The U.S. dollar strengthened for a third straight session on Thursday, ahead of the release of December nonfarm payrolls report due later today. The ICE Dollar Index gained 0.1% on the day to 97.42.
The euro was broadly flat at $1.1109. Official data showed that the eurozone’s jobless rate was steady at 7.5% in November as expected, while German industrial production grew 1.1% on the month (+0.8% estimated).
The British pound slipped 0.2% to $1.3069, posting a three-day decline. Bank of England Governor Mark Carney indicated that an interest rate cut may still be possible, saying, “there is a debate at the MPC (monetary policy committee) over the relative merits of near term stimulus to reinforce the expected recovery in U.K. growth and inflation.”
Economic Events to Watch Today
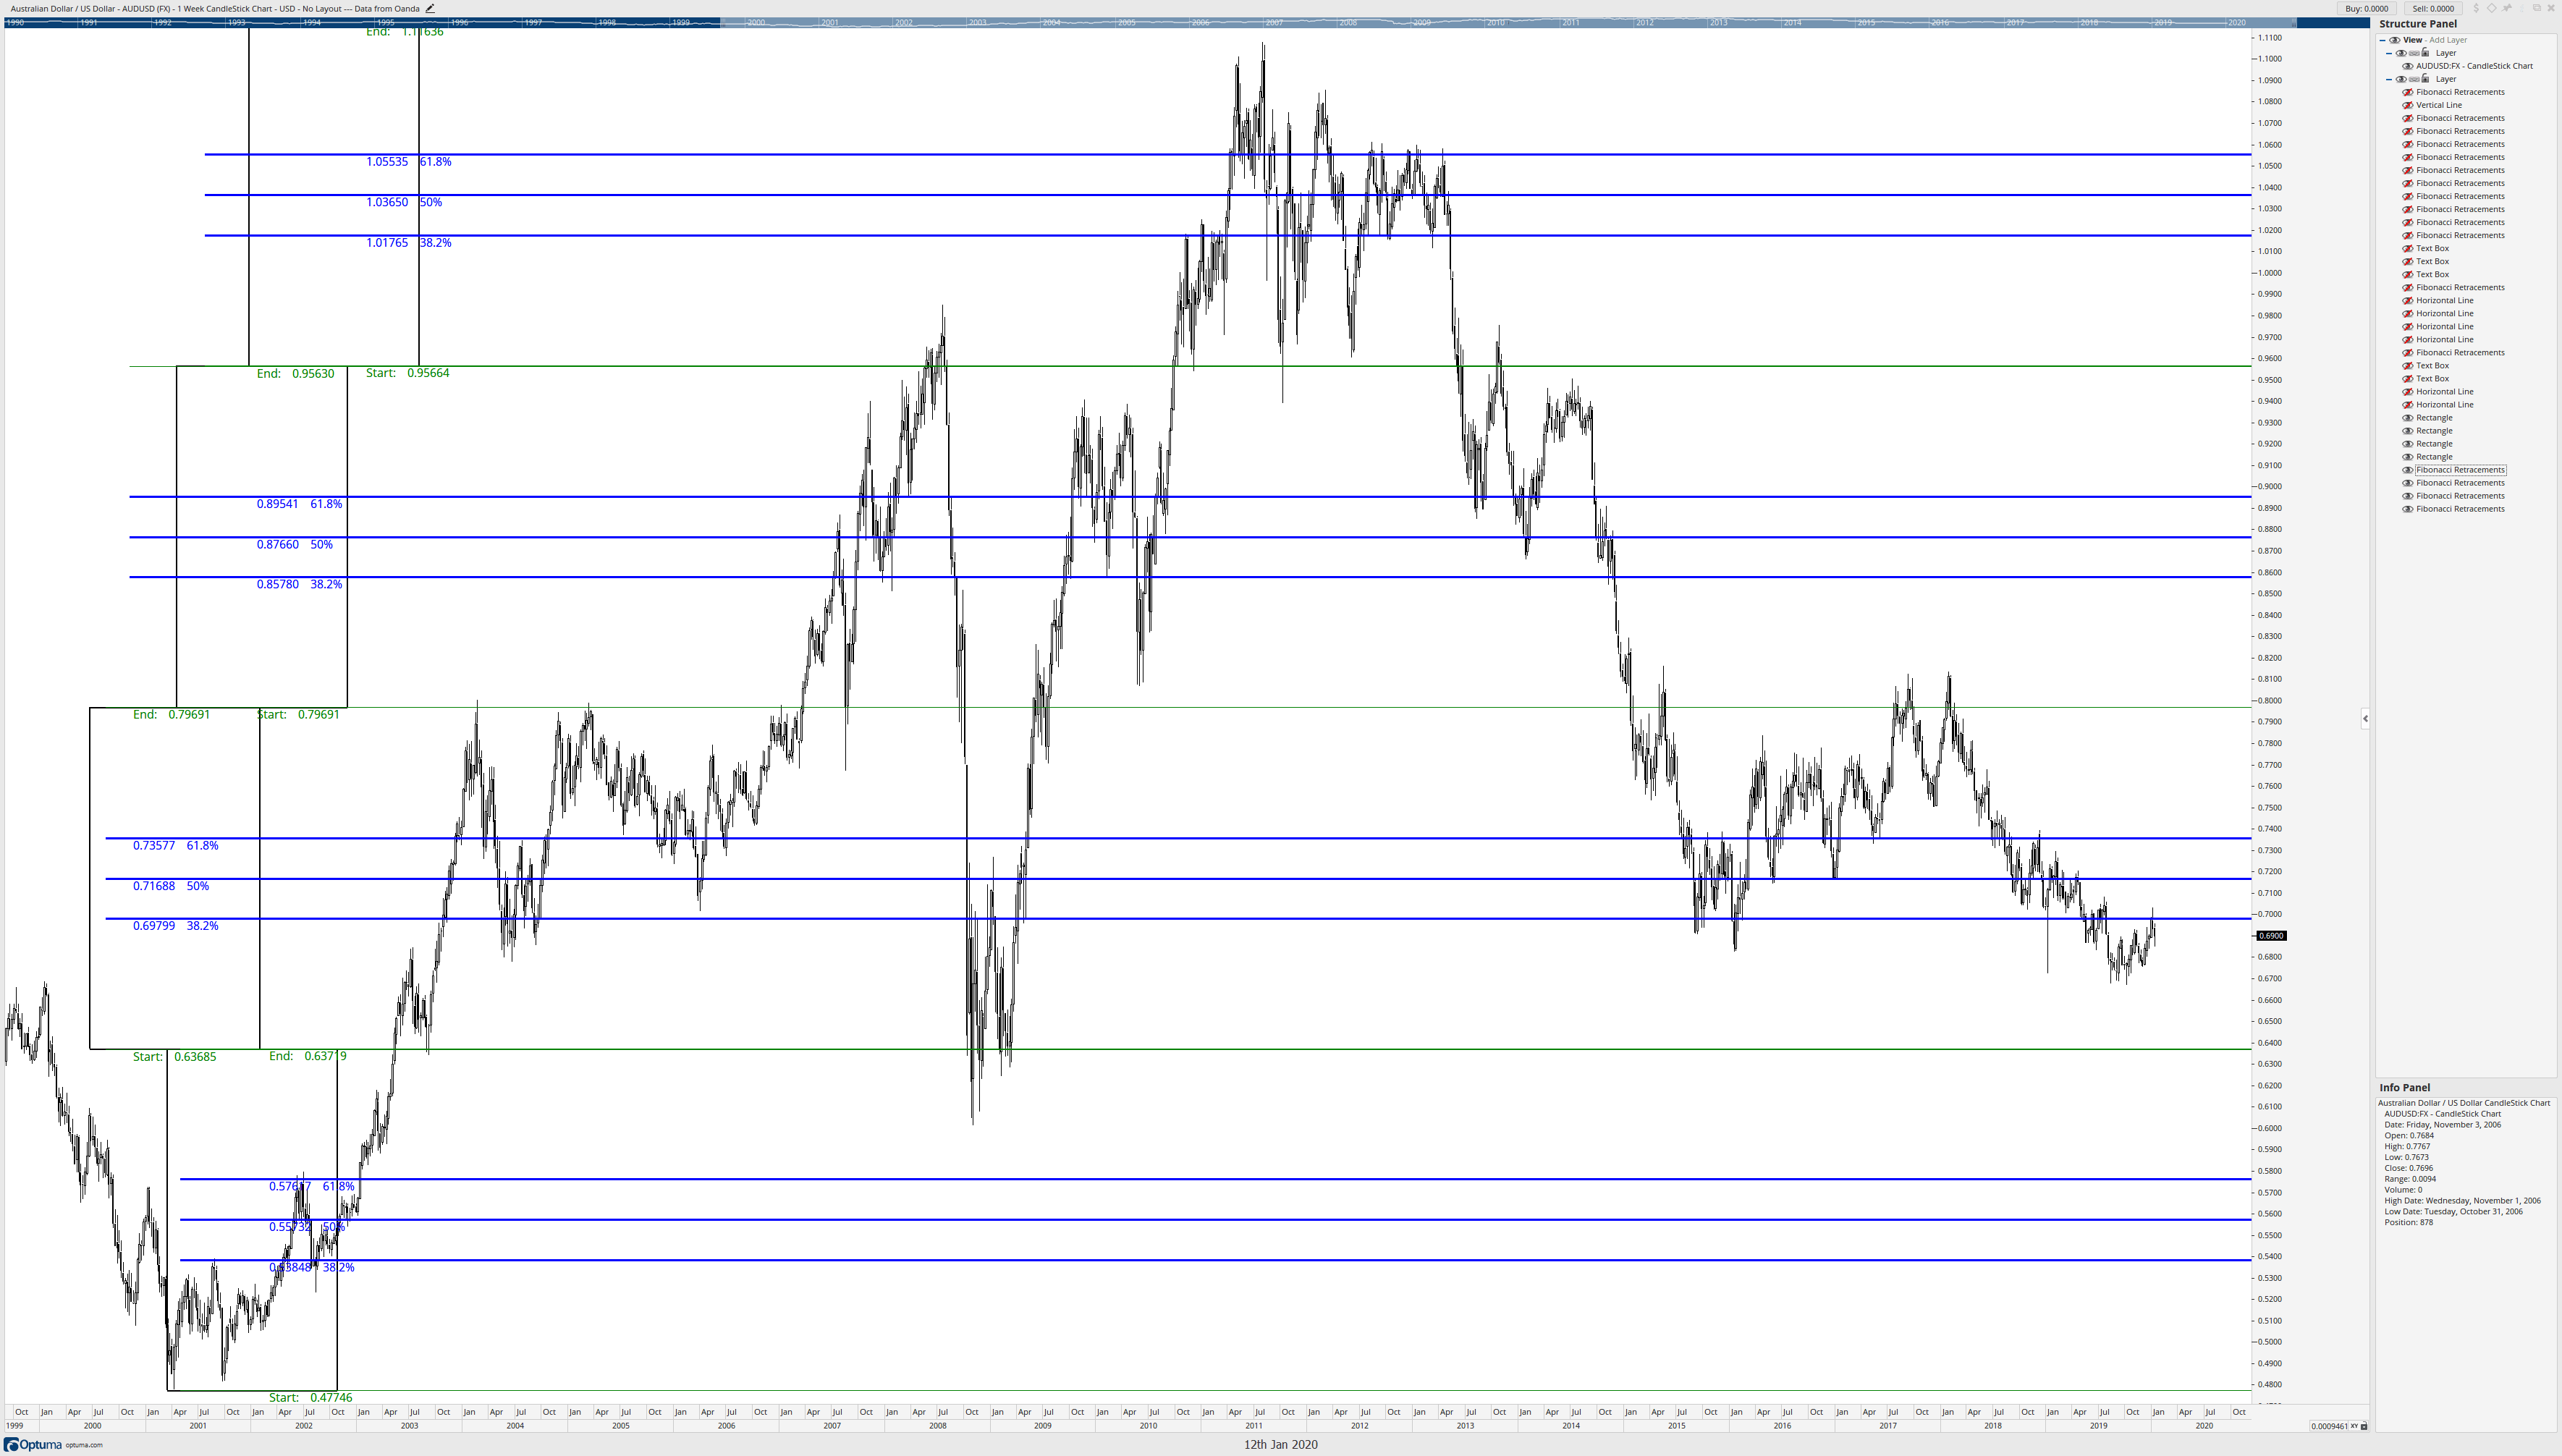
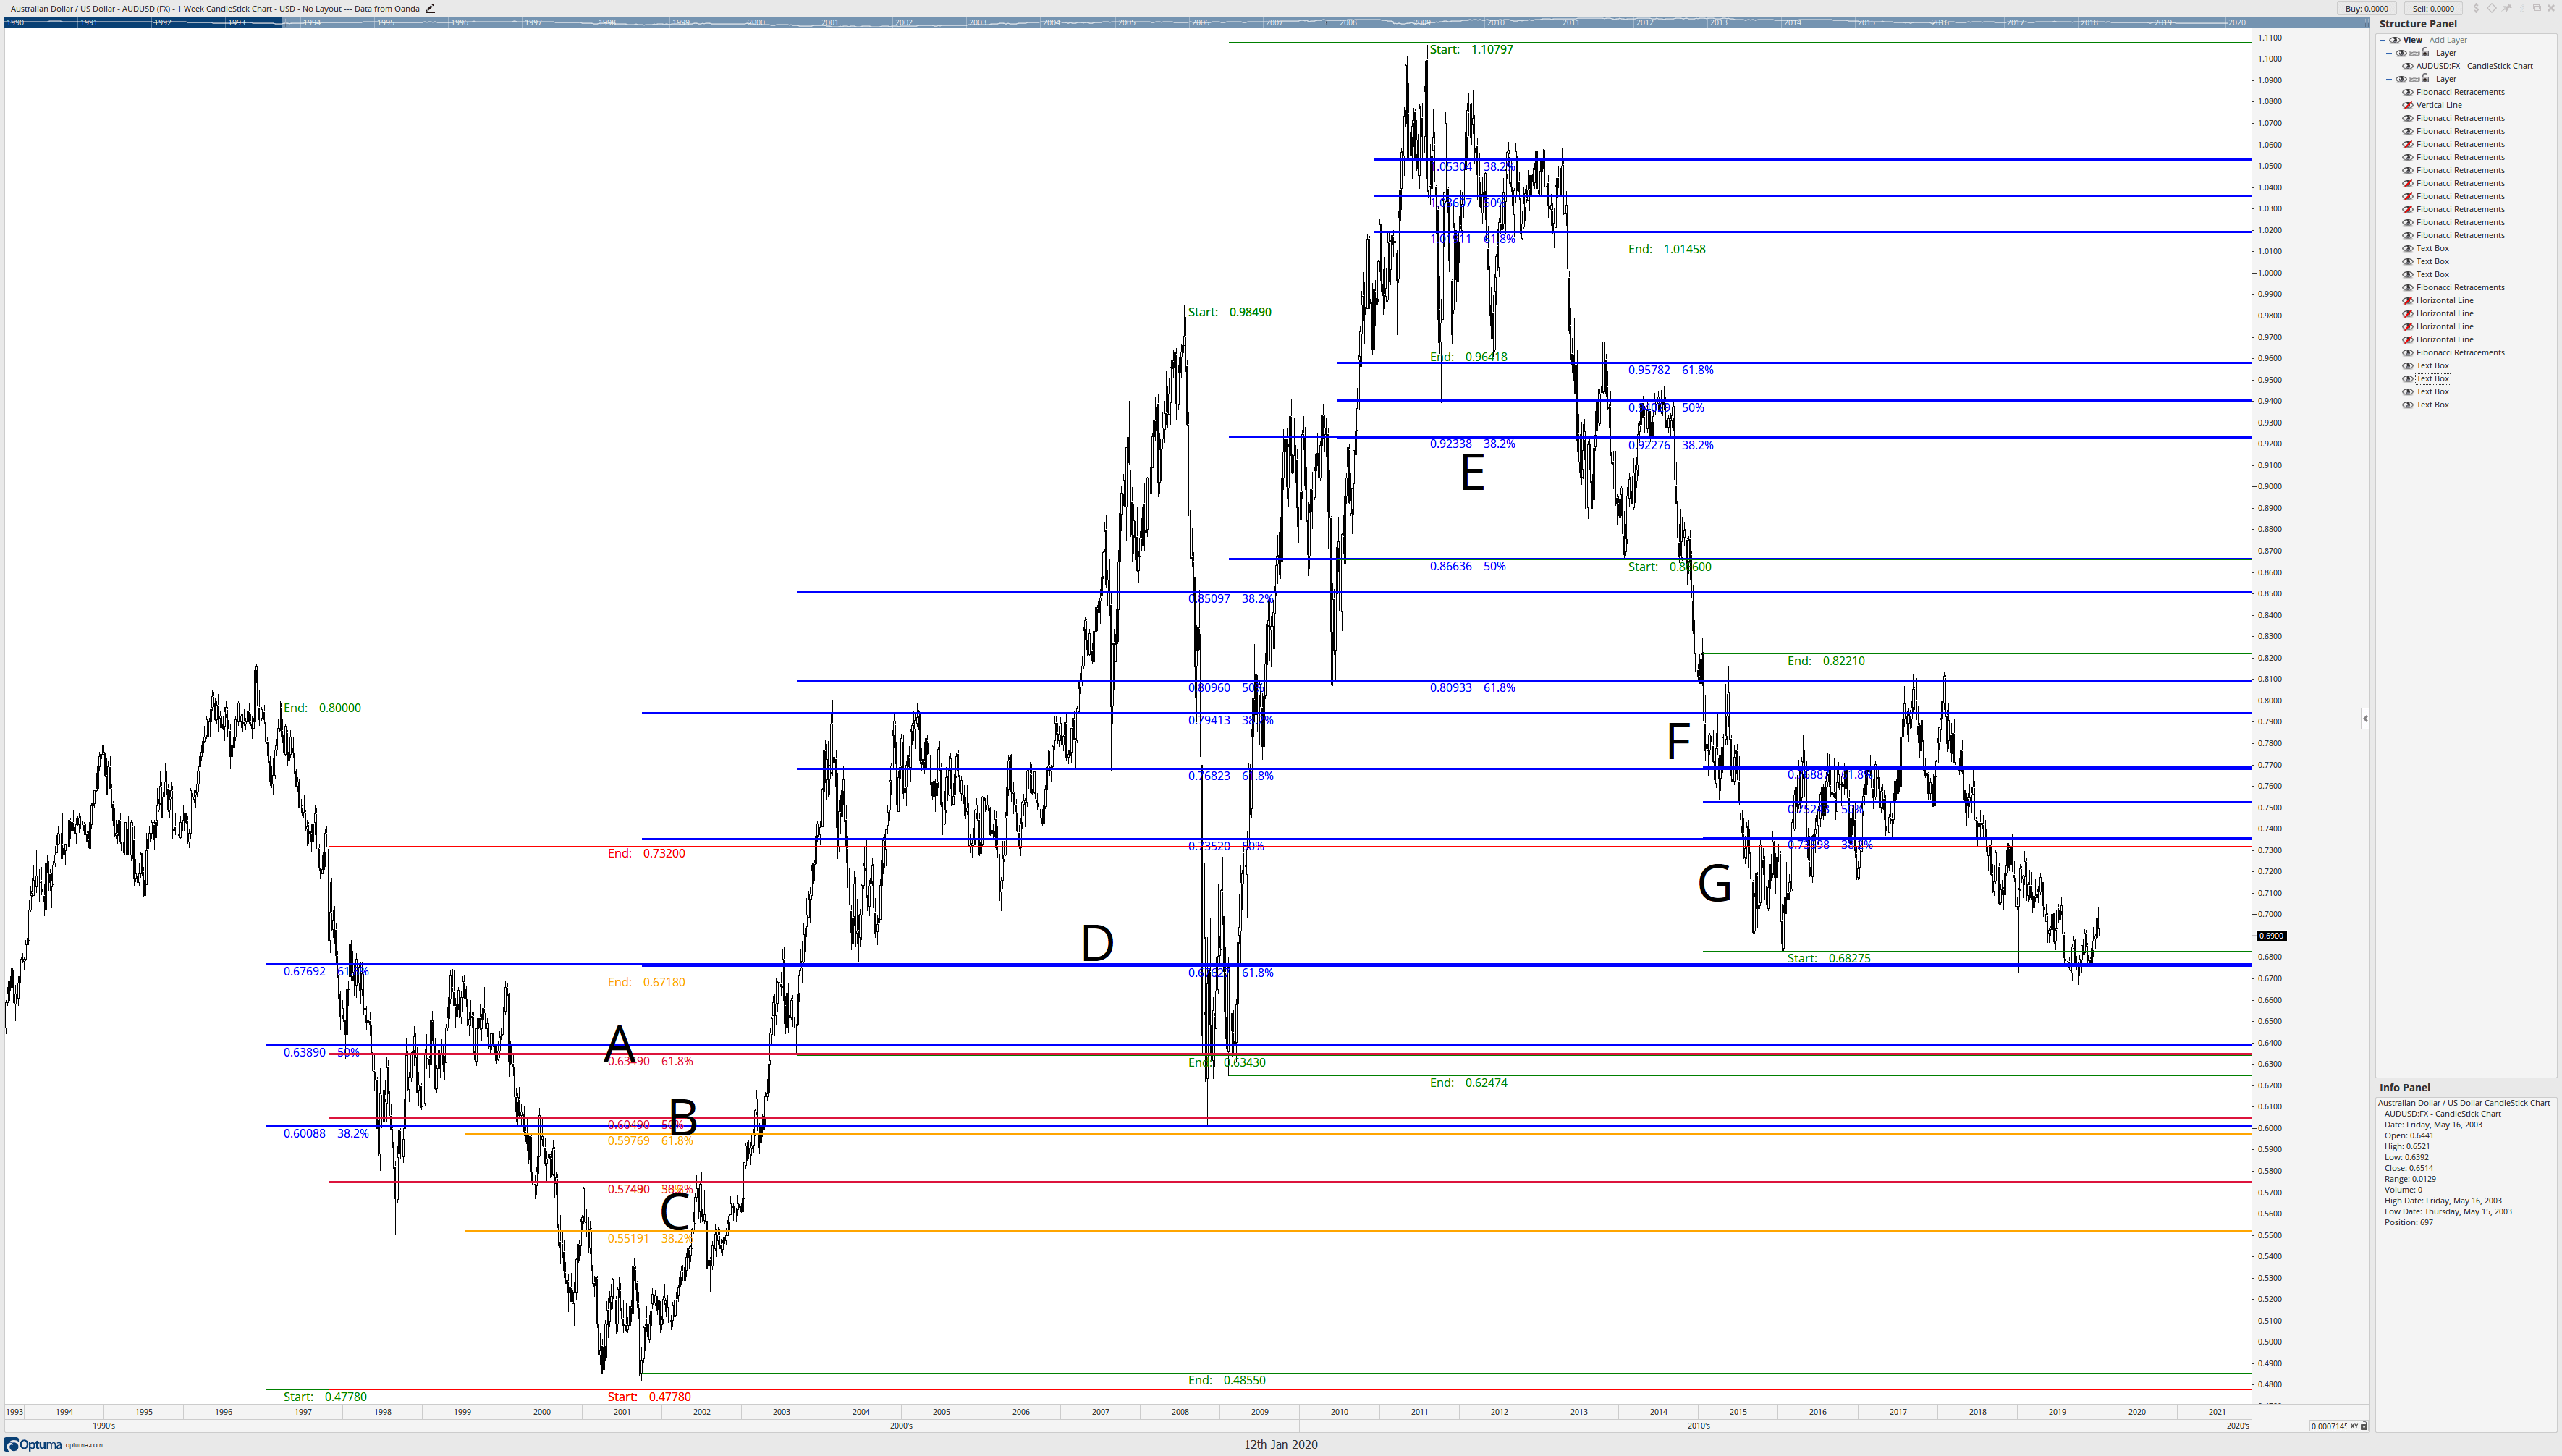
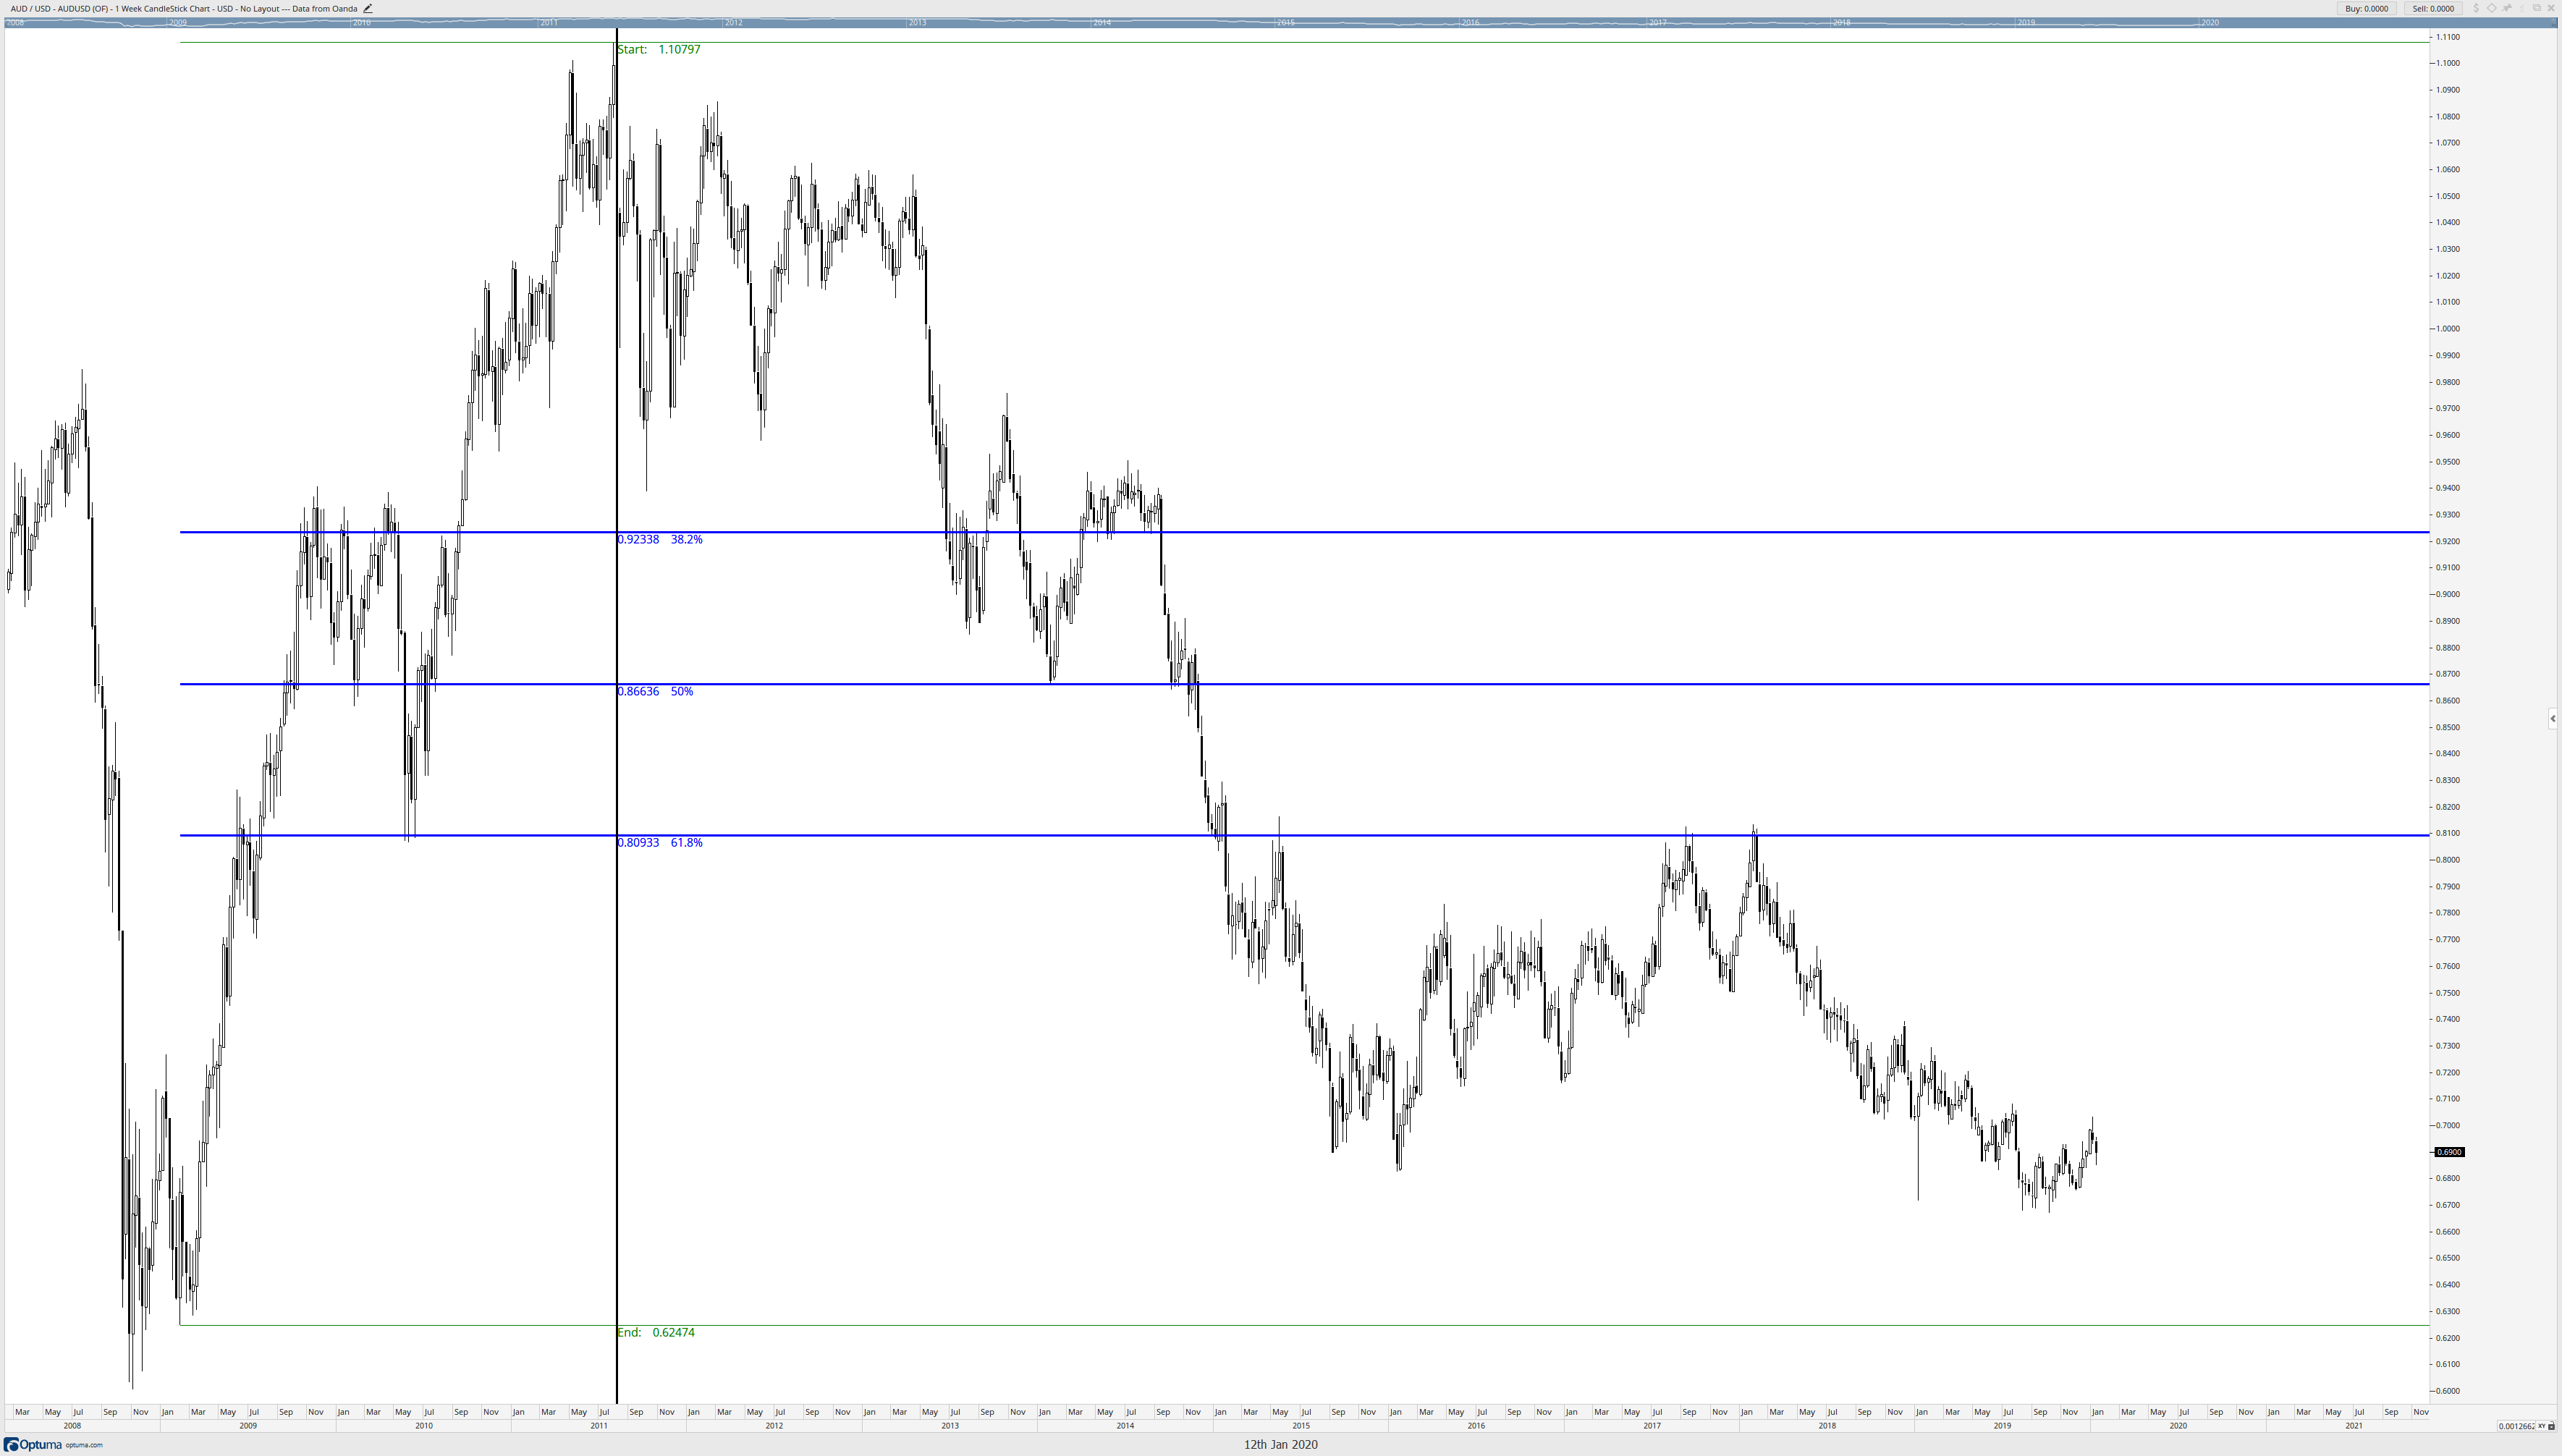
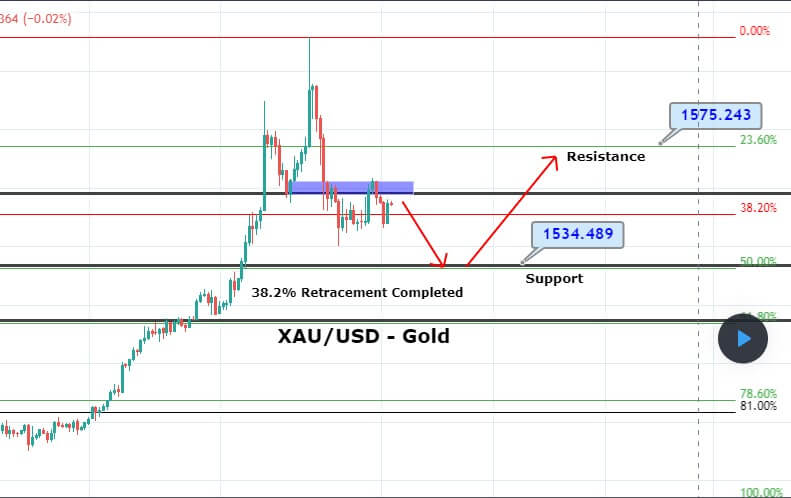
EUR/USD – Daily Analysis
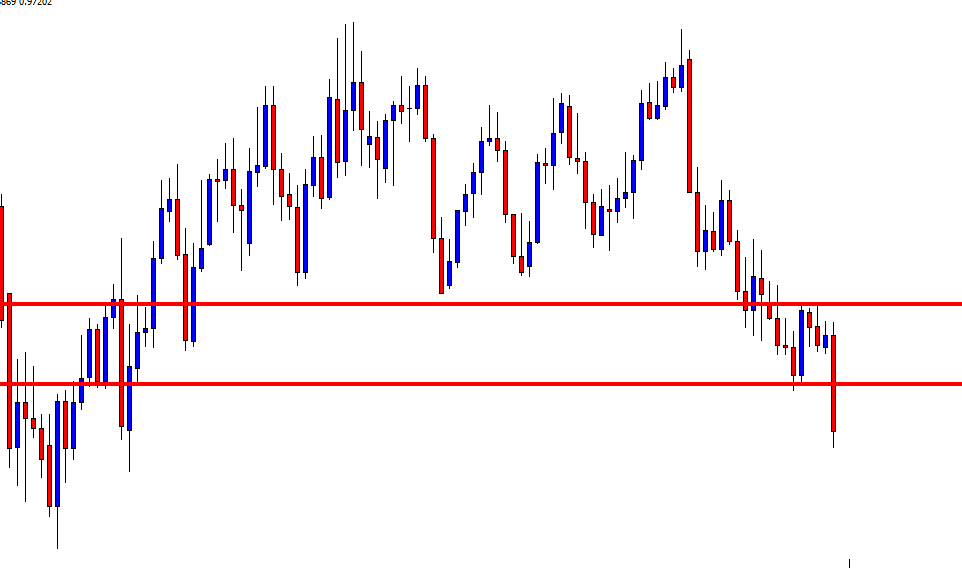
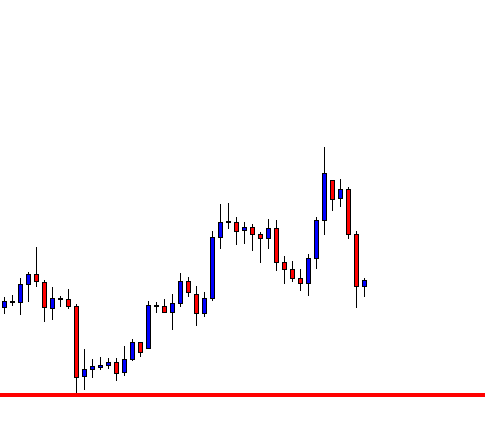
The EUR/USD currency pair flat near the 1.11 and traders stay on the waiting mode ahead of the U.S. Nonfarm Payrolls report for December, which is scheduled to release at 13:30 GMT. As of writing, the EUR/USD currency pair is currently trading at 1.1109 and consolidates in the narrow range between the 1.1102 – 1.1111.
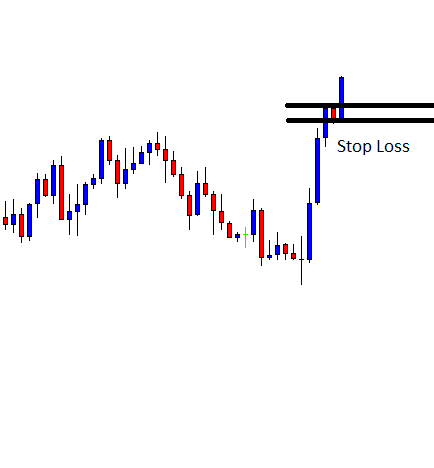
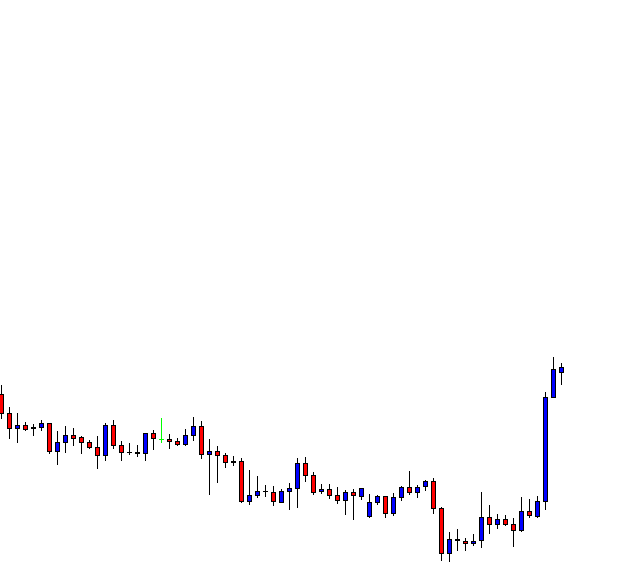
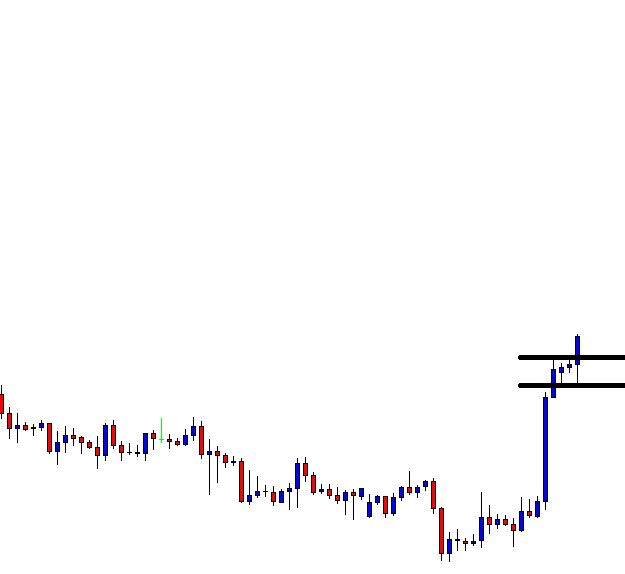
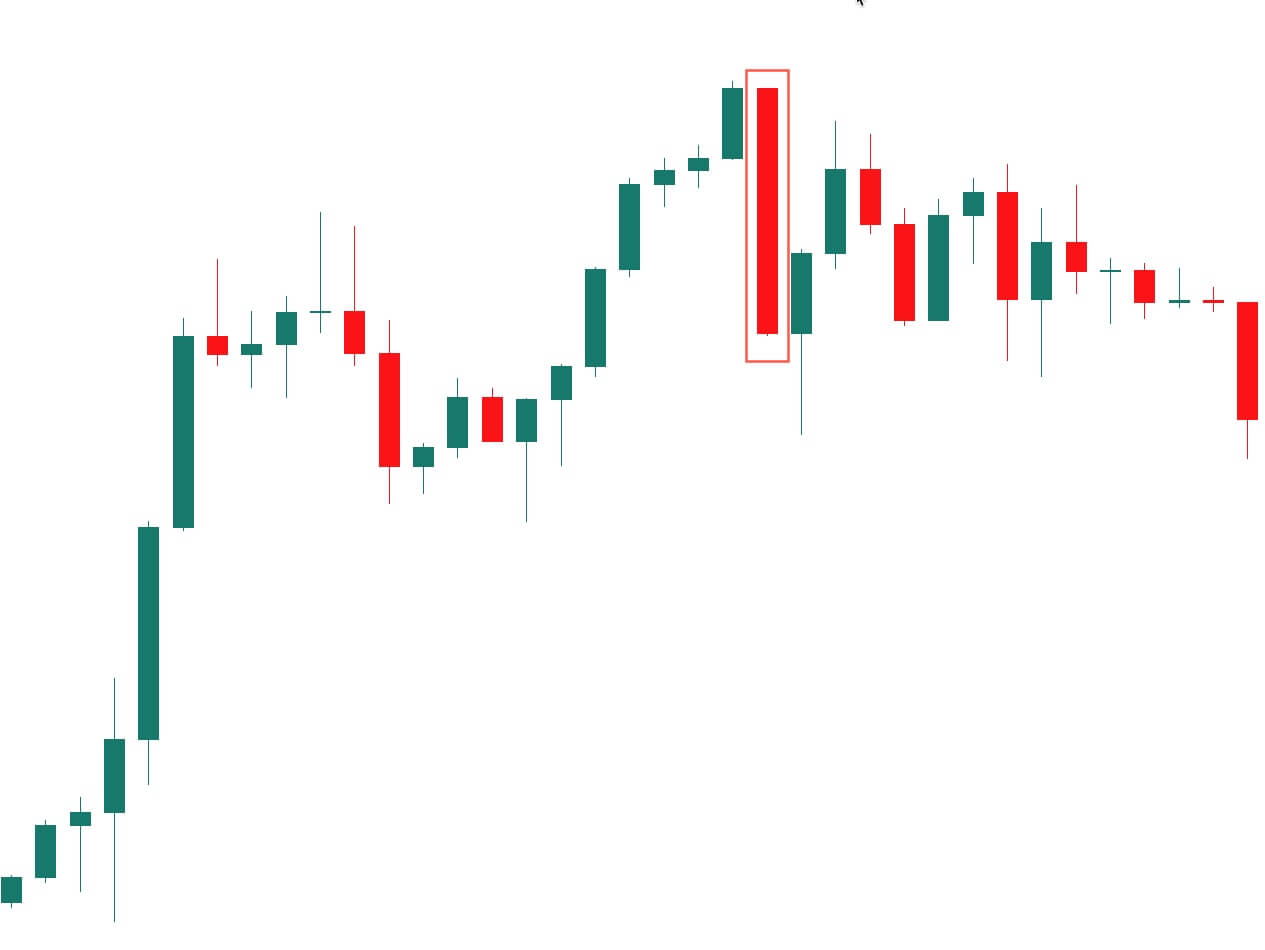
The currency pair charted a Doji candle Thursday because it marked two-way business and closed on a flat note. The Doji candle represents a lack of clear directional bias or indecision in the market place.
Moving ahead, the pair may hit the bearish track if the U.S. Nonfarm Payrolls ignore expectations. Moreover, the United States economy expected to have added 164,000 new jobs in December, after increasing 226,000 positions during November. The unemployment rate is expected to remain stable at 305%, along with the participation rate is projected at 63.2%.
Meanwhile, Average Hourly Earnings are rising by 0.3% month-on-month and by 3.1% year-on-year, almost unchanged from the previous month.
According to the forecast, the positive report will likely support the dollar to gain across the board. In that case, EUR/USD will hit the bearish close below 1.1093. Although, in the case of a below-forecast NFP and wage growth figures, the shared currency may find bids, pushing the EUR/USD above 1.1120.
At the USD front, the greenback currency found on the bullish track because the markets await ahead of the NFP report. The U.S. Index is higher for the 3rd-consecutive day, trading back 97.50.
At the Sino-US front, the United States and China will possibly sign a phase one trade deal on January 15. However, any fresh is not coming yet regarding the Sino-US trade deal, but the trader keeps their eyes on January 15 for new impulse.
Looking forward, the Non-Farm Employment Change report is the trader radar, which is due to release at 13:30 GMT. Traders will also keep their focus on the Unemployment rate and Average Hourly Earnings, which are scheduled to release at the same time.
Daily Support and Resistance
- S3 1.1014
- S2 1.1067
- S1 1.1086
- Pivot Point 1.1121
- R1 1.114
- R2 1.1174
- R3 1.1227
EUR/USD– Trading Tips
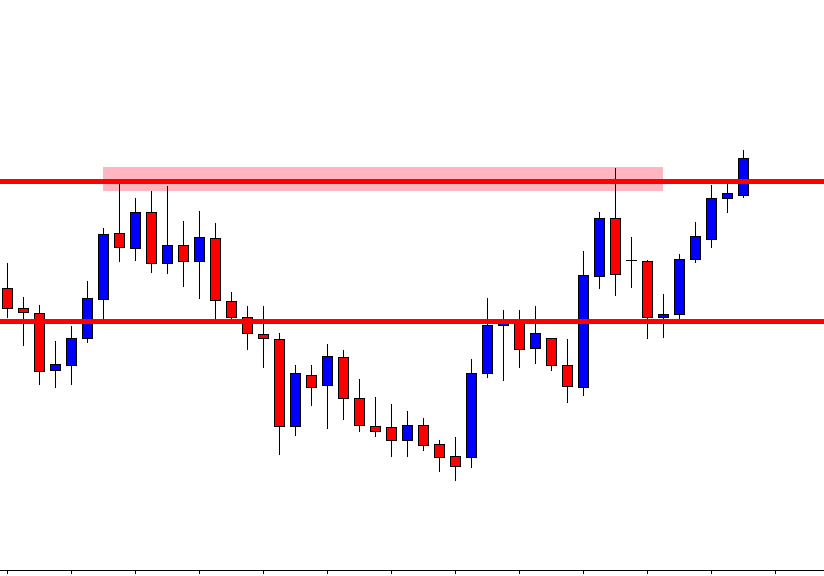
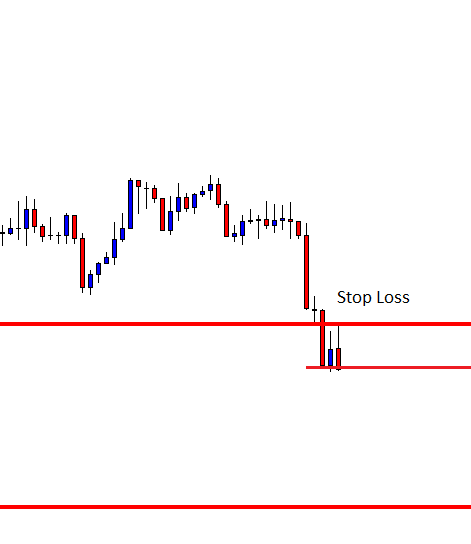
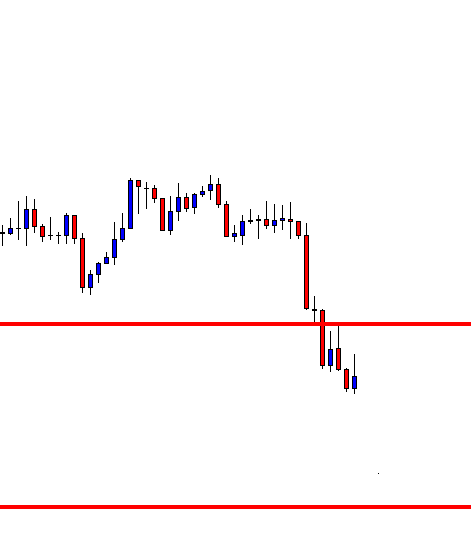
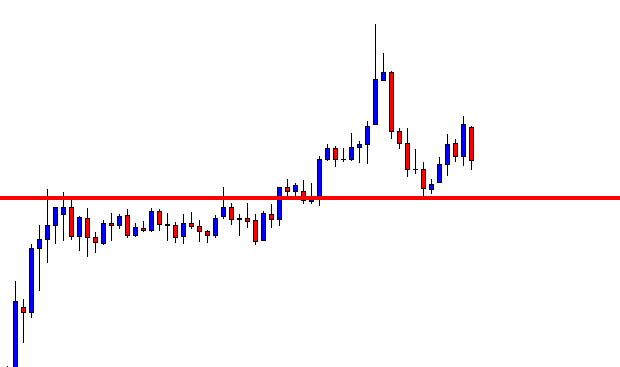
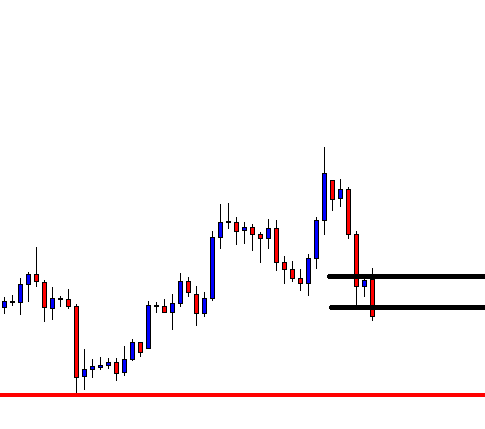
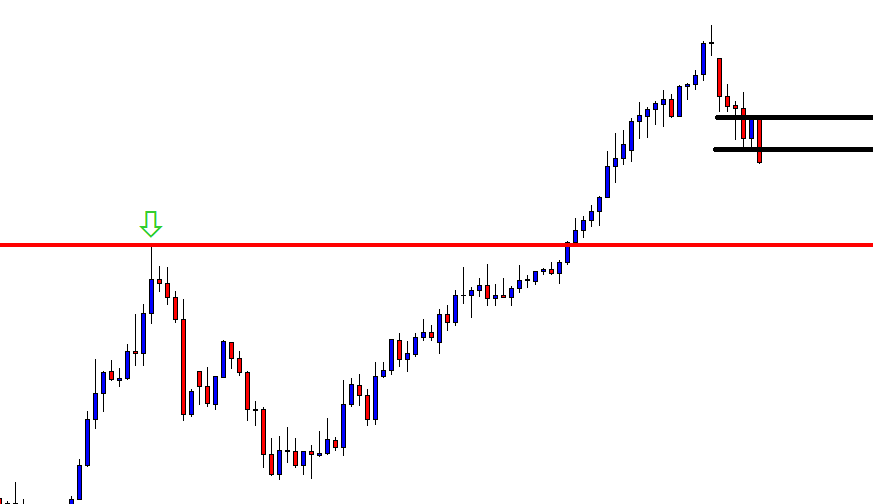
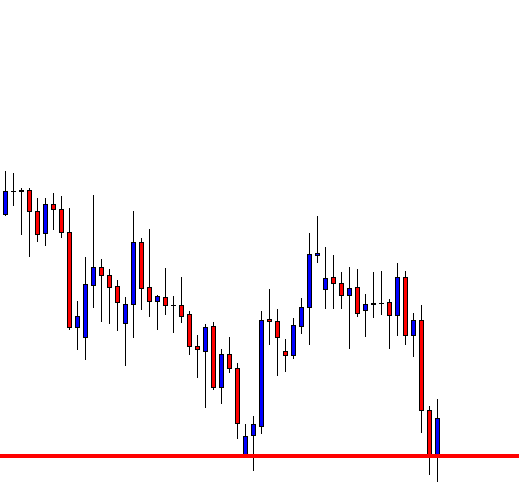
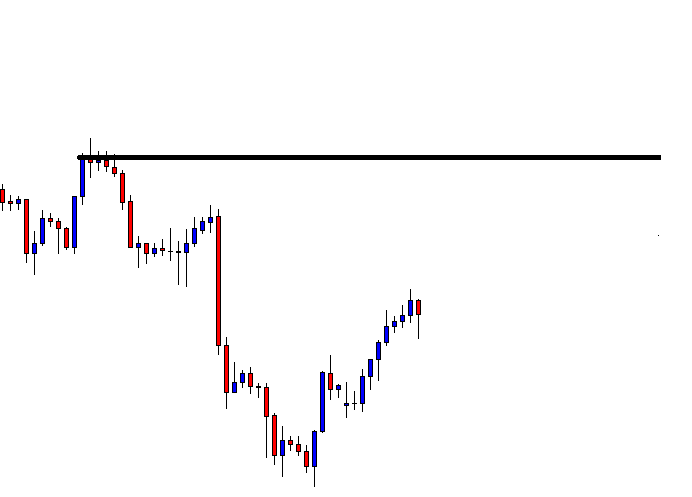
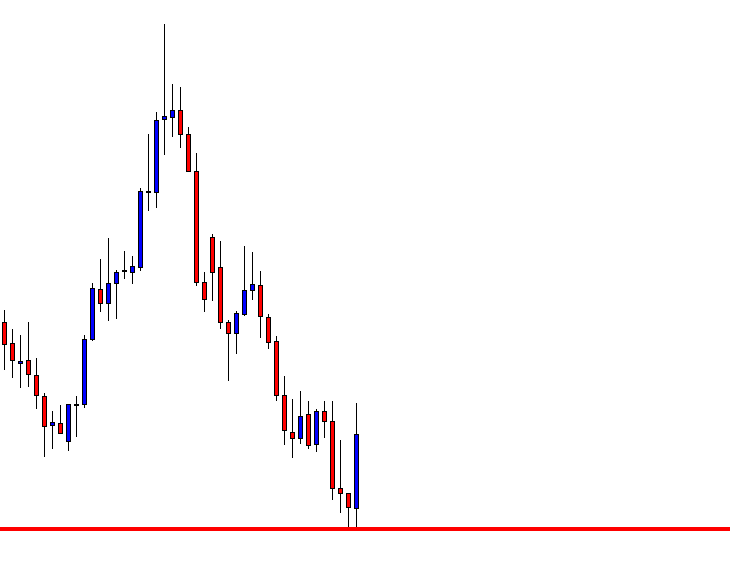
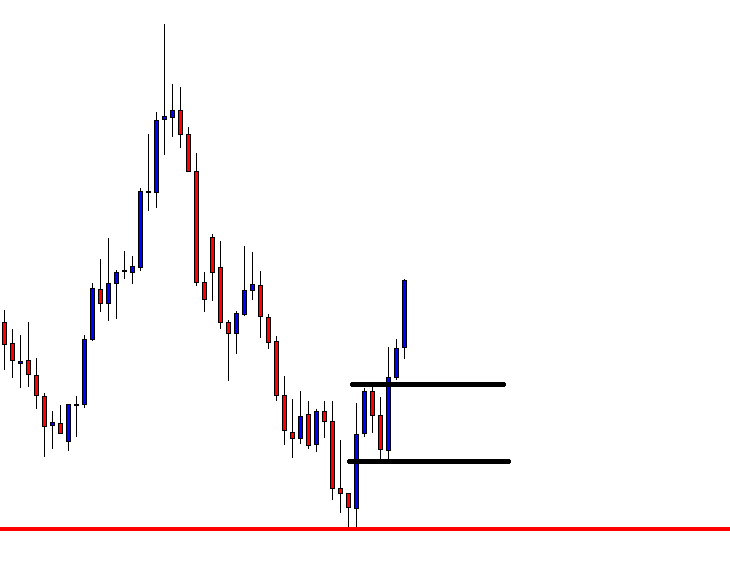
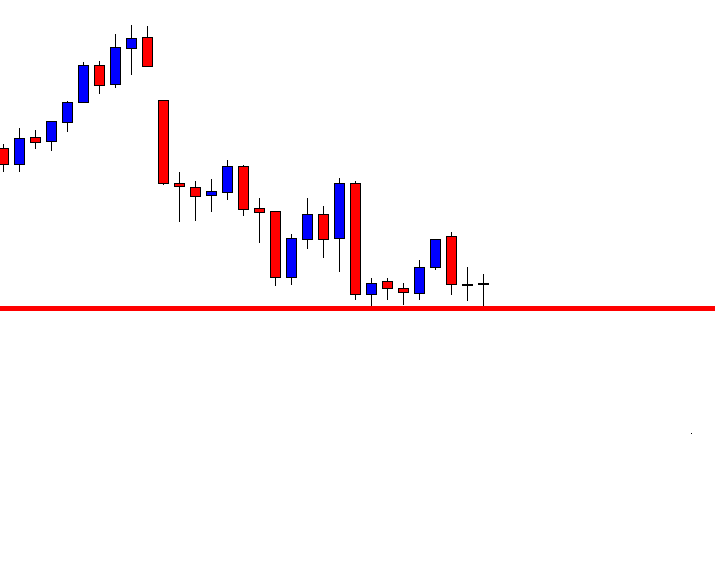
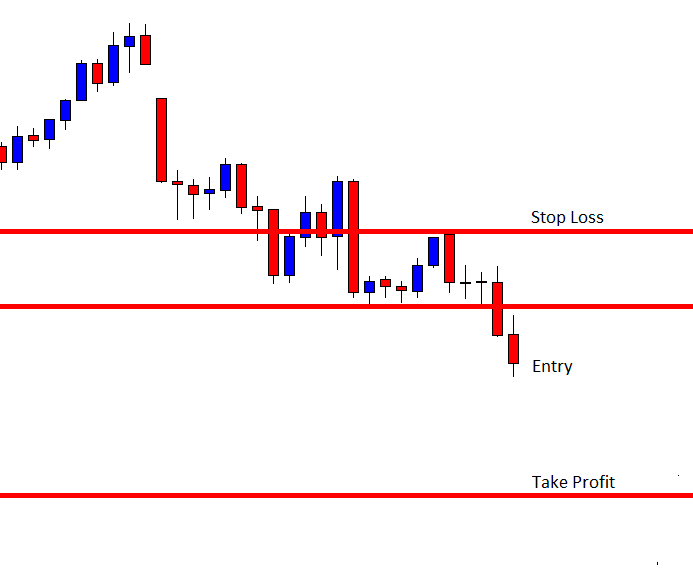
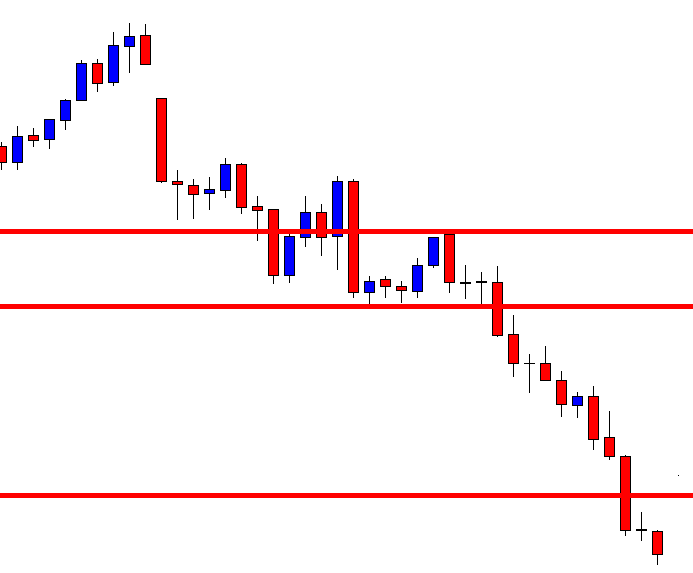
The EUR/USD is trading in a bearish mode below a crucial trading level of 1.1130, testing the support next level of 1.1100. This level worked as a support during the previous days, but this time it seems to get violated as the EUR/USD has formed a strong bearish candle. The MACD is trading below 0 levels, which is suggesting odds of the bearish trend continuation for the EUR/USD.
On the 4 hour chart, the pair had formed a bullish channel that has now been violated at 1.1130 level, and now this can lead the EUR/USD prices towards 1.1077 level.
GBP/USD– Daily Analysis
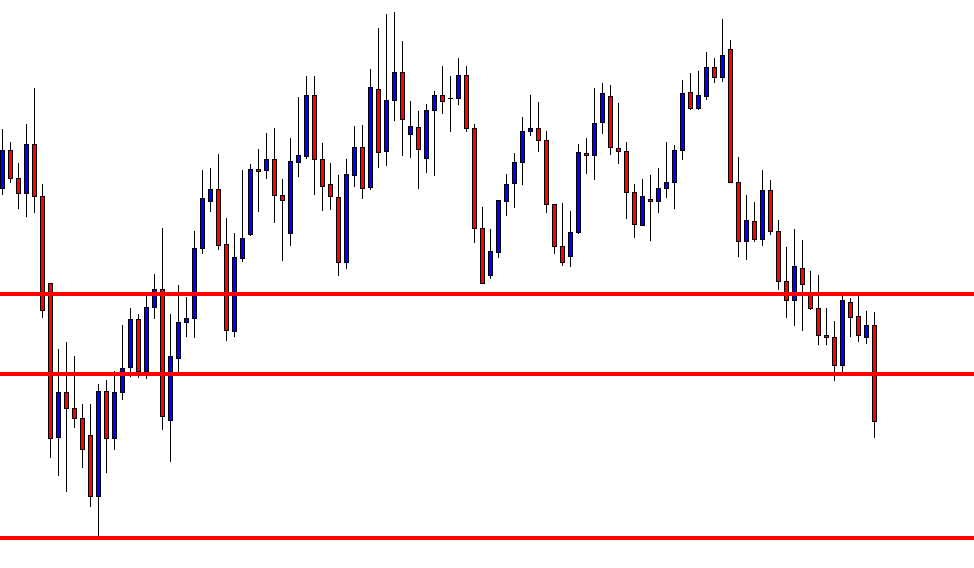
The GBP/USD closed at 1.30659 after placing a high of 1.31234 and a low of 1.30130. Overall the movement of GBP/USD remained bearish throughout the day.
The GBP/USD came under pressure after the Bank of England’s governor gave hints for an interest rate cut, and the pair GBP/USD dropped near 1.30 level.
On Thursday, the Governor of Bank of England, Mark Carney, dropped hints that interest rates could be cut soon to boost the British economy. He also warned that the BoE was running low on ways to fight the recession.
He said that the British economy had been sluggish recently, and the inflation was below the bank’s target of 2%. He added that if the weakness in the economy persisted the same, then the central bank could cut interest rates.
His comments put pressure on Britain Pound and sent it near 2-week lowest point against the U.S. dollar on Thursday. Mark Carney, in the previous monetary policy meeting of Bank of England, backed himself from cutting interest rates while 2 of nine policymakers were in favor of cutting rates to 0.5% from 0.75%.
He also said that there were tentative signs of stabilization in the global economy after a slowdown for almost 18 months, while the chances for Britain’s economy to drop still remain because of uncertainty after Boris Johnson’s election victory.
Regarding inflation, he said that the level of interest rates required to keep inflation steady would need to remain low for a prolonged period of time.
On the other hand, the U.S. dollar remained strong on Thursday amid positive job data from the U.S. labor department, which showed that jobless claims during the previous week decreased to 214K from expected 221K and supported U.S. dollar. The strong U.S. dollar added to the downward movement of GBP/USD.
Daily Support and Resistance
- R3: 1.3296
- R2: 1.3206
- R1: 1.3151
- Pivot Point 1.3116
- S1: 1.3061
- S2: 1.3026
- S3: 1.2936
GBP/USD– Trading Tip
The GBP/USD continues to trade with bearish bias after violating the 1.3045 support level. On the 4 hour chart, the pair has closed a bearish engulfing candle under 1.3045 support level, which is a proof of bearish breakout. Below 1.3045, the GBP/USD has the potential to trade lower until 1.3000 level and even towards 1.2910 support zone.
The leading indicators, such as RSI and MACD, are also supporting the bearish bias among traders. I will consider taking selling positions below 1.3058 to target 1.3000 today.
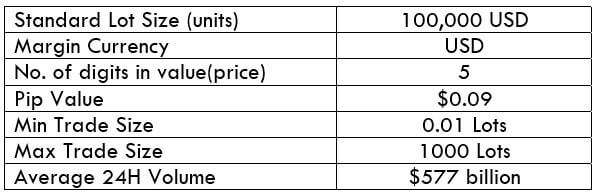
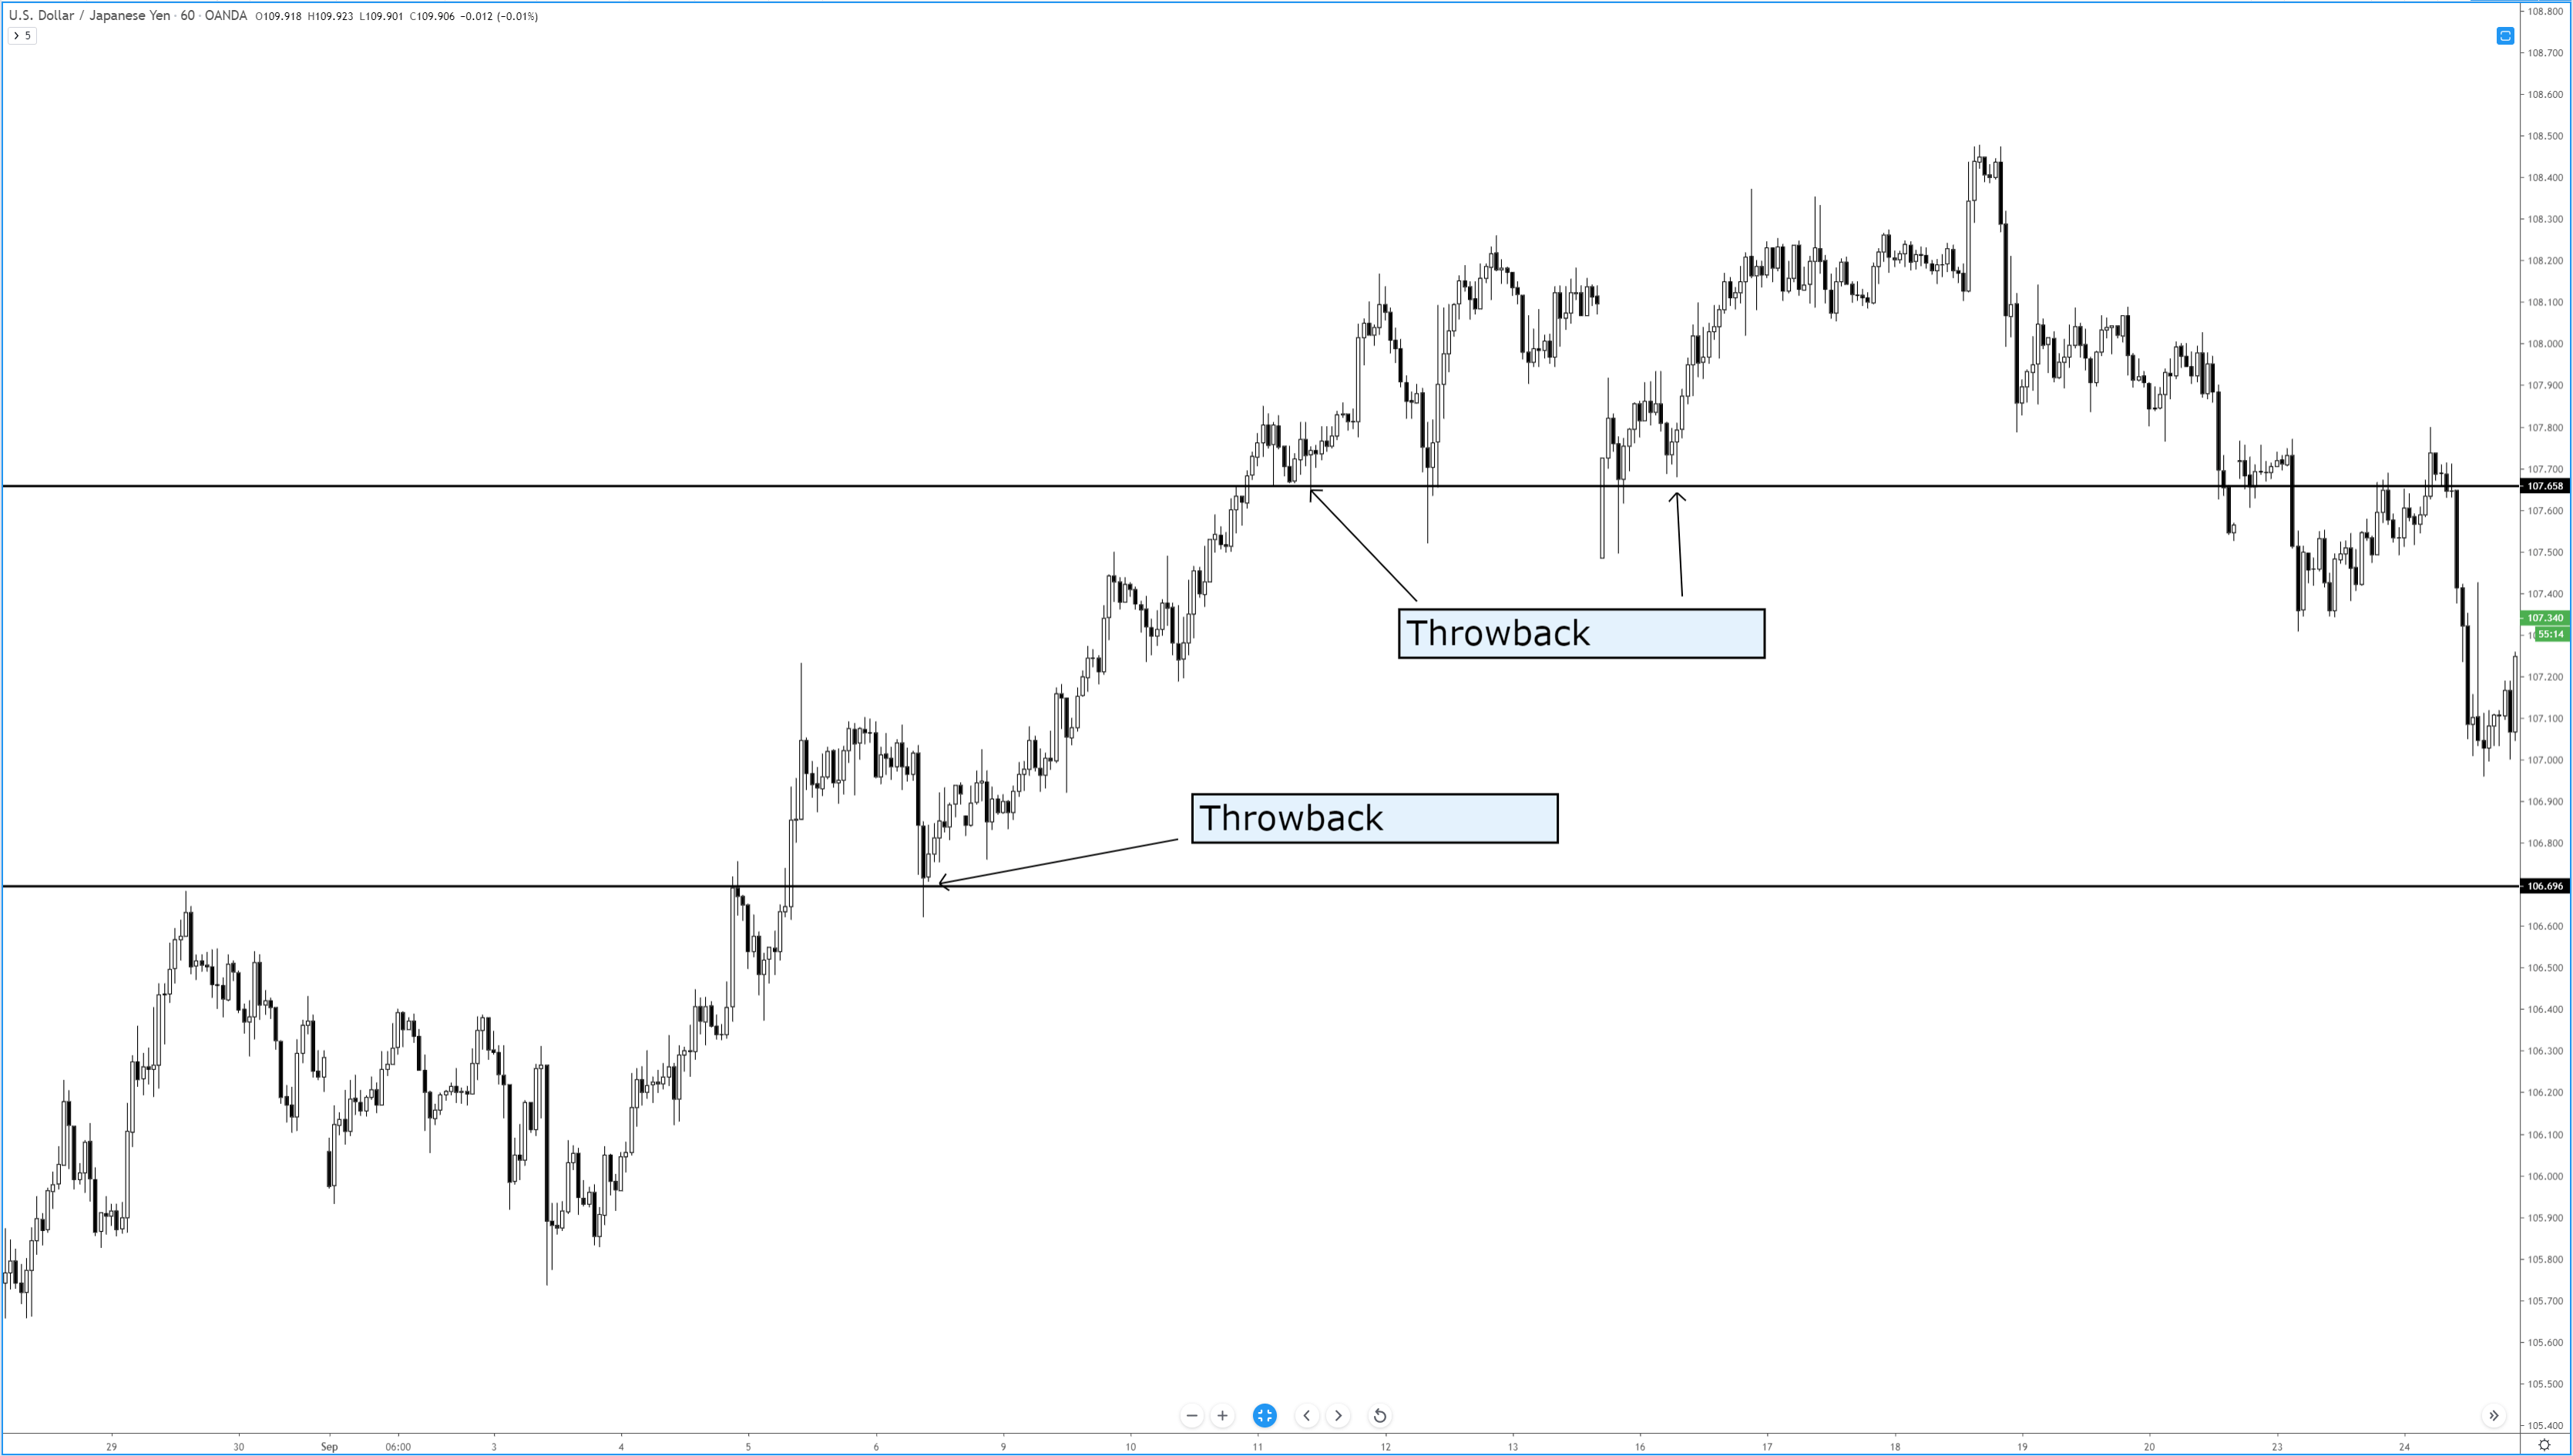
USD/JPY – Daily Analysis
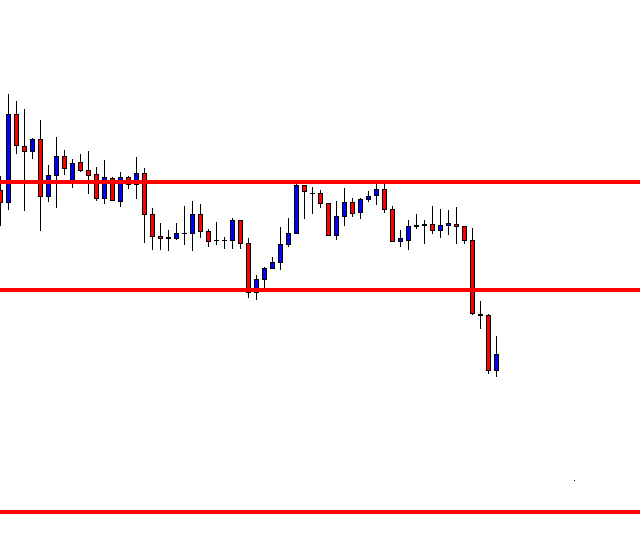
The USD/JPY closed at 109.514 after placing a high of 109.580 and a low of 109.010. Overall the movement of USD/JPY remained bullish throughout the day. The safe-haven Yen falls to 2-week lowest point against the U.S. dollar on Thursday amid the de-escalation of tensions between the U.S. & Iran after the targeted killing of Iranian general Qassem Soleimani by U.S. military.
On Wednesday, Iran, in retaliation against its general murder, dropped missiles on Iraqi airbases where U.S. troops were hosted. However, there were no American casualties that led to U.S. President Donald Trump to stop further military action against Iran.
Instead, Trump announced economic & financial sanctions on Iran in response to Iranian airstrikes. Furthermore, the Iran officials also said that their missile attacks were to conclude the retaliation, and no more attacks will be made from them. Both parties backed from any escalation of military actions, and this gave pressure to safe-haven currencies like Yen.
Weaker Japanese Yen caused the USD/JPY to move in the reverse direction, and the pair moved to its 2-week highest level above 109.5.
On the other hand, the U.S. dollar remained strong across the board on the back of strong economic data and supportive comments from Federal Reserve officials.
At 1:00 GMT, the Consumer Credit from the U.S. Federal Reserve for November was released, which showed a decline to 12.5B from the expected 15.5B and weighed on the U.S. dollar. However, at 18:30 GMT, the Unemployment Claims from the U.S. Department of Labor dropped to 214K from forecasted 221K and supported the U.S. dollar.
Daily Support and Resistance
- S3 106.93
- S2 107.9
- S1 108.49
- Pivot Point 108.87
- R1 109.46
- R2 109.84
- R3 110.81
USD/JPY – Trading Tips
The USD/JPY pair is trading bullish around 109.420 after breaking above a resistance level of 108.950. The way USD/JPY is forming bullish candles shows a strong buying bias among investors. We may see USD/JPY targeting the triple top resistance level around 109.700.
Leading indicators are massively overbought, and USD/JPY is looking for a reason to trigger bearish retracement. 109.750 can offer this reason today. Let’s keep an eye on this level to capture a sell positon below this today. All the best!


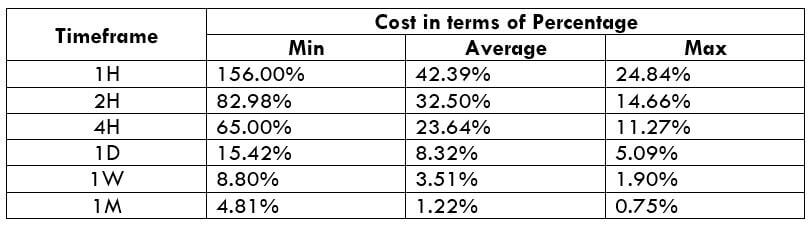
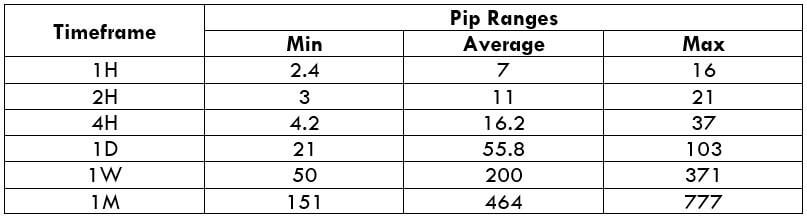
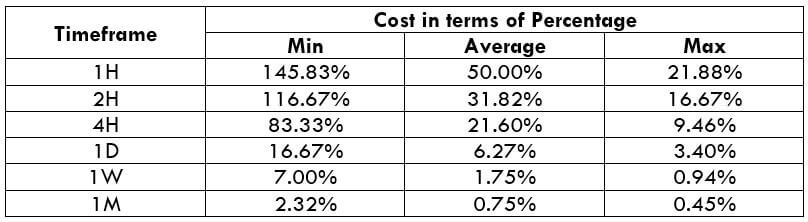
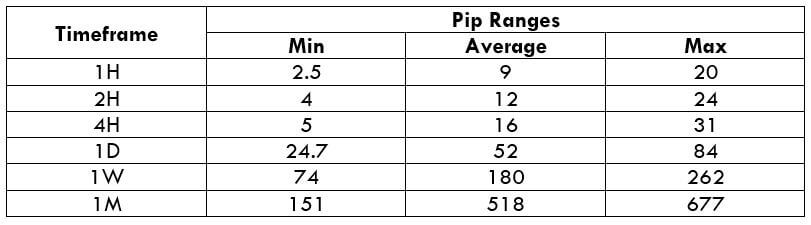
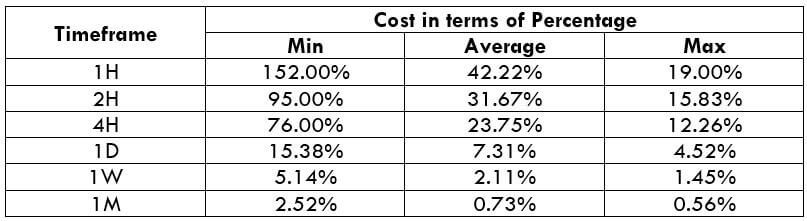
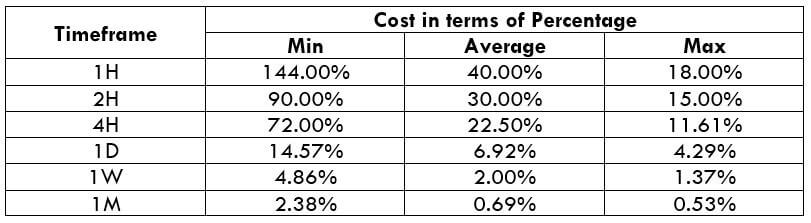
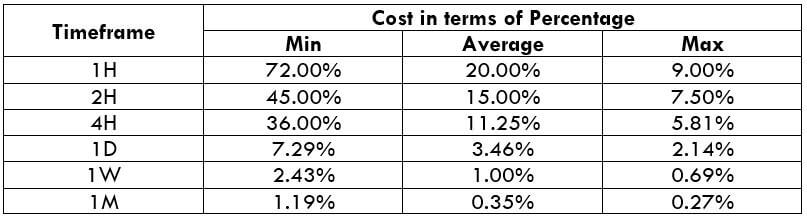
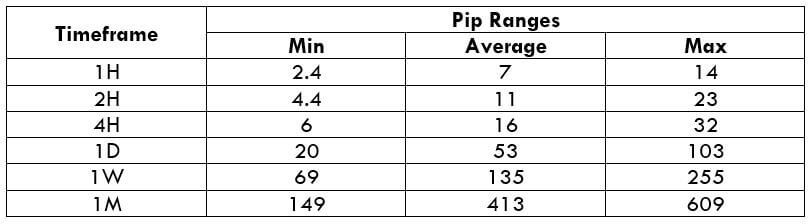
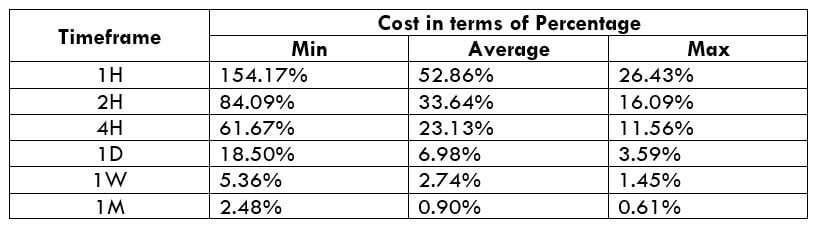
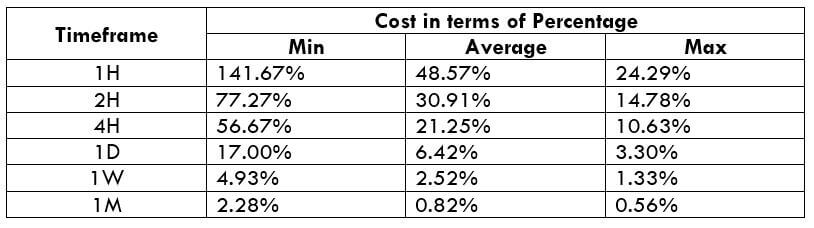
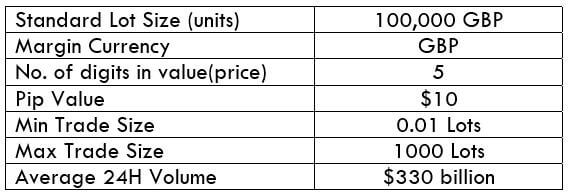
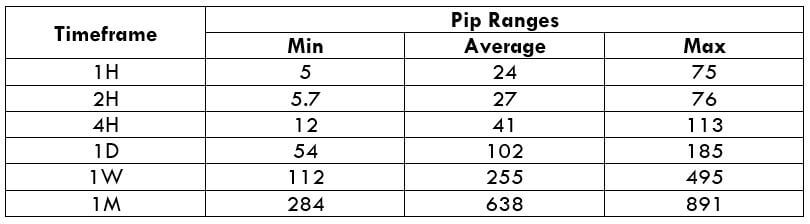
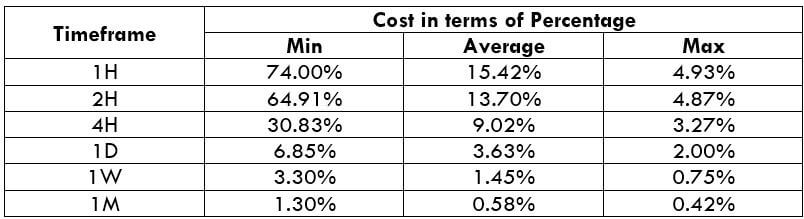
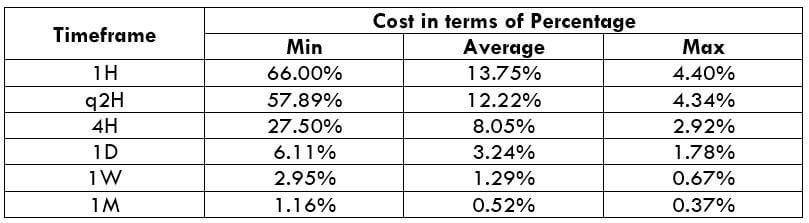
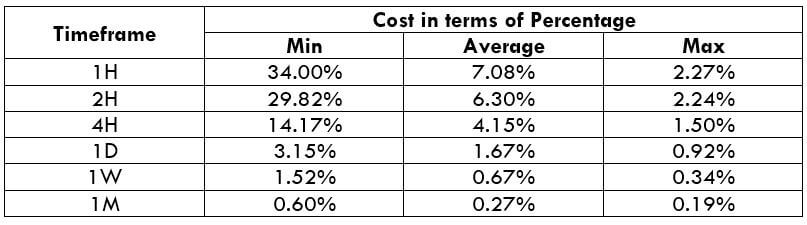
 Spread
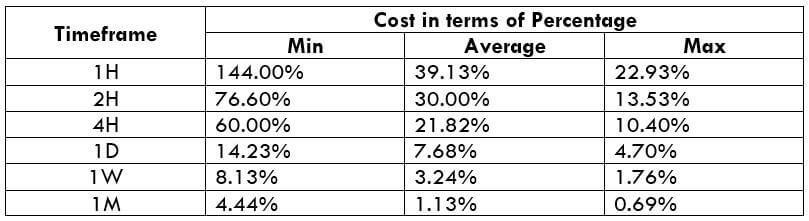
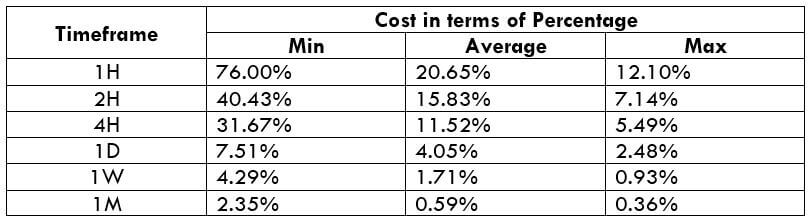
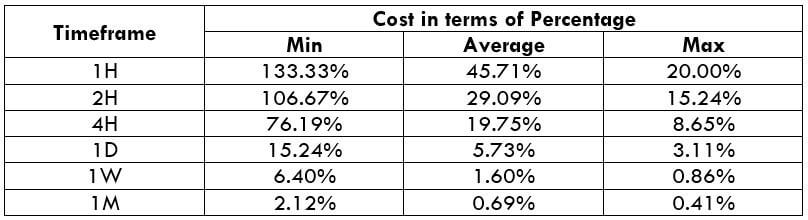