Categories
Forex Signals

EUR/GBP Downward Channel to Provide Sell Opportunity! 

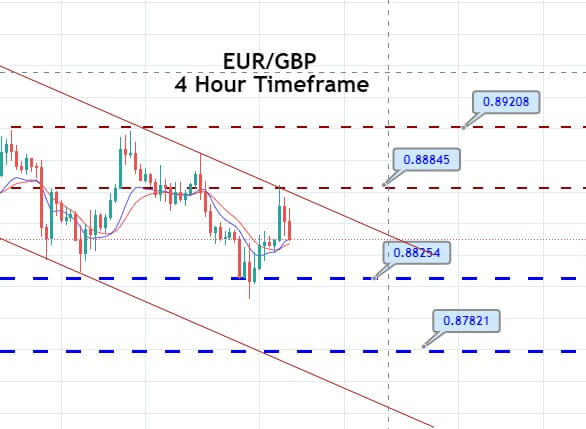
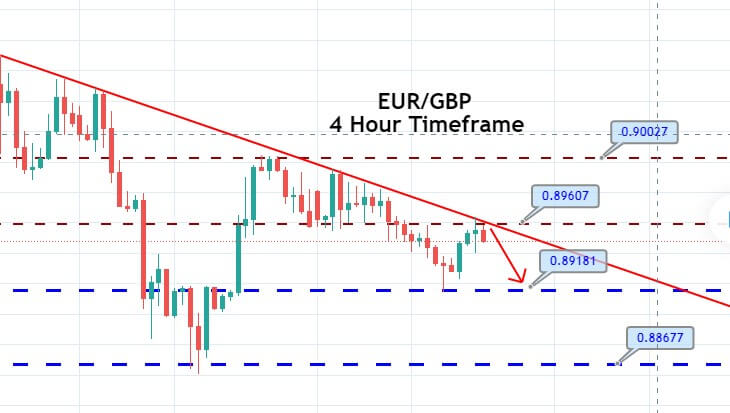
On the 4 hour timeframe, the EUR/GBP pair is trading with a selling bais at 0.8850 level, facing immediate support at 0.8825 level. On the lower side, the EUR/GBP pair may find support at 0.8825 area, whereas violation of this can extend selling bias until the 0.8782 mark. The MACD and RSI support a selling bias, along with a downward channel that we can see on the four hourly timeframes. Here’s a trading plan for today…


Entry Price – Sell 0.88668

Stop Loss – 0.89068

Take Profit – 0.88268

Risk to Reward – 1:1

Profit & Loss Per Standard Lot = -$400/ +$400

Profit & Loss Per Micro Lot = -$40/ +$40

Fellas, now you can check out forex trading signals via Forex Academy mobile app. Follow the links below.

iPhone Users: https://apps.apple.com/es/app/fasignals/id1521281368

Andriod Users: https://play.google.com/store/apps/details?id=academy.forex.thesignal&hl=en_US

Categories
Forex Signals

EUR/GBP Violates Descending Triangle Pattern – Sell Signal In Play! 

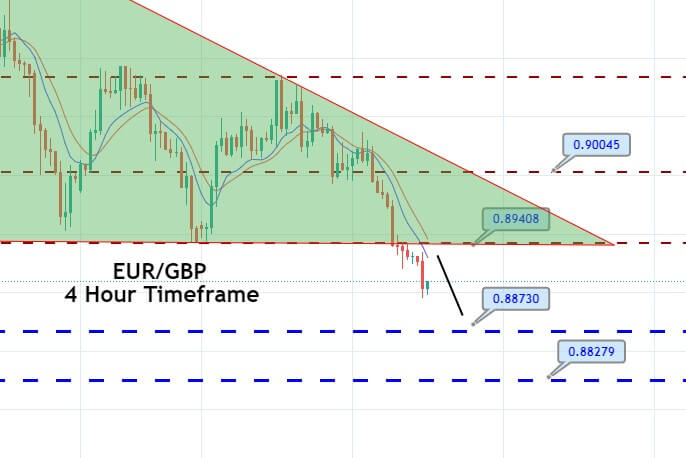
The EUR/GBP pair is trading with a bearish bias at a 0.8930 level, having violated the support level of 0.8940. The Euro seems to get weaker as the European countries have tightened measures to fight coronavirus after a brief relaxation over the Christmas and New Year period. They have re-imposed lockdowns, closed shops and offices, and introduced laws to make it easier for governments to impose further restrictions to battle the pandemic. 

These new lockdown measures across Europe to fight the second wave of coronavirus raised the fears of a double-dip recession in the Eurozone that added weight on the single currency Euro and capped further upside in the EUR/USD pair on Tuesday.

The Sterling is gaining strength as Bailey said that there were many issues with cutting interest rates below zero, and such a move could hurt banks. After these comments from Bailey, the British Pound gained traction and raised that ultimately pushed the EUR/GBP pair lower.

Meanwhile, The Deputy Governor of Bank of England, Ben Broadbent, said on Tuesday that Britain’s coronavirus pandemic was likely to have a limited long-run impact on inflation and has led to less short-term downward pressure on prices than might have been expected from the slump in headline economic output.

On the technical side, the EUR/GBP has violated the support level of 0.8940, and now it’s likely to extend the selling trend until it reaches 0.8873. The MACD and RSI are in support of selling; thus, we have entered the selling trade in the EUR/GBP pair. Here’s a trading plan…


Entry Price – Sell 0.89138

Stop Loss – 0.89538

Take Profit – 0.88738

Risk to Reward – 1:1

Profit & Loss Per Standard Lot = -$400/ +$400

Profit & Loss Per Micro Lot = -$40/ +$40

Fellas, now you can check out forex trading signals via Forex Academy mobile app. Follow the links below.

iPhone Users: https://apps.apple.com/es/app/fasignals/id1521281368

Andriod Users: https://play.google.com/store/apps/details?id=academy.forex.thesignal&hl=en_US


Categories
Forex Fundamental Analysis

EUR/GBP Global Macro Analysis – Part 3

EUR/GBP Exogenous Analysis

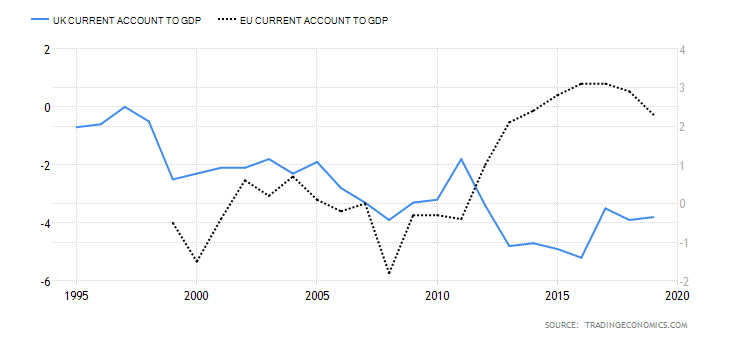
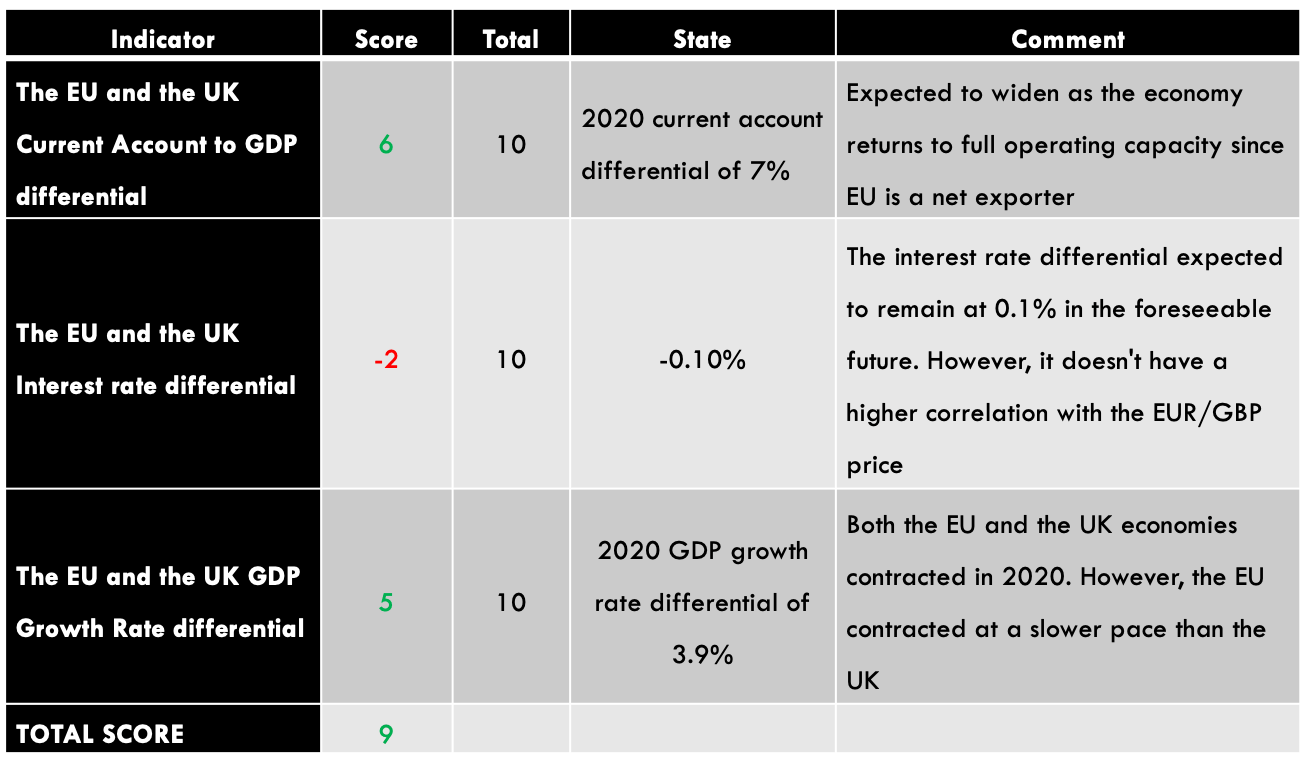
  • The EU and the UK Current Account to GDP differential

This indicator is used to measure how competitive an economy is in the international market. When a country has a higher trade surplus, the current account to GDP ratio is higher. Conversely, if a country has a lower trade surplus or deficit, the ratio is smaller.

Typically, economies with a higher surplus in terms of the balance of trade tend to have more exports than imports. That means that their value on exports is higher than imports, implying that the domestic currency is in high demand in the forex market. Similarly, a running deficit means lower demand for the domestic currency in the forex market since it is a net importer.

In 2020, the EU current account to GDP is expected to hit 3.4% while that of the UK -4%. The differential is 7%. Based on the correlation with the exchange rate of the EUR/GBP pair, we assign a score of 6. That means we expect a bullish trend for the pair.

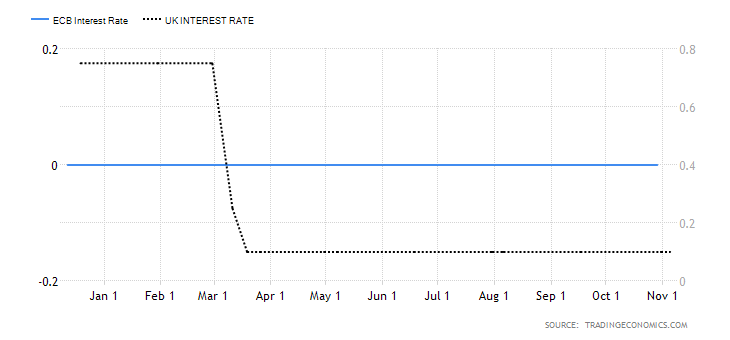
This helps determine where the most investor capital will flow. Expectedly, investors will direct their capital to the country with a higher interest rate to earn superior returns. In the forex market, traders tend to be bullish when a currency pair has a positive interest rate differential and bearish if it has a negative interest rate differential.

In the EU, the ECB has maintained interest rates at 0%, while the BOE cut interest rates from 0.75% to 0.1%. Therefore, the interest rate differential for the EUR/GBP pair is -0.1%. Based on the correlation with the EUR/GBP exchange rate, we assign a score of -2.

  • The EU and the UK GDP Growth Rate differential

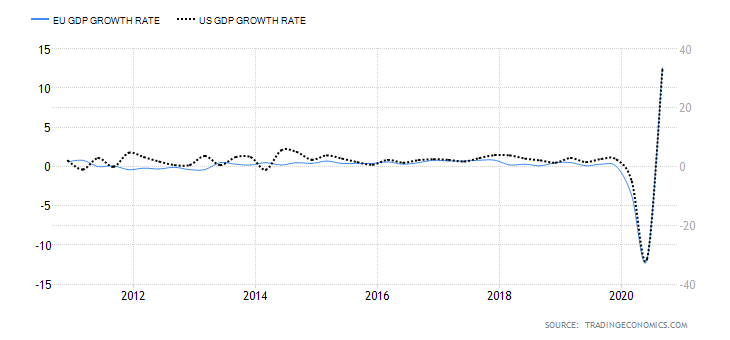
The differential in GDP growth helps to efficiently compare economic growth by eliminating the aspect of the size of different economies.

For the first three quarters of 2020, the EU economy has contracted by 2.9% while the UK has contracted by 6.8%. That makes the GDP growth rate differential between the two economies 3.9%. It means that the EU economy contracted at a slower pace than the UK. Based on the correlation with the EUR/GBP price, we assign a score of 5.

Conclusion

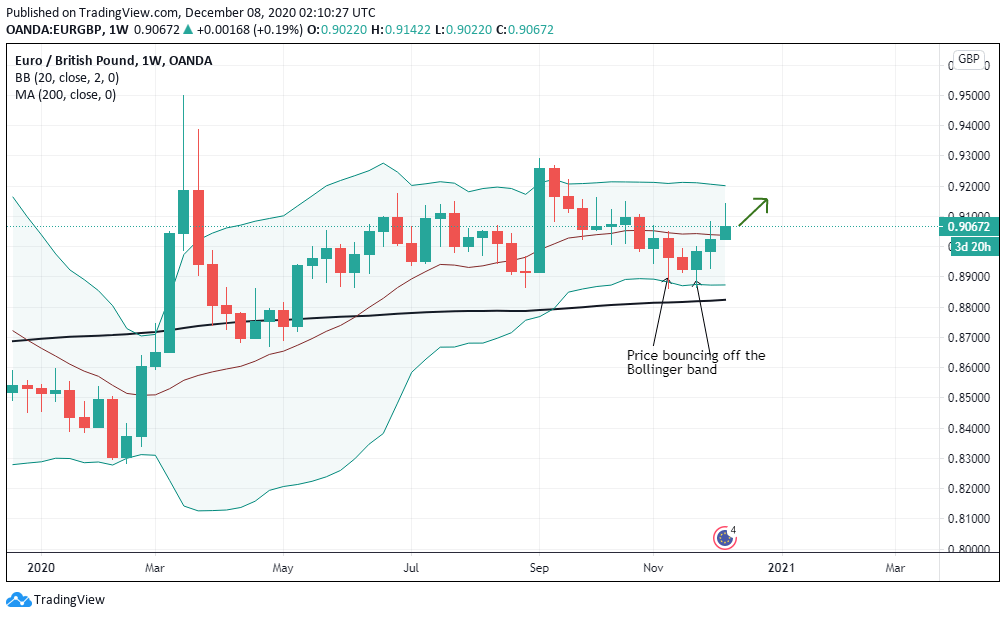
The exogenous analysis of the EUR/GBP pair has a score of 9. This inflationary score means that we can expect a bullish trend for the pair in the short-term.

Our technical analysis shows the pair trading above the 200-period MA. More so, notice that the EUR/GBP pair bounces off the lower Bollinger band crossing above the middle band, supporting our fundamental analysis. Happy  Trading.

Categories
Forex Signals

EUR/GBP Faces Resistance Below Downward Trendline – Sell Trade in Play! 


Entry Price – Buy 0.8973

Stop Loss – 0.9013

Take Profit – 0.8933

Risk to Reward – 1:1

Profit & Loss Per Standard Lot = -$400/ +$400

Profit & Loss Per Micro Lot = -$40/ +$40

Fellas, now you can check out forex trading signals via Forex Academy mobile app. Follow the links below.

iPhone Users: https://apps.apple.com/es/app/fasignals/id1521281368

Andriod Users: https://play.google.com/store/apps/details?id=academy.forex.thesignal&hl=en_US

Categories
Forex Signals

EUR/GBP Closes Bearish Setup – Quick Signal Update


Entry Price – Buy 0.8973
Stop Loss – 0.9013
Take Profit – 0.8933
Risk to Reward – 1:1
Profit & Loss Per Standard Lot = -$400/ +$400
Profit & Loss Per Micro Lot = -$40/ +$40
Fellas, now you can check out forex trading signals via Forex Academy mobile app. Follow the links below.
iPhone Users: https://apps.apple.com/es/app/fasignals/id1521281368
Andriod Users: https://play.google.com/store/apps/details?id=academy.forex.thesignal&hl=en_US

Categories
Forex Signals

EUR/GBP Trades Ascending Triangle – Bullish Breakout Eyed! 

The cross-currency pair EUR/GBP traded bullish, adding its moderate gains throughout the early European session. It’s been trading at 0.9113 level, consolidating with a narrow trading range of 0.9130 – 0.9085. 

The shared currency Euro was underpinned by the series of medium impacted data that came out in favor of the European economy. Yes, I’m referring to the Eurozone upbeat PMI prints. The preliminary announcement recorded that the German manufacturing area reverted to development in July, and the measure jumped to a 19-month high mark of 50.0. Appending to this, the Eurozone Manufacturing PMI grew to 51.1, and the Services PMI soared to 55.1 in July.

On the flip side, the Sterling fought to obtain any significant traction despite Friday’s stronger UK macroeconomic event. The United Kingdom’s monthly retail sales developed to register a surge of +13.9% for June as versus +8.0% forecasted and +12.0% beforehand. The core retail sales held at +13.5% MoM as versus to +7.5% forecasted and +10.2% previous one.


The EUR/GBP pair is consolidating in a narrow trading range of 0.9128 level to 0.9085 level. The upward trendline supports the pair at 0.9085 on the hourly timeframe, and it may cause a bounce off in the EUR/GBP pair later today. Simultaneously, the 50 periods EMA is also supporting the bullish bias in the EUR/GBP pair. But lately, the MACD and RSI figures are entering into the selling bias. Therefore, we need to be very careful with 0.9084 level as a violation of this could trigger sharp selling until 0.9056. Check out a trading plan below…

Entry Price – Buy 0.9124

Stop Loss – 0.9084

Take Profit – 0.9164

Risk to Reward – 1

Profit & Loss Per Standard Lot = -$400/ +$400

Profit & Loss Per Micro Lot = -$40/ +$40

Fellas, now you can check out forex trading signals via Forex Academy mobile app. Follow the links below.

iPhone Users: https://apps.apple.com/es/app/fasignals/id1521281368

Andriod Users: https://play.google.com/store/apps/details?id=academy.forex.thesignal&hl=en_US

Categories
Forex Signals

EUR/GBP Fails to Break Triple Bottom Support – Is Our Signal Still Safe?

The EUR/GBP pair is trading at 0.9028 level, holding above the triple bottom support area of 0.9020 level. Overall, the EUR/GBP is trading with a bullish bias, both from fundamental and technical perspective. For instance, the headline IFO Business Climate Index was improving to 85.0 against 79.5 previously. While, the Current Assessment sub-index was arriving at 84.0 this month, while the IFO Expectations Index – indicating firms’ projections for the next six months – is likely to come out at 87.0 in the reported month vs. 80.1 last.

Looking ahead, the big surge in the data will likely bolster market expectations toward faster recovery in the Eurozone’s largest economy, which may provide support to the shared currency. As we know, the economic activity has already recovered slightly since the March crash. As the Manufacturing and service sector activity improved in Germany in June, it showed in the preliminary PMIs released on Tuesday. 

One of the reasons behind a slight bearish bias today is that coronavirus remains a risk, said by the German Health Minister Jens Spahn, while speaking to broadcaster ARD on Wednesday, which eventually undermined the shared currency and contributed to the pair declines. As per the Jens Spahn, “we see that if we make it too easy for this virus, it spreads very, very quickly again even all over the world, we do not only see the relaxing attitude in Guetersloh – we’ve also seen it in Goettingen, in Leer, in Bremen and at churches and family celebrations.”

While the number of confirmed coronavirus cases increased to 191,449 with a total of 8,914 deaths so far, the cases rose by 587 in Germany on Wednesday against Tuesday’s +503, and the death toll rose by 19 as per the German disease and epidemic control center, Robert Koch Institute (RKI), on Wednesday.

The EUR/GBP pair early-day gains could be associated with the report that President Emanuel Macron and Dutch Prime Minister (PM) Mark Rutte made some progress on the talks over the European Union budget and recovery fund in the Netherlands which initially underpin the shared currency and provided support to the major during the early Asian session on the day.

Looking forward, the trader will keep their eyes on the German IFO Business Climate and pandemic updates for fresh impetus. As well as, Fed speech could offer additional directions for the pair.


On the technical side, the EUR/GBP is gaining support above 0.9020, and the closing of candles above this level can drive buying in the pair. Lagging indicators like the 50 periods EMA also suggests the bullish bias and extend support at 0.9007. However, the lagging indicator 50 periods EMA is suggestings odds of a bullish bias. Here’s a quick trade plan for the day. 

Entry Price – Buy 1.12914    

Stop Loss – 1.12514    

Take Profit – 1.13314

Risk to Reward – 1

Profit & Loss Per Standard Lot = -$400 / +$400

Profit & Loss Per Micro Lot = -$400/ +$40

Categories
Forex Assets

What Should You Know About EUR/GBP Forex Pair Before Trading

Introduction

EURGBP is the abbreviation for the currency pair Euro area’s euro against the Great Britain pound. This pair, unlike the EURUSD, USDCAD, GBPUSD, USDCHF, etc. is not a major currency pair. This pair is classified under the minor currency pairs and the cross-currency pairs. In EURGBP, EUR is the base currency, and GBP is the quote currency.

Understanding EUR/GBP

The current market price of EURGBP depicts the required number of pounds to purchase one euro. For example, if the value of EURGBP is 0.8527, then one needs to pay 0.8527 pounds to buy one euro.

EUR/GBP Specification

Spread

Spread in trading is the difference between the bid price and the ask price. The spread is not the same on all brokers but depends on the type of account. It also varies depending on the volatility of the market. An average spread on an ECN account and an STP account is shown below.

Spread on ECN: 0.8 | Spread on STP: 1.5

Fees

On trade a trader takes, there is some fee associated with it. Fees, again, depends on the type of account. There is no fee on STP accounts, but few pips on ECN accounts.

Slippage

When a trader executes a using the market order, they don’t really get the price they had intended. There is a small pip difference between the two prices. And this difference between the prices is referred to as slippage. The slippage is usually within 0.5 to 5 pips.

Trading Range in EUR/GBP

Understanding the volatility of the market is essential before opening or closing a position. It shows how much profit or loss a trader will be on a particular timeframe. For example, if the volatility is on the 4H is 10 pips, the trader can expect to gain or lose $1269 (10 pips x 12.69 value per pip) in a matter of about 4 hours.

The table below illustrates the minimum, average, and maximum pip movement on the 1H, 2H, 4H, 1D, 1W, and 1M timeframe.

EUR/GBP PIP RANGES

Procedure to assess Pip Ranges

  1. Add the ATR indicator to your chart
  2. Set the period to 1
  3. Add a 200-period SMA to this indicator
  4. Shrink the chart so you can assess a large time period
  5. Select your desired timeframe
  6. Measure the floor level and set this value as the min
  7. Measure the level of the 200-period SMA and set this as the average
  8. Measure the peak levels and set this as Max.

EUR/GBP Cost as a Percent of the Trading Range

An application of the volatility would be the determining of cost on each trade. As in, the ratio between the volatility and the total cost on each trade is calculated and is expressed in terms of percentage. The percentage depicts the cost for a particular timeframe and volatility. The comprehension of it shall be discussed in the subsequent section.

ECN Model Account

Spread = 0.8 | Slippage = 2 | Trading fee = 1

Total cost = Slippage + Spread + Trading Fee = 2 + 0.8 + 1 = 3.8

STP Model Account

Spread = 1.5 | Slippage = 2 | Trading fee = 0

Total cost = Slippage + Spread + Trading Fee = 2 + 1.5 + 0 = 3.5

The ideal way to trade the EUR/GBP

With the above two tables, let us figure out the ideal way to trade this currency pair. Note that the higher the percentage, the higher is the cost on a trade and vice versa. It is evident from the chart that the percentages are highest for the minimum column and lowest for the max column. In other words, the cost is high when the volatility of the market is low, and the cost is low when the volatility is high. So does this mean it is ideal to trade when the volatility is high? Well, that’s not the right approach to it, as trading in high volatility is risky. So, it is ideal to take trades during those times when the volatility is around the average range. Doing that will ensure marginal cost as well as decent cost. For example, a 4H trader must take trades during those occasions when the volatility is around 20 pips.

Note: One can apply the ATR indicator to determine the current volatility of the market.

Another feasible way to reduce costs is by canceling out the slippage cost. Cancel slippage costs can simply be done by placing limit orders. With limit orders, the slippage automatically becomes 0.

The difference in the cost percentage when the slippage goes to zero is illustrated as follows.

We hope you find this Asset Analytics informative. Let us know if you have any questions in the comments below. Cheers!

Categories
Forex Market Analysis

Daily F.X. Analysis, December 12 – Top Trade Setups In Forex – U.K. Voting and ECB in Play! 

The U.S. dollar declined versus other major currencies as the Fed signaled that interest rates could be stable at current levels through 2020. The ICE U.S. Dollar Index sank to 97.08, the lowest level since August.

The euro rose 0.4% to $1.1133. The European Central Bank is expected to keep its monetary policy unchanged later today.

As expected, the Federal Reserve maintained the rates after cutting them at three earlier meetings. Fed Chairman Jerome Powell stated that monetary policy is well-positioned for the expanding economy, where the jobs market is expected to remain strong and inflation moderate.

Economic Events to Watch Today

Let’s took at these fundamentals.


EUR/USD – Daily Analysis

The EUR/USD currency pair slightly recovered in the last hour in the wake of inflation data released from the United States, which made the EUR/USD pair weaker. As of writing, the EUR/USD currency pair is currently trading 1.1094 but virtually unchanged daily near the 1.1090 handles. 

The data published by the United States (U.S.) Bureau of Labor Statistics (BLS) on Wednesday showed that the core Consumer Price Index (CPI) in the United States stayed unchanged at 2.3% every year during November. Although these figures came in line with the market expectation, the initial reaction caused the U.S. Dollar Index to drop to a fresh session low below the 97.50 marks.

Despite this, the EUR/USD currency pair may not pick up bid further in the coming hours because traders are unlikely to take large bets before the Federal Reserve Open Market Committee monetary policy announcements. However, investors don’t see the Federal Reserve cutting rate again; the updated economic projections will provide fresh hints regarding the rating outlook in 2020. 

After the FOMC event, investors’ eyes will shift to the European Central Bank’s (ECB) meeting and President Lagarde’s first press conference on Thursday.

According to the ECB event, we will not see the steady bullish progress in the EUR currency because policy continuity should be the main takeaway. Lagarde’s style and sound is a wild card. Preventing an early misstep there, the slight declines we see to growth may be offset upgrades to next year’s inflation forecast.

At the Fed front, the Federal Reserve is expected to keep the Fed Funds rate stable at the 1.50 – 1.75% range. After cutting interest rates 3-times in a series, for now, market participants see no change today and also at the January meeting. Most members of the Federal Open Market Committee (FOMC) mentioned they think the current stance of policy appropriate. 

Looking forward, the Federal Reserve will announce its decision regarding monetary policy today at 19:00 GMT. Chairman Jerome Powell will read a statement and will hold a press conference at 19:30 GMT. 

Daily Support and Resistance

  • S3 1.102
  • S2 1.1043
  • S1 1.1054

Pivot Point 1.1066

  • R1 1.1076
  • R2 1.1089
  • R3 1.1111

EUR/USD– Trading Tips

The EUR/USD has crossed over its 5-month downtrend at 1.1113. The EUR/USD is trending higher but has not gained any support until now. The EUR/USD has next support near 61.8% Fibonacci support level of 1.1105.  

While the resistance stays around 1.1190, and the 1.1225 horizontal resistance mark strictly follows it. Considering the recent crossover on MACD, the pair may trade bearish below the 1.1100 level today. 


GBP/USD– Daily Analysis

The GBP/USD currency pair dropped but recovered a significant part of its early declines to weekly lows manly in the reaction to the latest election polls results. As of now, the GBP/USD currency pair is currently trading near the 1.3179 and consolidates in the narrow range between 1.3108 – 1.3188 after the Fed holding rates steady yet signaling that there will not be a change in rates in 2020, something quite to the contrary of Fed watchers.

The pair continued the previous session’s late pullback from over eight-month highs and saw some follow-through long-unwinding trade on Wednesday in the wake of the latest U.K. election poll, which tilted towards a hung parliament.

A closely watched YouGov’s poll based on the MRP model showed a narrowing lead for Prime Minister Boris Johnson’s Conservative Party, now expected to win a majority of 28 seats in the parliament, falling sharply from 68 last month.

The slight pick up in the greenback demand, despite the uncertainty of President Trump regarding the phase-one trade deal between the United States and China, further collaborated to the pair’s intraday slide to the 1.3100 neighborhood.

No:1 Key takeaways from FOMC statement and projections

No:2 The market has priced in virtually no chance of rate move through February.

No:3 IOER 1.55% vs 1.55% prior.

No:4 Fed drops language about ‘uncertainties about this outlook remain.’

No:5 The vote was unanimous.

No:6 The Committee will continue to monitor the implications of incoming information for the economic outlook, including global developments and muted inflation pressures, as it assesses the appropriate path of the target range for the federal funds rate.”

No:7 No changes in the economic outlook paragraph*

No:8 Says, “the current stance of monetary policy is appropriate.”

No:9 Leaves forecasts for GDP and inflation unchanged lowers 

unemployment.

No:10 The median forecast is for one rate hike in 2021 and one in 2022.

Looking forward, we are now counting down to the U.K. election vote for Thursday, where results are expected to come in from around 0200 GMT onwards. Pound Sterling has been improving because of yesterday’s YouGov outcome that proved the Conservative’s lead was narrowing. 


Daily Support and Resistance

  • S3 1.3056
  • S2 1.3104
  • S1 1.3124

Pivot Point 1.3153

  • R1 1.3173
  • R2 1.3202
  • R3 1.325

GBP/USD– Trading Tip

The GBPUSD is displaying a solid bullish bias as traders seem confident about the victory of the Conservative party and assume Boris Johanson to win the election. The GBP/USD may persist massively volatile today, and a day after, as the election result will start reaching out by tomorrow morning. On the higher side, the GBP/USD is expected to find resistance around 1.3265 and 1.3336. While the support can be seen near 1.3185 and 1.3110.

The RSI and MACD are in the bullish zone, signaling chances of a bearish correction, but then the Sterling will be found to do more upward movement. 


USD/JPY – Daily Analysis

The USD/JPY currency pair initially hit the bullish track and rose to 108.76 and the reversed falling to 108.57, the new daily bearish level after the decision of the Federal Reserve to keep the rate unchanged. As of writing, the USD/JPY currency pair is currently trading at 108.60, slightly lower as compared to previous before the statement.

The greenback dropped across the bard and hit the fresh bearish levels. The U.S. Dollar Index dropped under 97.30, the lowest level since November 4. The United States’ yields moved to the downside, and equity prices in Wall Street rose but remain under the highs. 

At the Sino-US front, the clock is ticking because we close in on the deadline on the so-called ‘phase- one’ deal and/or tariff delay by December 15. We are awaiting an announcement from U.S. President Donald Trump to come before the weekend’s deadline. Moreover, the news yesterday that tariffs would be delayed caused a short period of risk-on in the markets. Still, the news was unconfirmed, and Trump’s closest advisers tell the decision is finally depend on the president.

Daily Support and Resistance    

  • S3 108.06
  • S2 108.31
  • S1 108.43

Pivot Point 108.56

  • R1 108.68
  • R2 108.8
  • R3 109.05

USD/JPY – Trading Tips

On Thursday, the dovish FOMC and weaker U.S. dollar have driven sharp selling in the USD/JPY currency pair this week. For now, the pair is trading above 108.550, which is working as a double bottom support level.

A bearish breakout of this level can trigger selling until 108.250. The USD/JPY has already completed 81% retracement on three hourly charts, and this level can give some support to USD/JPY. Above this, the pair may find resistance around 108.900. Let’s wait for NFP to determine the further trend of USD/JPY. 

All the best!

Categories
Forex Market Analysis

Market Update: BoC Keeps its Overnight Rate Target Unchanged

BoC release

The bank of Canada has released its  overnight rate, keeping it at the same level with 1.25% As all economists had recently expected that rate to remain unchanged.

“Inflation in Canada is close to 2 percent as temporary factors that have been weighing on inflation have largely dissipated” (source: BoC release note).

The market has its own response to slipping of the Canadian dollar, as the decision was already priced in, so most of the traders started to open short positions.

UK Inflation

On the other hand, UK Inflation Drop Poses a Challenge For Bank of England. As CPI released with 2.5% despite its forecast with 2.7%

This diagram shows UK inflation


CAD/CHF

On the daily chart, the price has reached a well demand area. As it rebounded from the lower trendline connecting the highs, also from the broken upper trendline connecting the lows, and finally the resistance zone (0.7615-0.769)

The pair had its bullish rally to approach the B point of the harmonic pattern.

After reaching 61.8& Fibonacci & moving average 200, the price is expected to go down to meet 0.759 then 0.75


CAD/JPY

On the daily chart, the price couldn’t go further after rebound from the main resistance 85.55

It’s a combination of demand level & 50% Fibonacci

After reaching an overbought area in RSI and forming pin bar, the price is expected to go down to retest 83.5


EUR/GBP

On the daily chart, the pair has a tight movement for seven months. Between then levels 0.867 & 0.901

The price reversed from the support level after making a false break

With two bullish candles & oversold in RSI, we should wait until the lower channel is broken up to reach the next target at 0.879


Categories
Forex Market Analysis

Weekly Forecast w/c 22nd January 2018

Weekly forecast’s Hot Topics:

  • DOLLAR – US GOVERNMENT SHUTDOWN STILL WITHOUT A DEAL.
  • EUR – WHAT TONE WOULD DRAGHI TAKE IN THE NEXT ECB MONETARY POLICY DECISION?
  • GBP – COULD IT BE MAKING A TERMINAL PATTERN?

Weekly Performance

The past week, the best performer was the Aussie with an advance of 1.18% supported mainly by the stronger employment change data released on Thursday 18th, where it was forecasted 9K and the change reported was 34.7K. The worst performer was the Loonie which fell -0.33% after the BoC decision that kept the interest rate at a 1.25%.


DOLLAR – US GOVERNMENT SHUTDOWN STILL WITHOUT A DEAL.

This week the US agenda will be driven by the Government shutdown and the deal expectation that the Republican Senate could achieve with Democrats. On the economic side, the main macroeconomic events will be from the housing market, in both Existing Home Sales and New Home Sales, a moderated decrease is expected.

Technically, the US Dollar Index is in a range between 89.99 and 90.8. RSI is showing bullish divergence signals. The price could make a new low to the 89.6 area before it starts a new bullish cycle.

EUR – WHAT TONE WOULD DRAGHI TAKE IN THE NEXT ECB MONETARY POLICY DECISION?

This Thursday 25th, the market volatility will be led by the Mario Draghi tone in the ECB Monetary Policy Decision Conference. Investors are expecting answers to the following questions: When will the first interest rate hike be? When will the QE end? What is his opinion about the strength of the Euro and the inflation level due to the climb in oil prices? Also, the market is expecting news about his successor in the ECB Presidency.

On the technical side, in the short term, the price remains bullish. Our vision is a limited appreciation of the common currency to 1.239 area for then start a new bearish cycle that could reach the 1.15 area.


GBP – COULD IT BE MAKING A TERMINAL PATTERN?

The Sterling has a gaining momentum as it approaches 1.40 level. In this area, we find the 2nd weekly resistance level (1.406); our vision is that in this area the pound could find resistance and start a corrective structure in the first instance to 1.384, and the second instance to 1.373 level.