The H1 reversal candle plays a significant part in the H1-15M chart combination trading. If the traders wait to get an H1 reversal candle, by using candle’s lower low/higher high, they get a better risk-reward. In a bearish market, a trader needs to wait for an H1 bearish reversal candle after the breakout. In a bullish market, he needs to do the opposite. In today’s lesson, we are going to demonstrate an example of a bullish market where the H1-15M chart combination offers an entry upon producing an H1 bullish reversal candle. Let us get started.
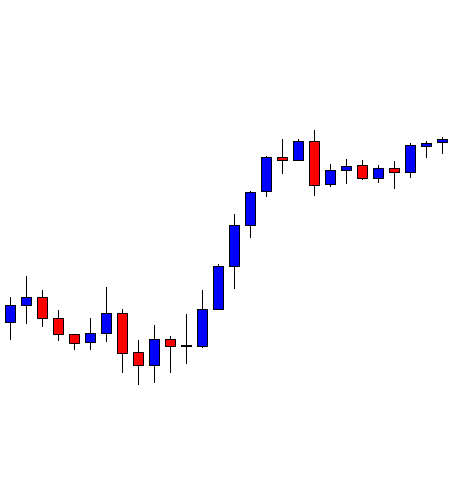
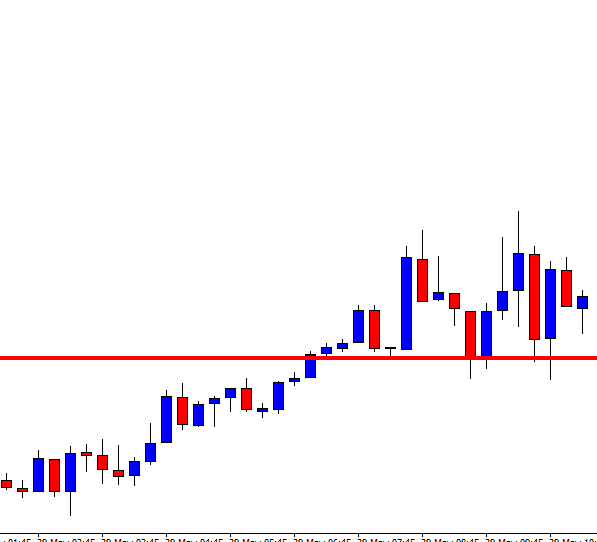
This is an H1 chart. The chart shows that the price heads towards the North with good bullish momentum. The price, then upon finding its resistance, has been in a bearish correction. It consolidates around a level and heads towards the North. The buyers are to keep their eyes on the chart with a hope that it may make a bullish breakout.
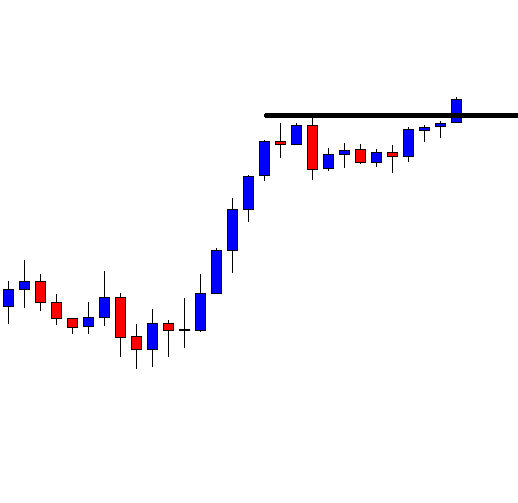
The chart shows that the last candle makes a bullish breakout closing well above the last highest high. The buyers are to wait for the chart to produce an H1 bullish reversal candle followed by a 15M bullish candle to trigger a long entry. Let us keep watching the chart to get that H1 bullish reversal candle.
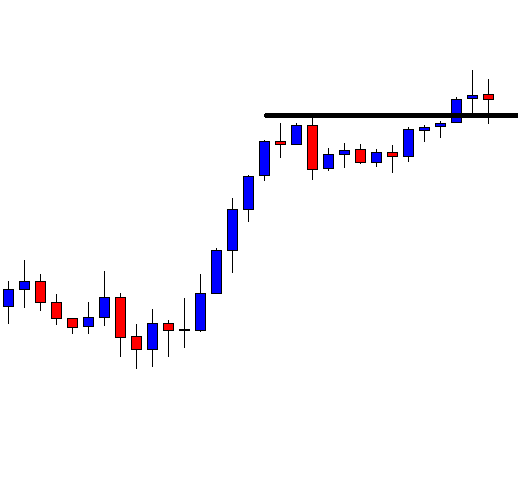
The chart shows that it produces two doji candles. It means the price has been in bearish correction at the minor charts. An H1 bullish reversal candle at the breakout level would be the ‘getting ready’ signal to go long in the pair.

Look at the last candle. The last candle comes out as a bullish candle forming at the breakout level. The buyers are waiting for the chart to produce such a candle. They may flip over to the 15M chart now. Let us flip over to the 15M chart.
The last candle comes out as a bearish inside bar. Since the H1 candle closes as a bullish candle, so a 15M bullish candle is the signal to trigger a long entry. Let us proceed to the next chart.
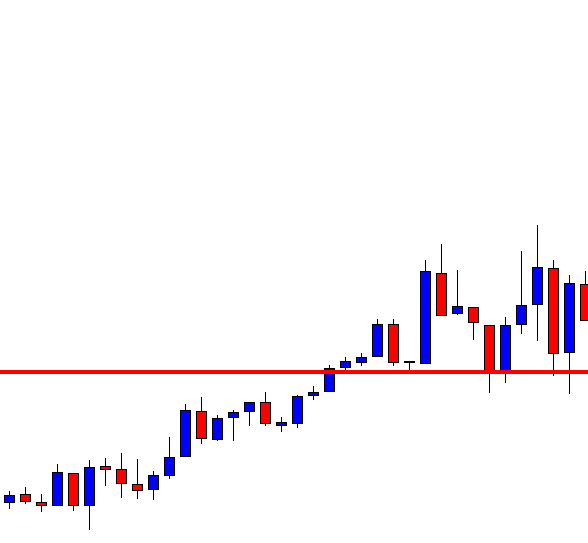
Here it is. The chart produces a bullish Pin Bar. The buyers may trigger a long entry right after the last candle closes. Traders may set their stop loss below the H1 bullish reversal candle’s lowest low, which is below the red-marked level. To set take profit, they may use Fibonacci levels. If the price trends from 61.8%, it usually goes up to the level of 161.8%. Let us find out how this one goes.
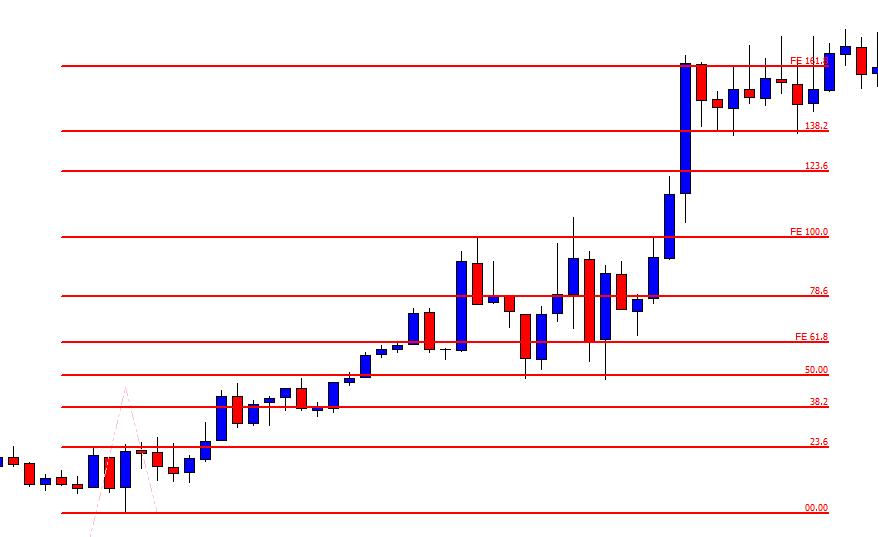
Yes, the price heads towards the level of 161.8% with good bullish momentum. If we flip over to the 15M chart right after the breakout, we would take entry by setting stop loss below 00.00%. By waiting for an H1 reversal candle, we may set the stop loss below 38.2%. This ensures a better risk-reward. On the other hand, if we always wait to get an H1 reversal candle after the breakout, we may not get it all the time. Thus, we end up being offered less number of entries in the H1-15M chart combination trading.