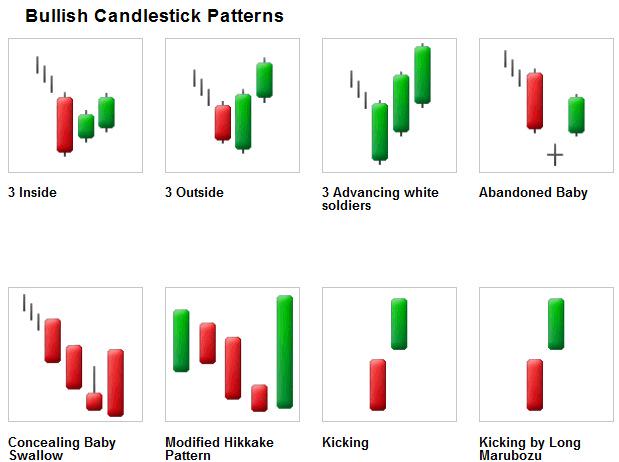
Hundreds and hundreds of trading tools make it super easy for the traders to trade the markets. There are candlestick patterns, indicators, price action trading. All of these things making trading are an easy game for the traders. In this article, we are using the reversal patterns and double moving average to successfully trade the counter trend situations. Below is the explanation of a couple of reversals candlesticks and the double moving average.
BULLISH ENGULFING PATTERN
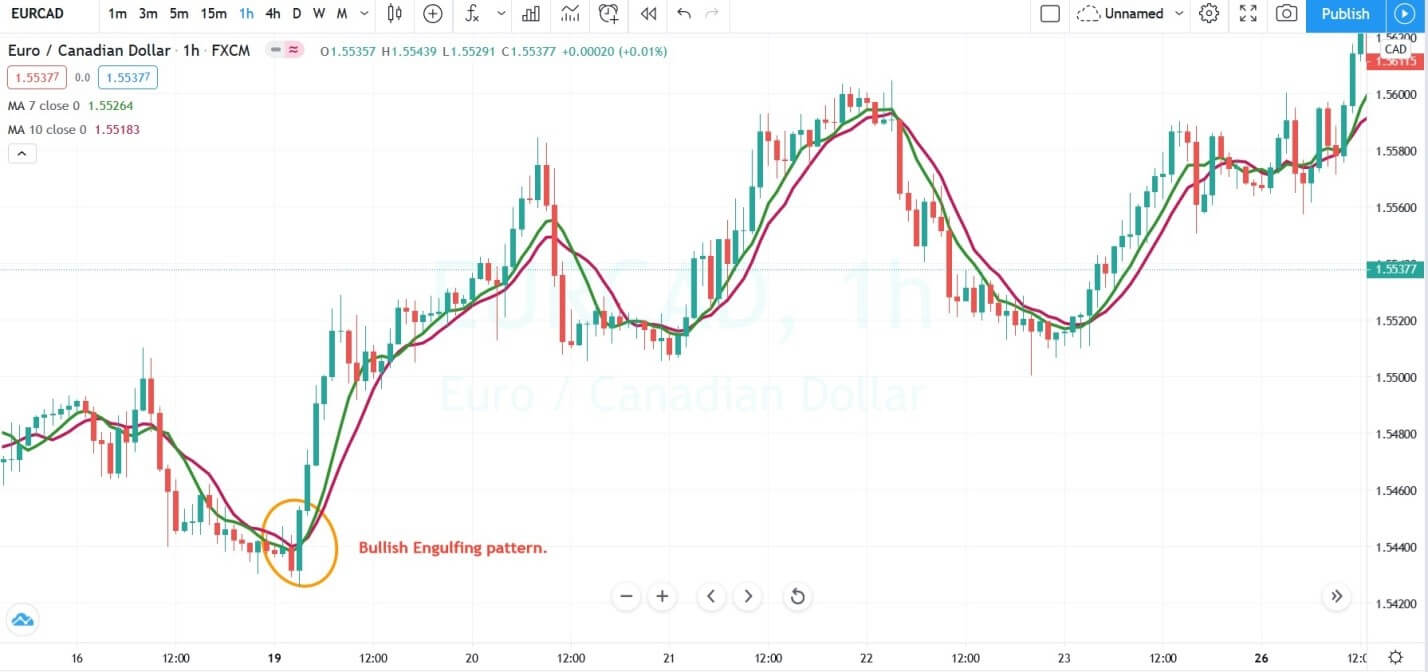
Bullish engulfing is a reversal pattern that appears at the end of the downtrend. The pattern consists of two candles, Red and Green. The first candle is red, which indicates the sellers are in control and the second candle completely engulfs the first candle, which shows that the buyers overtake the sellers.
HAMMER
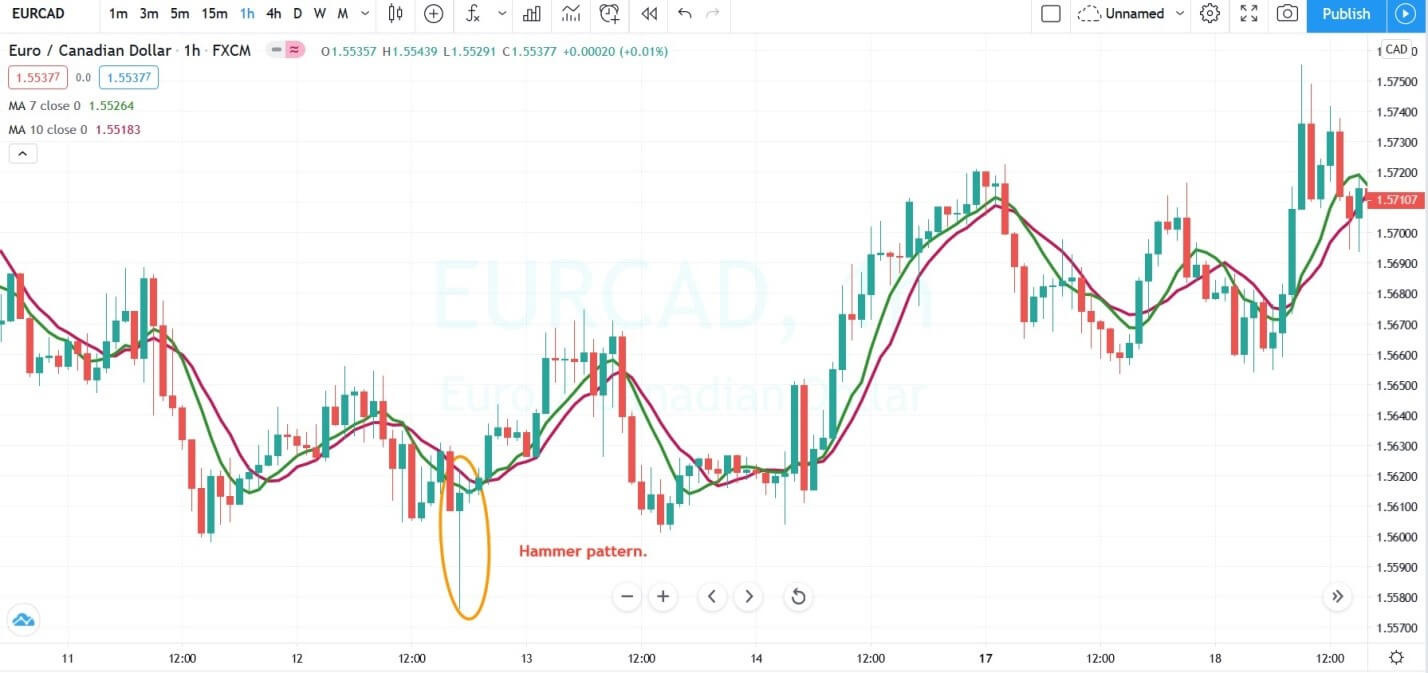
Hammer is a single candle reversal pattern, and it appears in a downtrend. The pattern forms a hammer-shaped candlestick, where the lower shadow is twice as big the size of the real body of the pattern. The boy of the candlestick represents the closing and opening price, and the lower shadow indicates the low of the candle.
MORNING STAR
Morning star is a reversal three candle pattern appears in a downtrend. The first candle is red indicating the downtrend and the second candle opens gap down which means the sellers are in control and the third candle pushes the prices and closed near the opening of the first candle indicating the buyers stepping in and get ready for the brand new higher high.
DRAGONFLY PATTERN
Dragonfly is a single candle pattern which shows the extreme strength of the buyers. The candle open, close and high is the same, indicating the buyers are ready for the brand new higher high. It has a long lower shadow with no upper body.
MOVING AVERAGES
Moving average is a trend following lagging indicator based on the past price. The indicator is used for identifying market trends. If it is pointing upward and below the price, it means the trend is up, and if it is above the price and pointing downward, it means the trend is down. All the type of traders uses moving averages, and there are infinite numbers of averages exists, which traders used according to the market circumstances. If you are a lower timeframe trader, then use the lower averages and if you are trading the higher timeframe or swing trader, then go for the bigger averages.
REVERSAL TRADING STRATEGIES
The image below represents the Bullish engulfing pattern in the EURCAD forex pair.
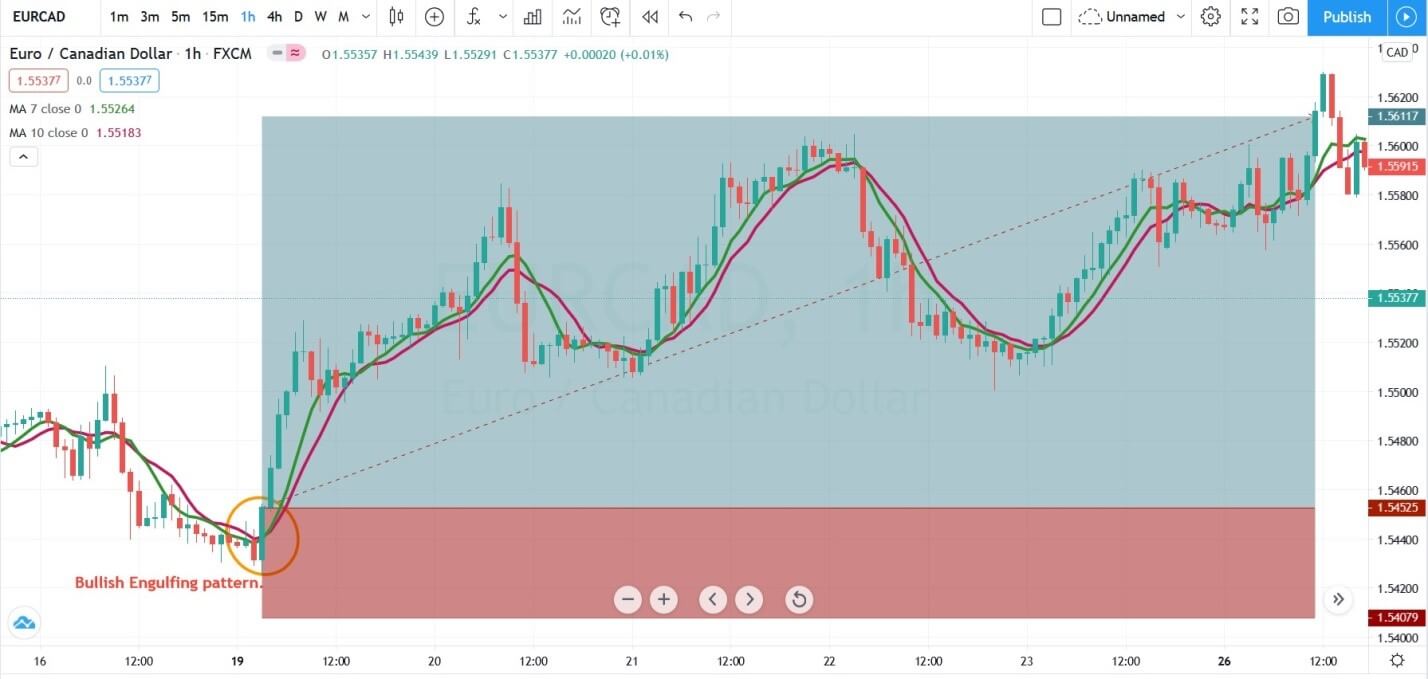
The image below represents the buying entry after the short term reversal in the EURCAD. When the second green candle completely engulfs the first red candle and closes above both of the moving averages, it was an indication to go long. We took the entry after the pattern completion and choose to go for a brand new higher high with stops below the entry.
TRADING THE HAMMER PATTERN
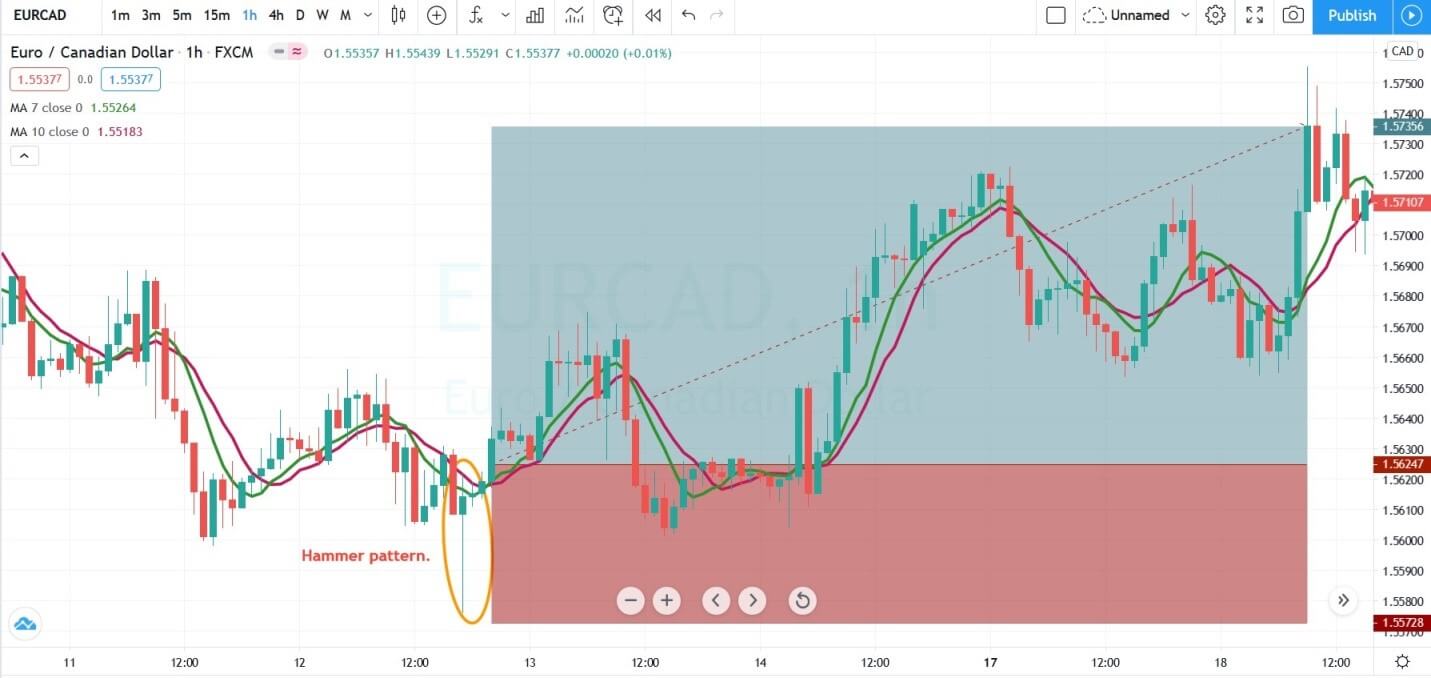
The image below represents the Hammer pattern in the EURCAD forex pair.
The image below represents the hammer pattern and our buying entry in the EURCAD as you can see the price action prints the hammer pattern, but it failed to go above the moving average. At this stage, some trader chooses not to trade the pattern just because half of the criteria aren’t met. This happened some tie in the market where one tool is saying something and another one is saying something. In these situations, it is advisable to have enough patience and let the second trading tool to align with the first one. In our trade after the three hours prices goes above the moving average, which indicated the buying momentum is back into the show. With the stops just below the pattern, we choose to milk the trend for the brand new higher high.
TRADING THE MORNING STAR PATTERN
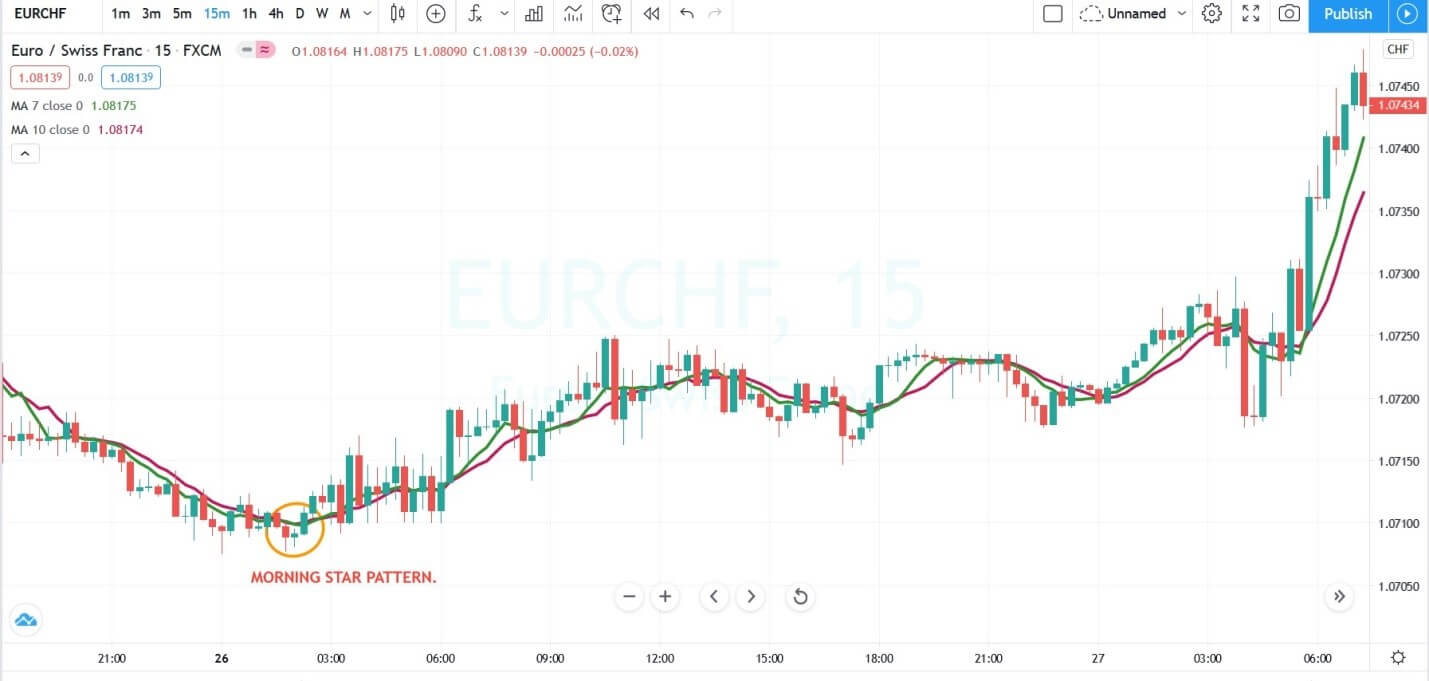
The image below represents the Morning star pattern in the EURCHF forex pair.
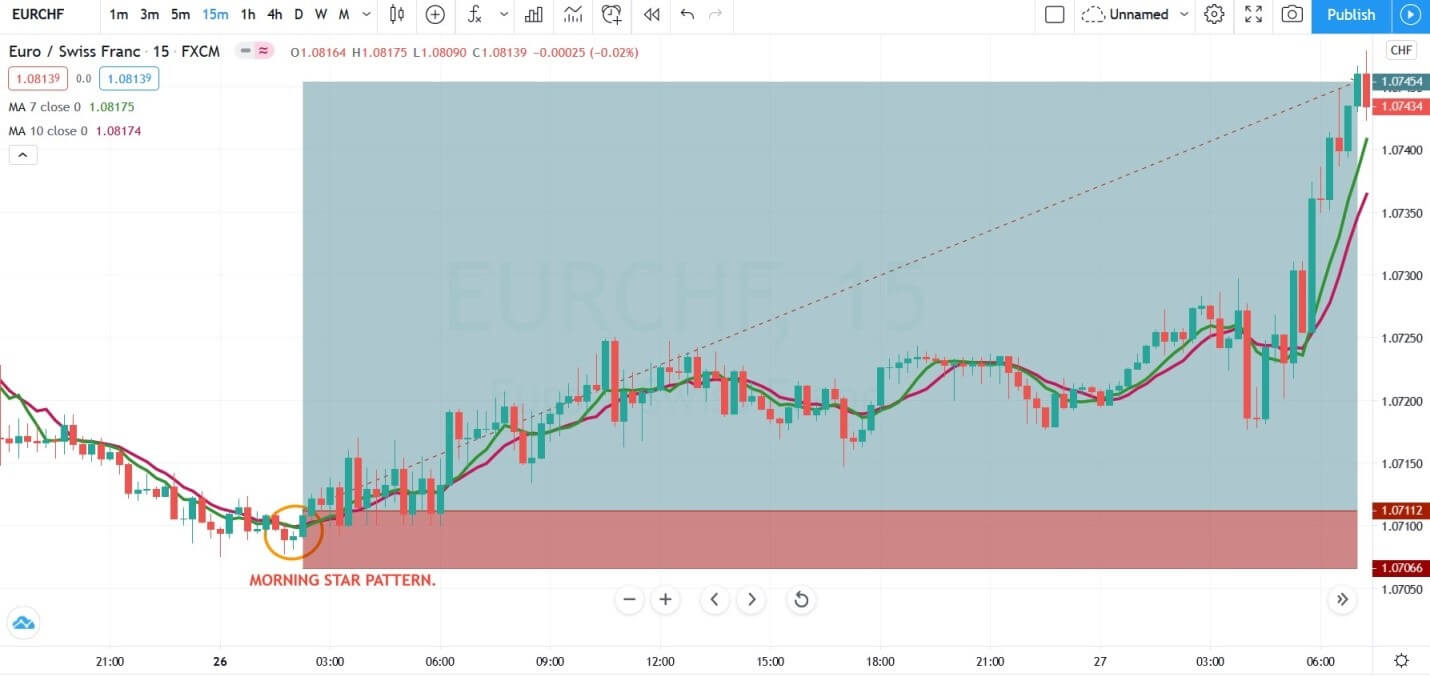
The image below represents our entry, exit, and stop-loss in the EURCHF forex pair. The market was in a downtrend, and when the prices prints the morning star pattern and both of the moving averages goes above the price, it means the market is printed at the bottom, and going long will be beneficial. We activated the buying entry after the pattern completion with the stops just below the entry, and for taking profit, the brand new higher high was a good area.
DRAGONFLY PATTERN
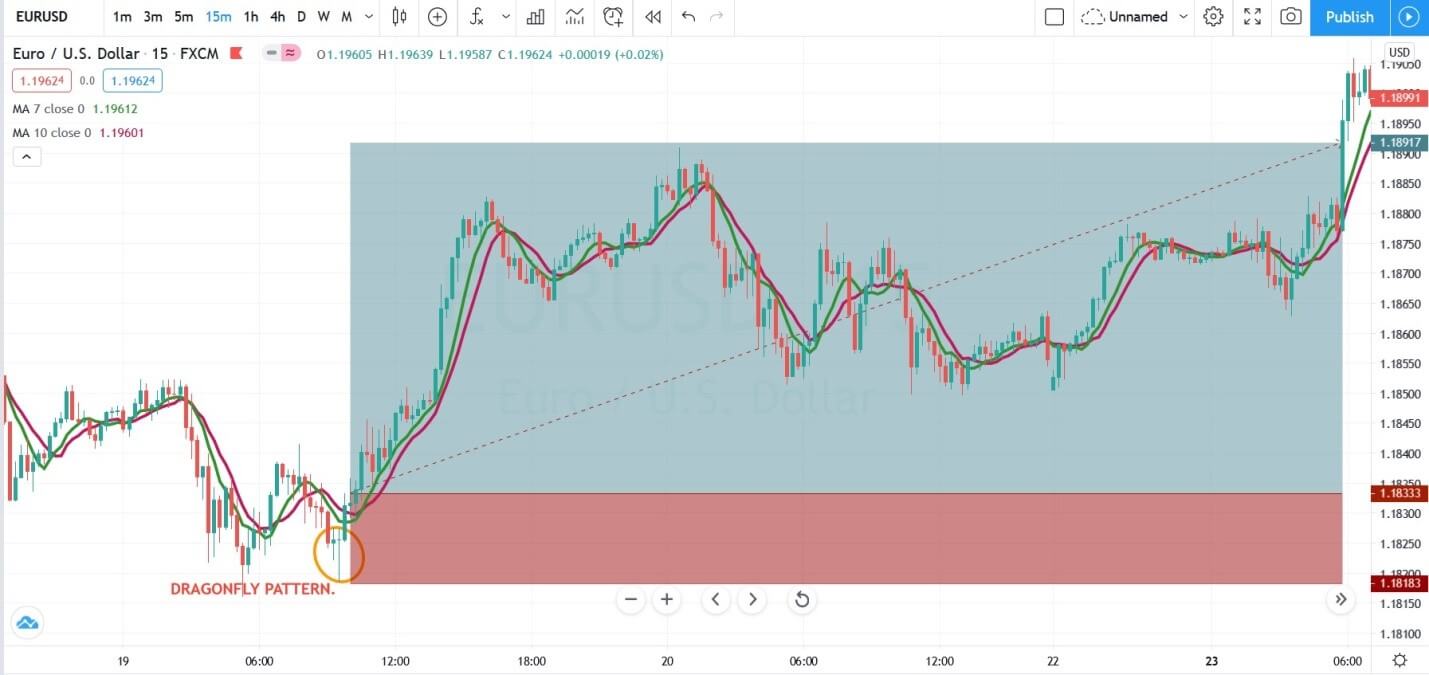
The image below represents the buying trade in the EURUSD forex pair.
As you can see in an ongoing downtrend when the market printed the dragonfly pattern, but it was below the moving average, which means we need to wait for another signal to line up to take the trade. Patience matters, if you take trade by having only one signal, then the chances of loss are very high. So wait let the things to settle, let both of the tools to align in one direction then only go. On this 15 minute chart when the moving average goes above the price action, we choose to go long with the stops below the entry.
CONCLUSION
In today’s world, we have a lot of tools which makes trading is an easy game. Do not try to use all the trading tools; instead, choose the one or two and master them on demo first then only choose another one. Here in this article, we discussed the four well-known candlestick patterns to trade the reversals. By pairing them with the moving average traders can time the market well. In these four trading strategies, two of them gave use the trades immediately, and two of them took some time to confirm the entry. Never be in a hurry to pull the trigger; it can produce disastrous effects. The major problem with the traders is that they always try to tell the market what to do next; instead, it is the market duty to tell us what to do next in the game, when to pull the trigger and when not.

