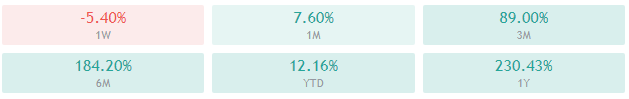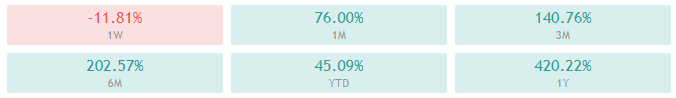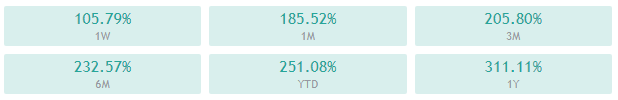
The cryptocurrency space had a wild week, first because of the r/WallStreetBets community entering the market (and pumping Dogecoin’s price by over 1000%) and then because of Tesla’s CEO Elon Musk tweeting about Bitcoin and promoting it. This has, in turn, caused Bitcoin to spike from $31,000 all the way to $38,200 in a matter of one hour. An interesting fact is that Musk’s Twitter bio now has #bitcoin displayed for everyone to see.
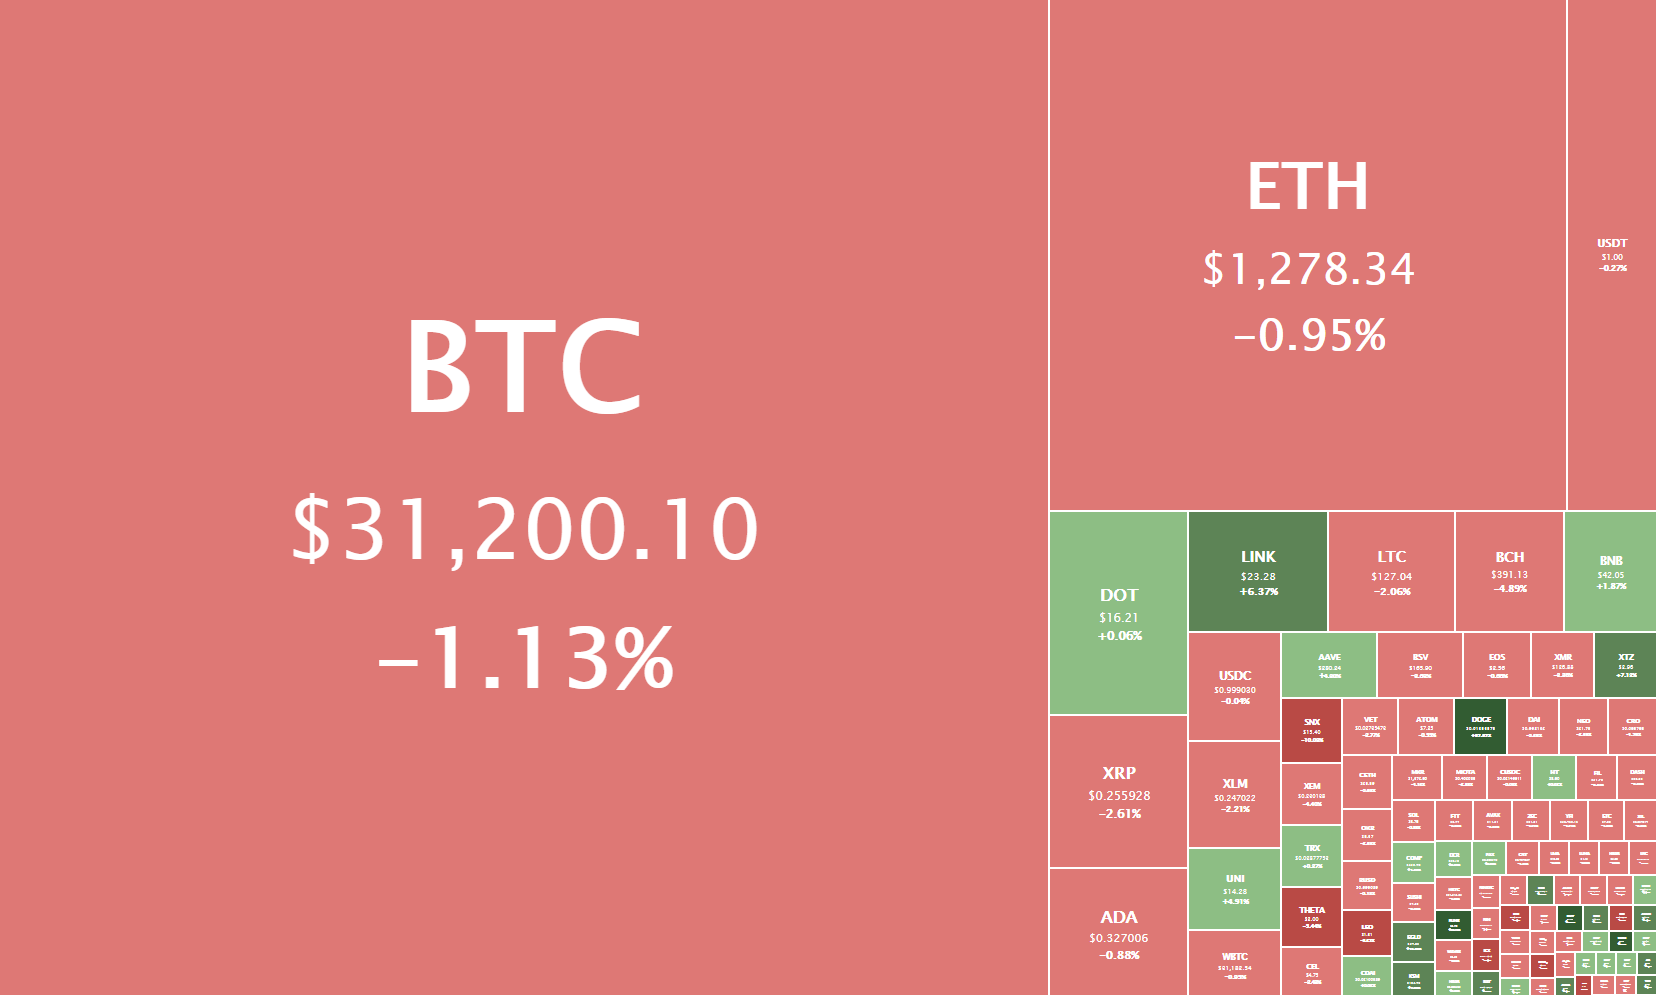
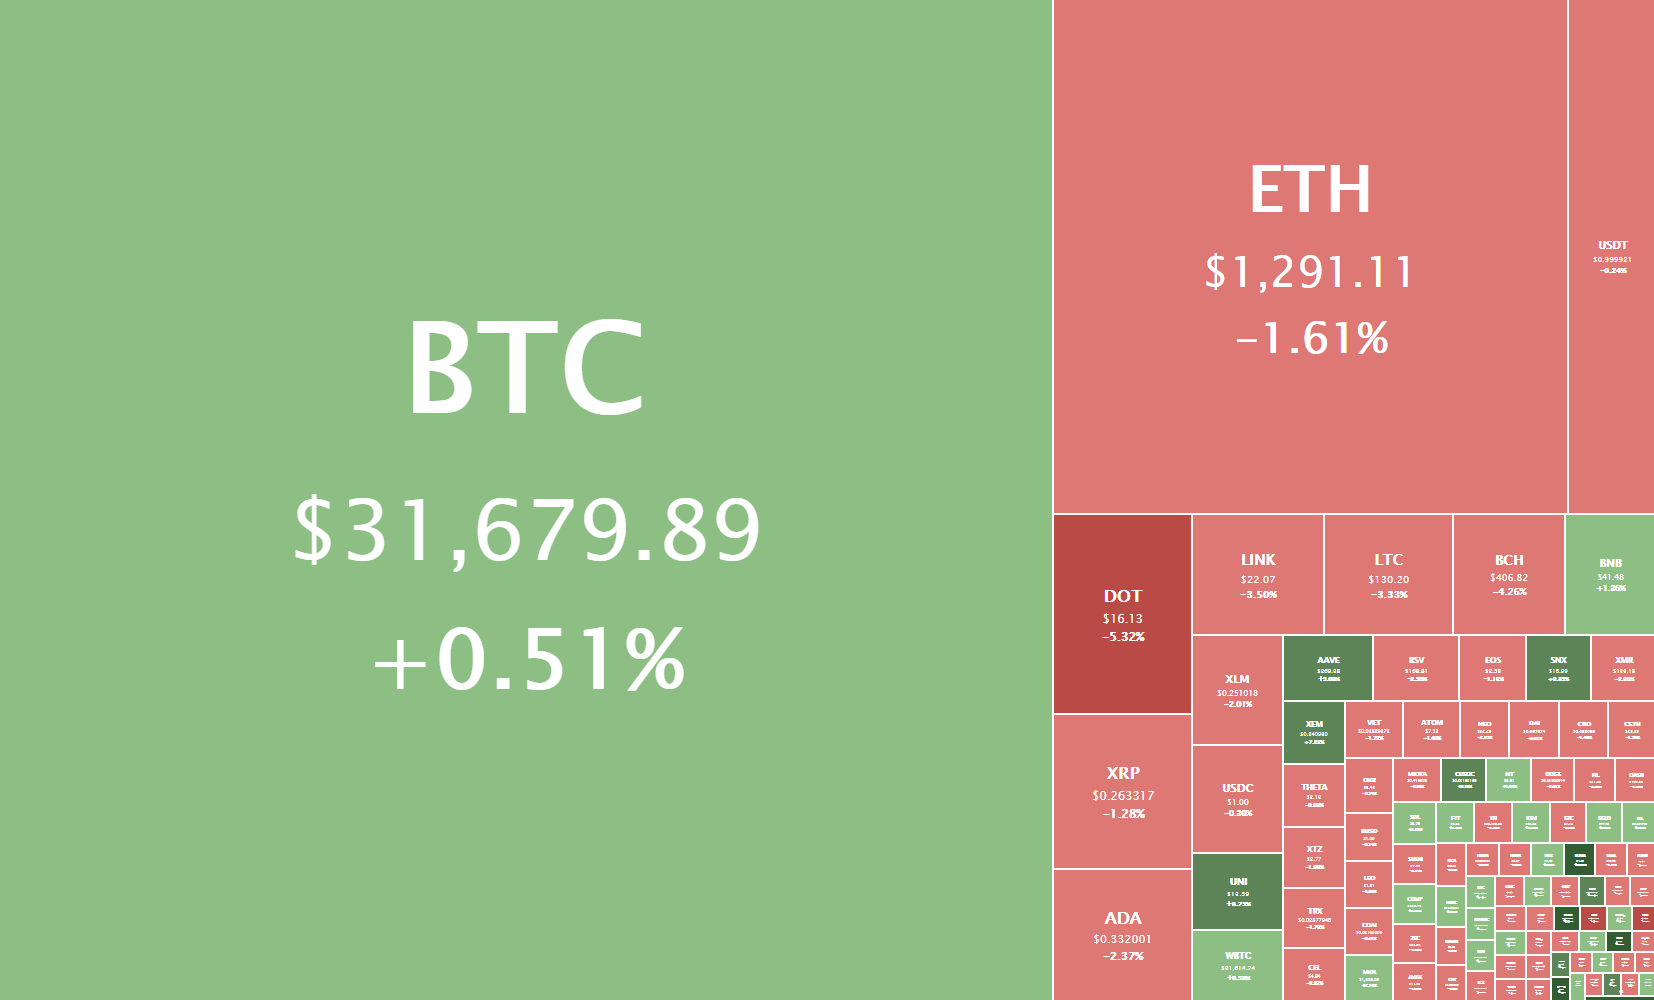
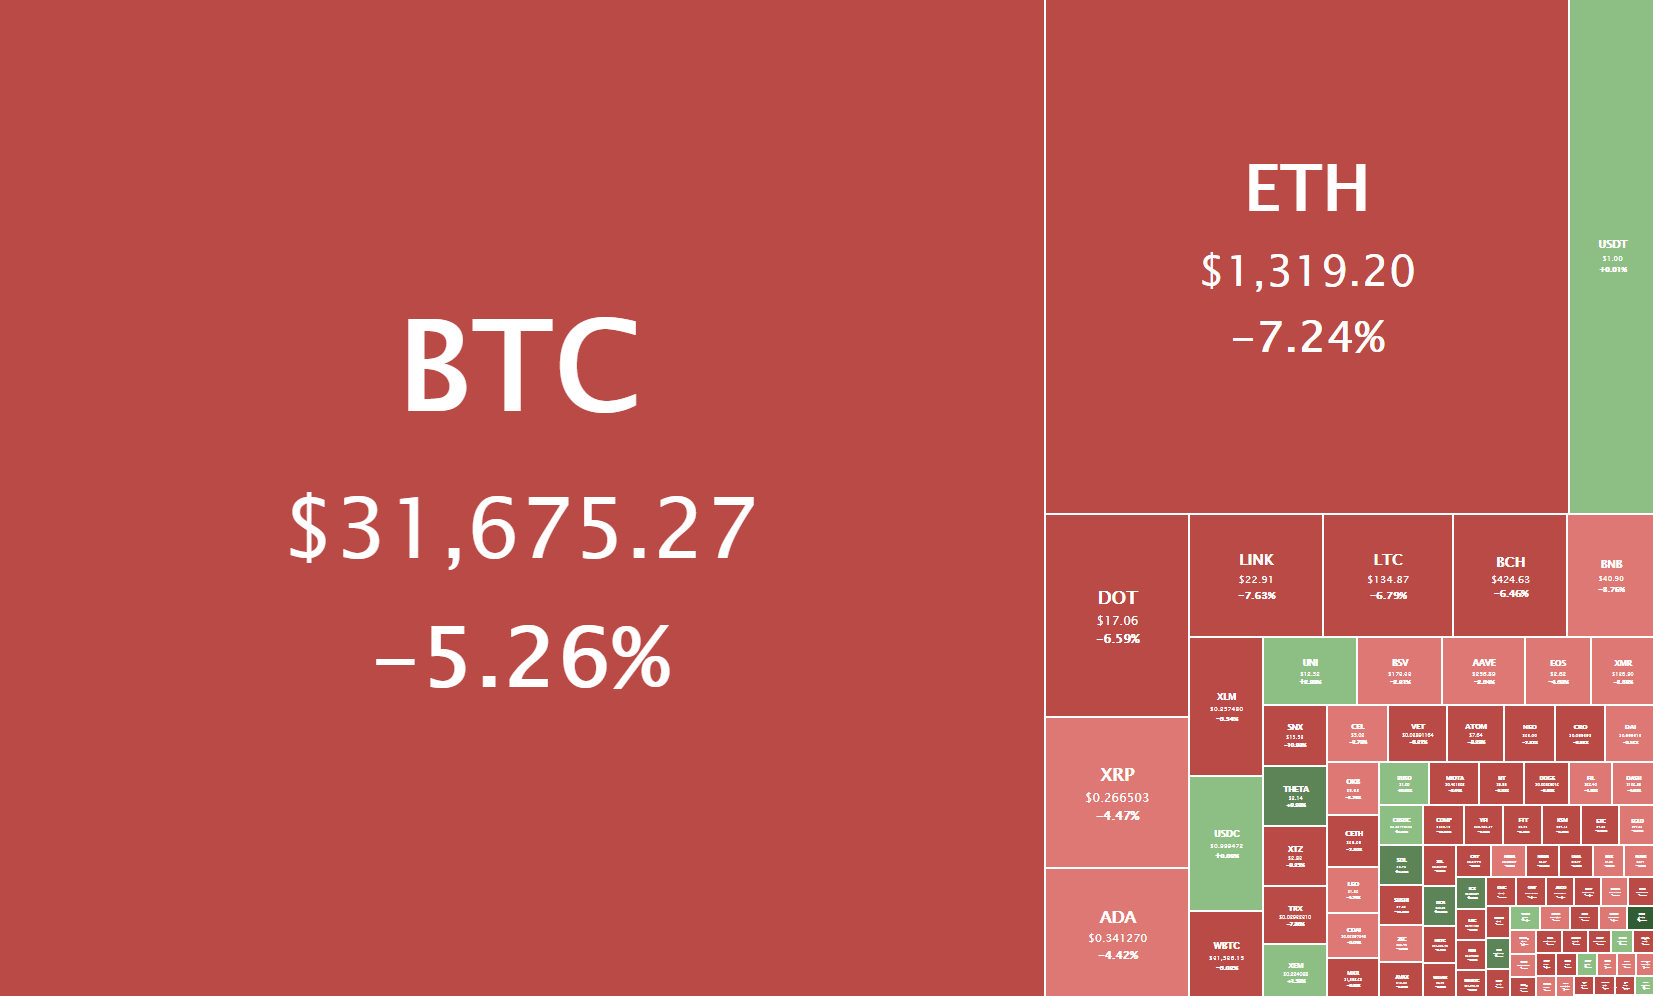
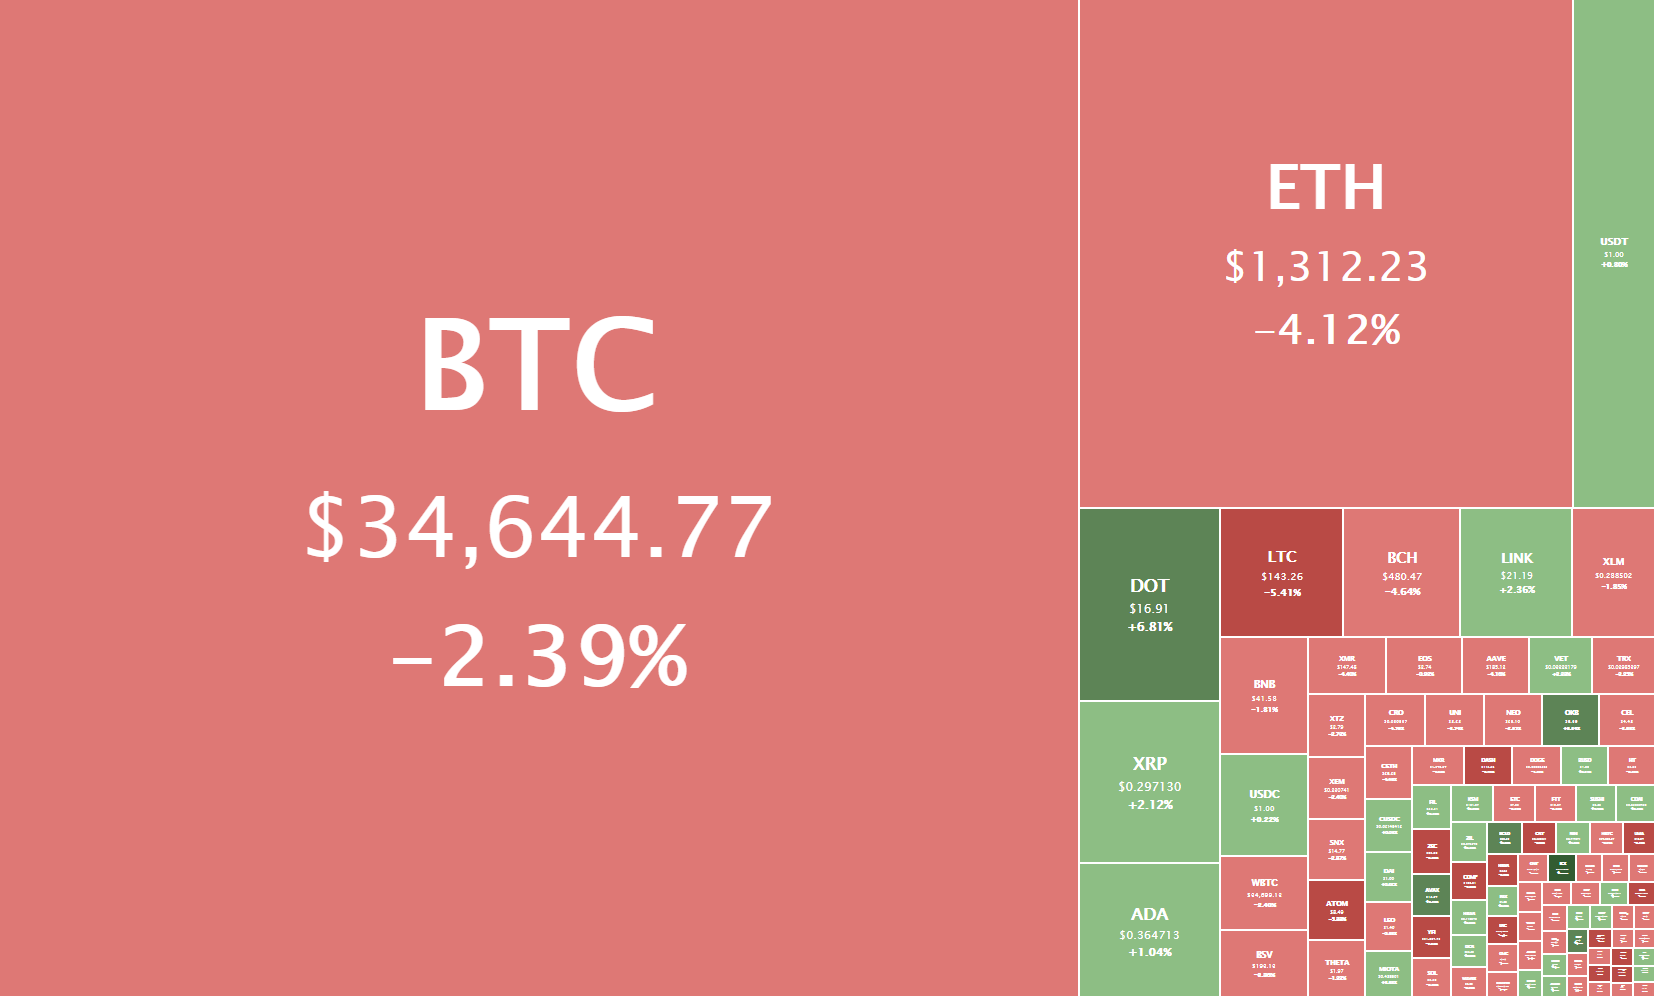
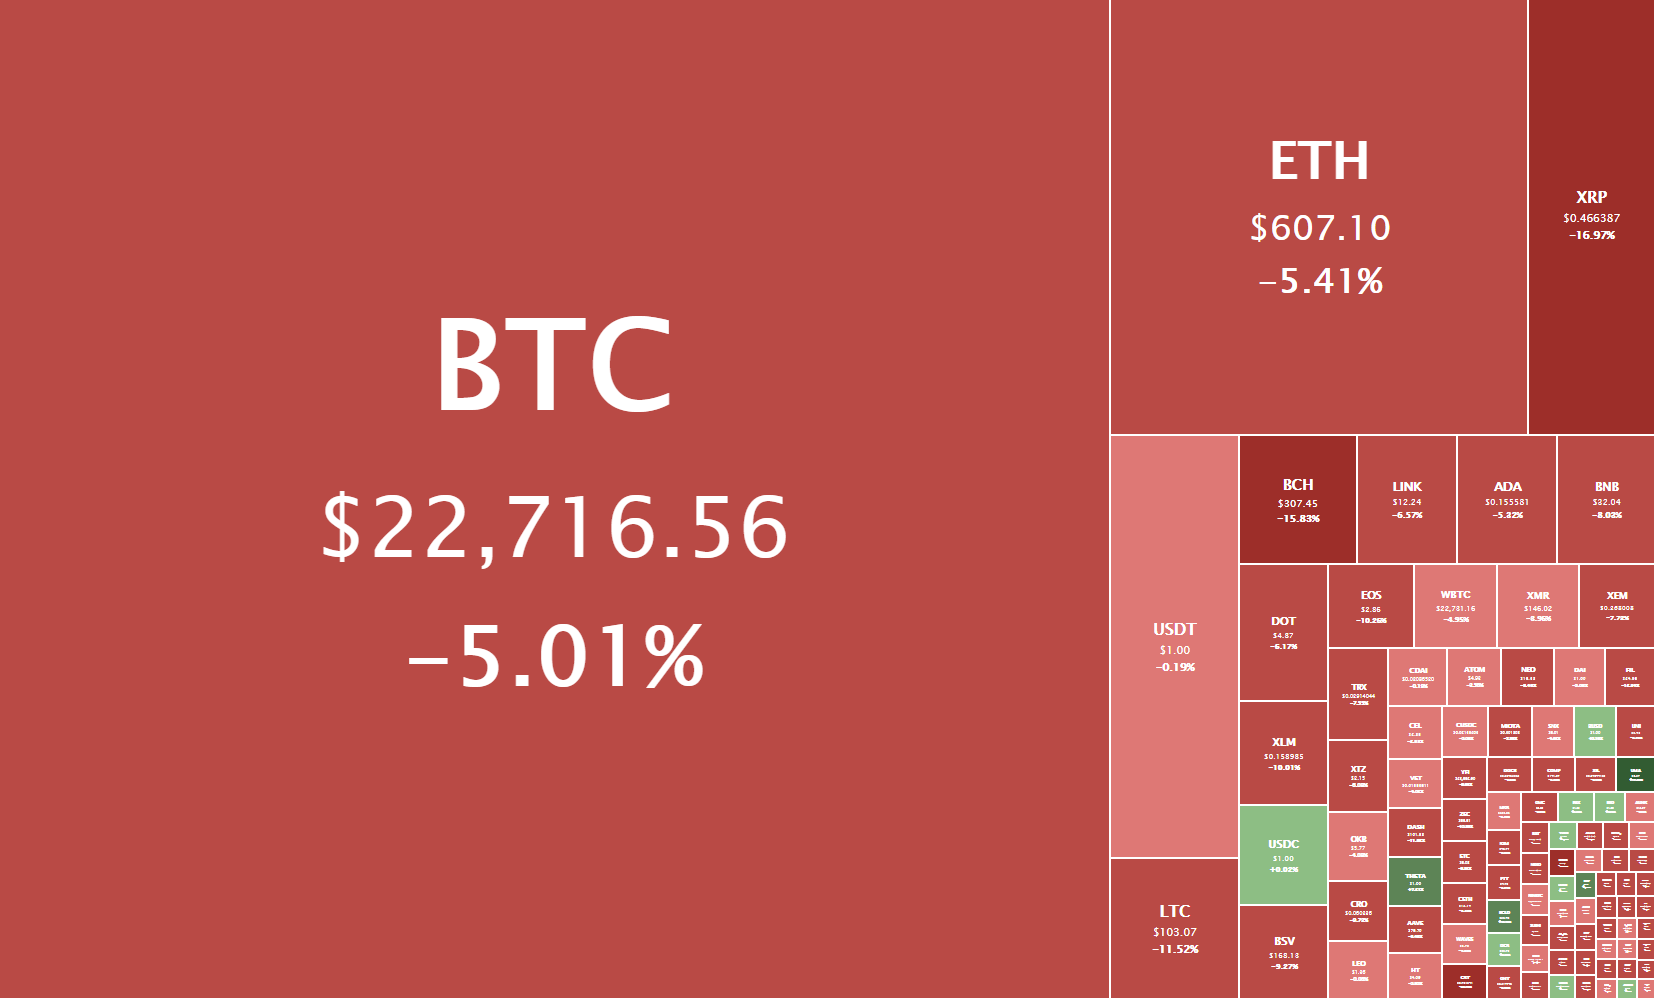
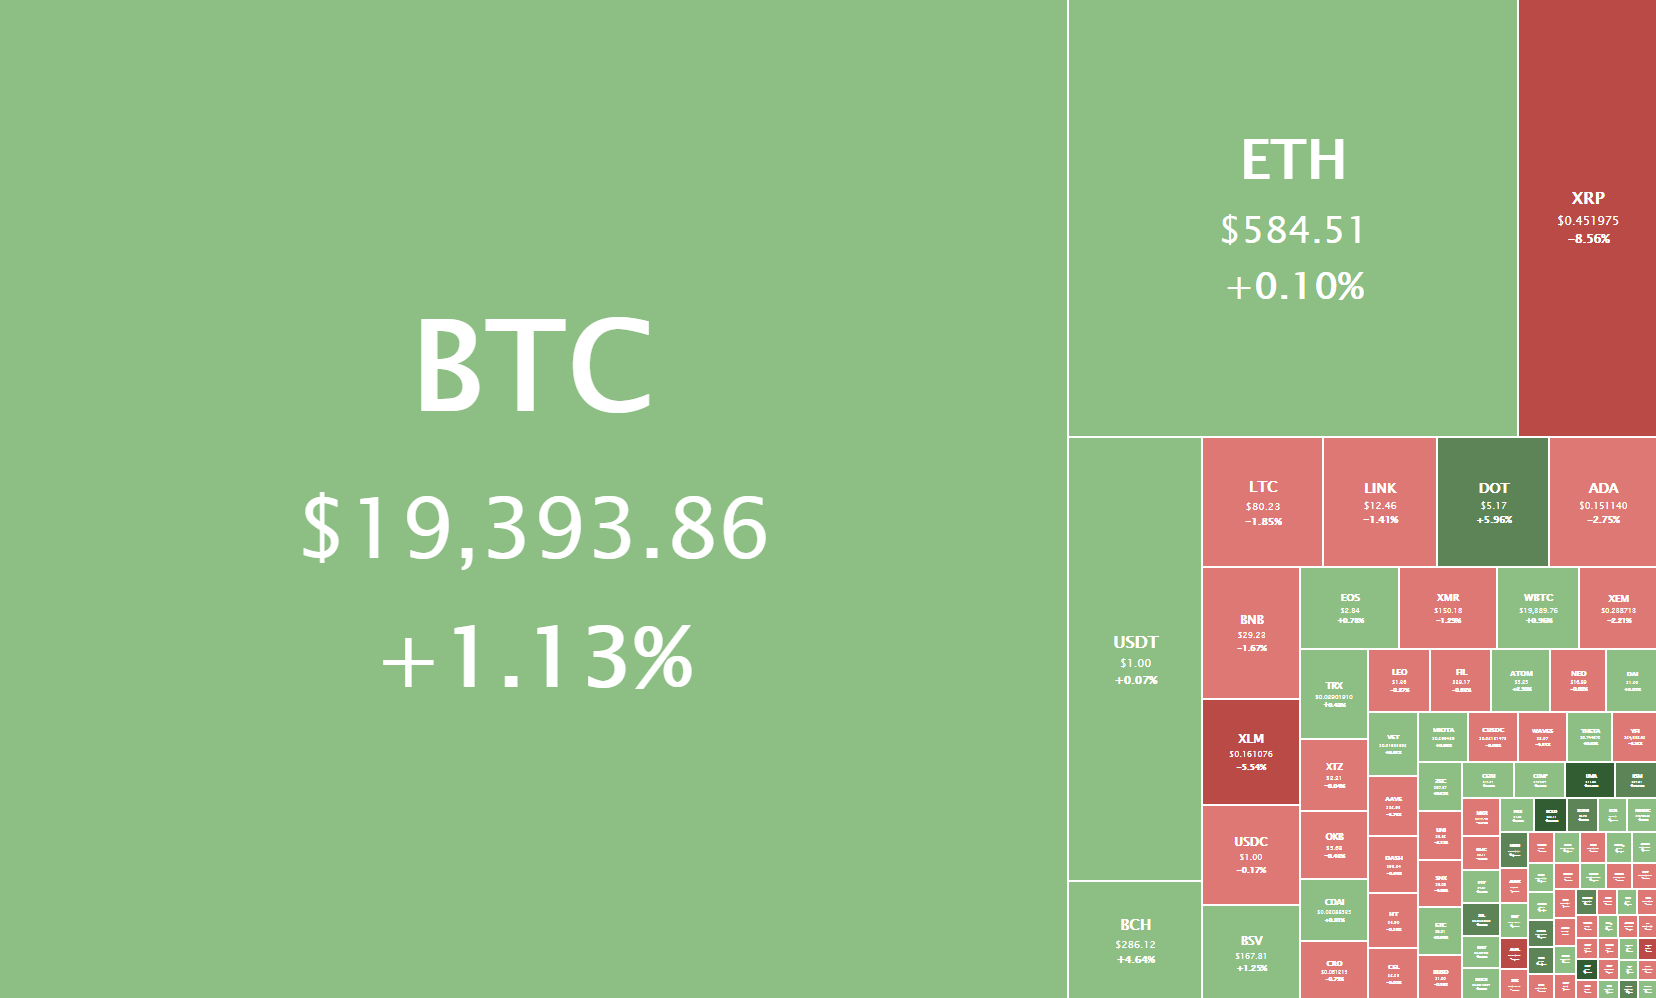
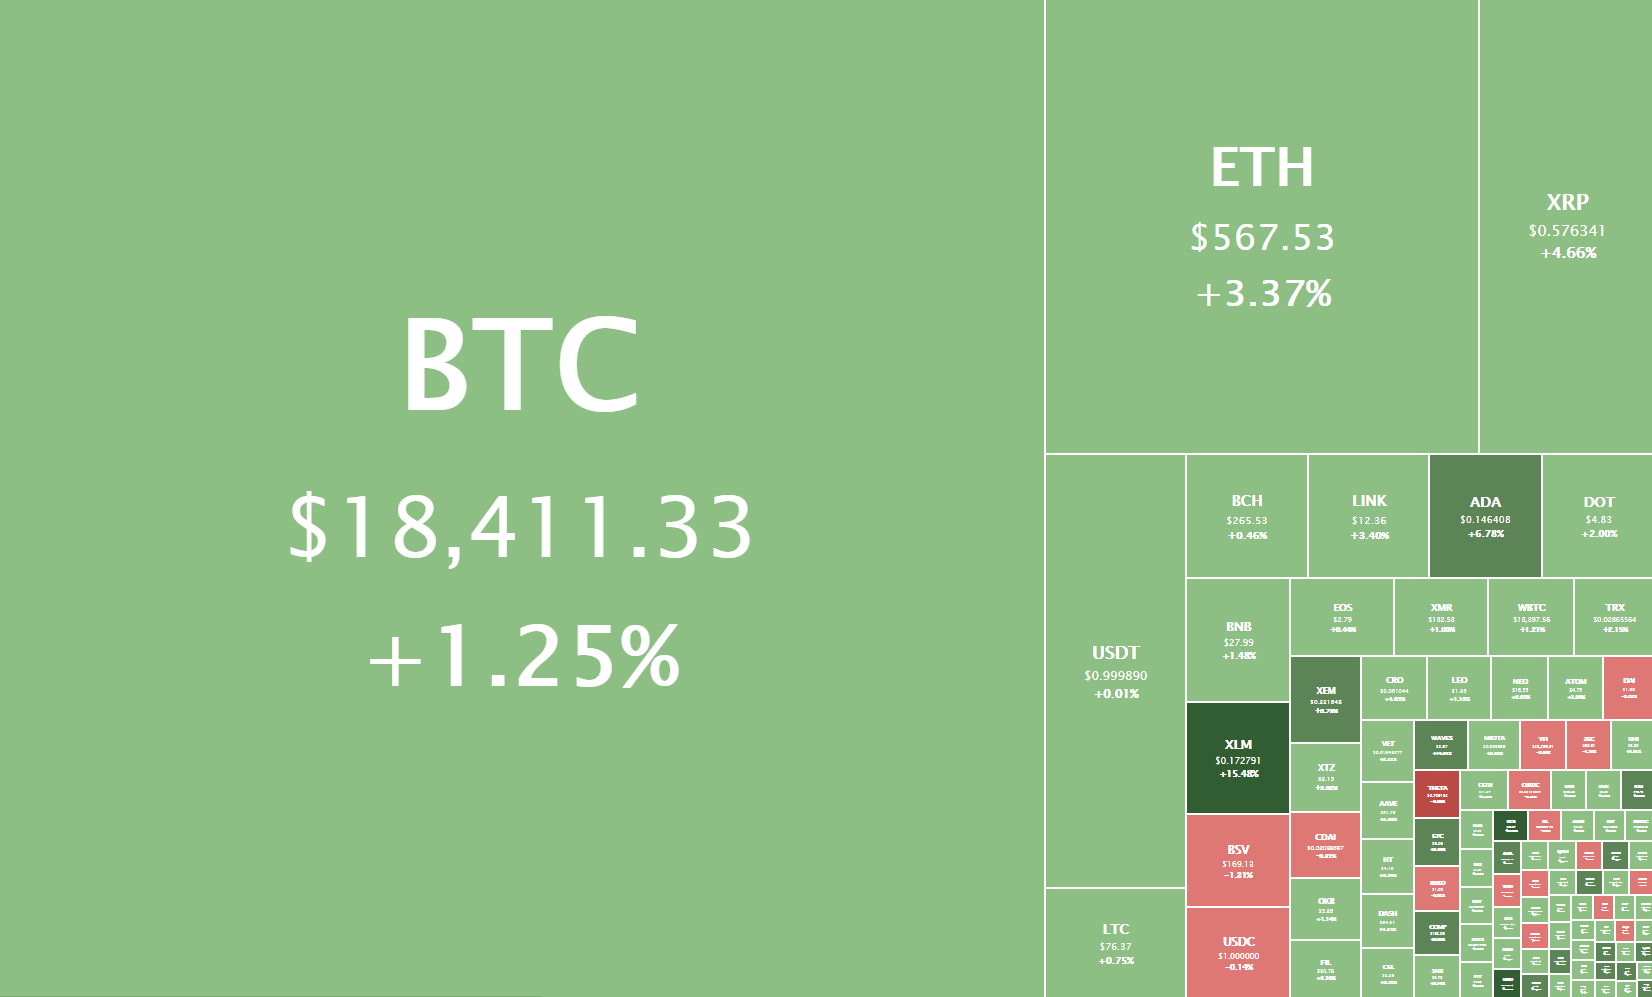
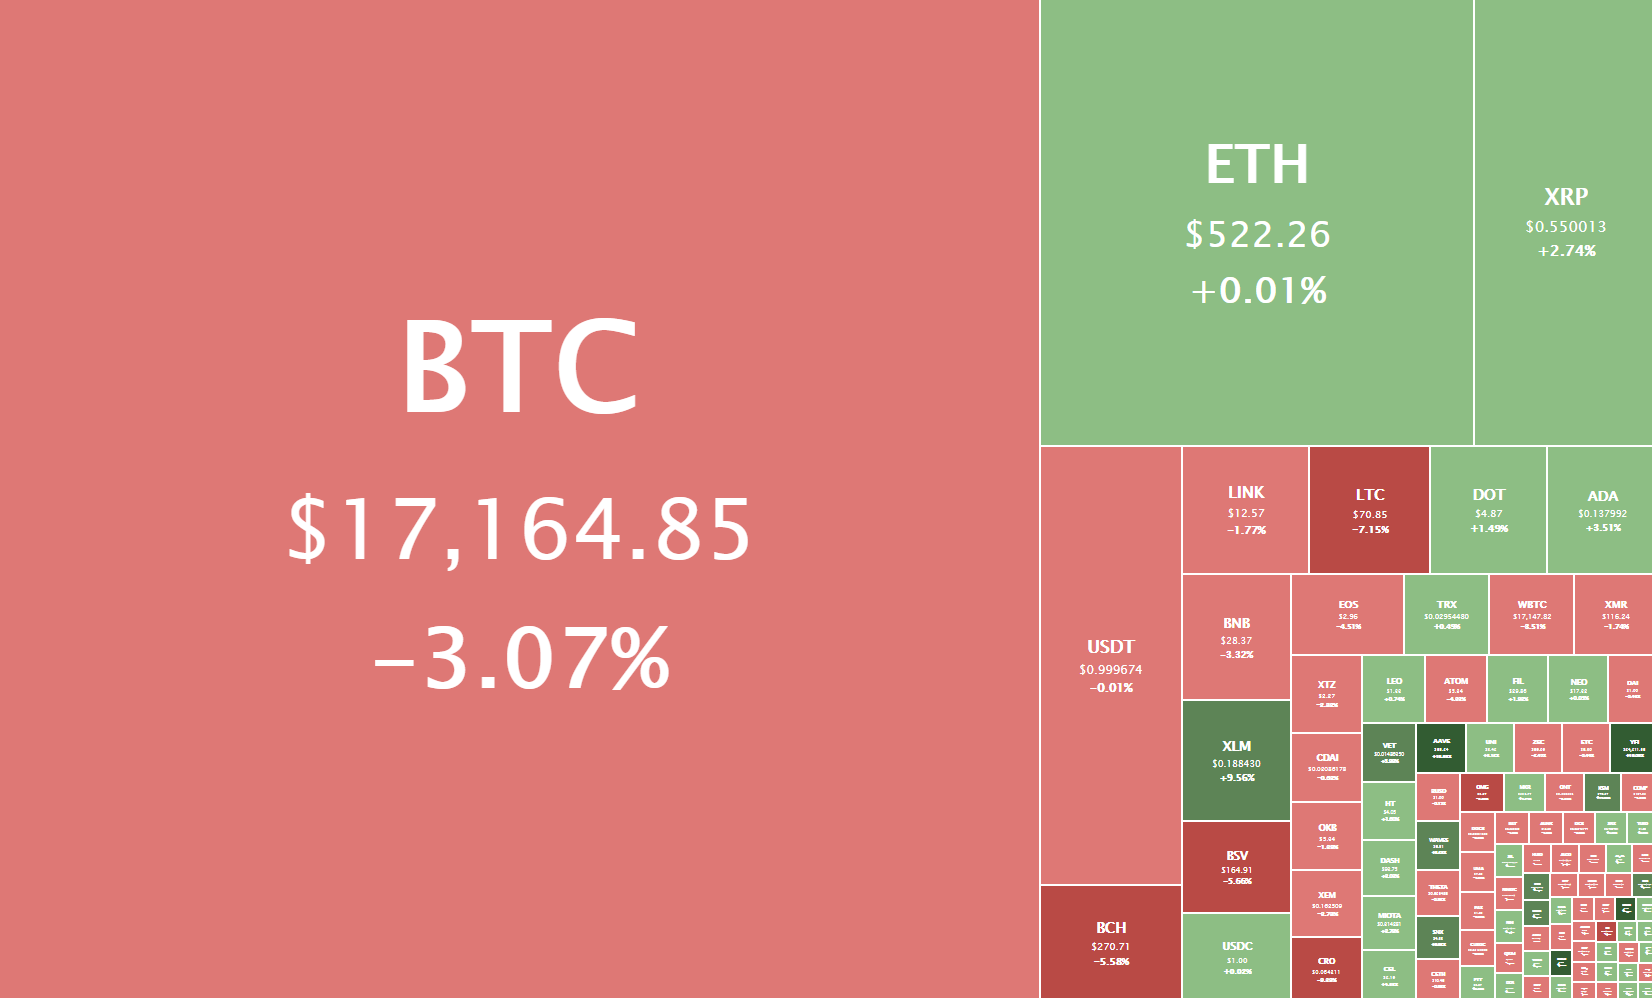
The crypto sector ended the day with most of the top cryptocurrencies in the green. Most analysts speculate that the recent wave of buyers came as a result of Dogecoin’s incredible pump, which was caused by the notorious r/WallStreetBets subreddit. Bitcoin is currently trading for $32,964, representing an increase of 5.26% compared to yesterday’s value. Meanwhile, Ethereum’s price has increased by 1.41% on the day, while Litecoin gained 5.11% of its value.
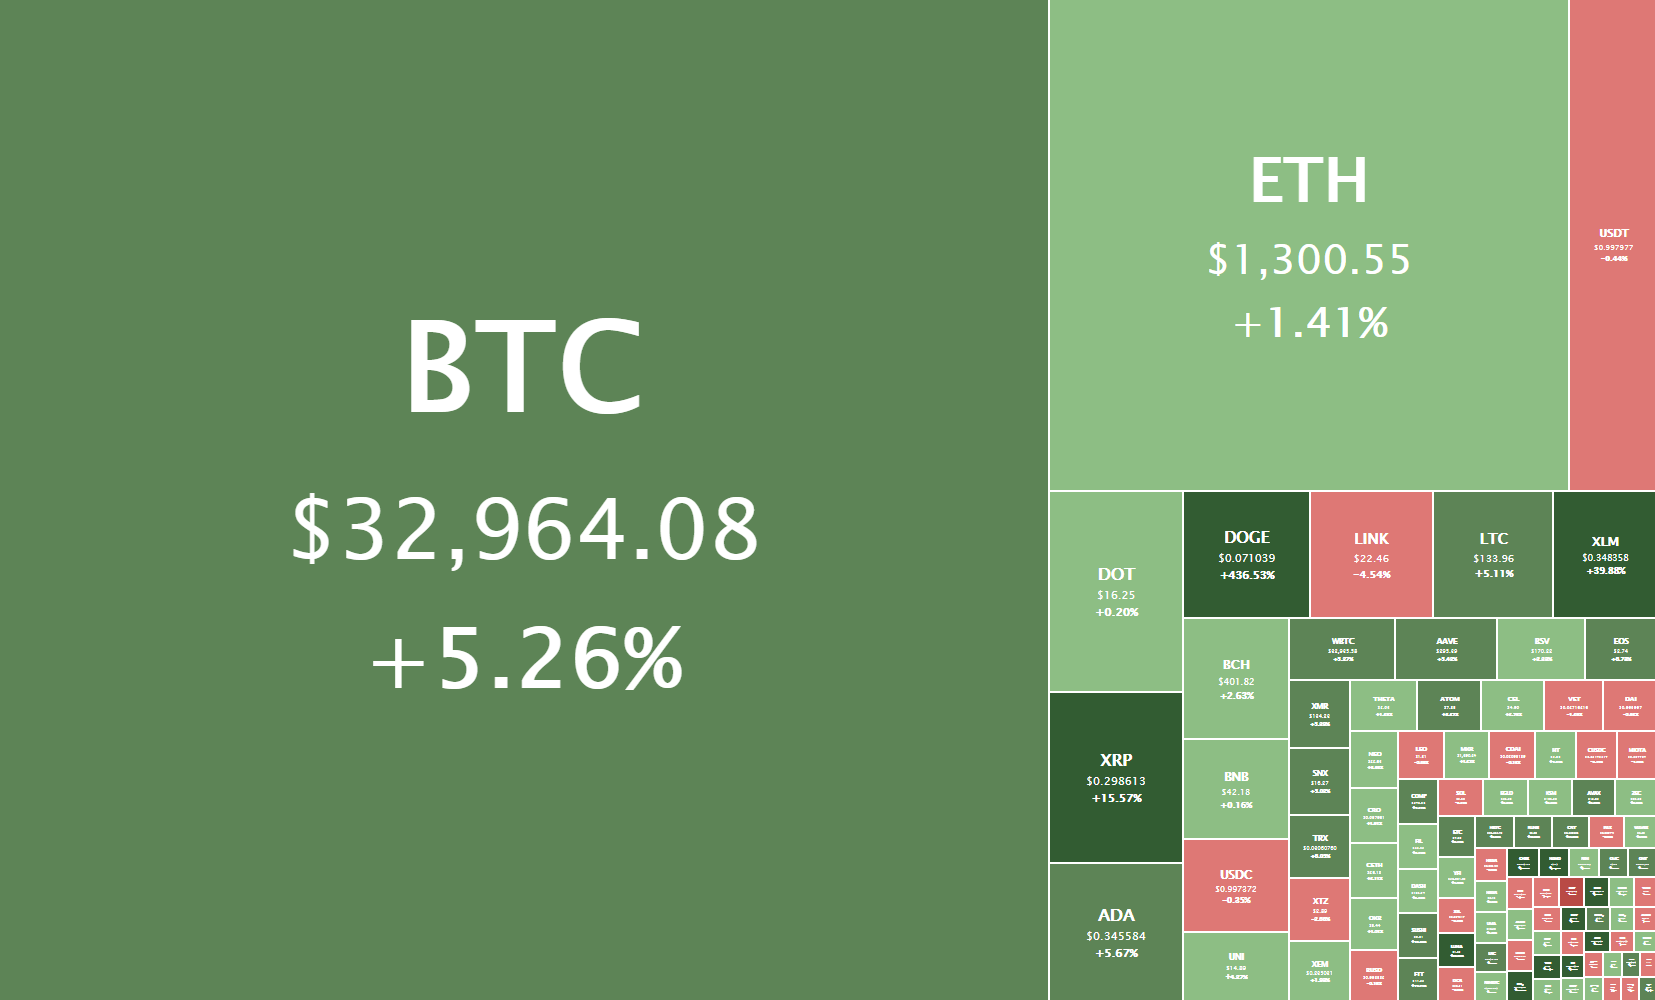
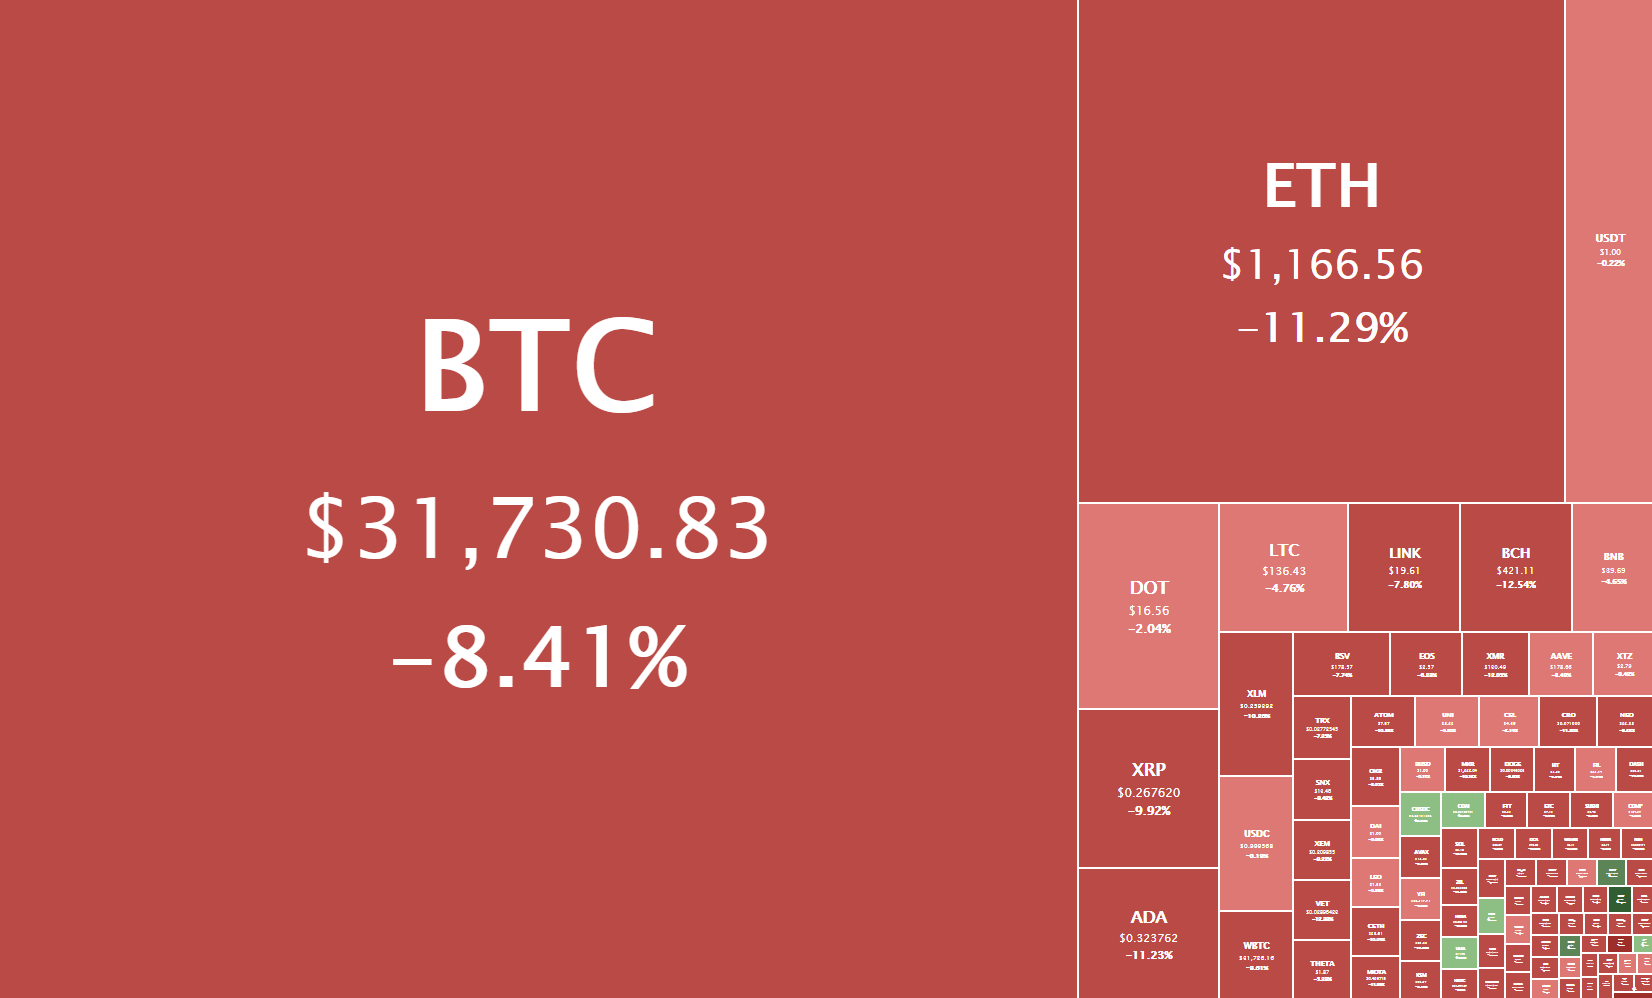
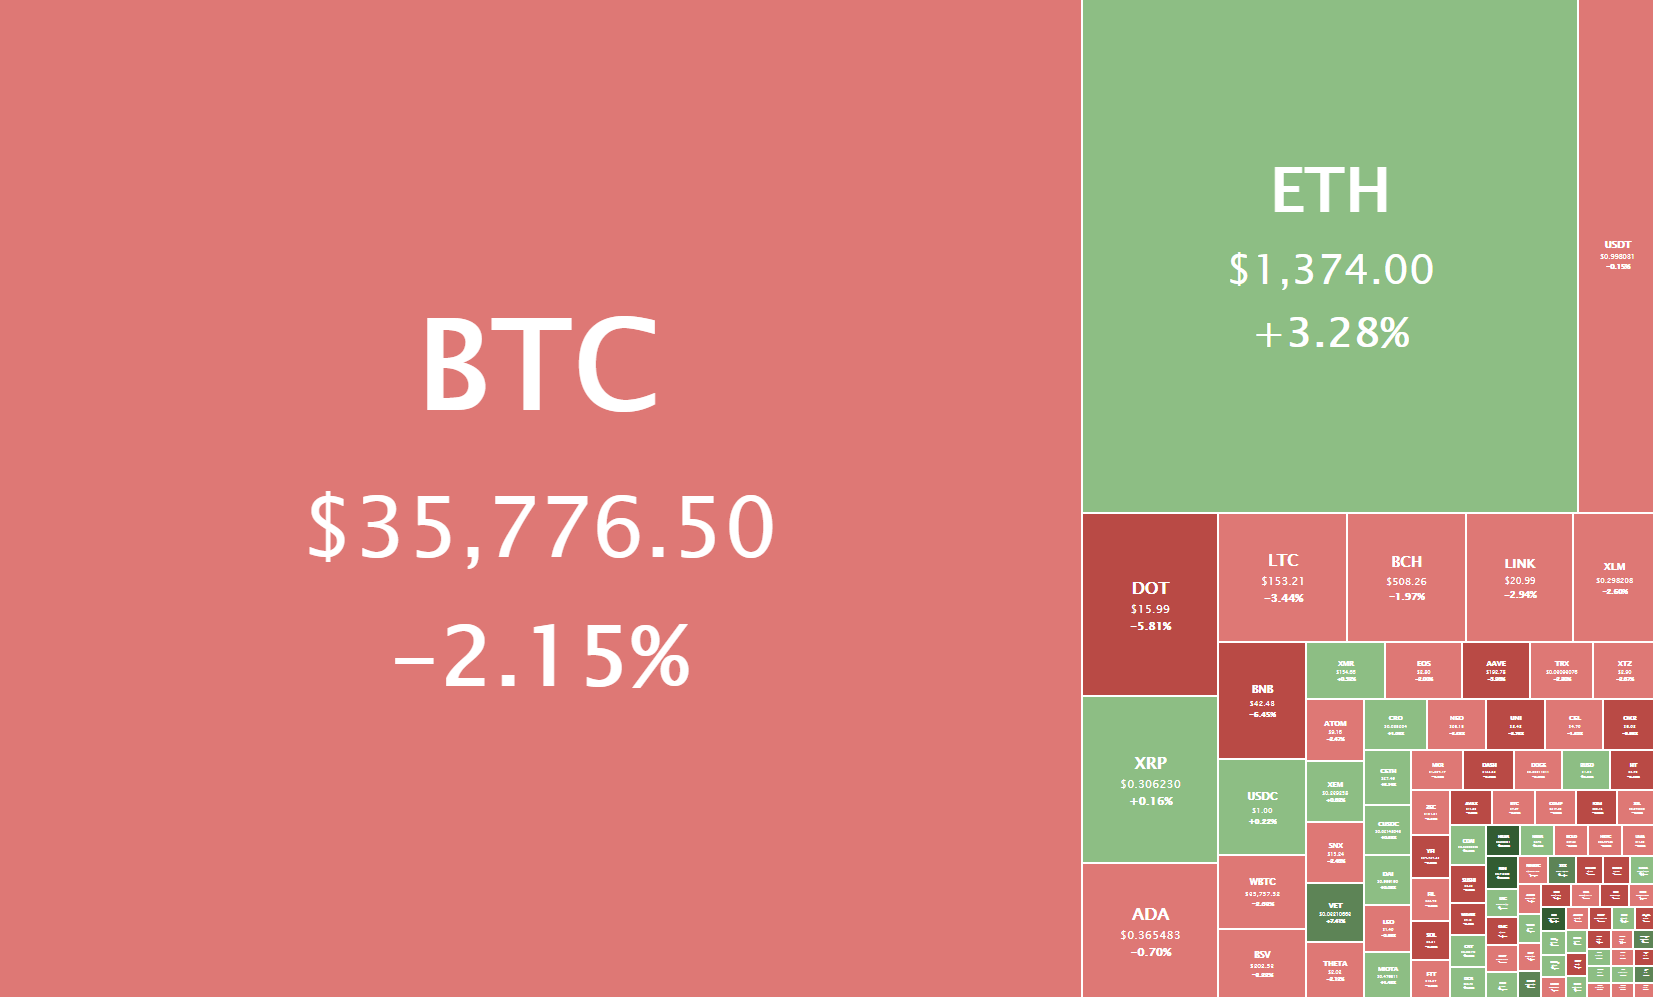
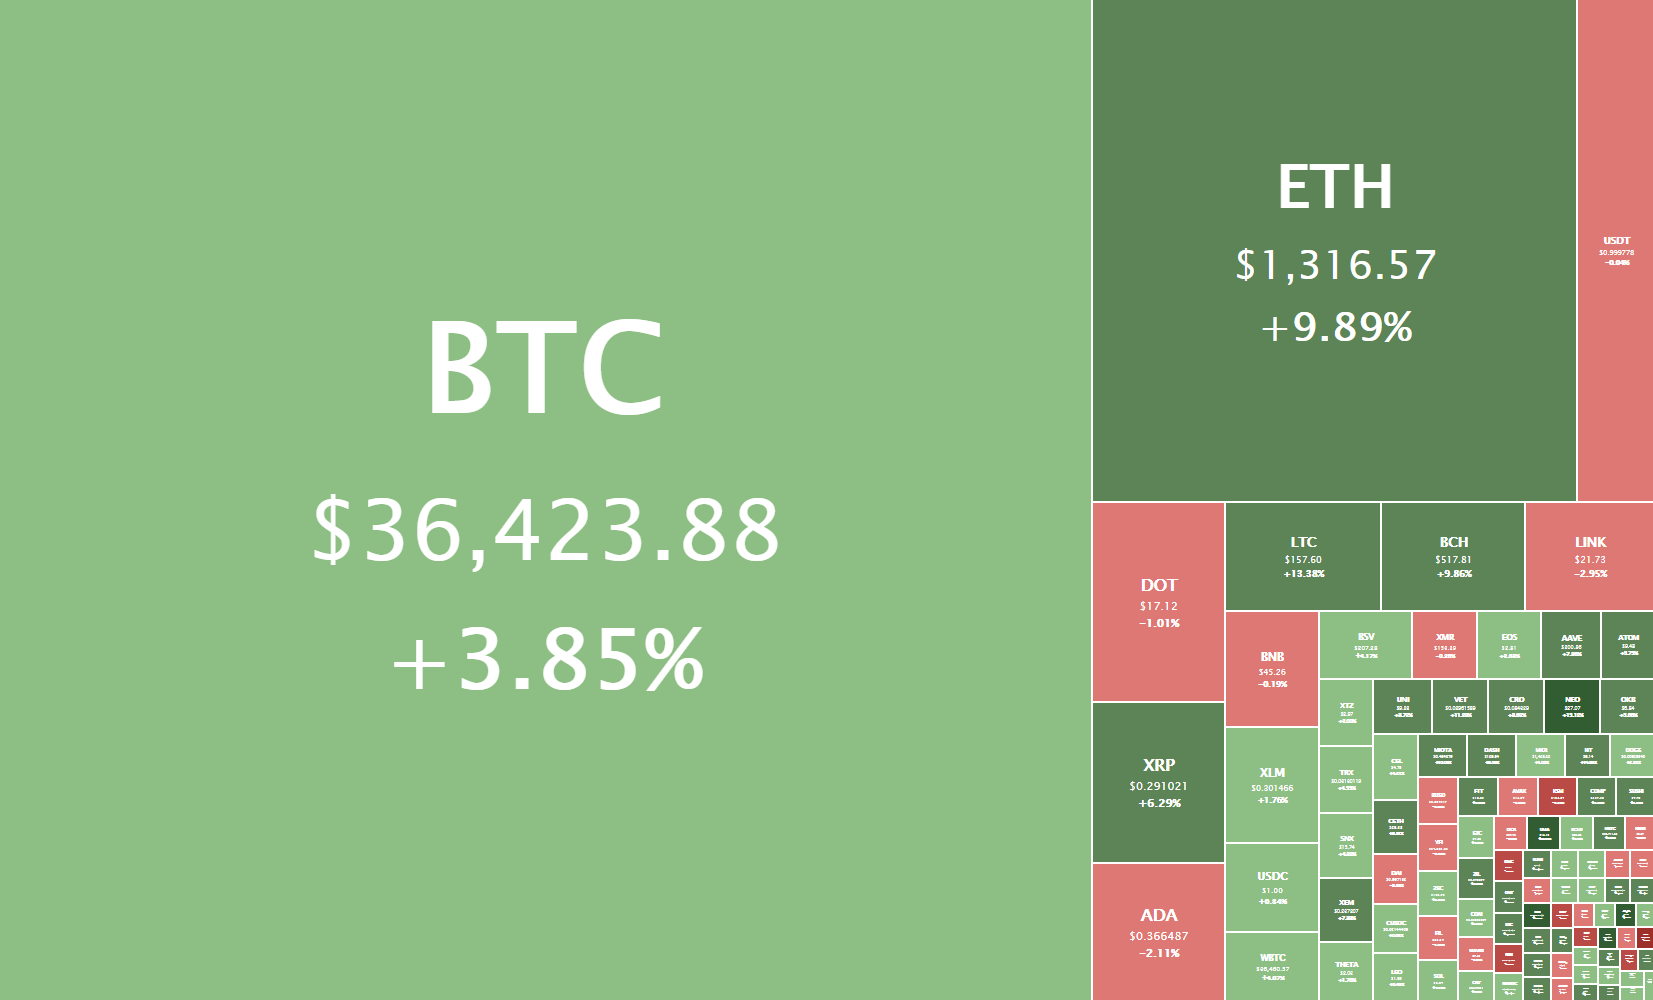
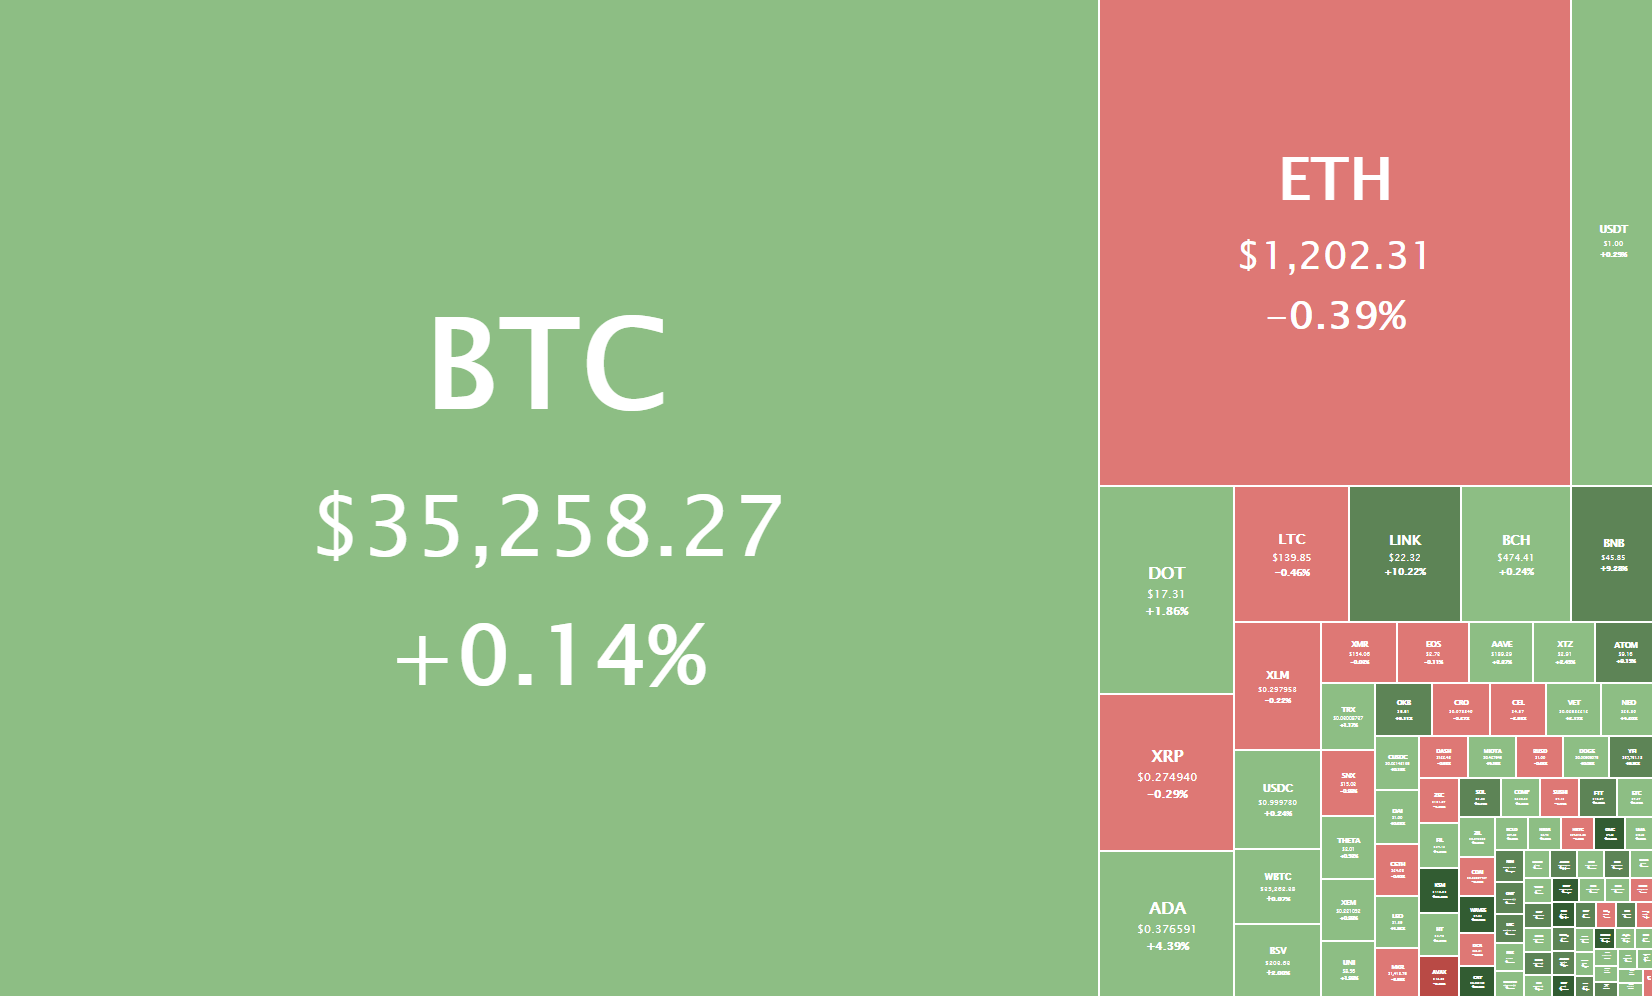
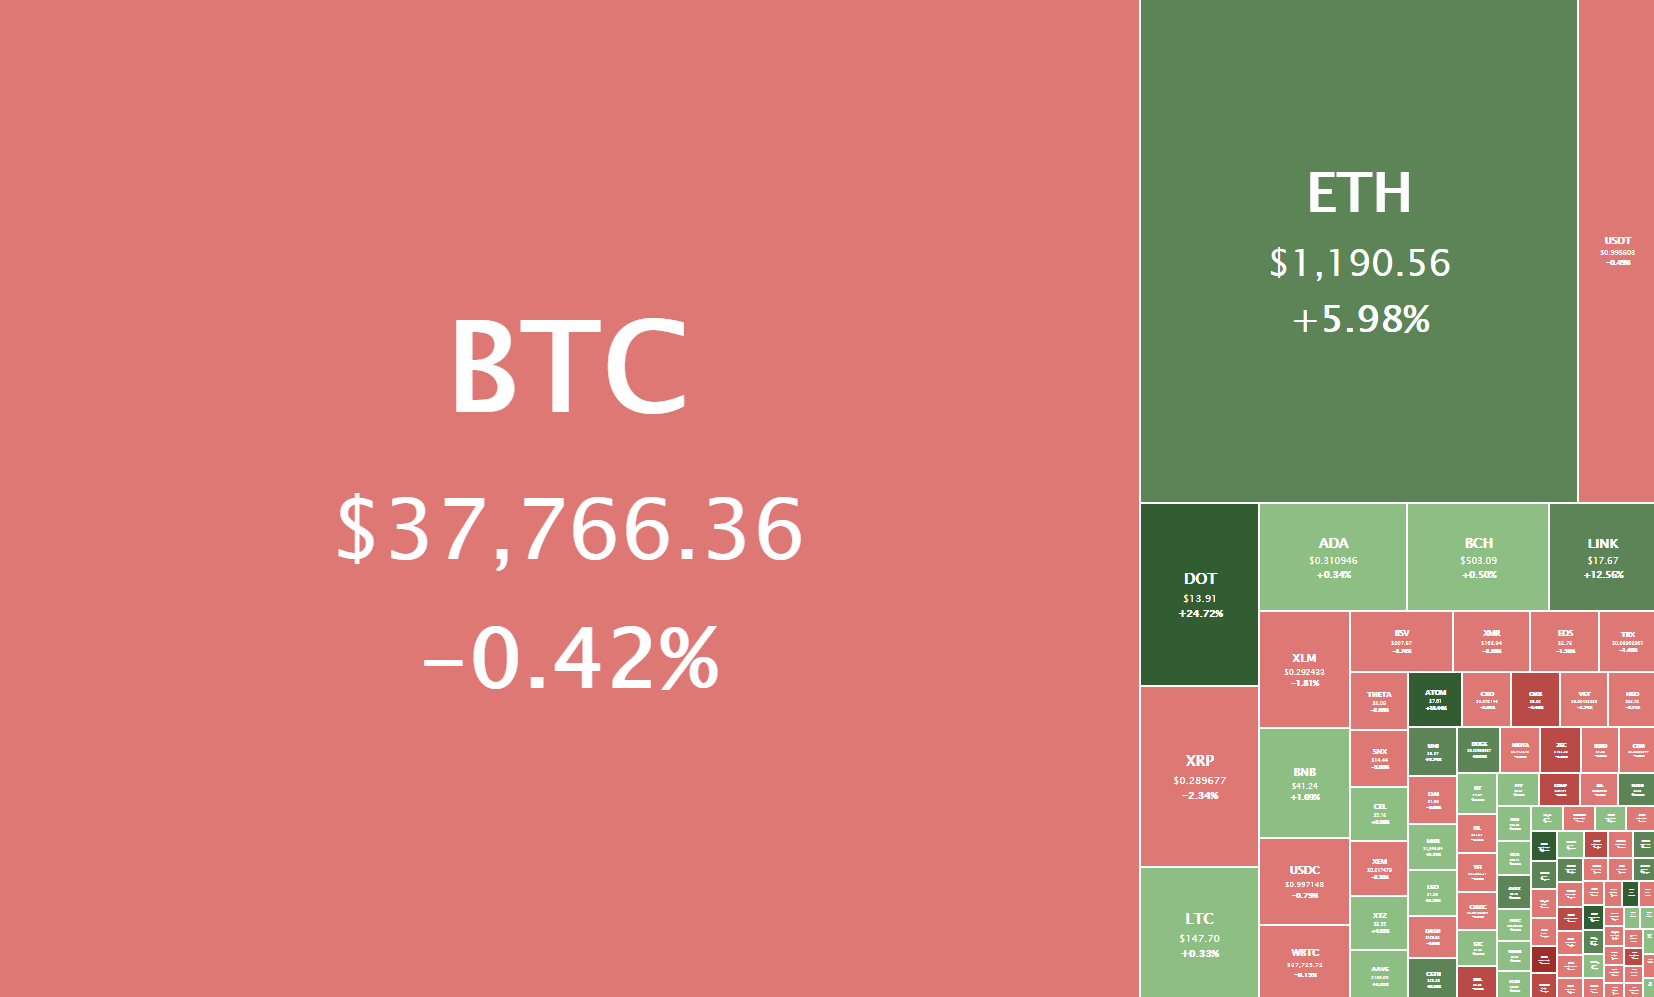
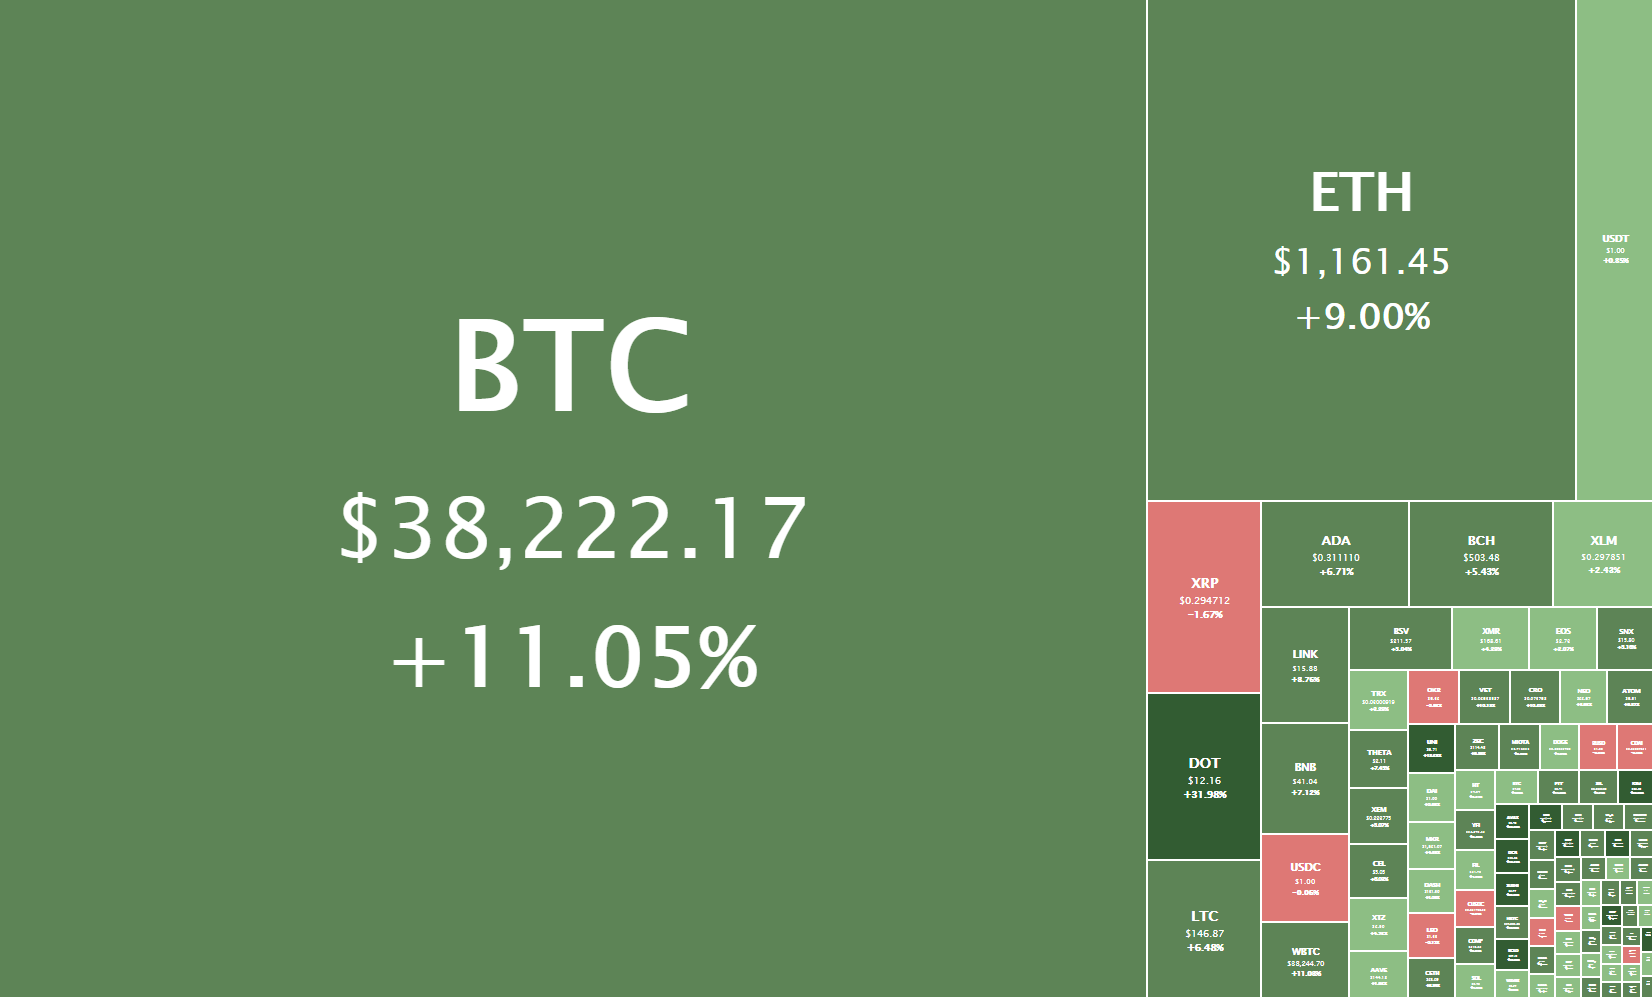
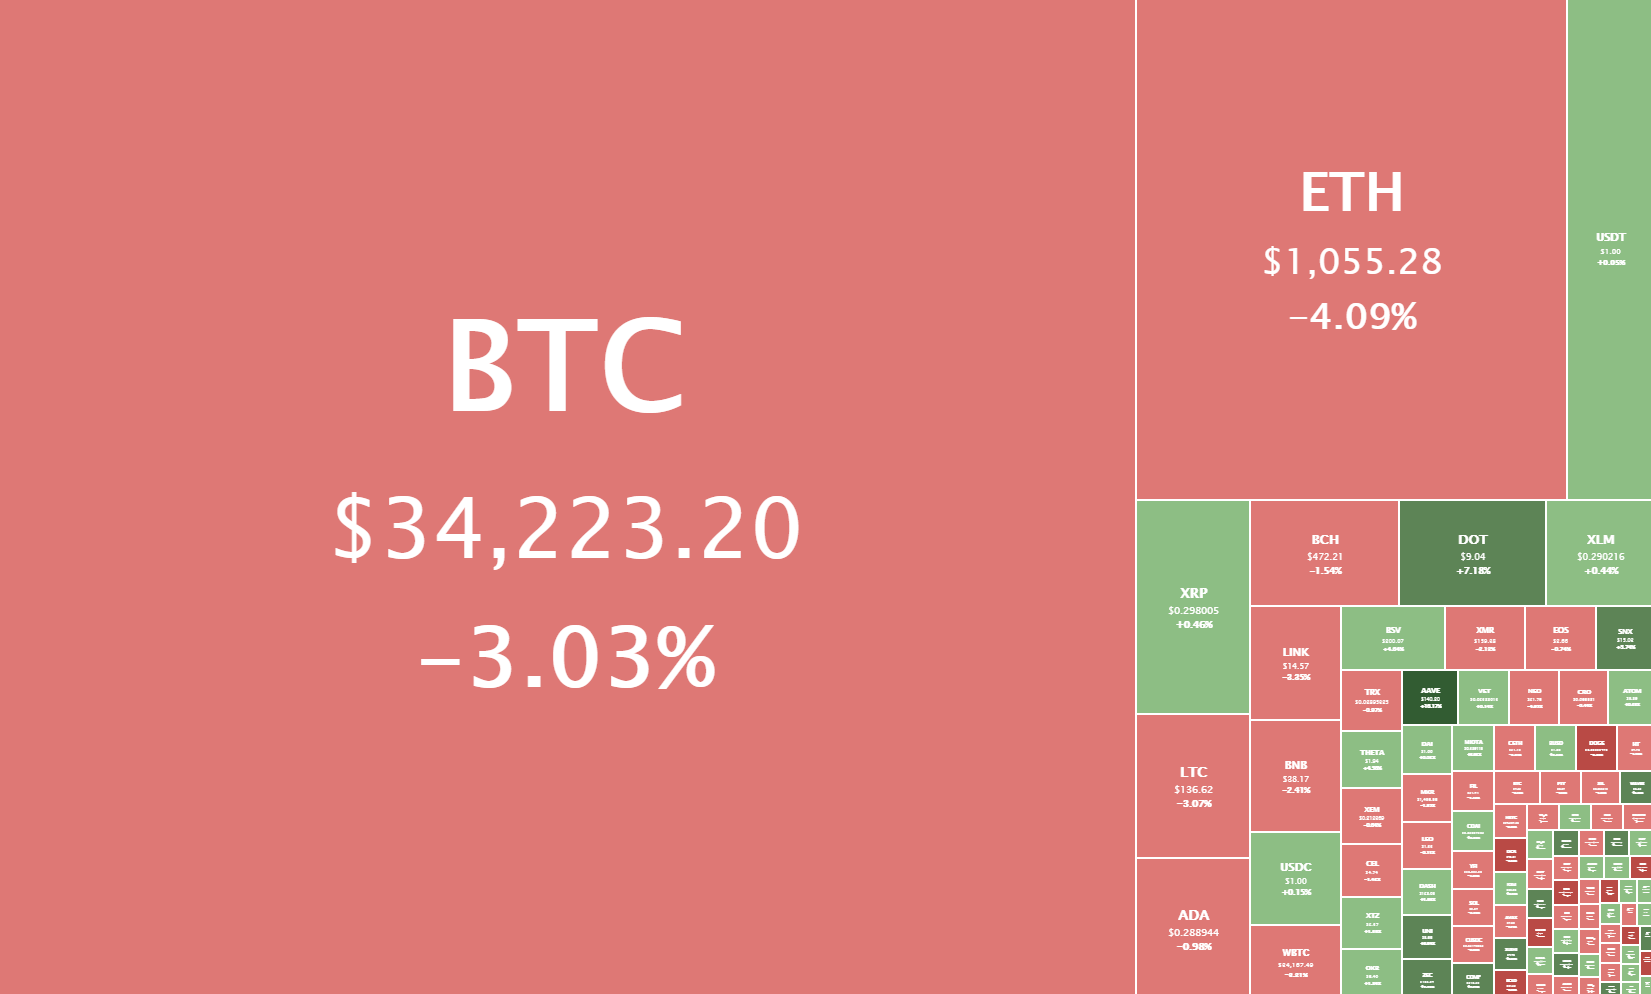
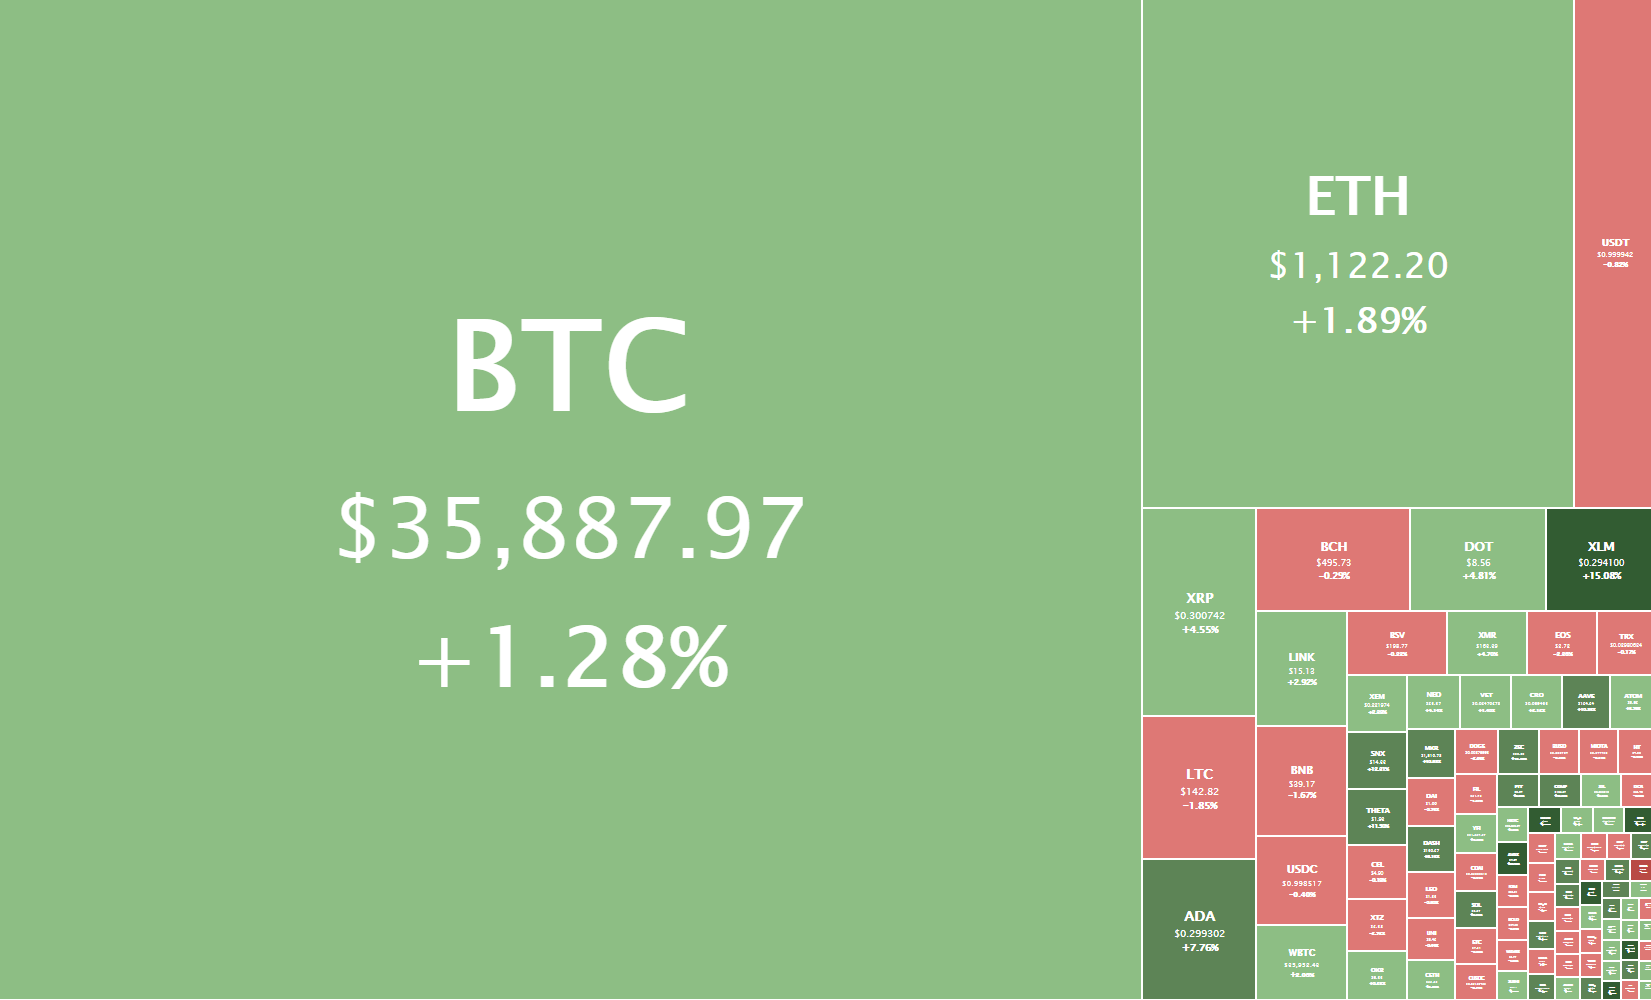
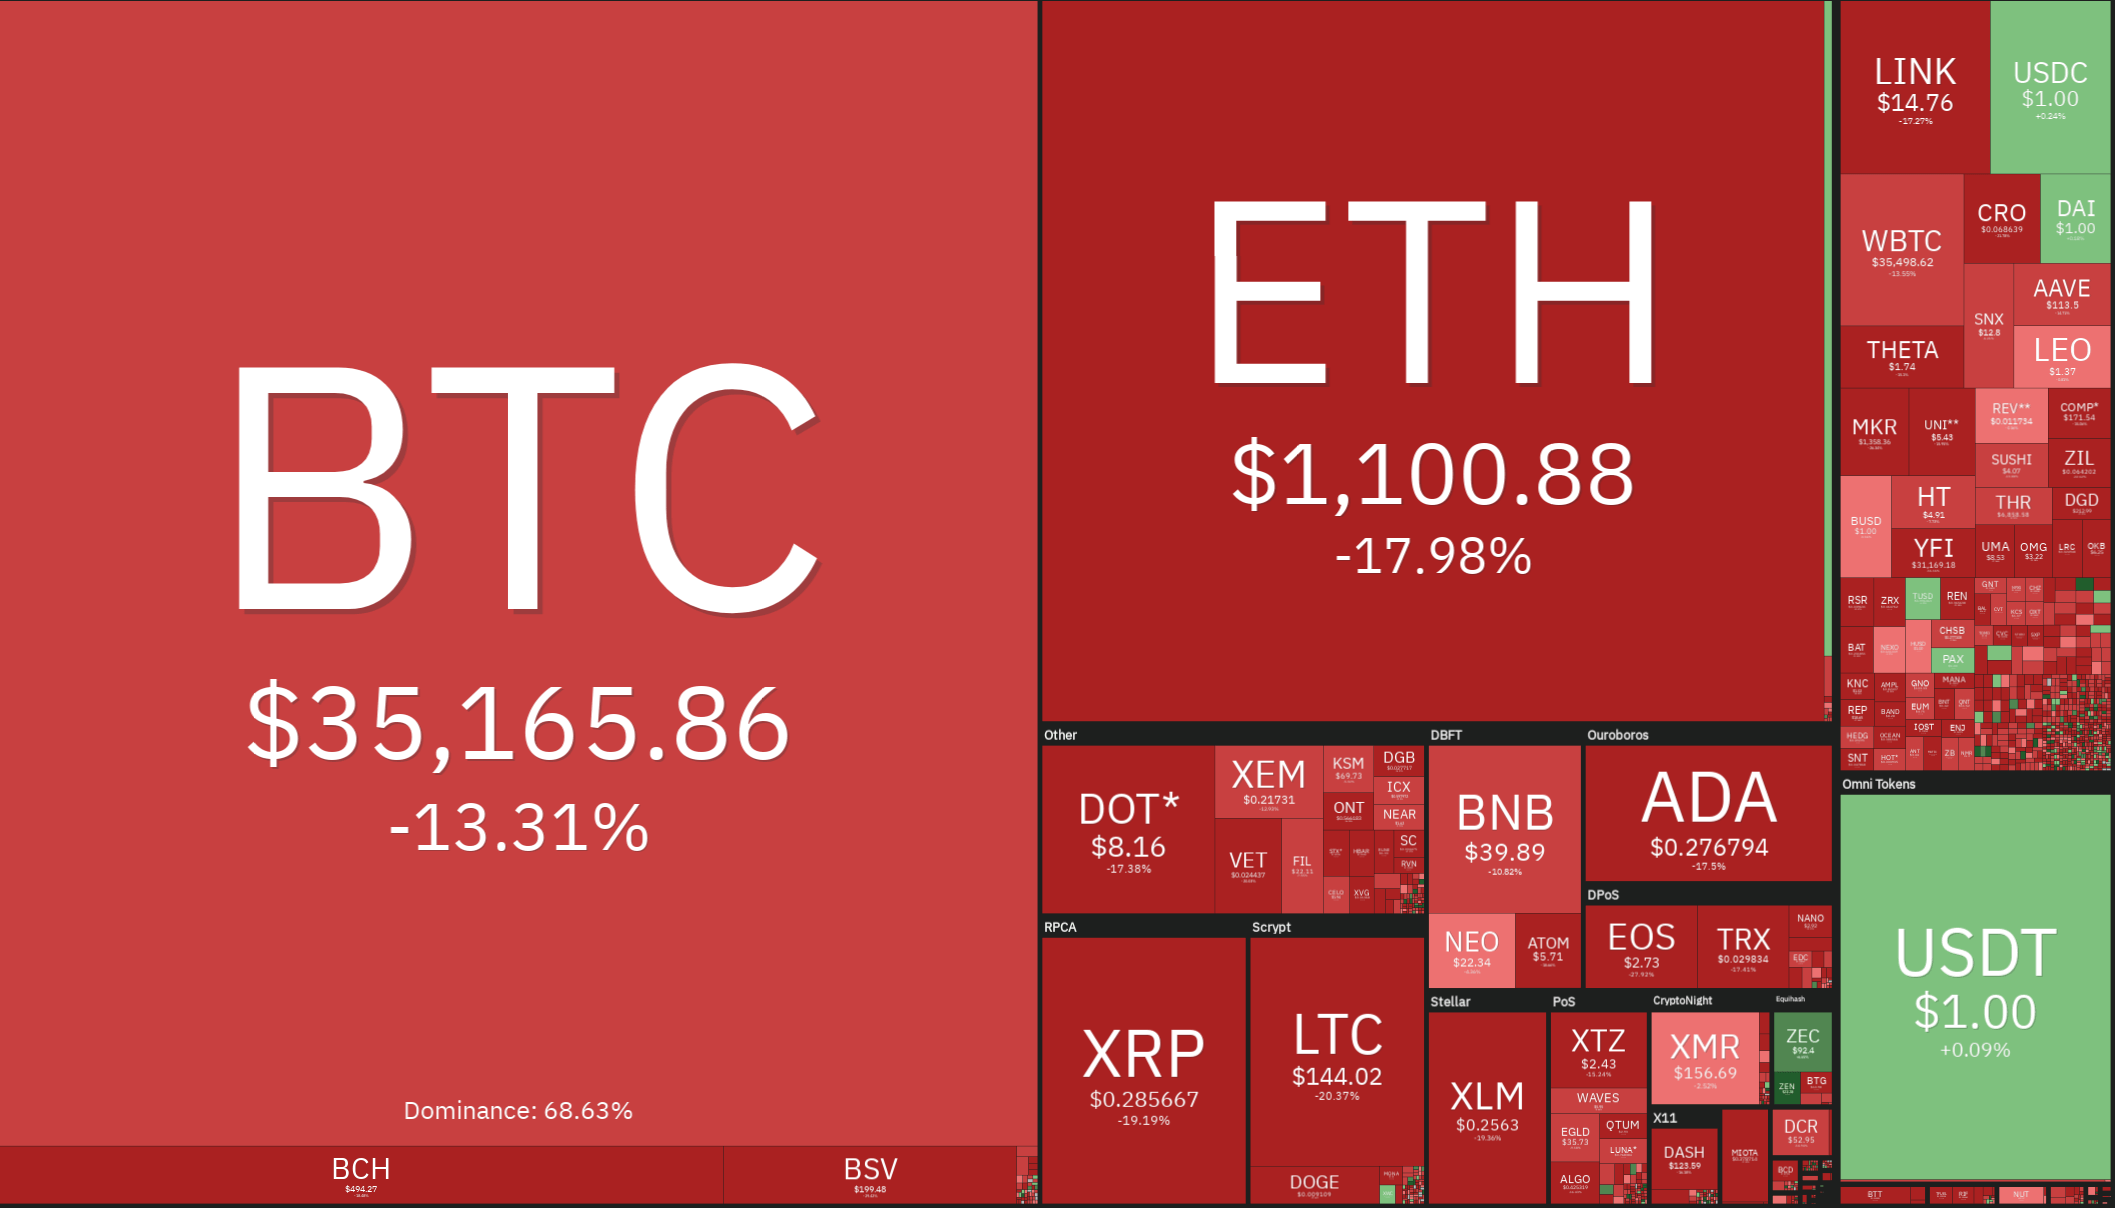
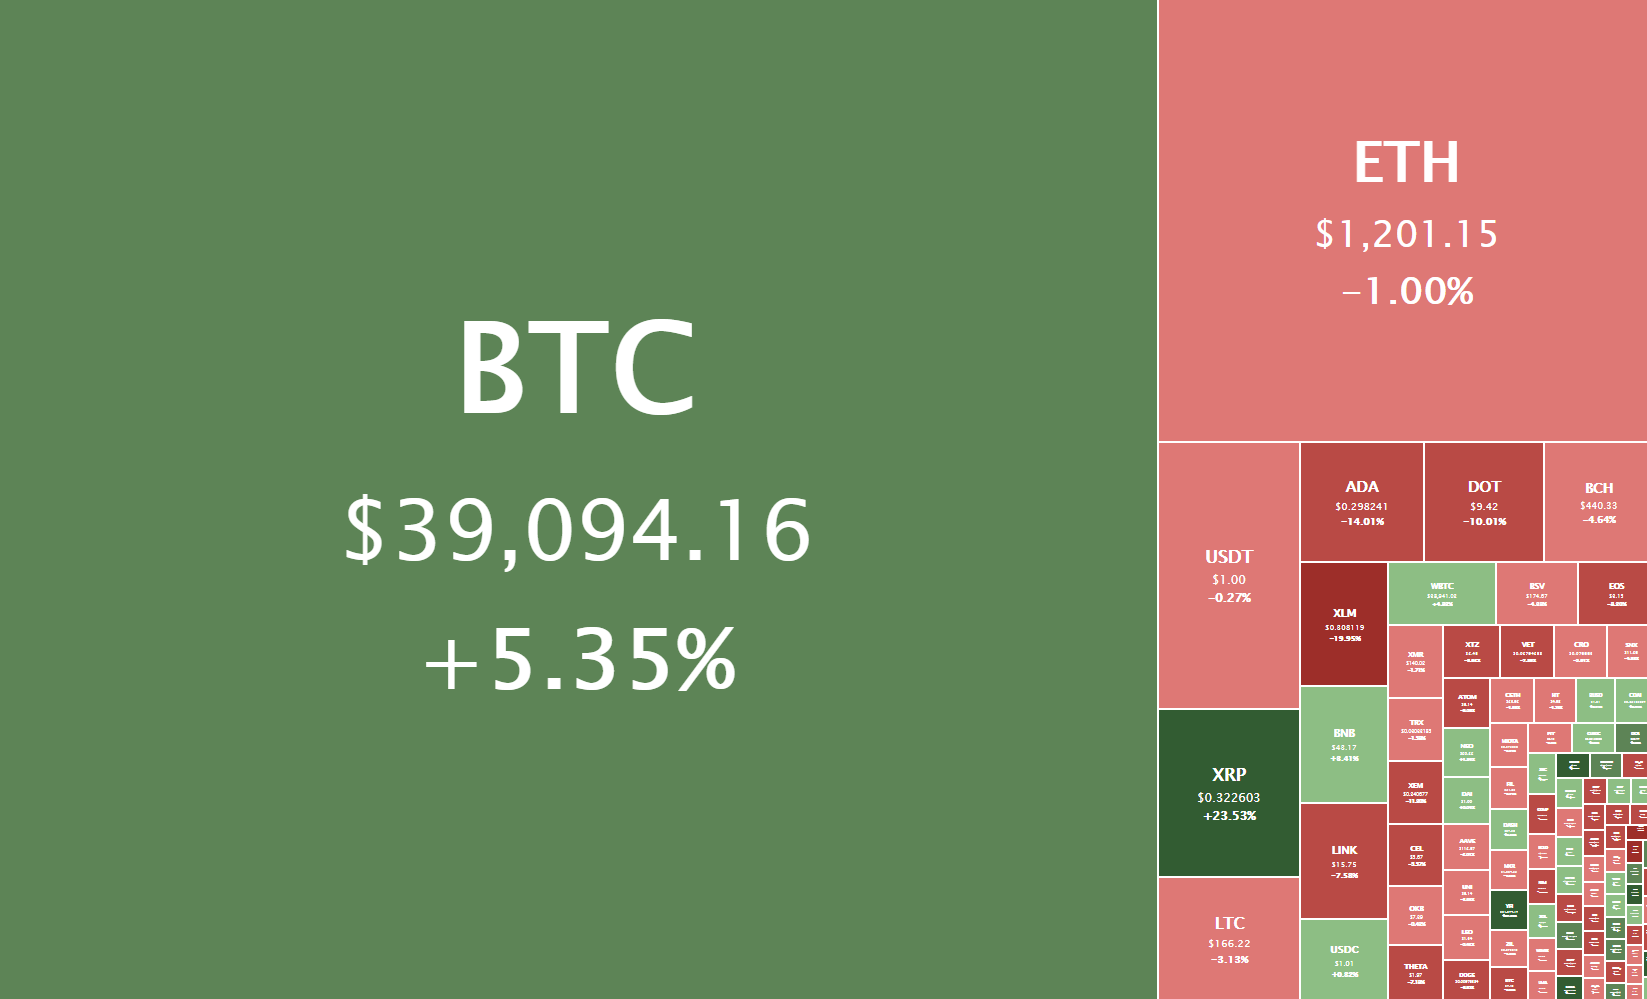
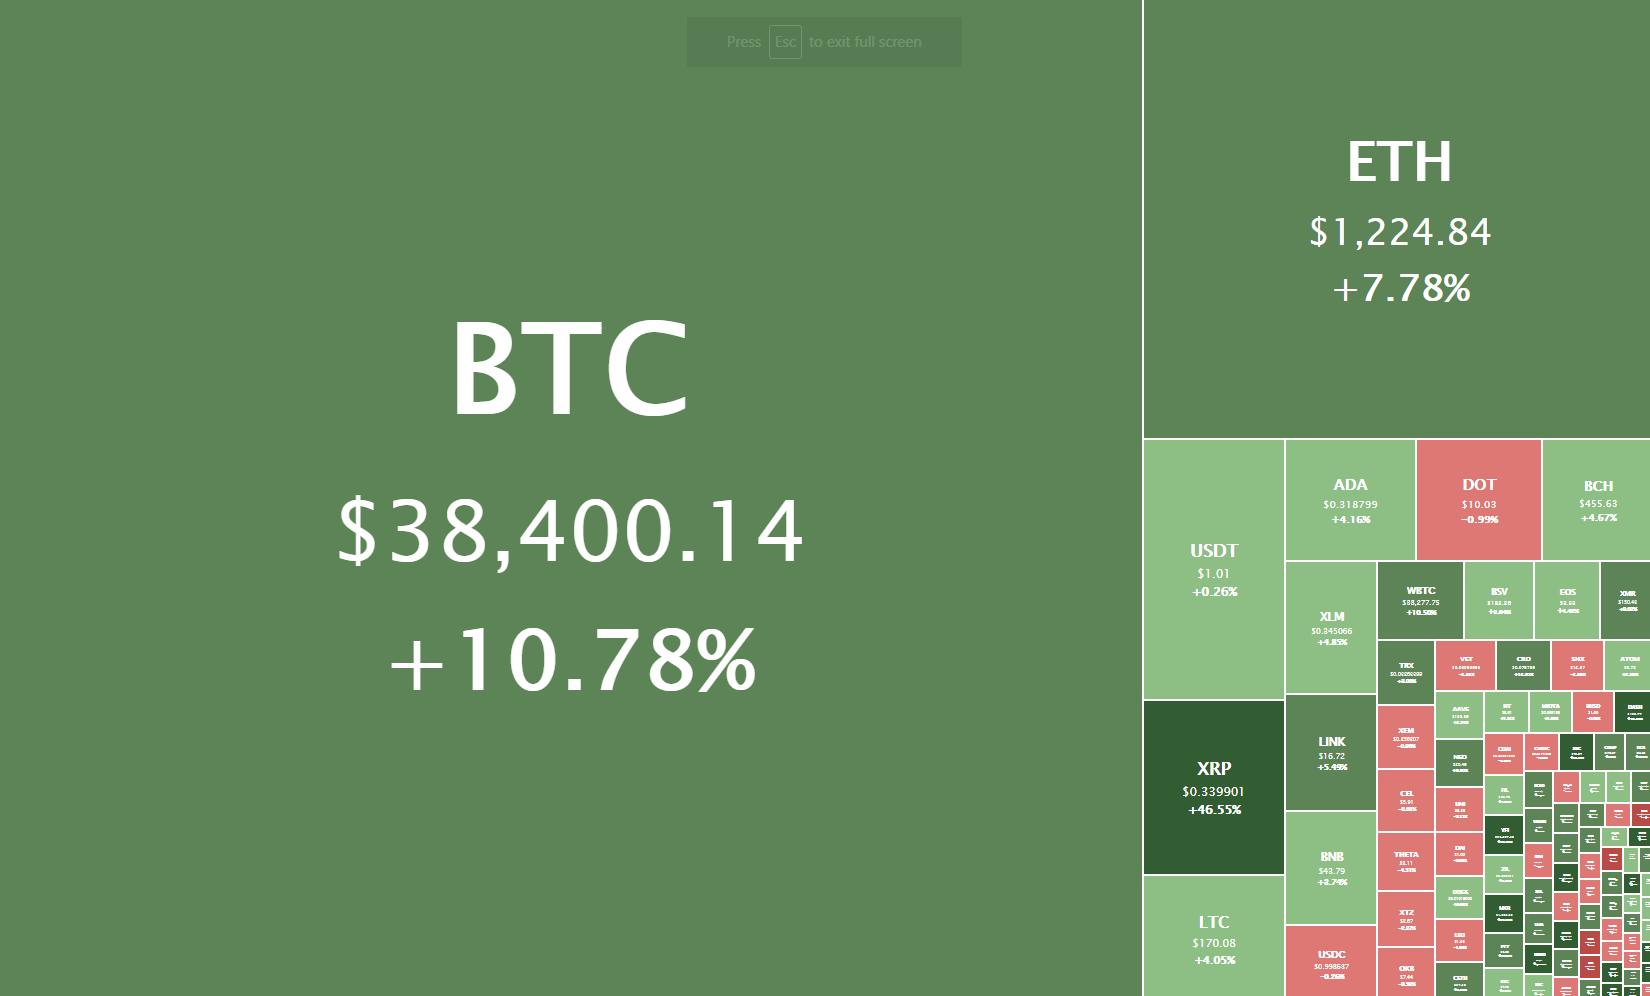
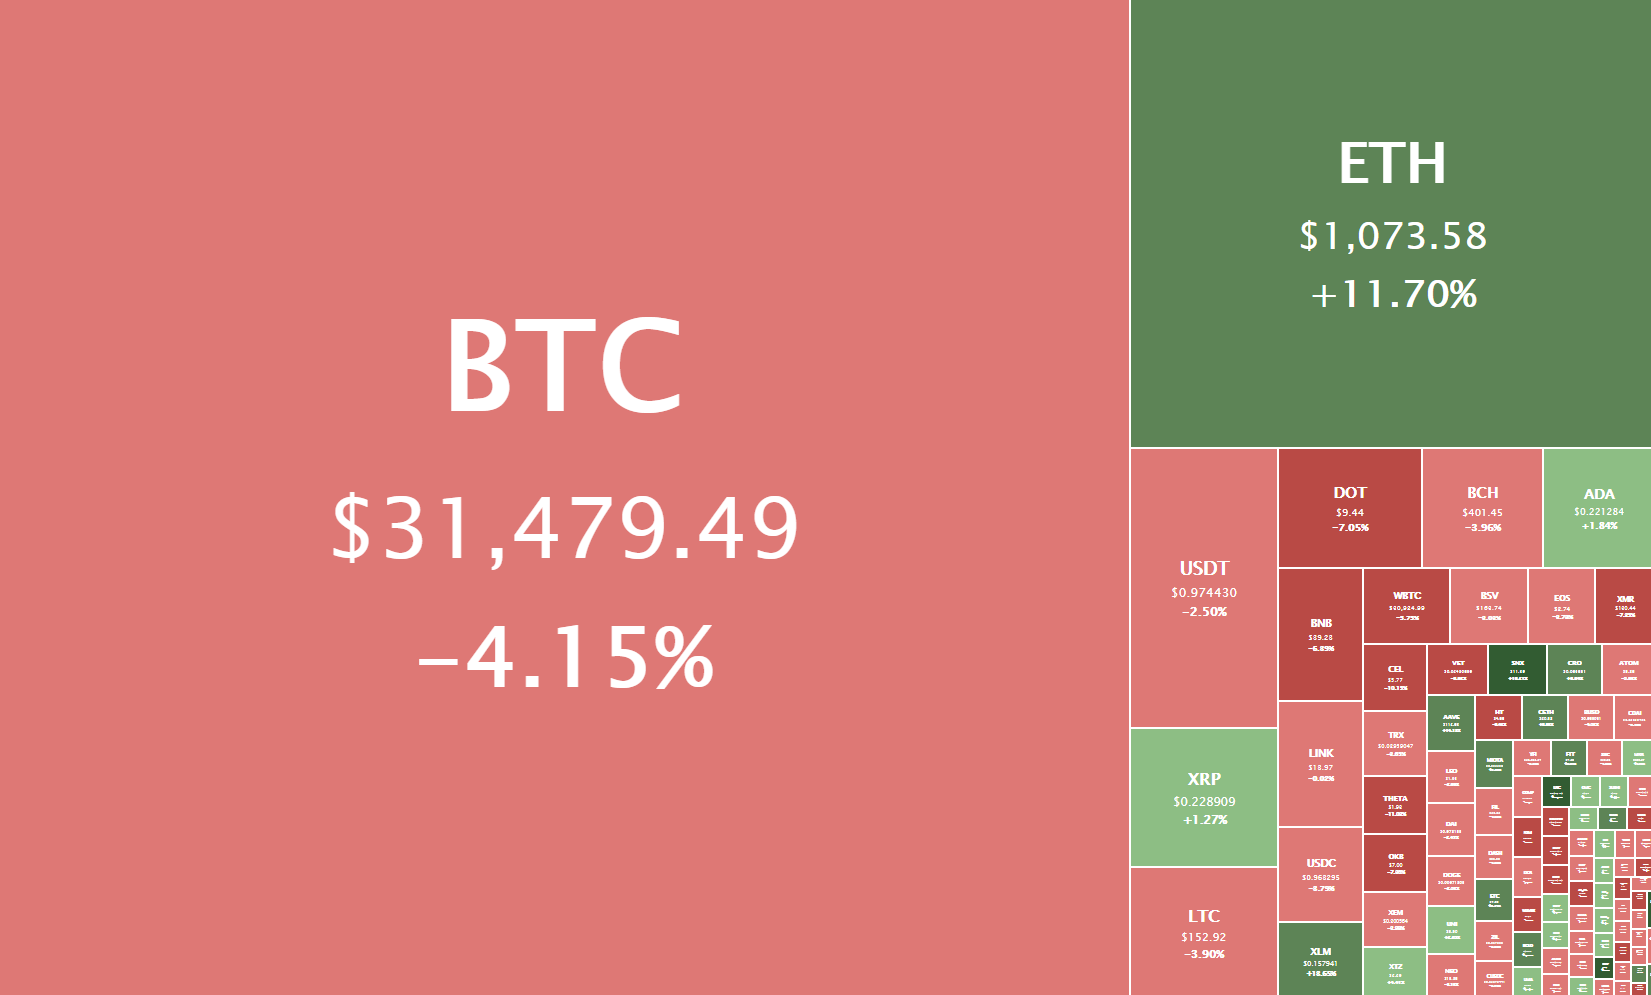
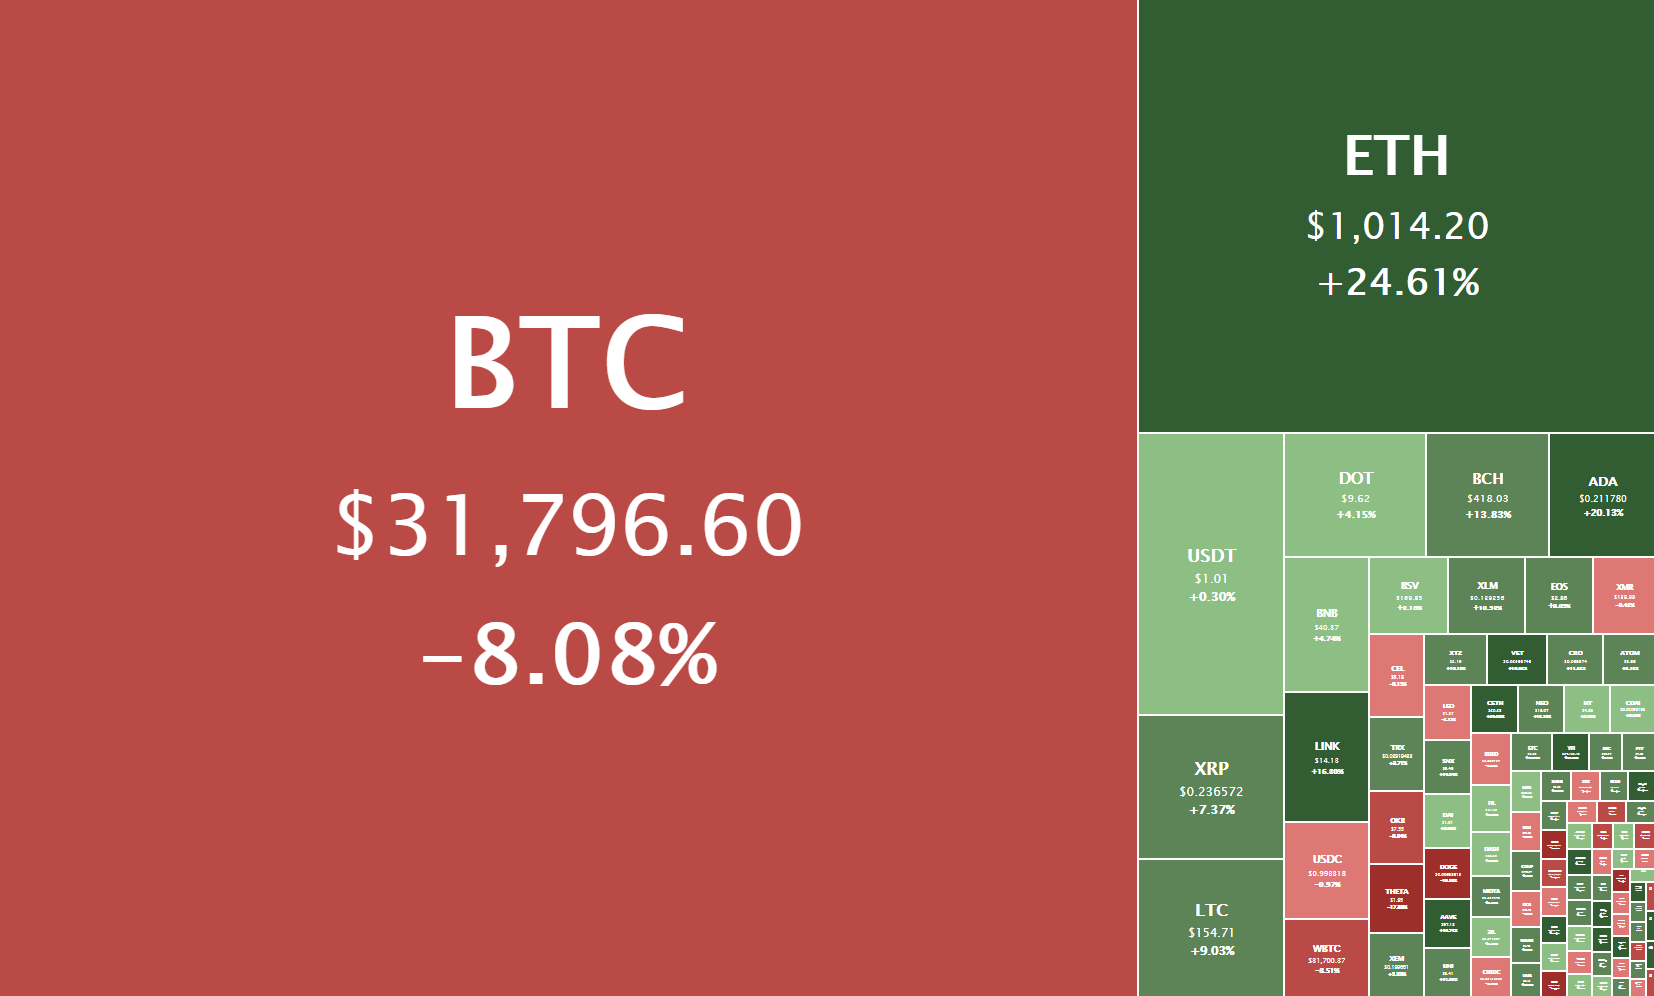
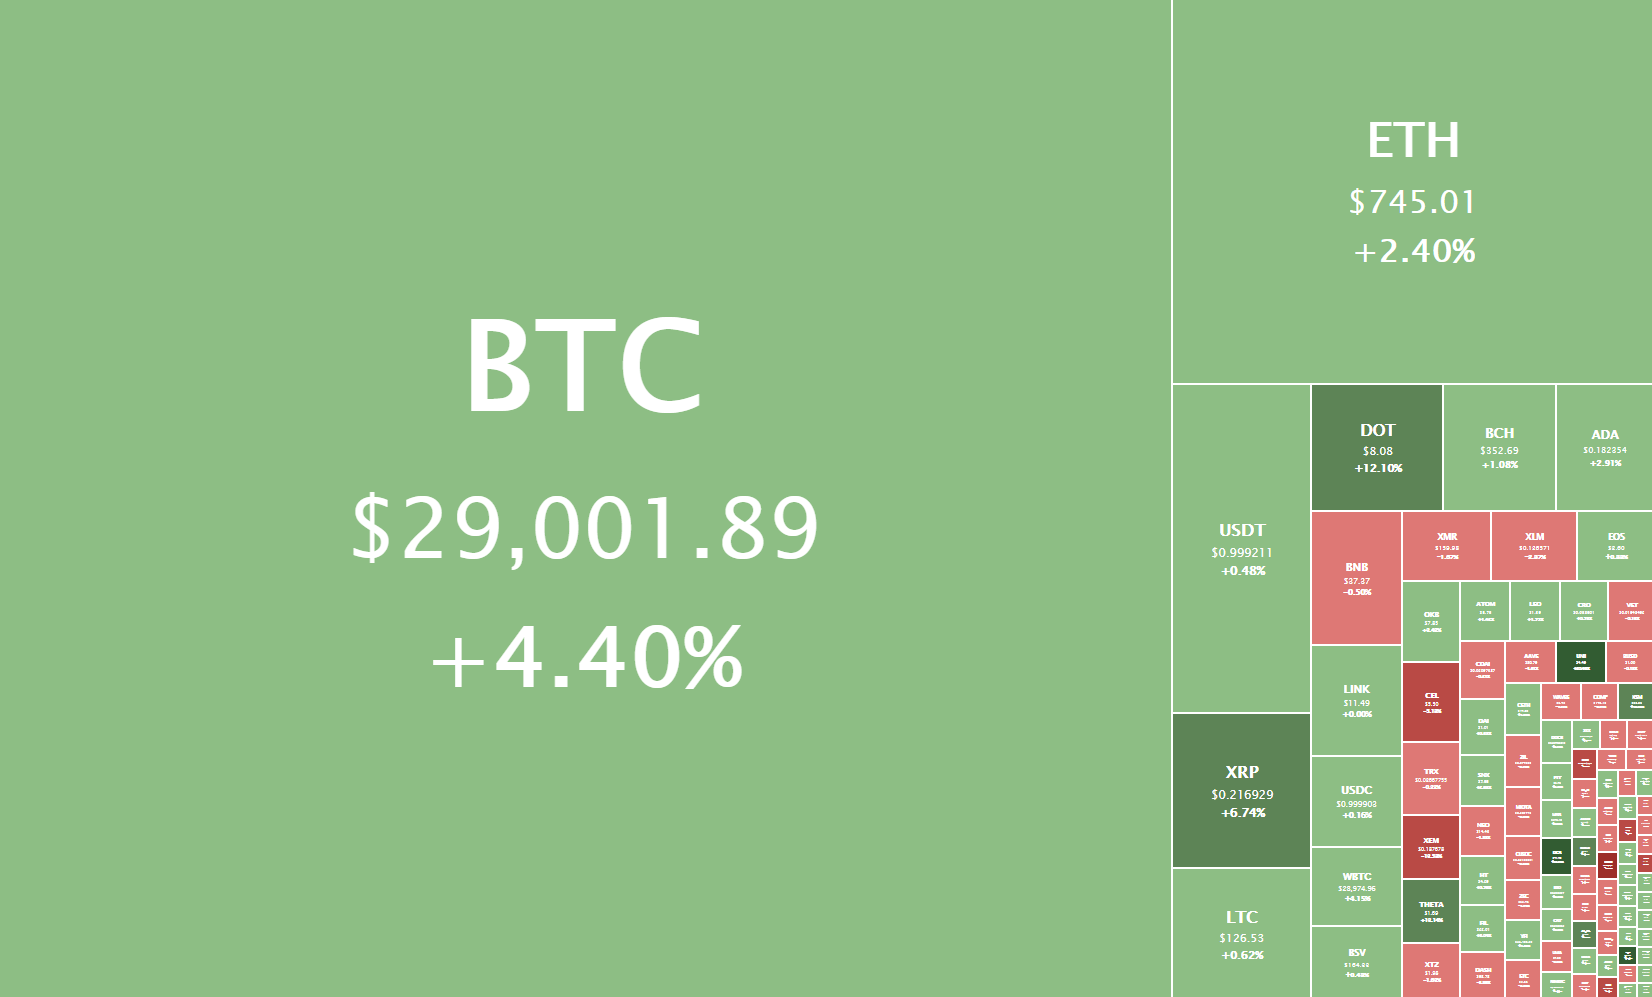
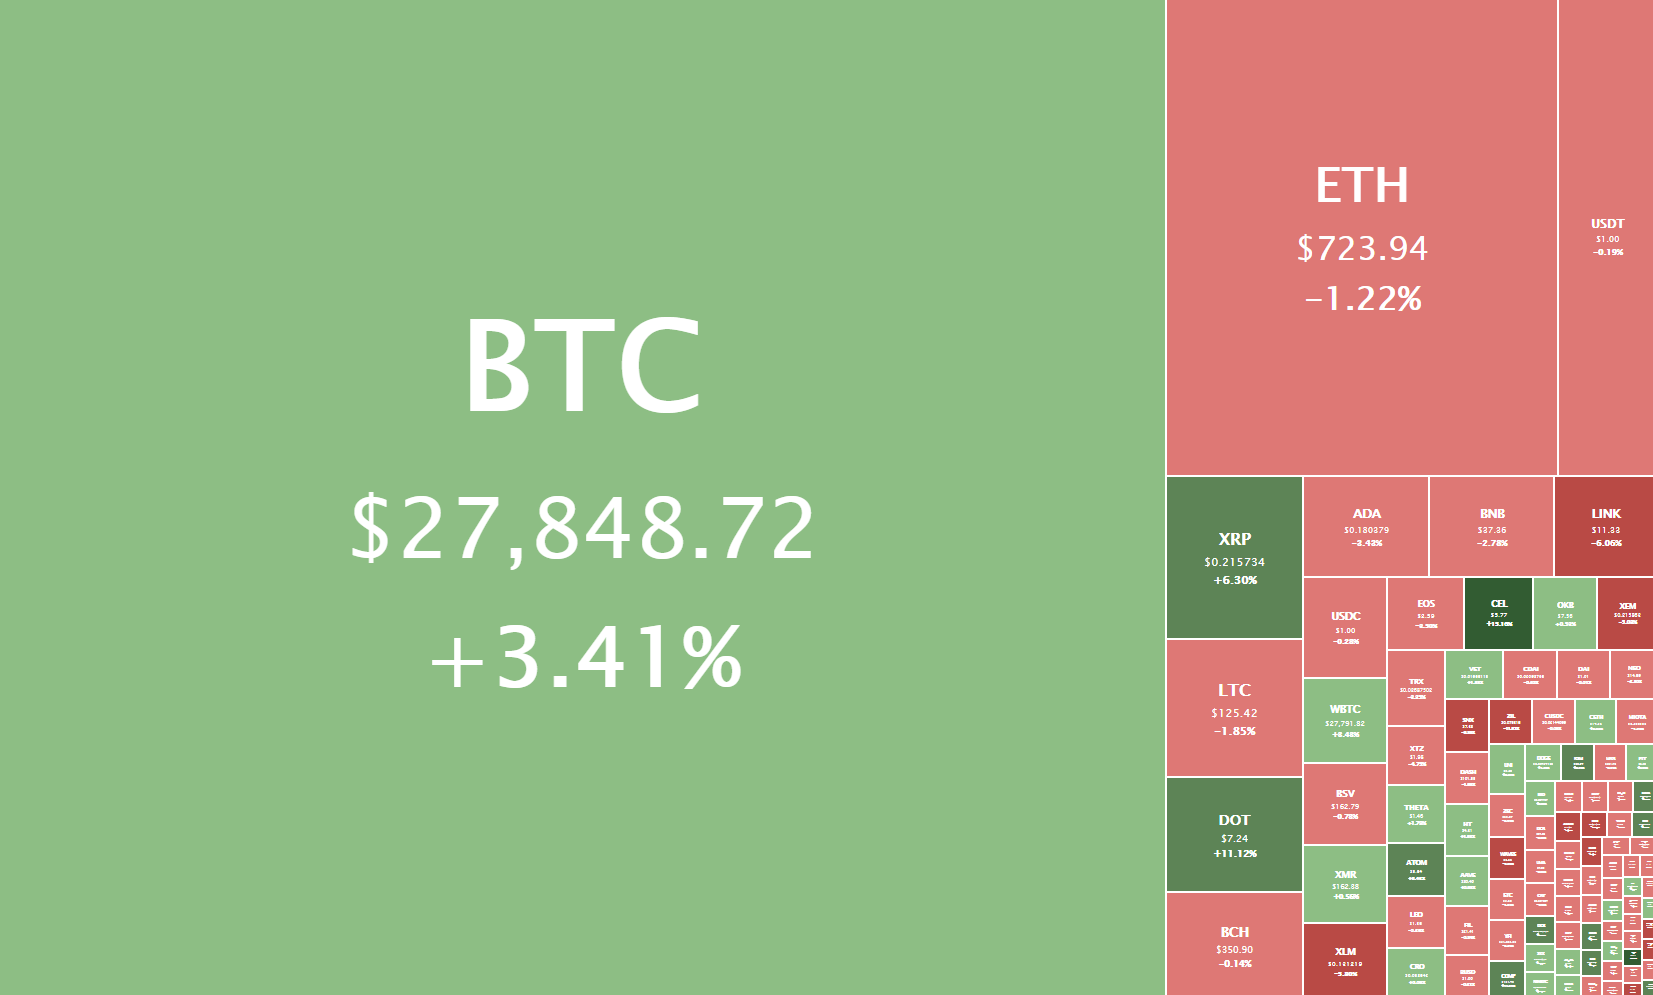
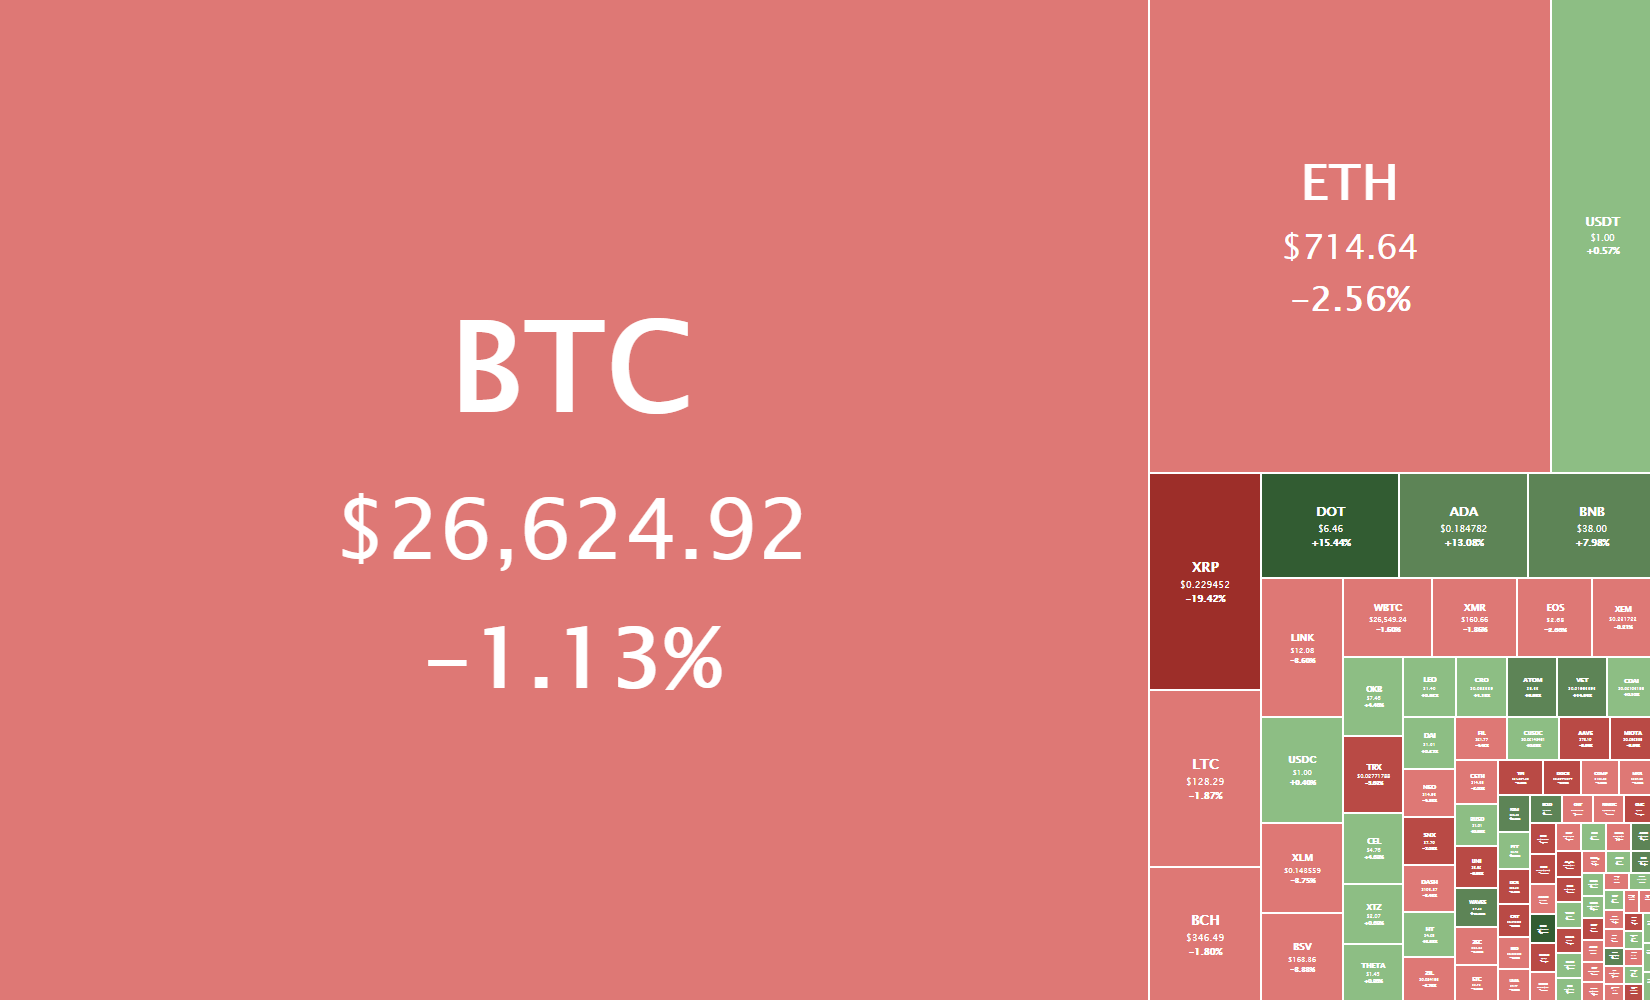
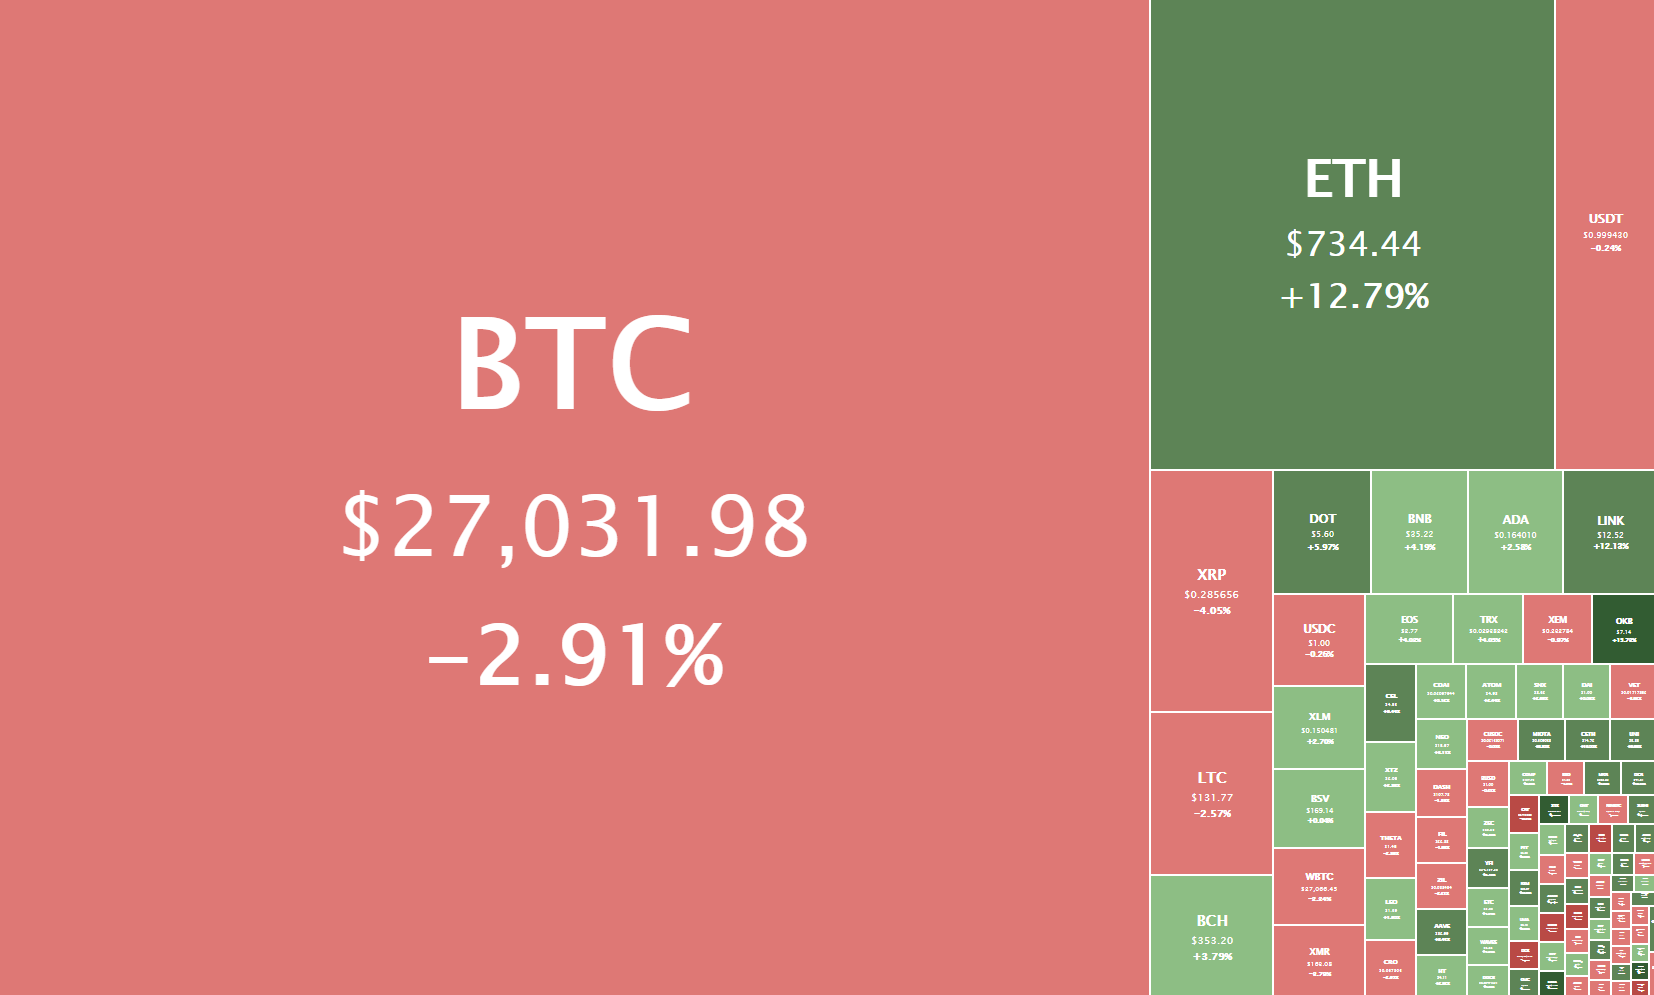
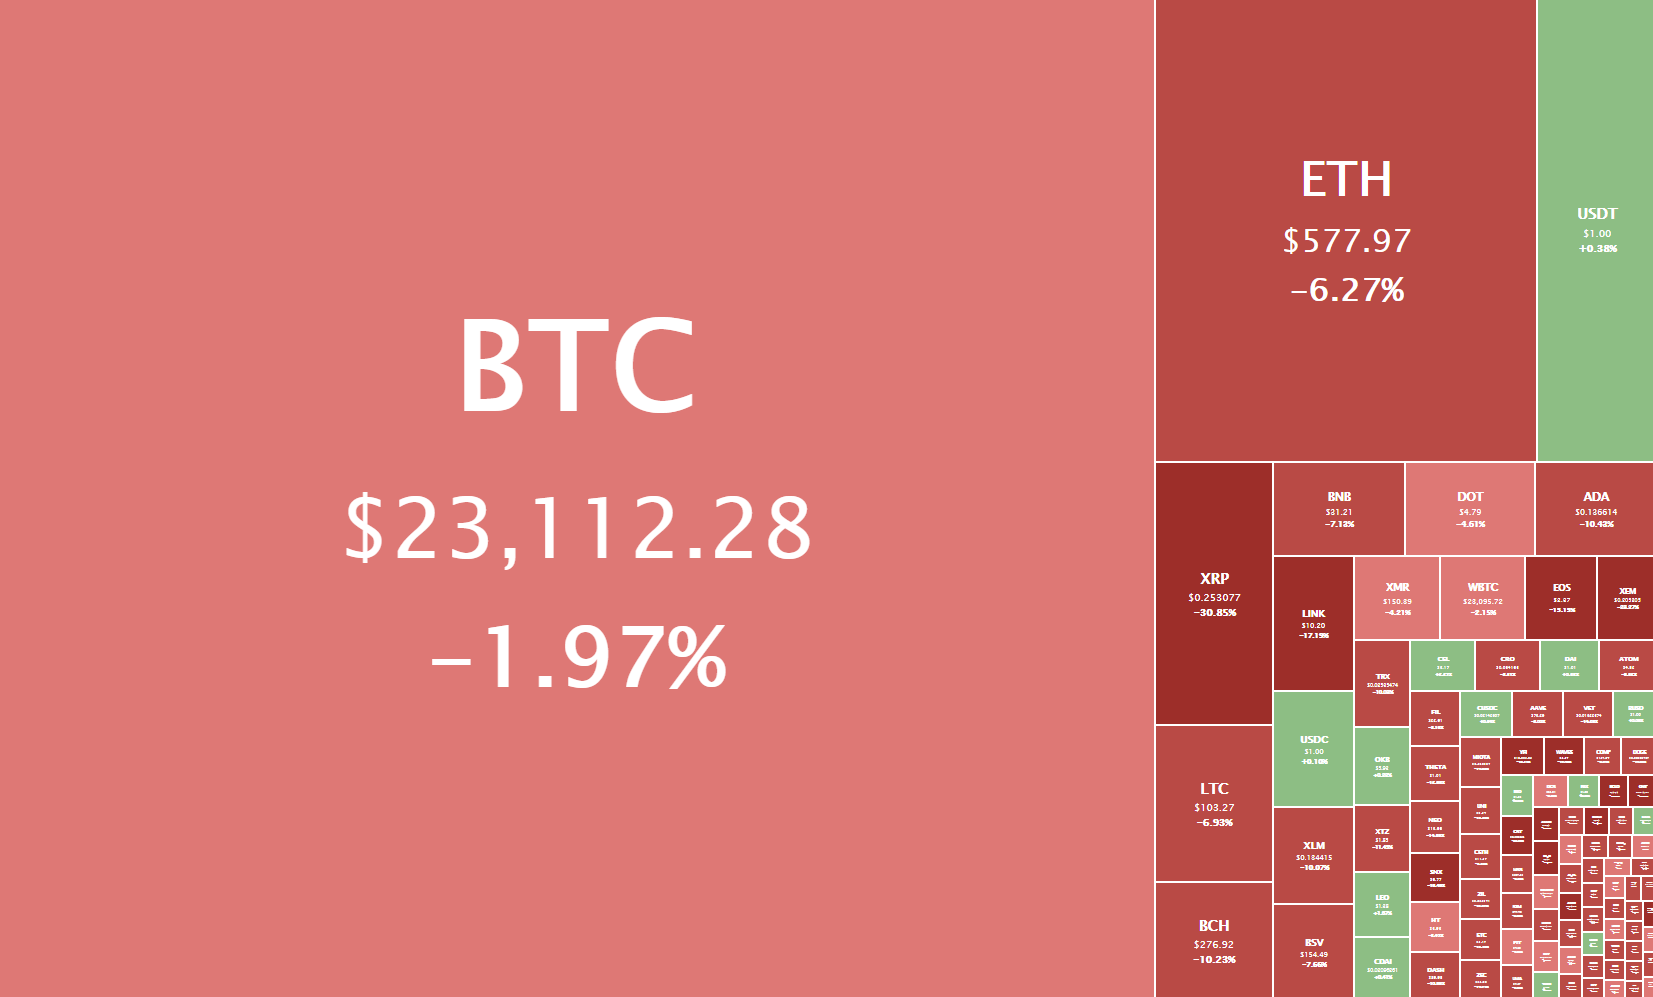
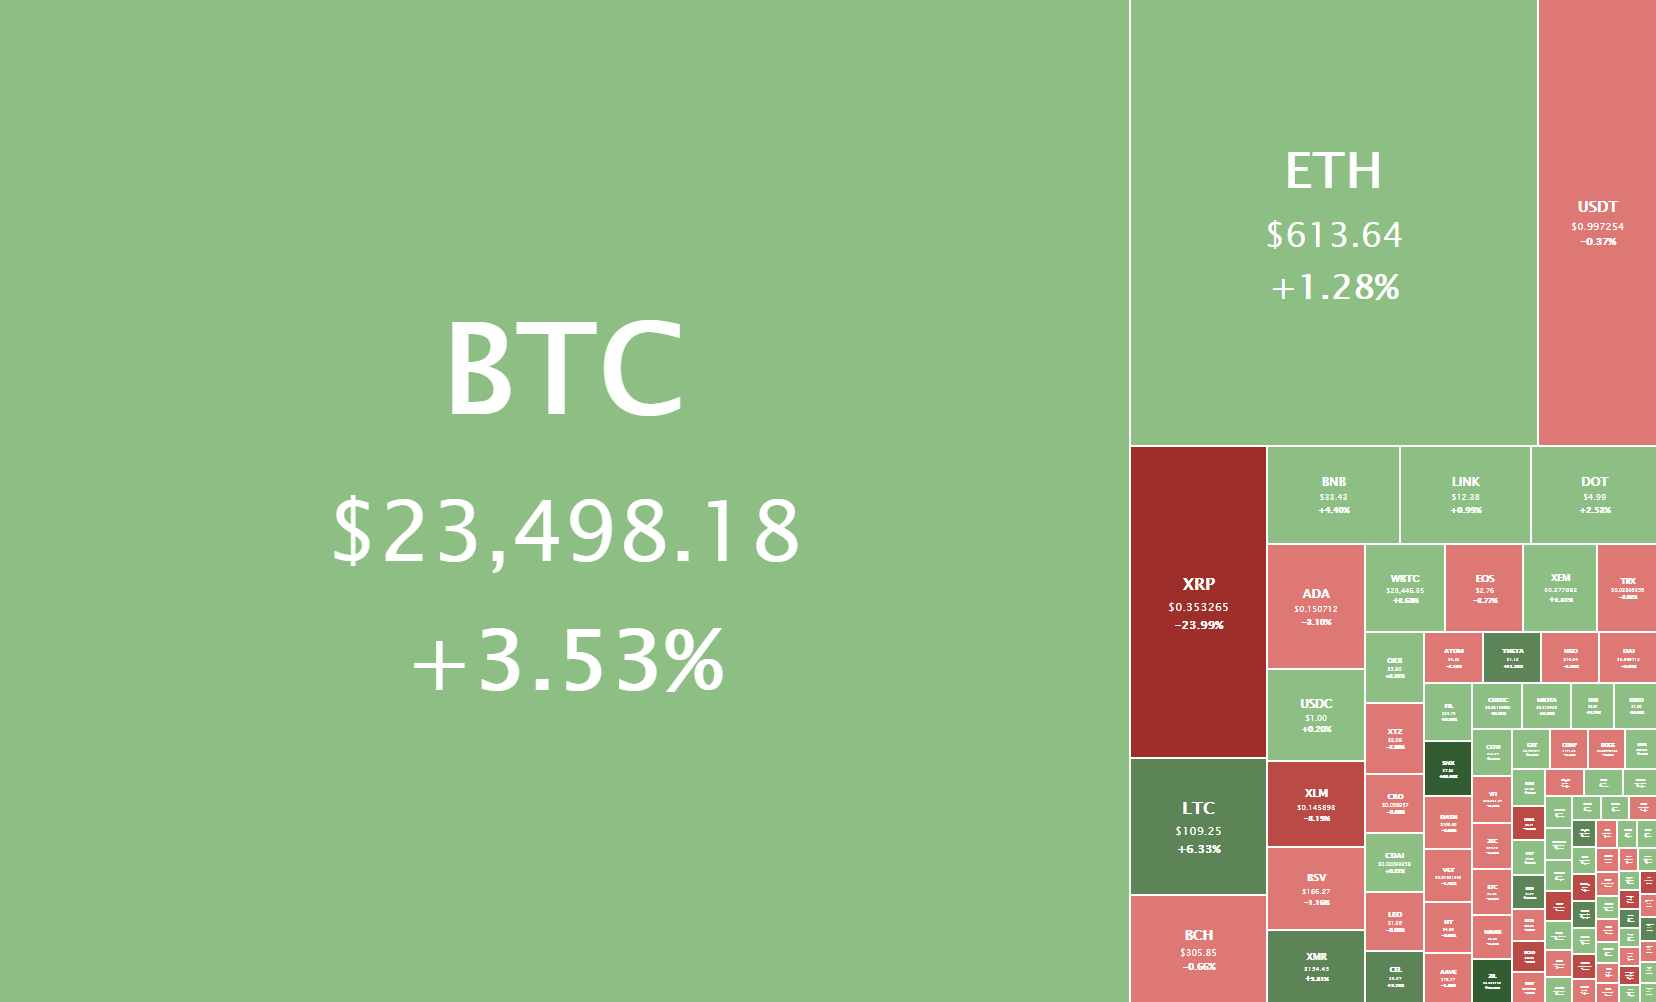
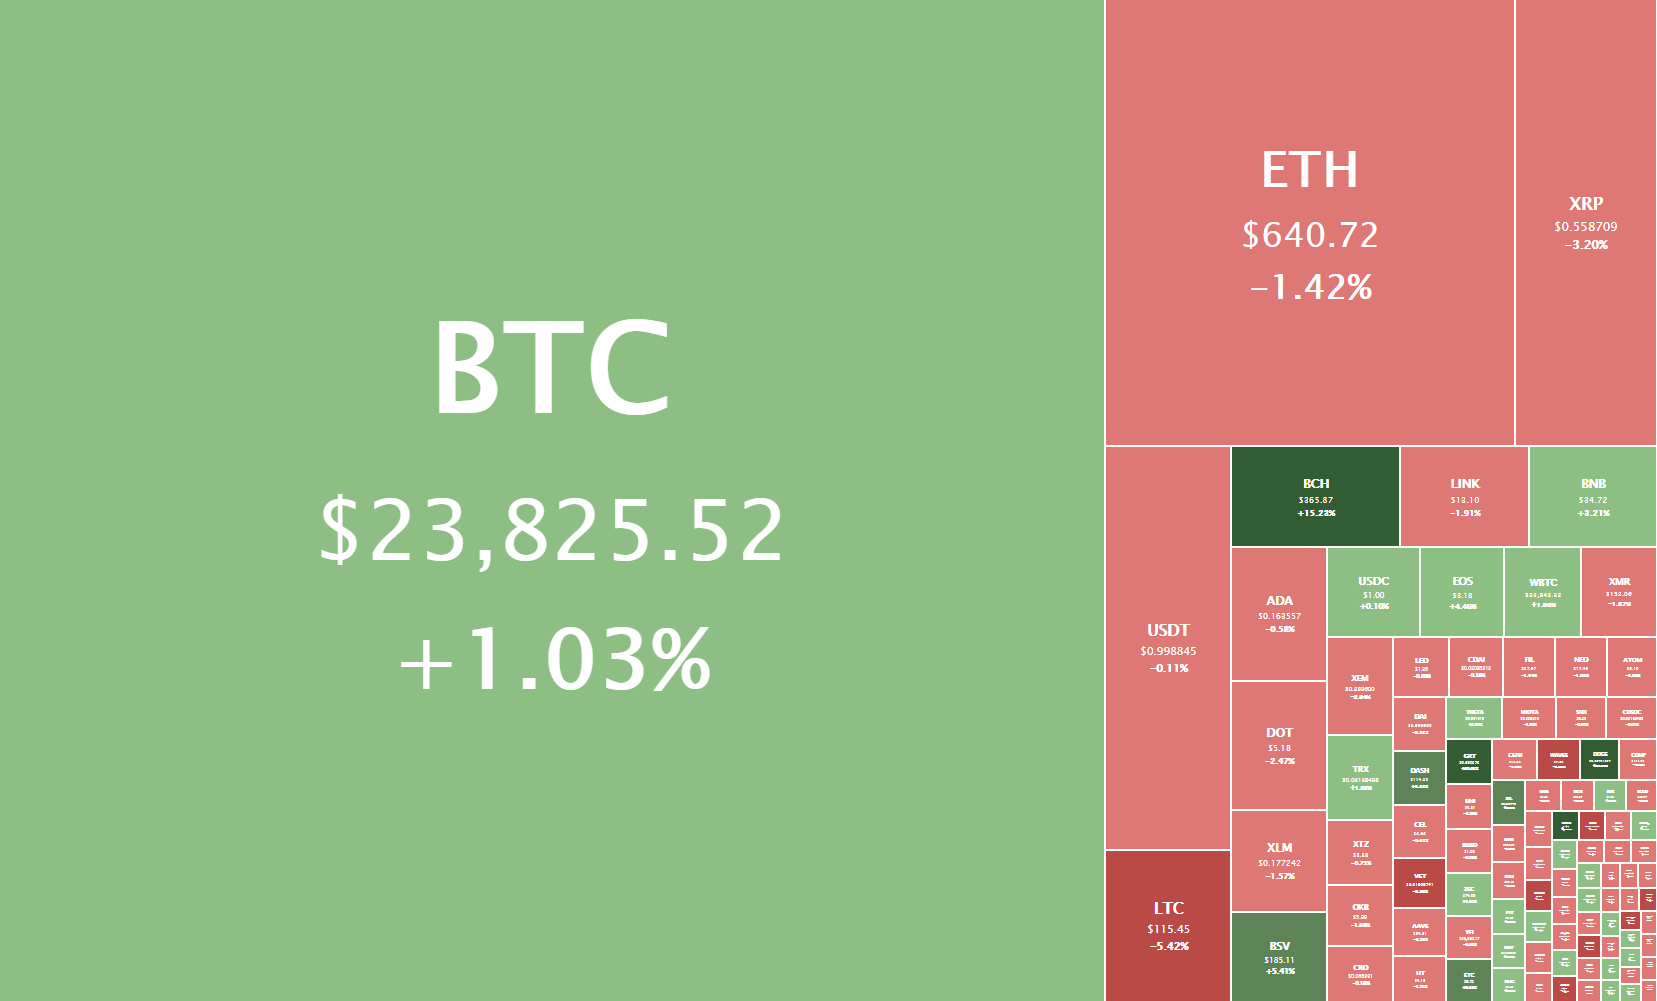
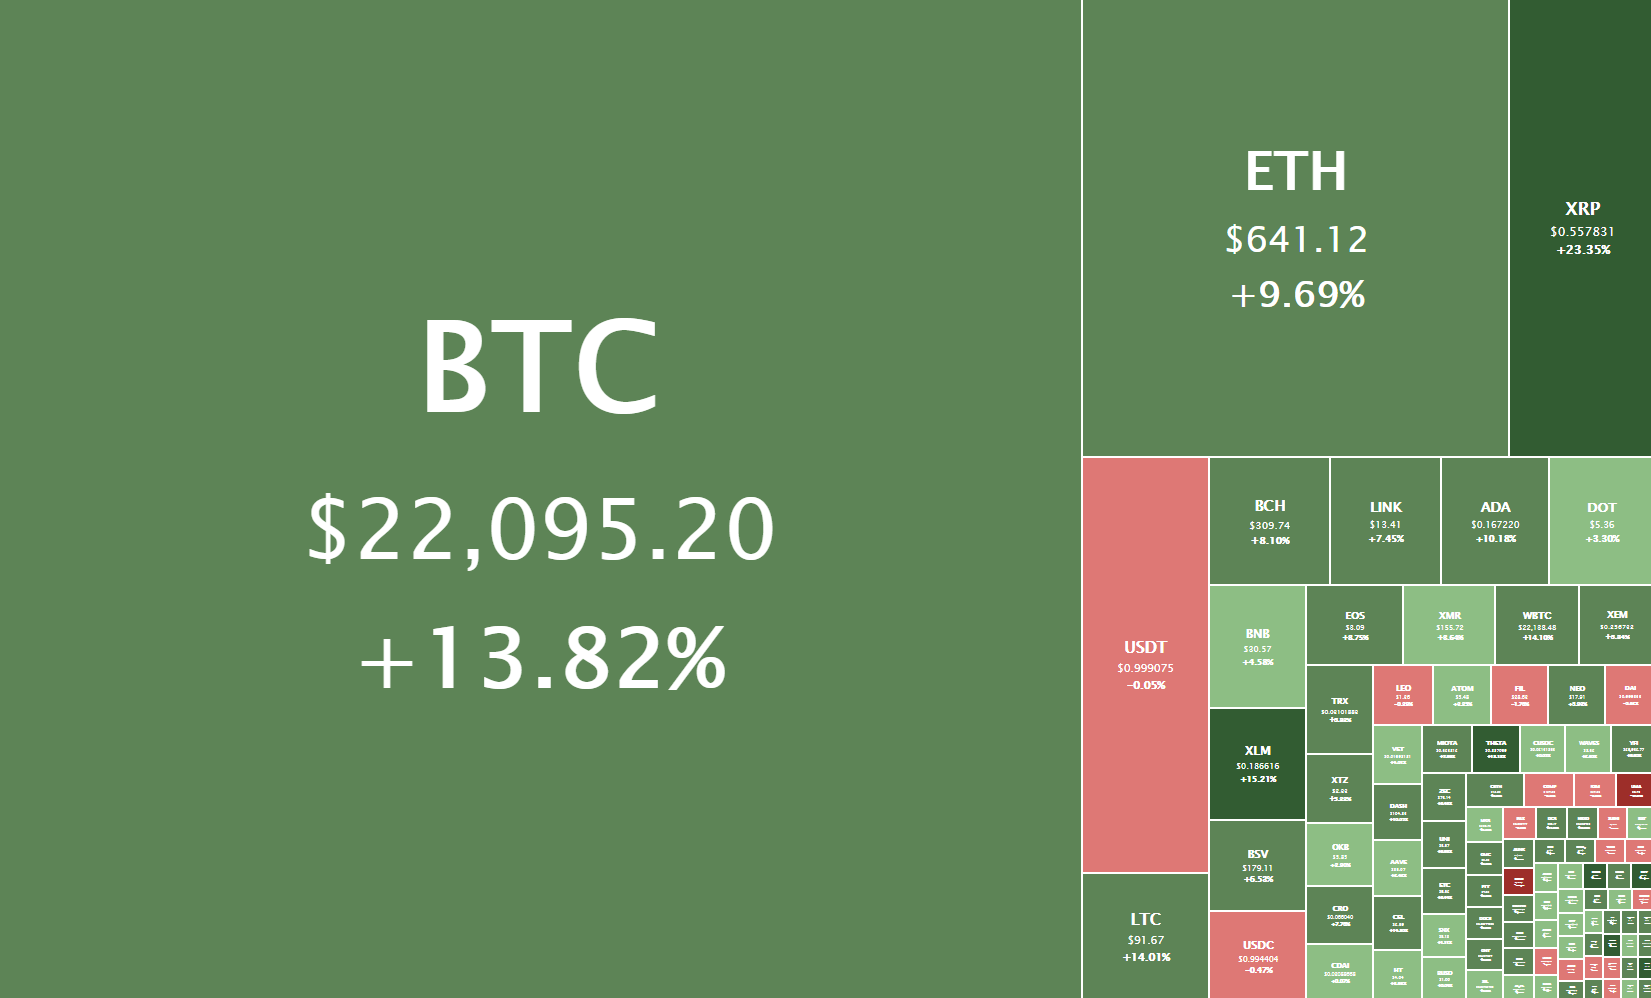
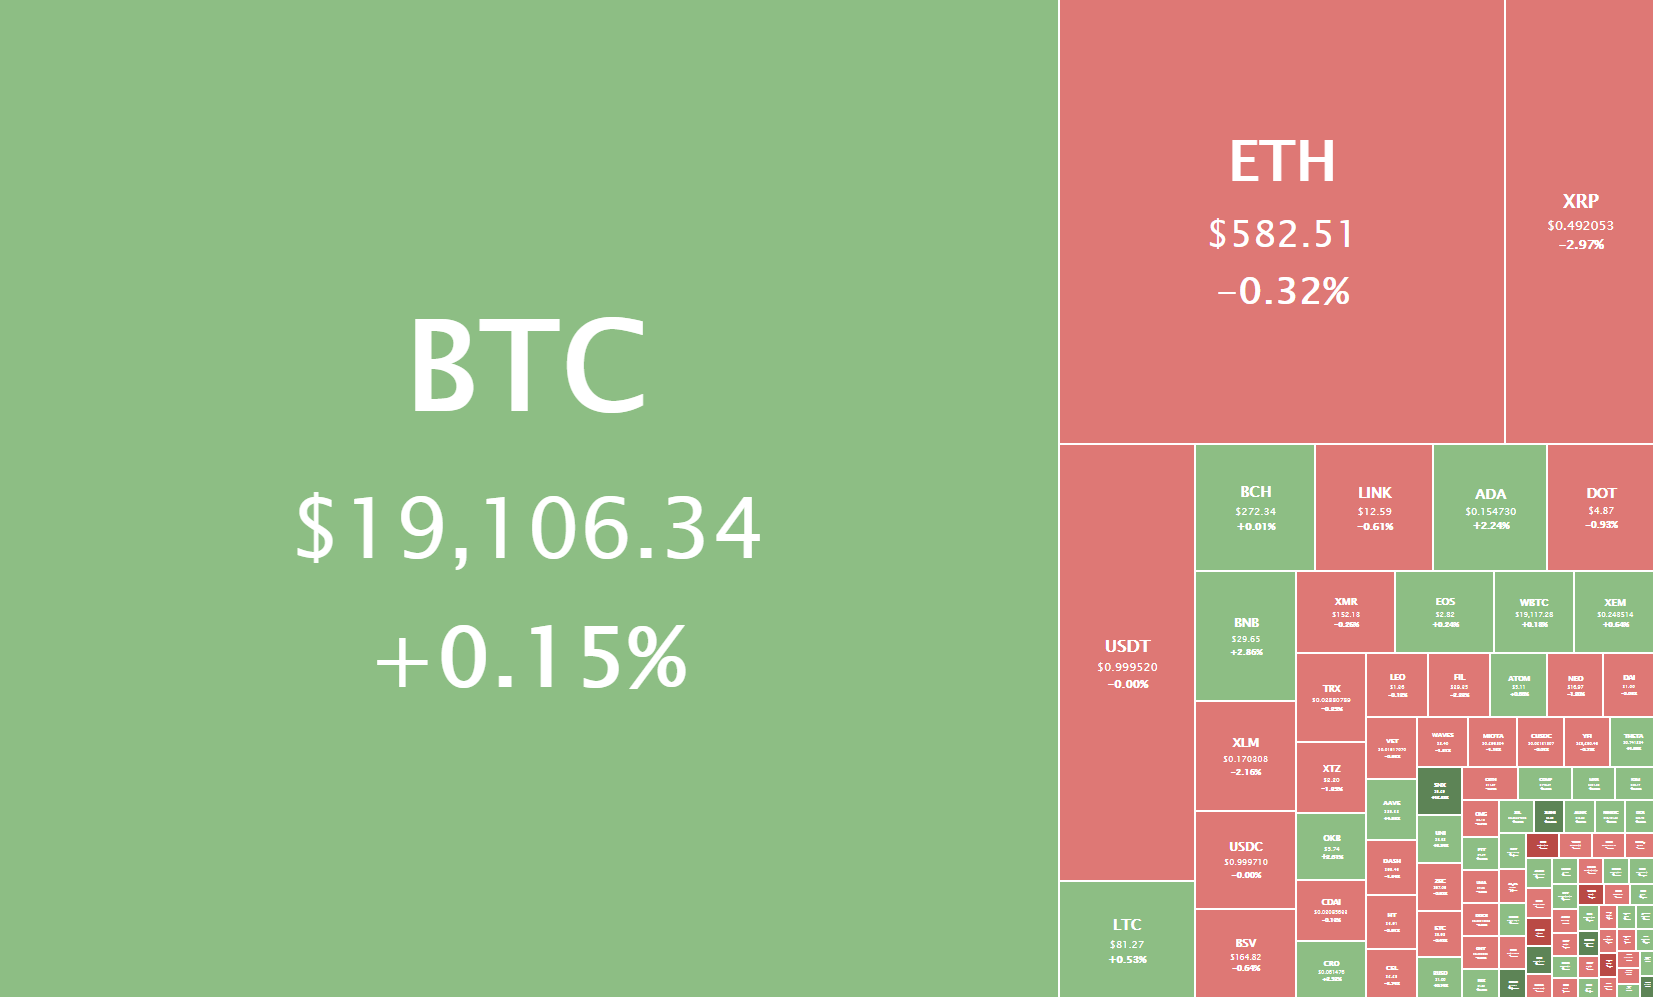
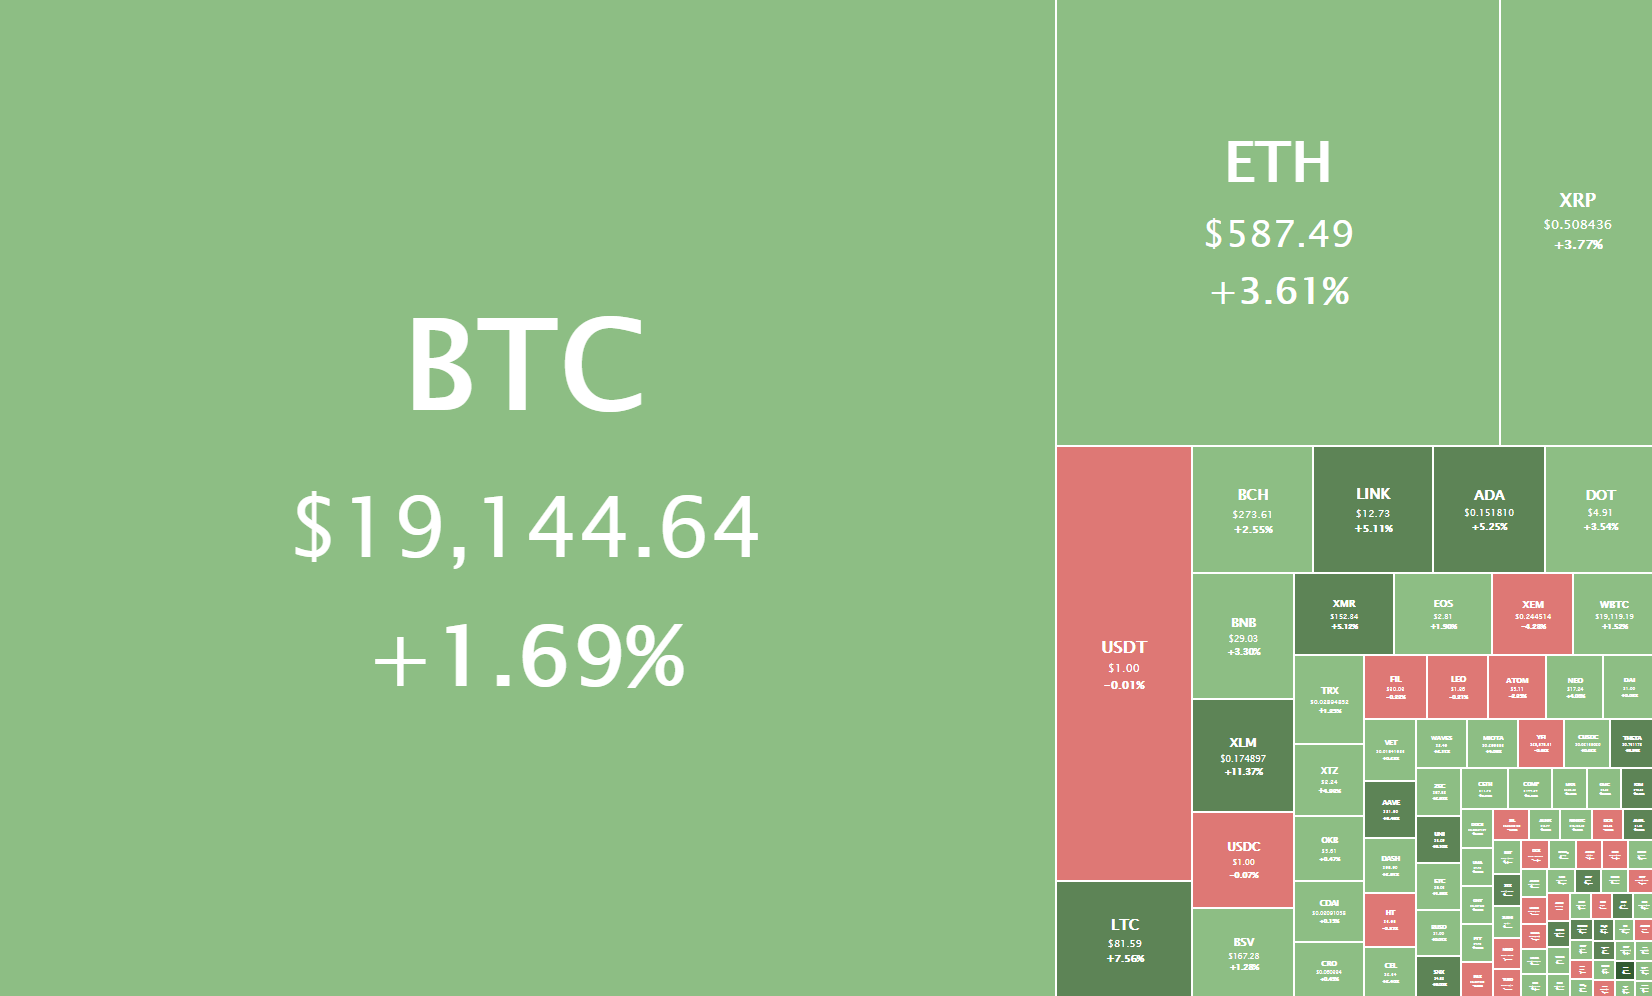
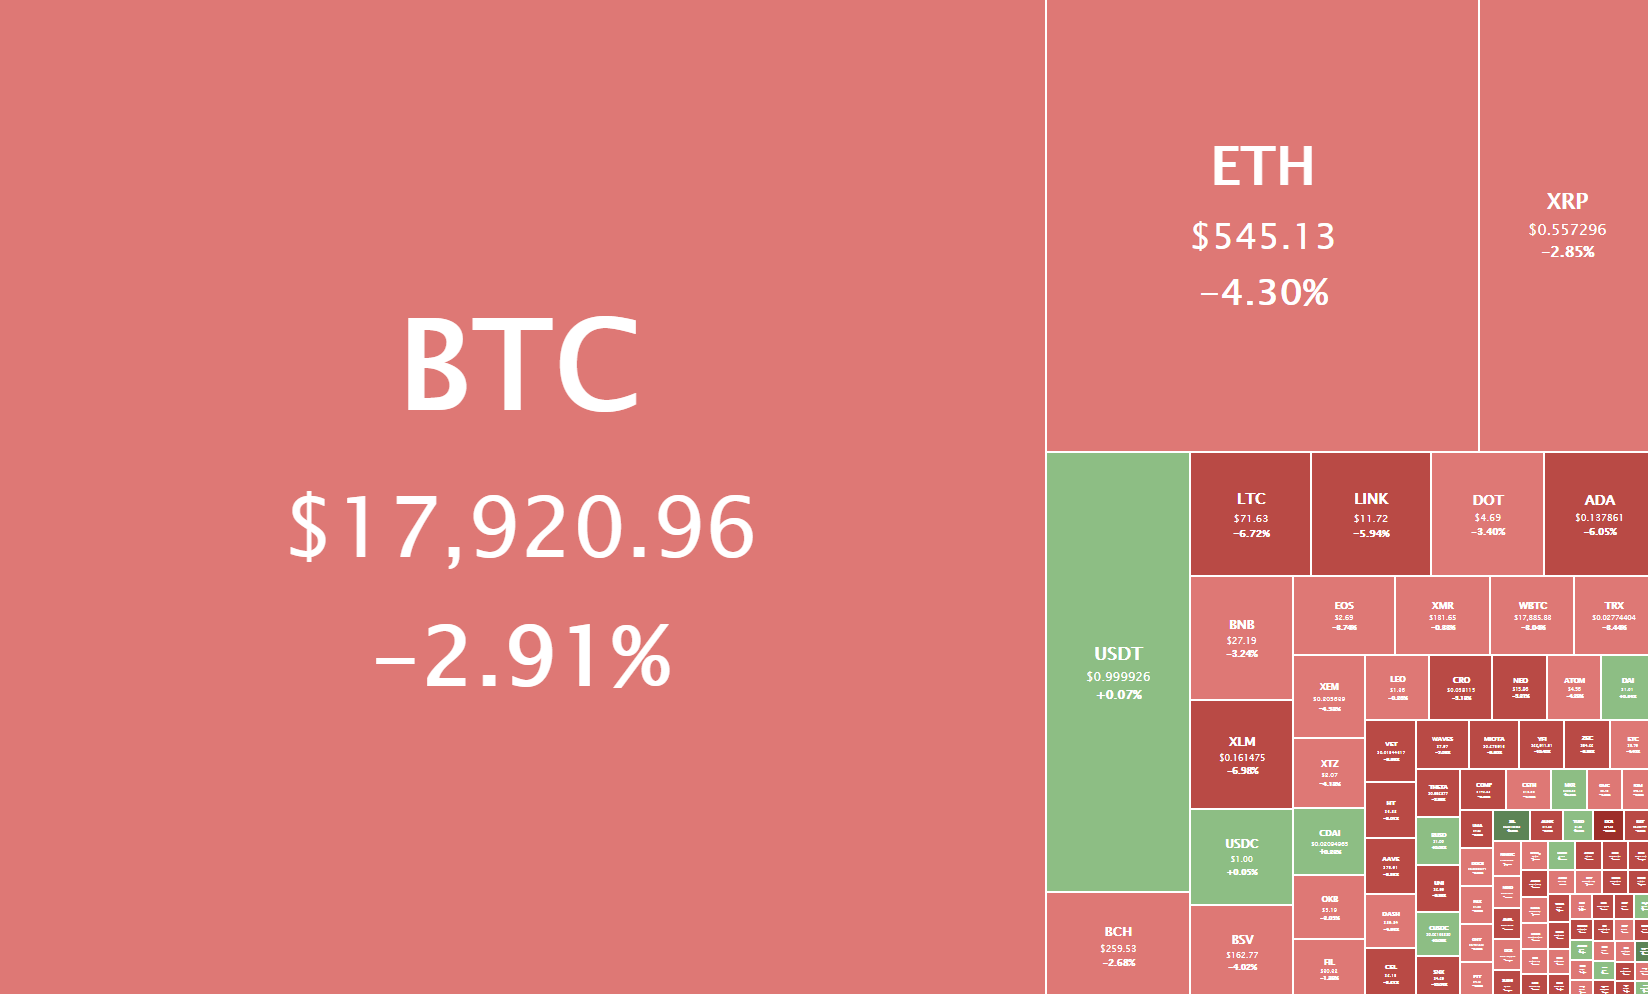
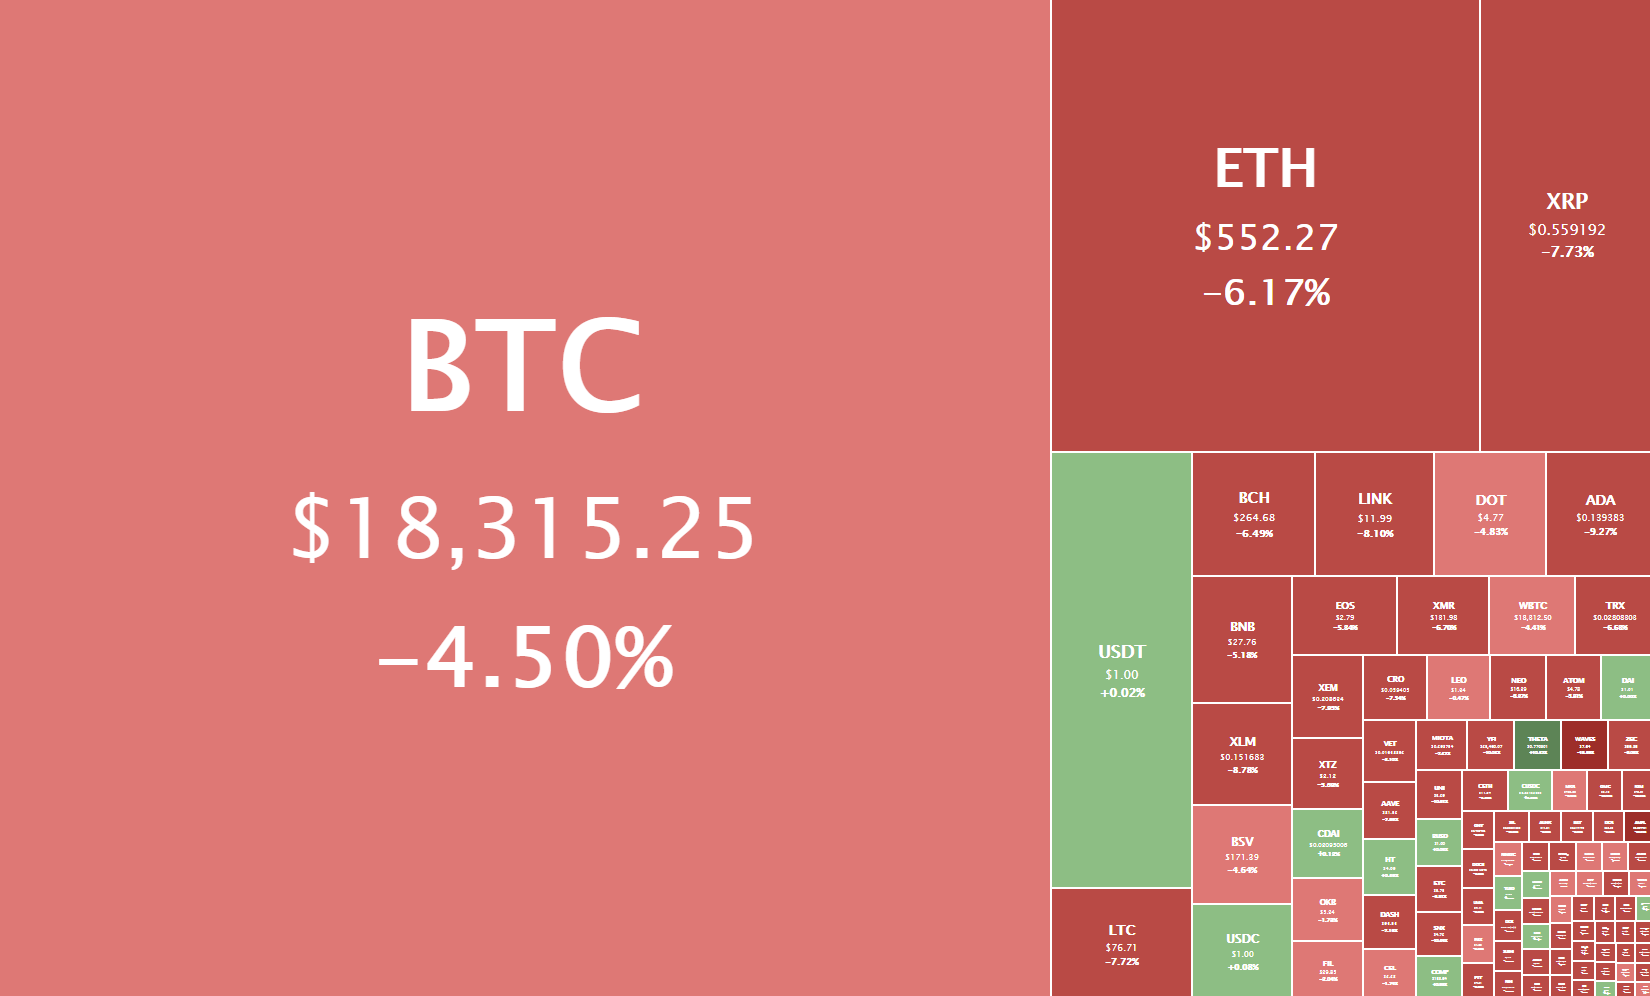
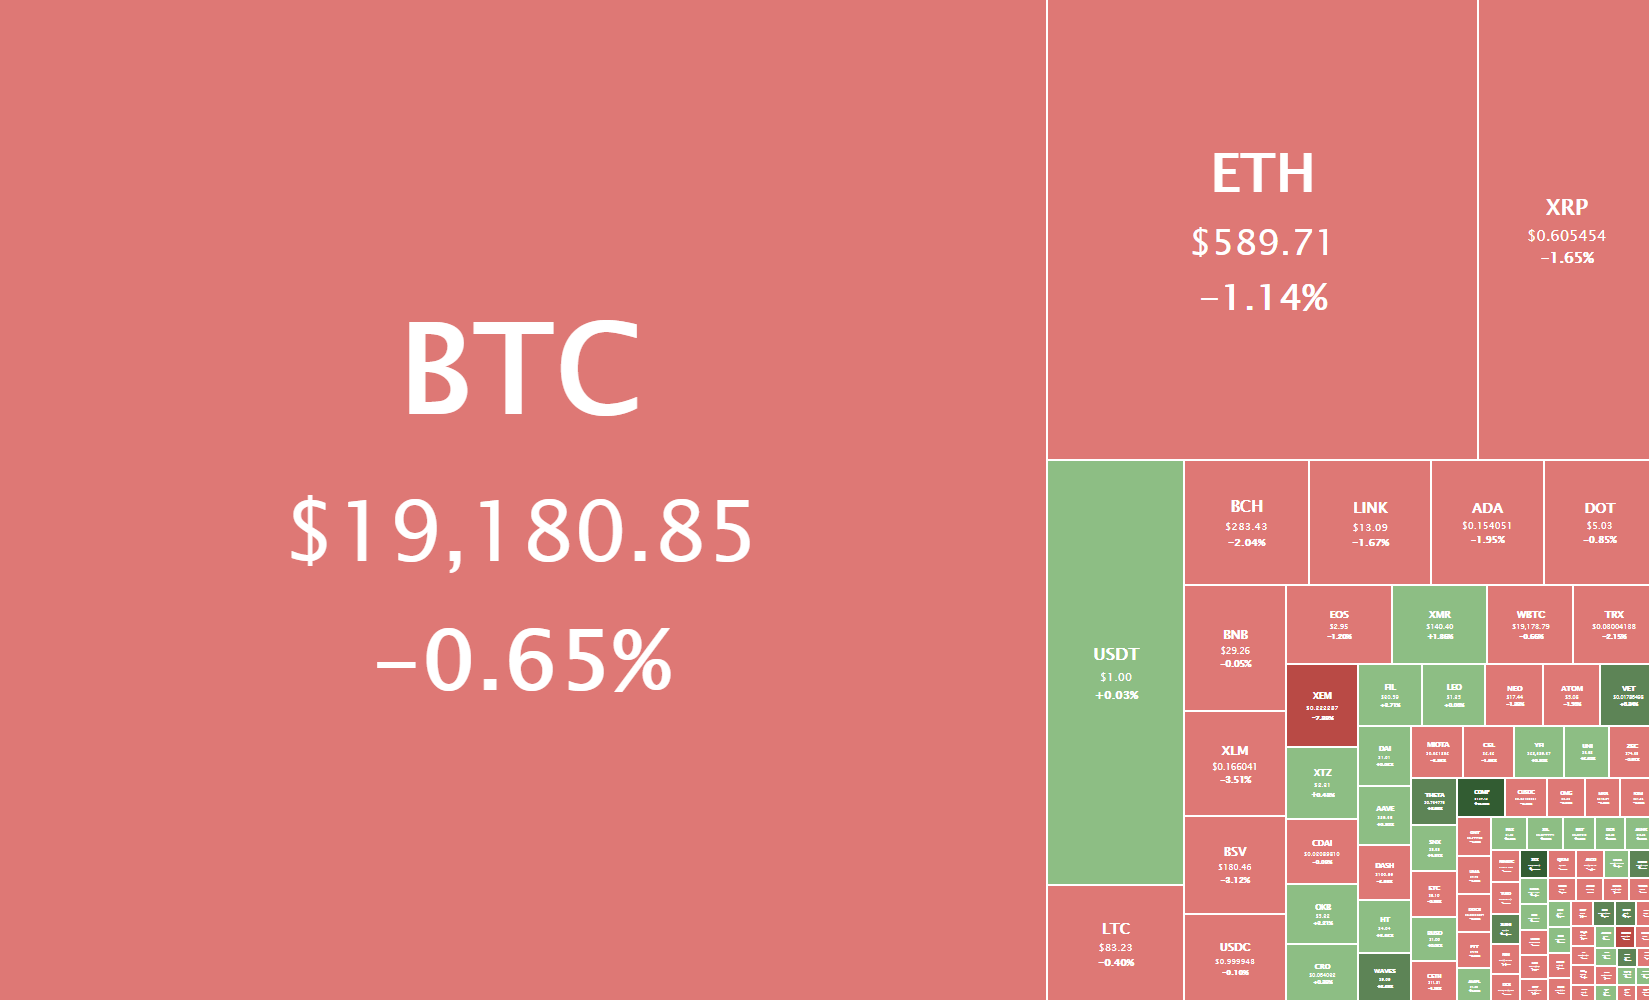
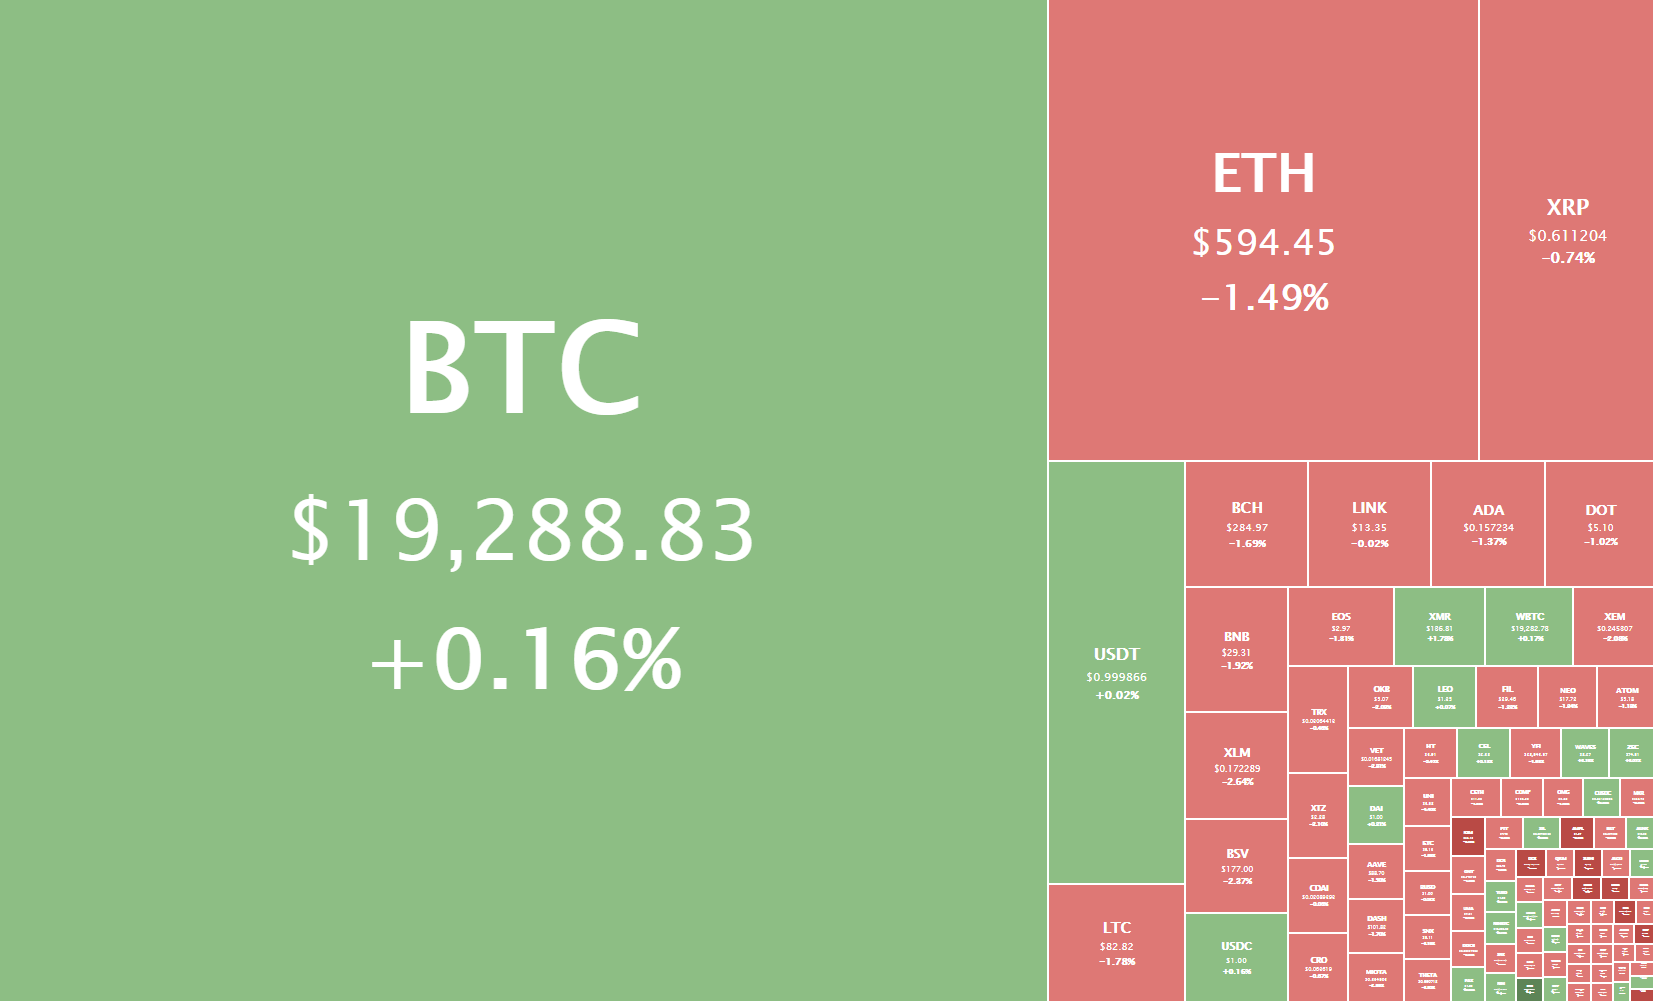
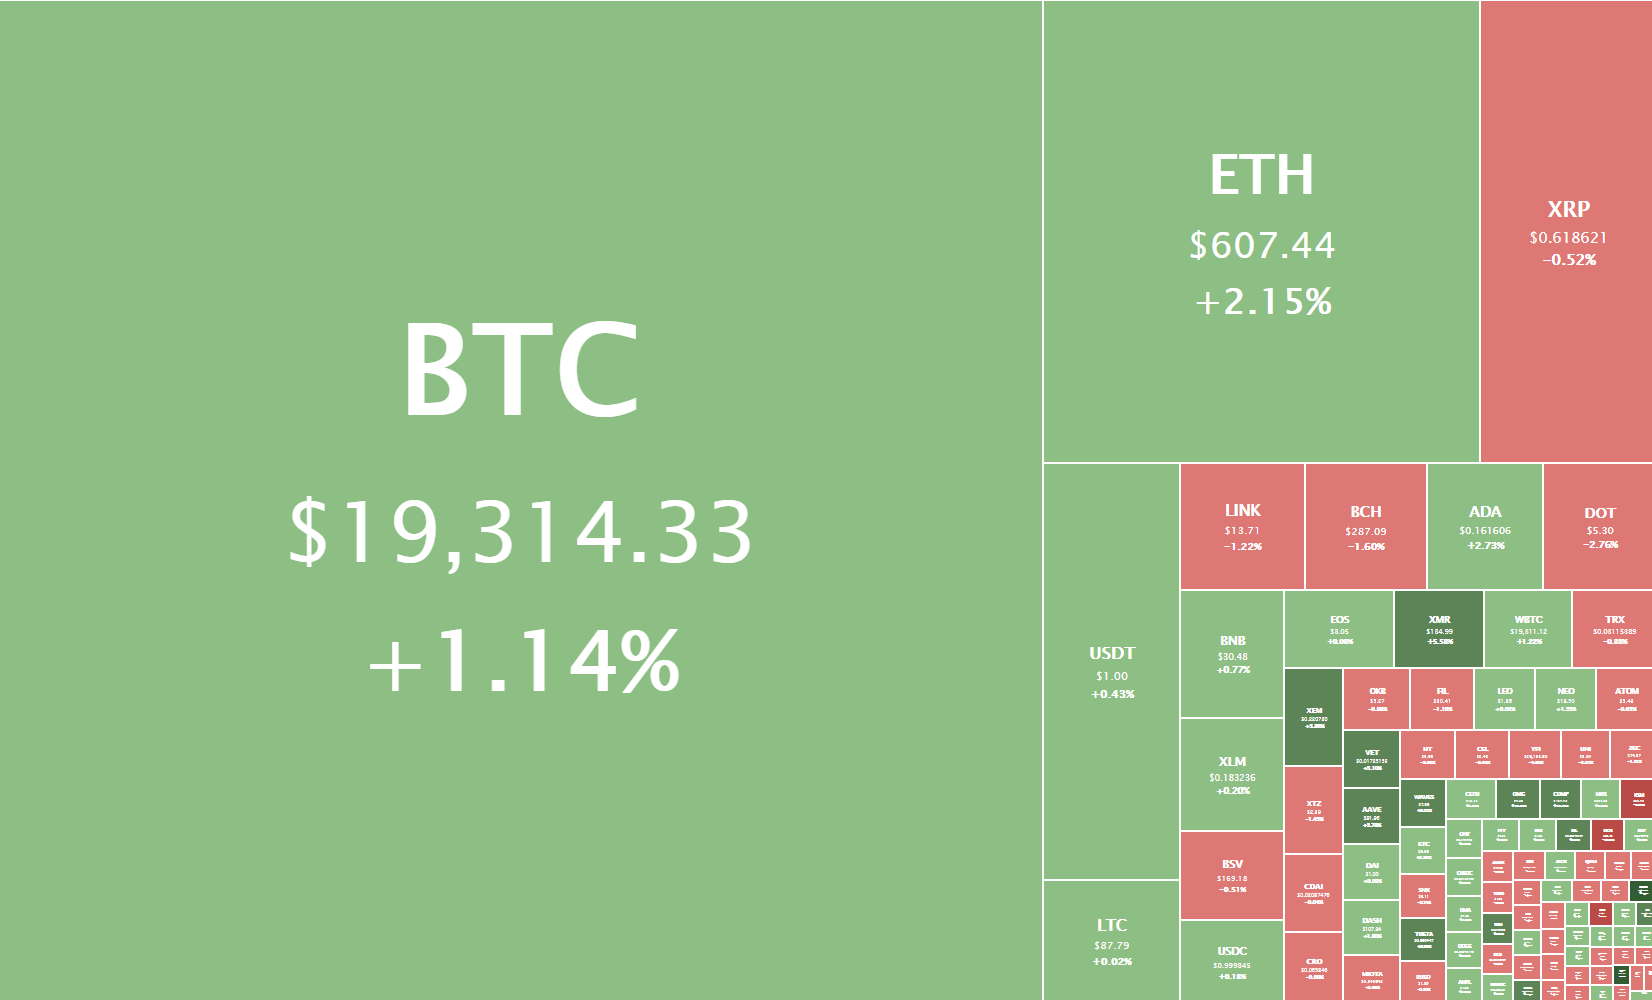
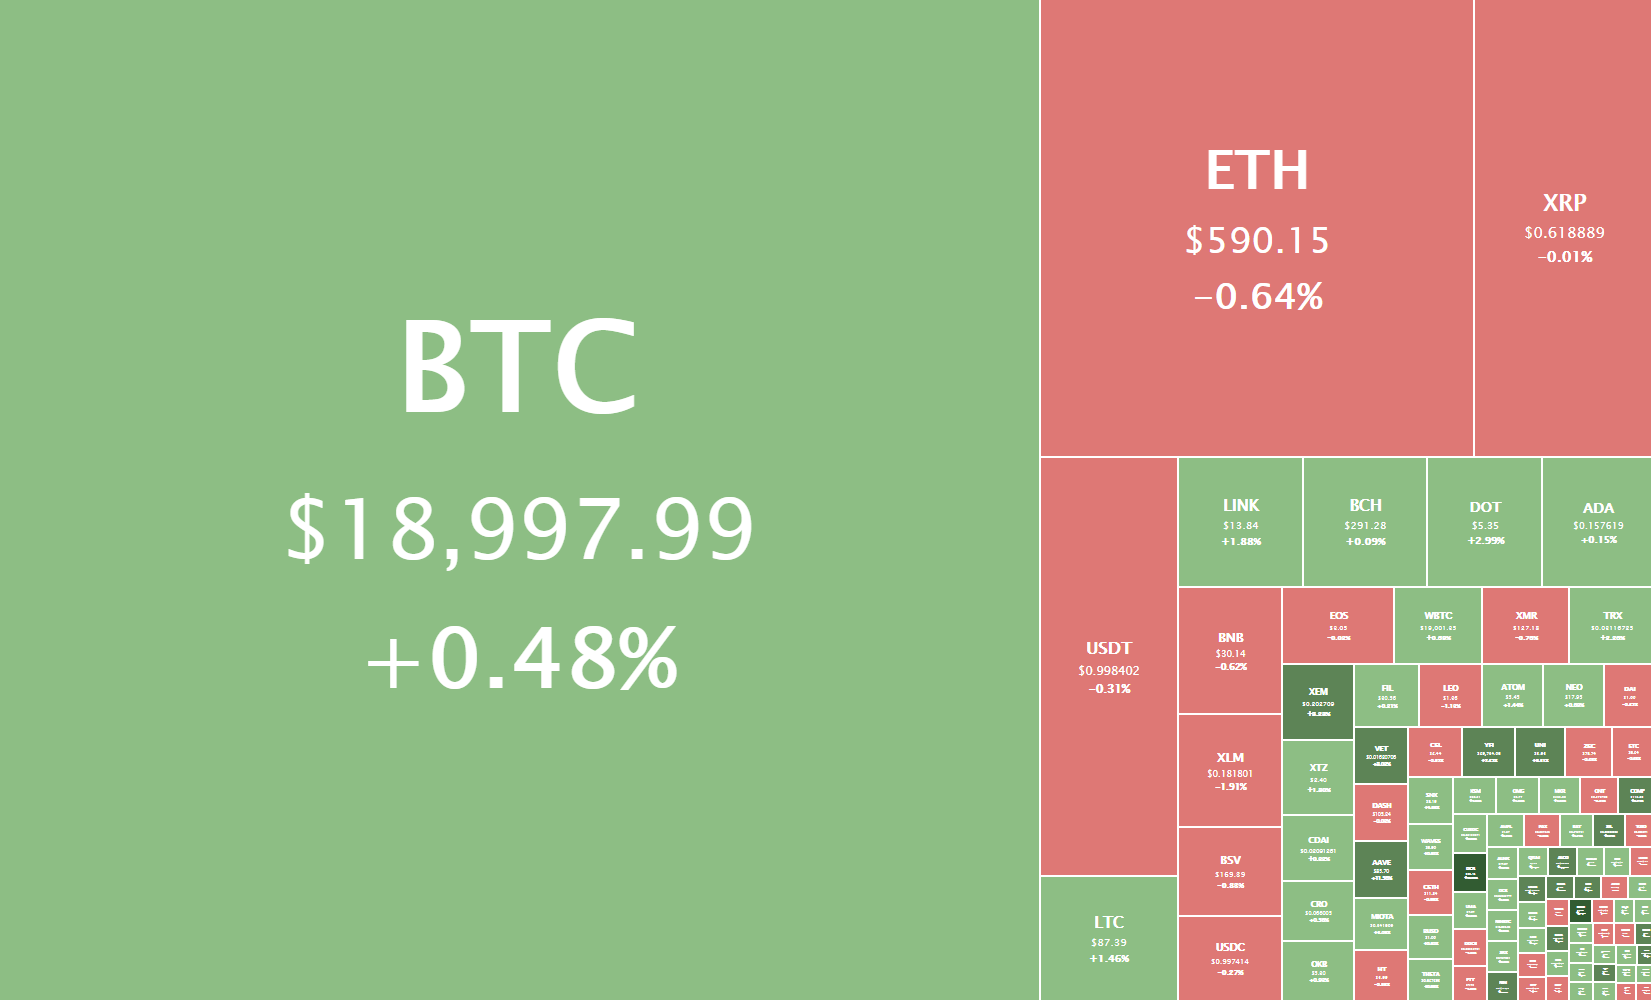
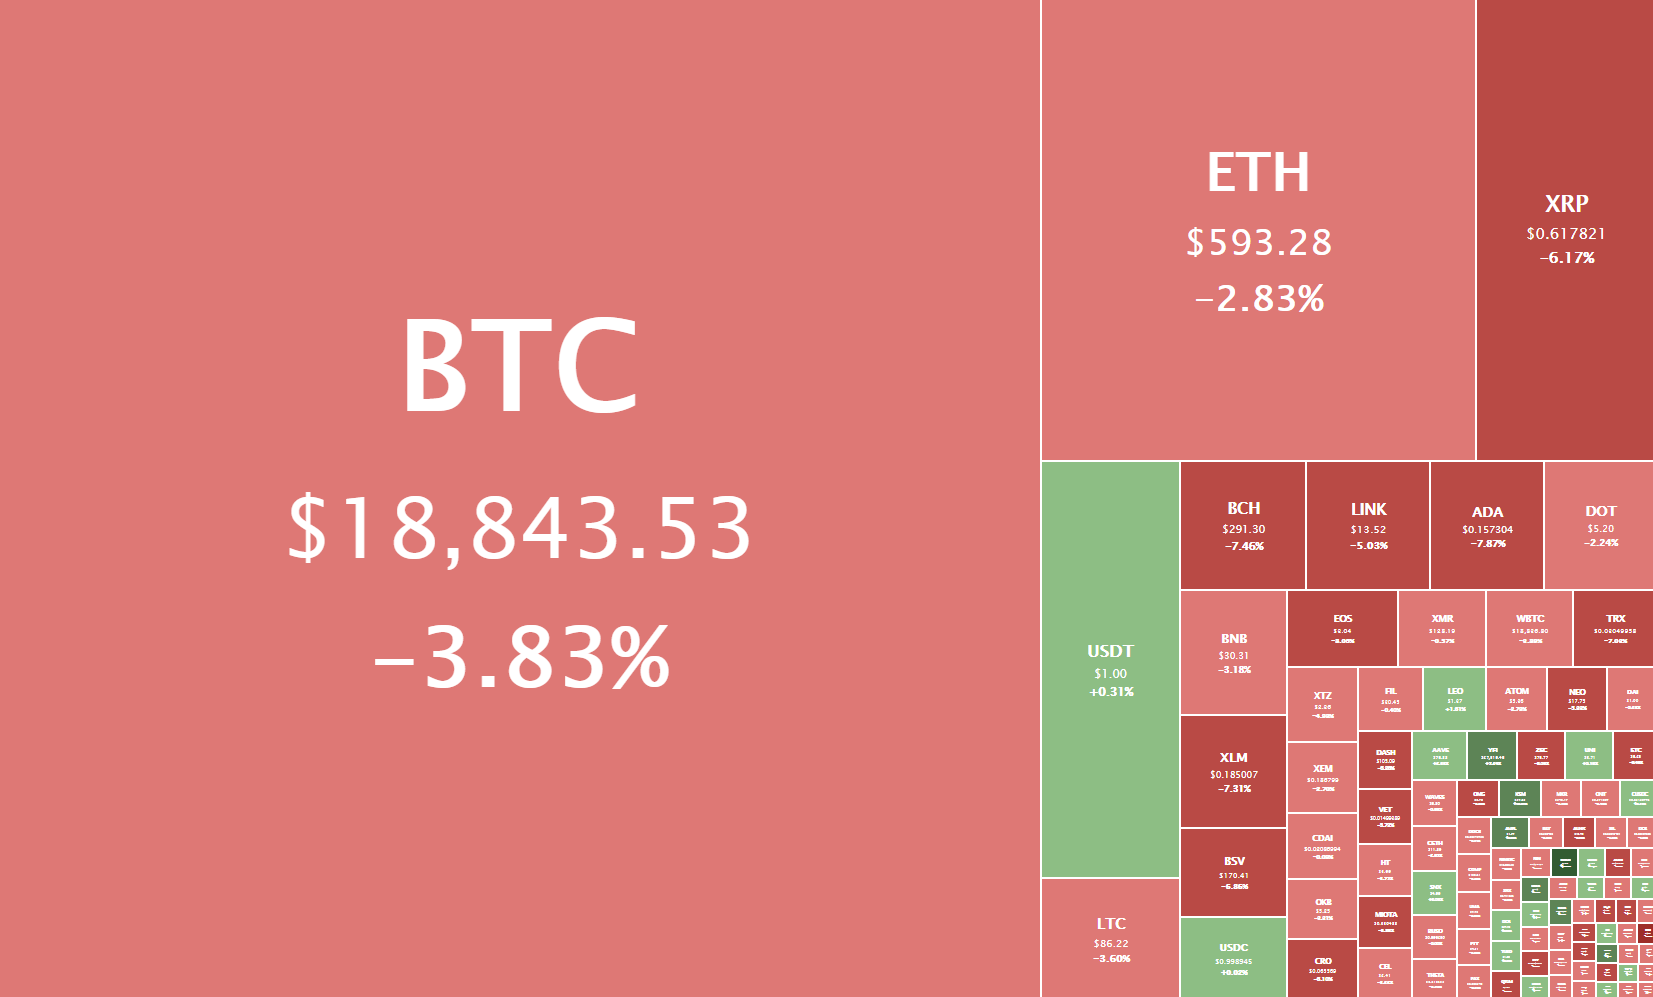
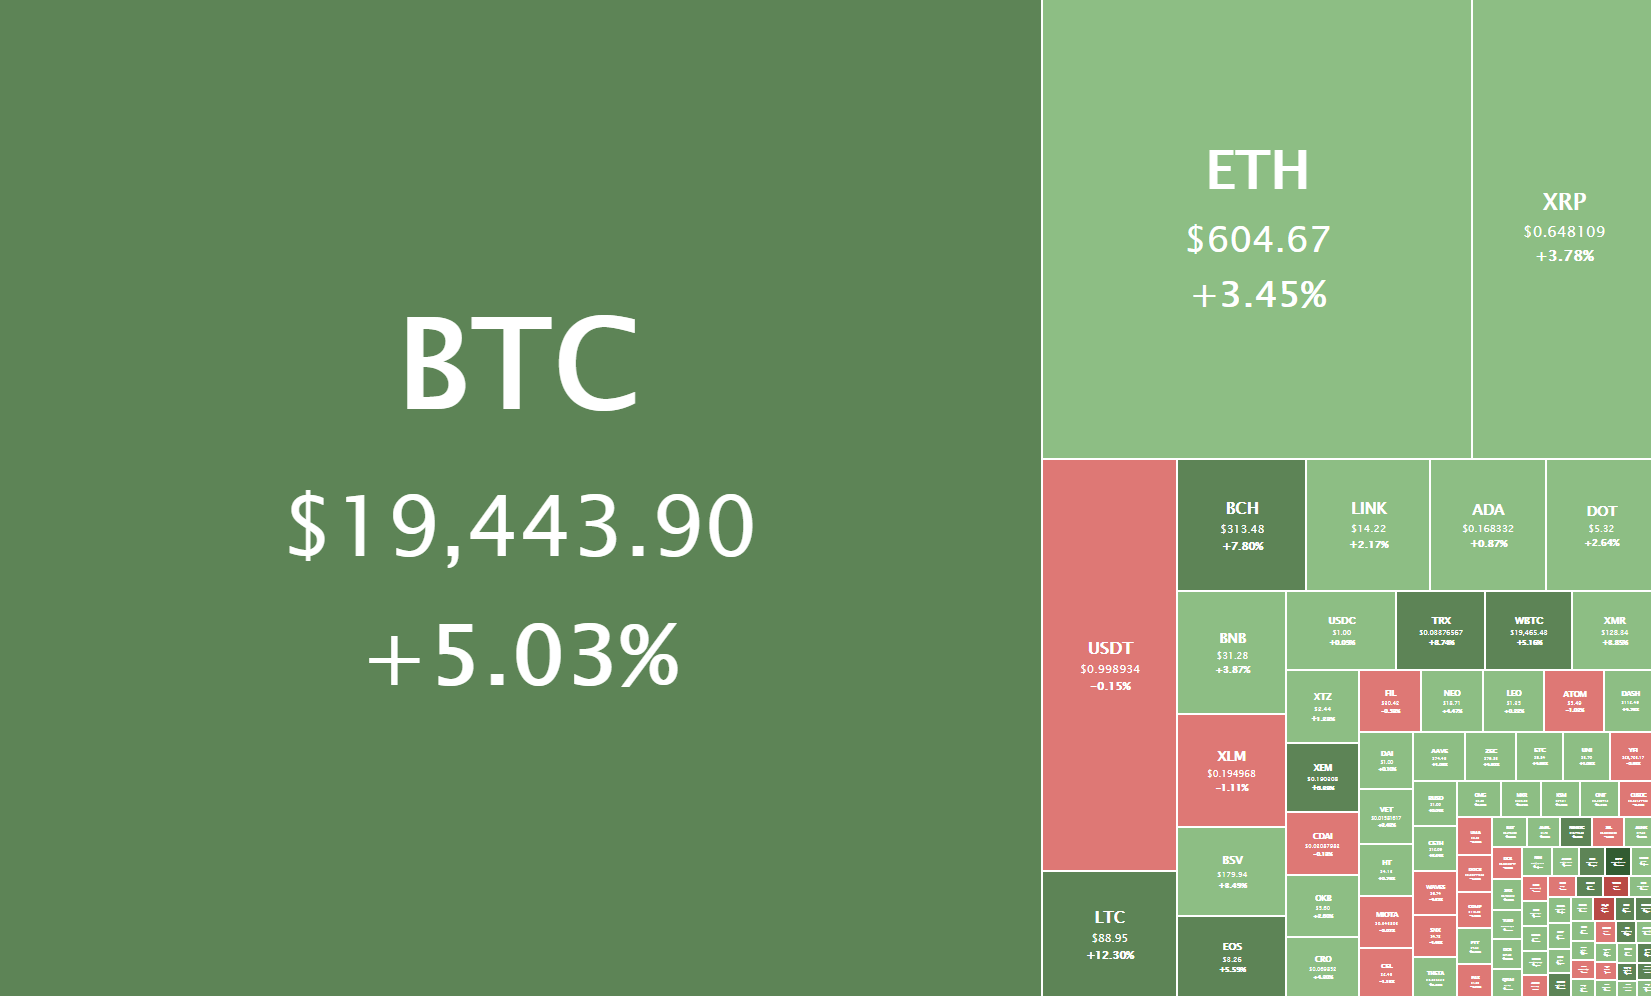
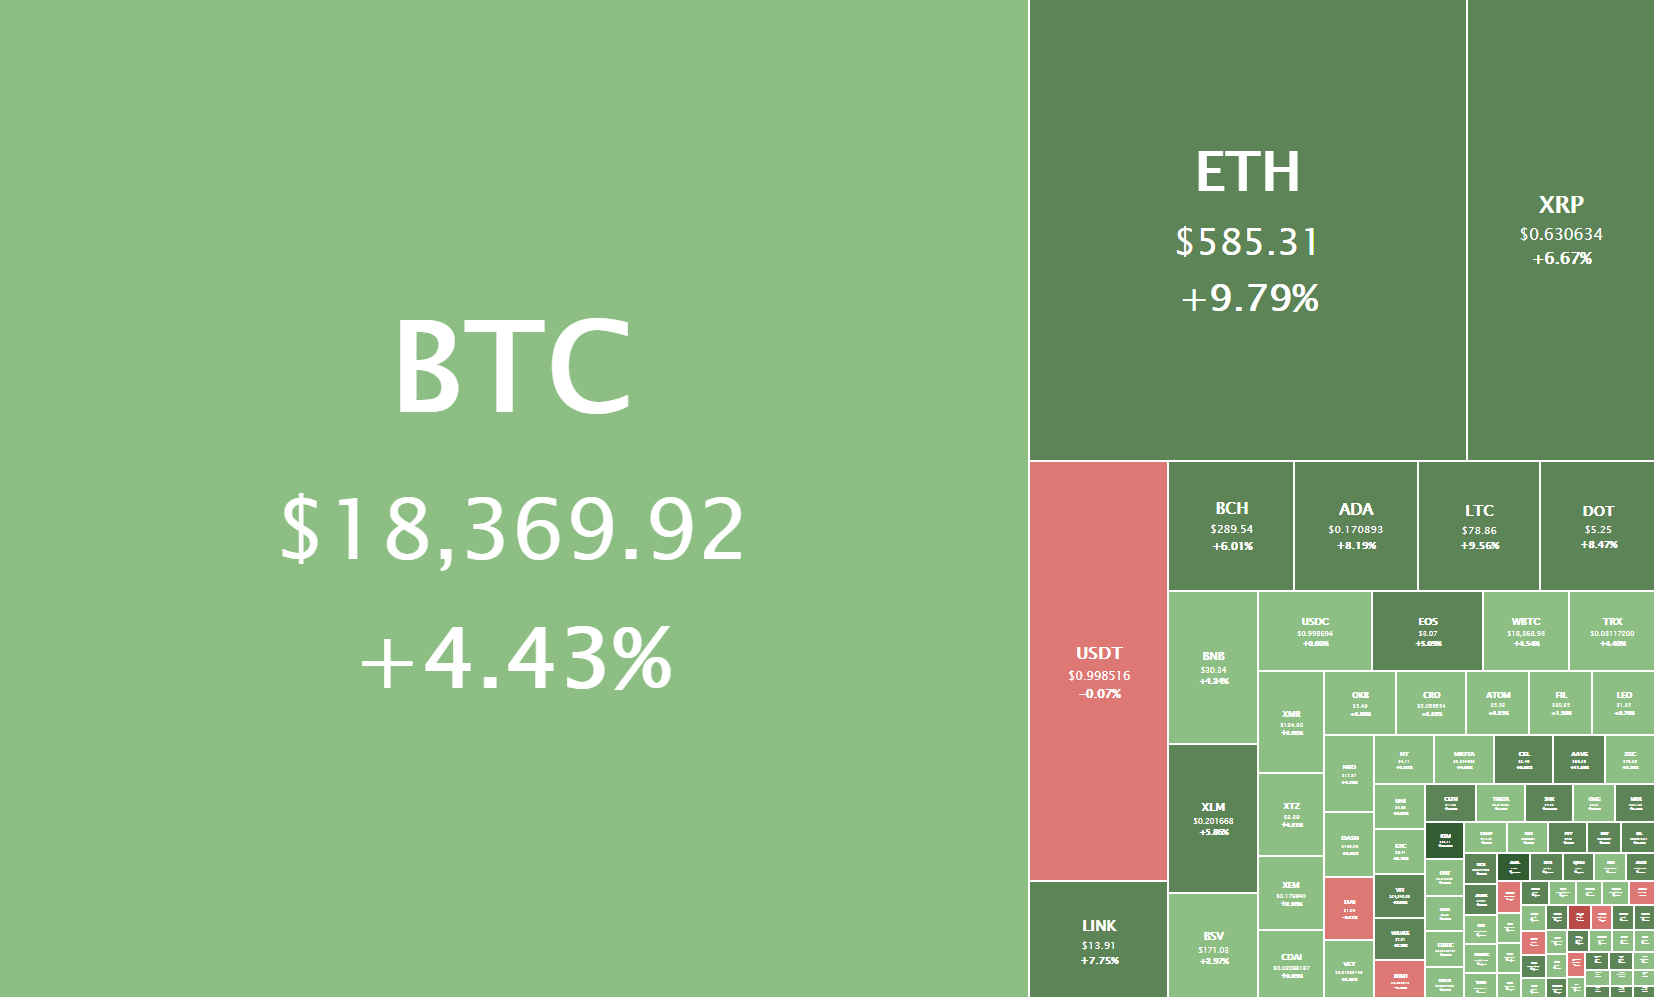
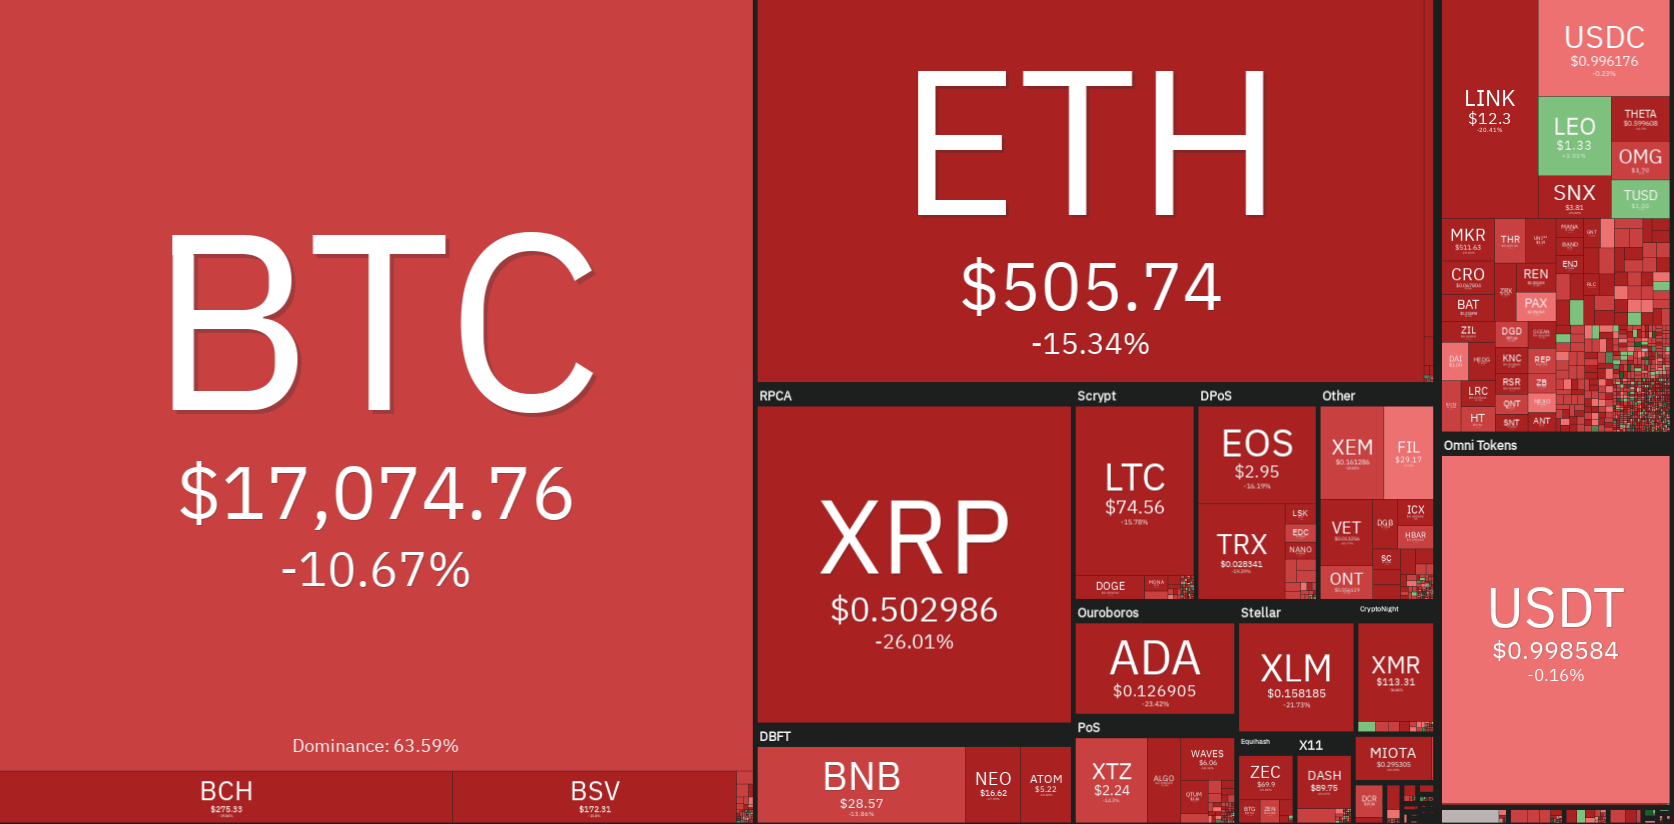
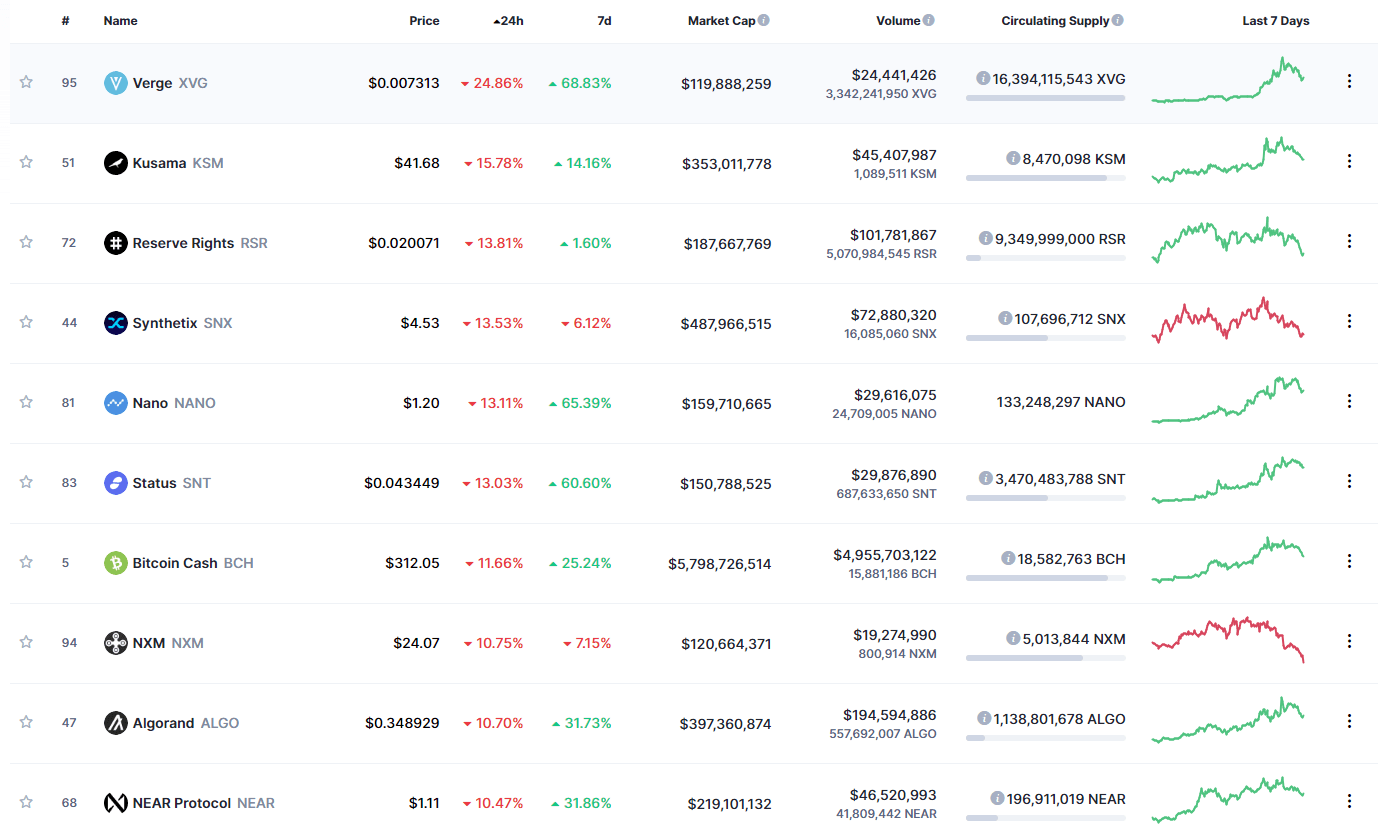
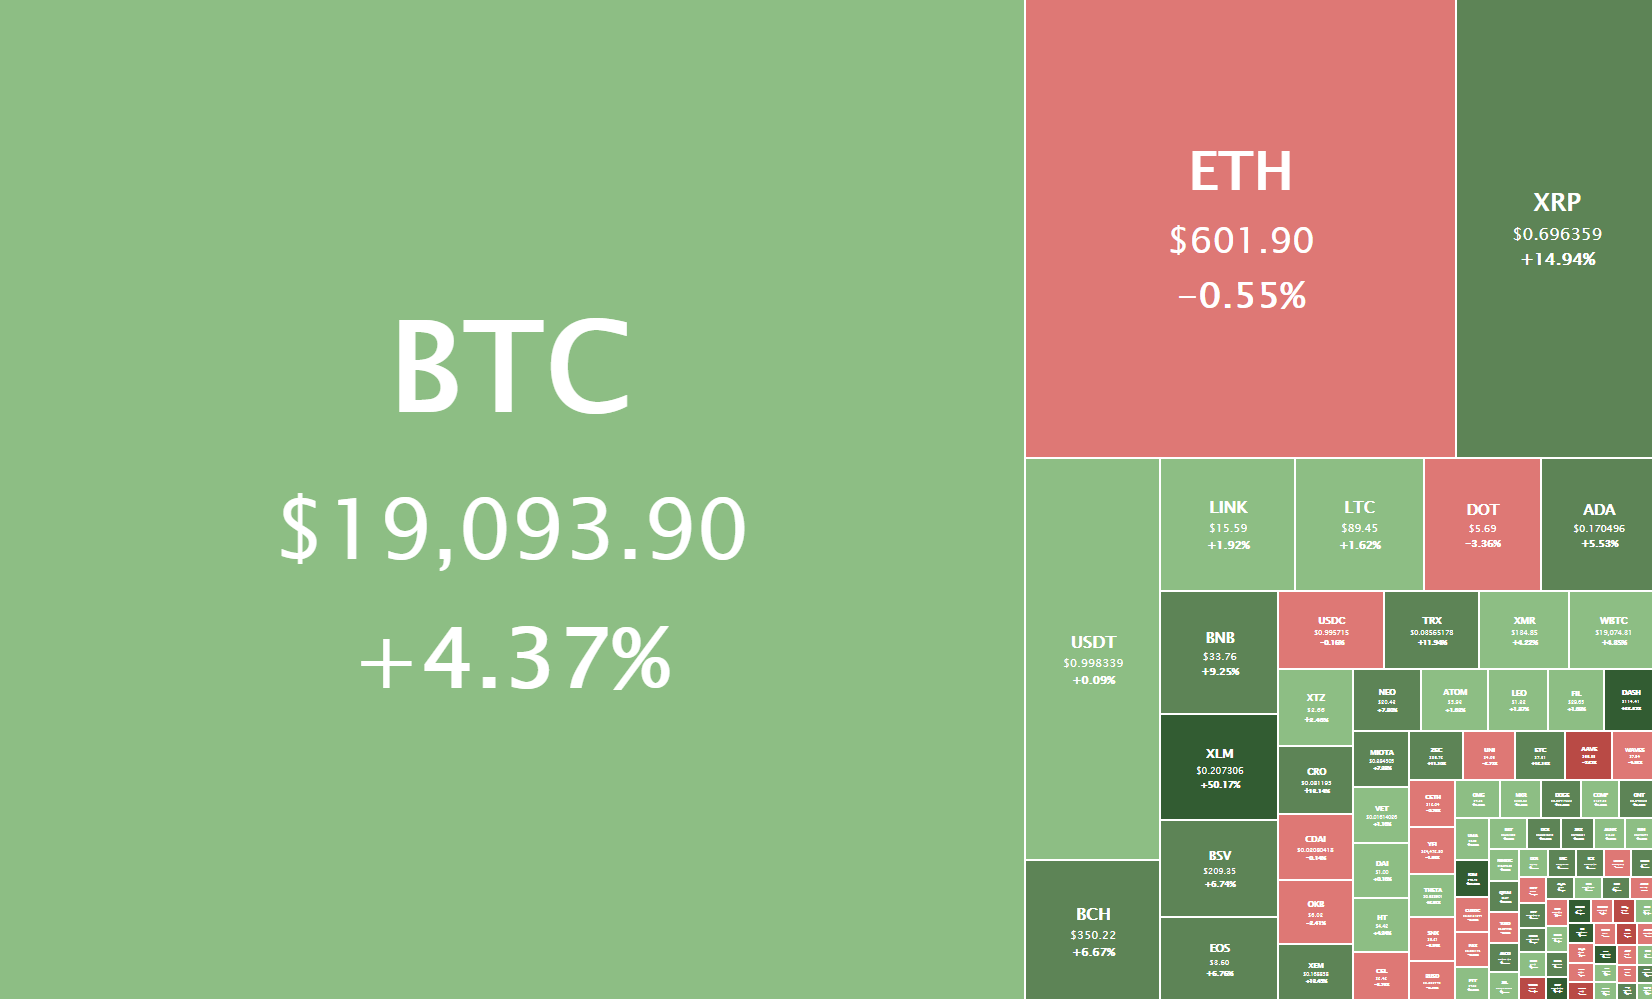
Daily Crypto Sector Heat Map
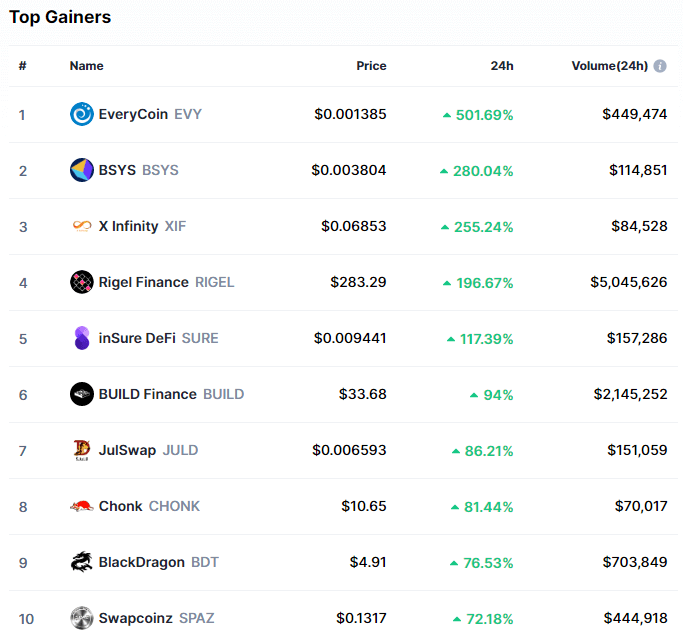
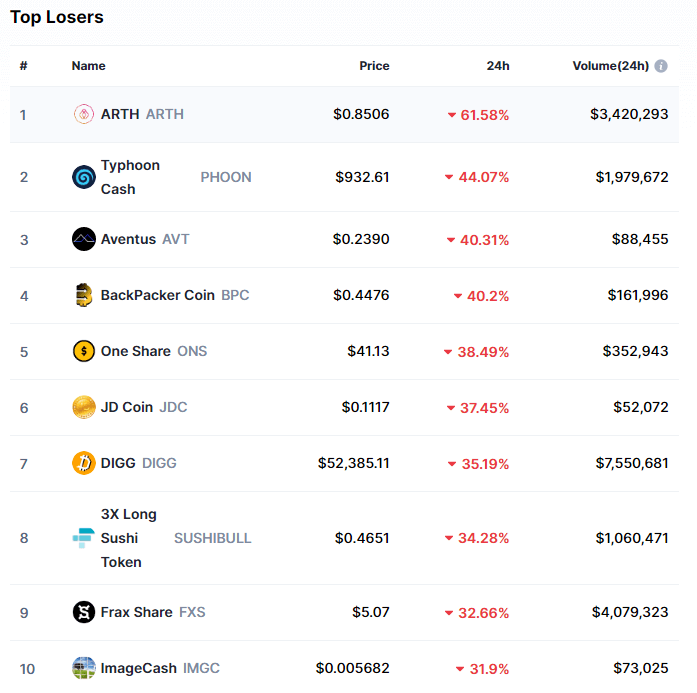
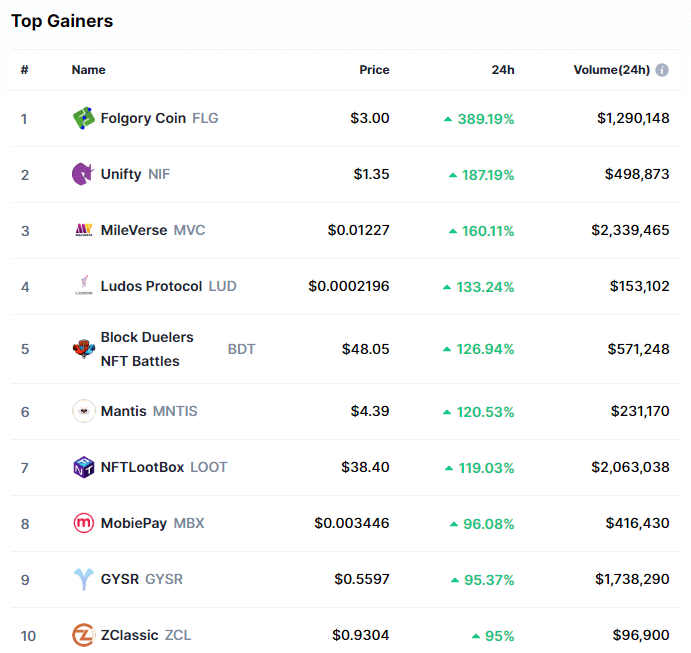
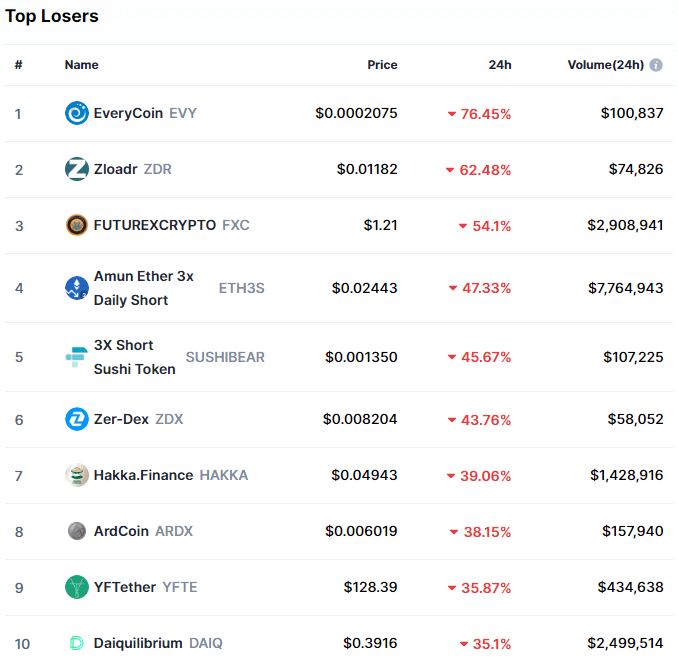
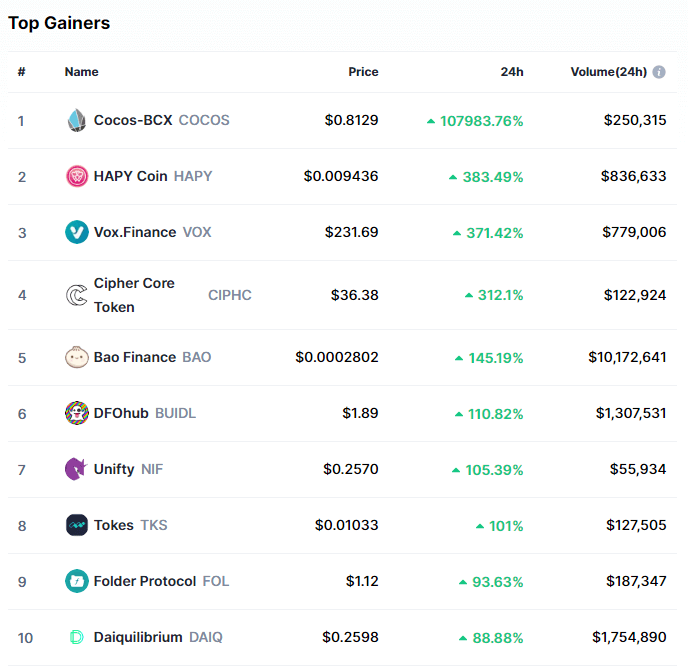
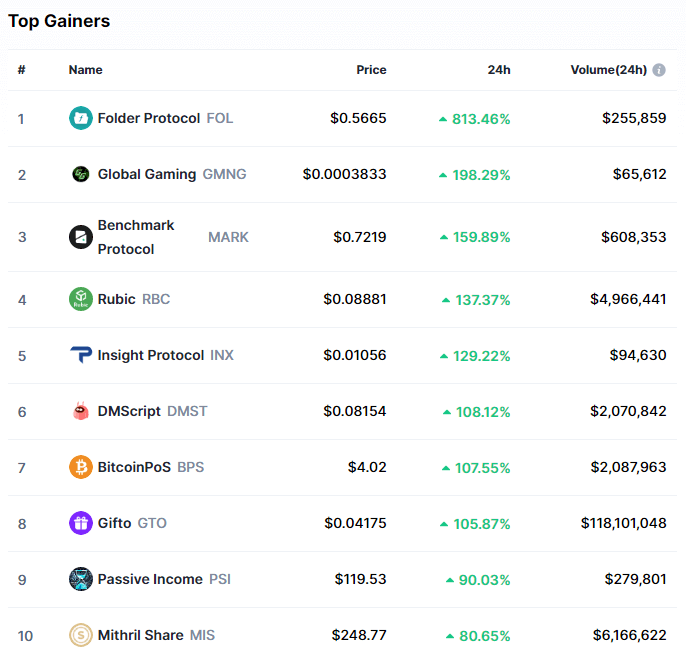
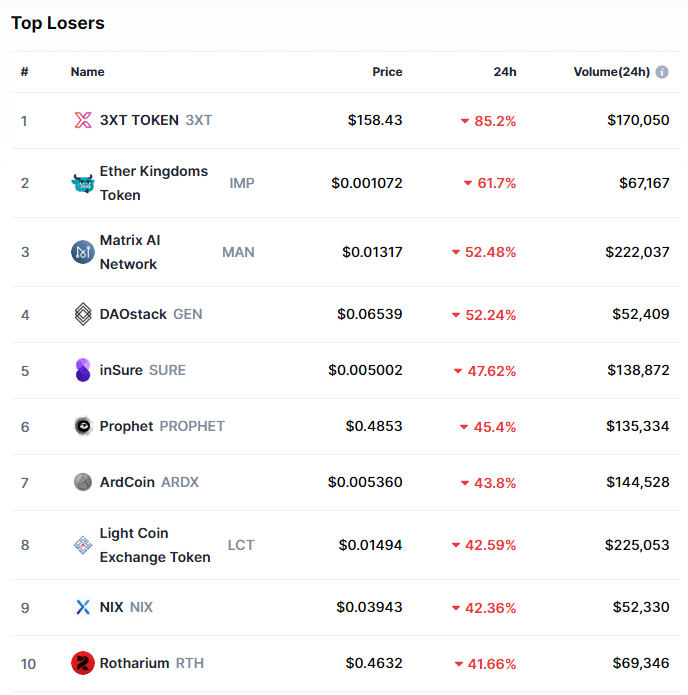
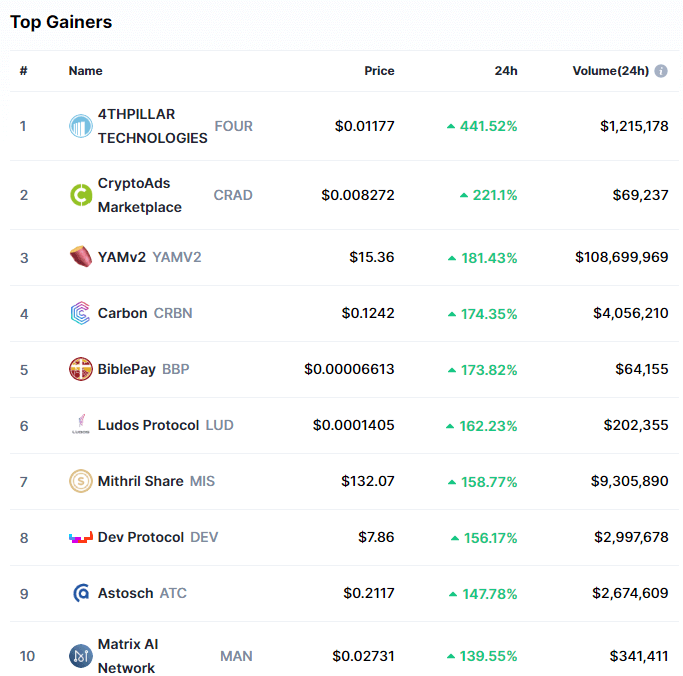
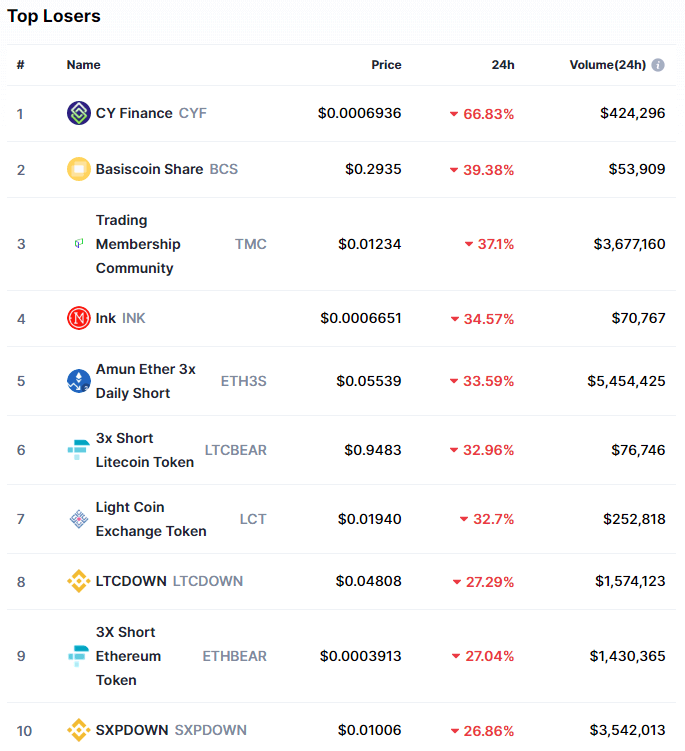
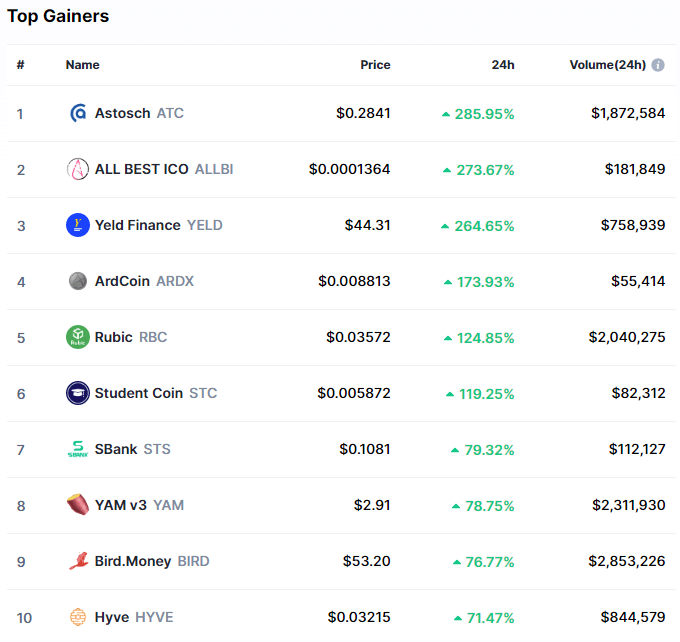
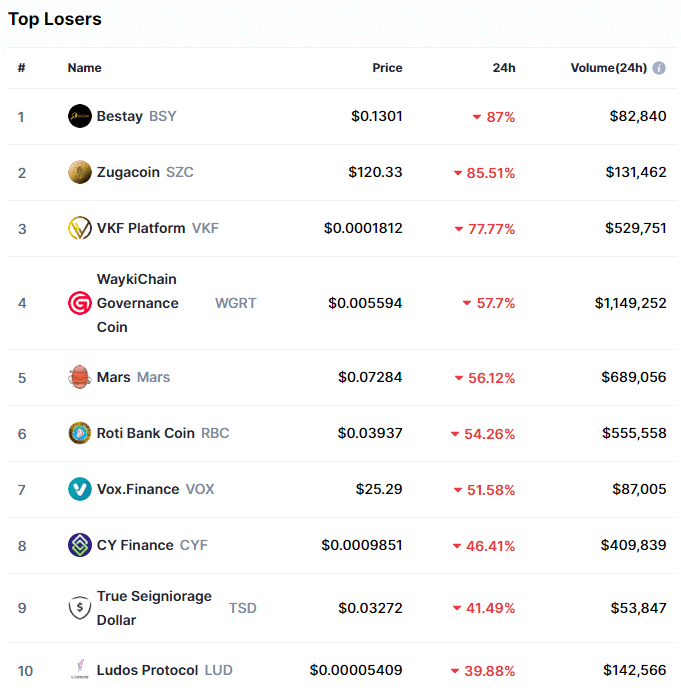
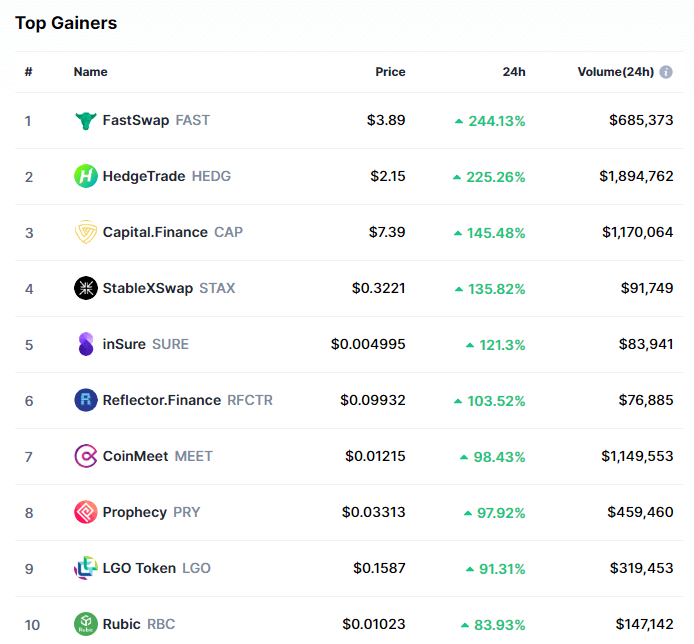
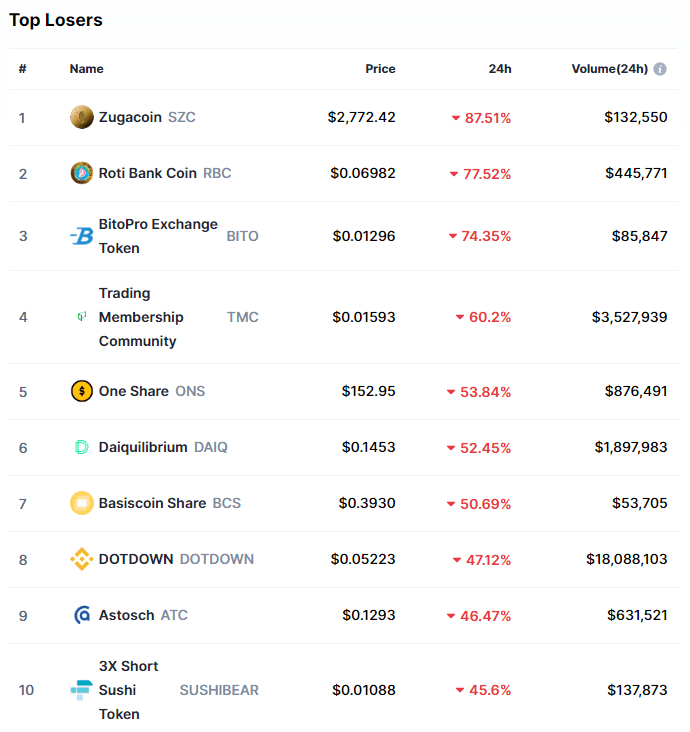
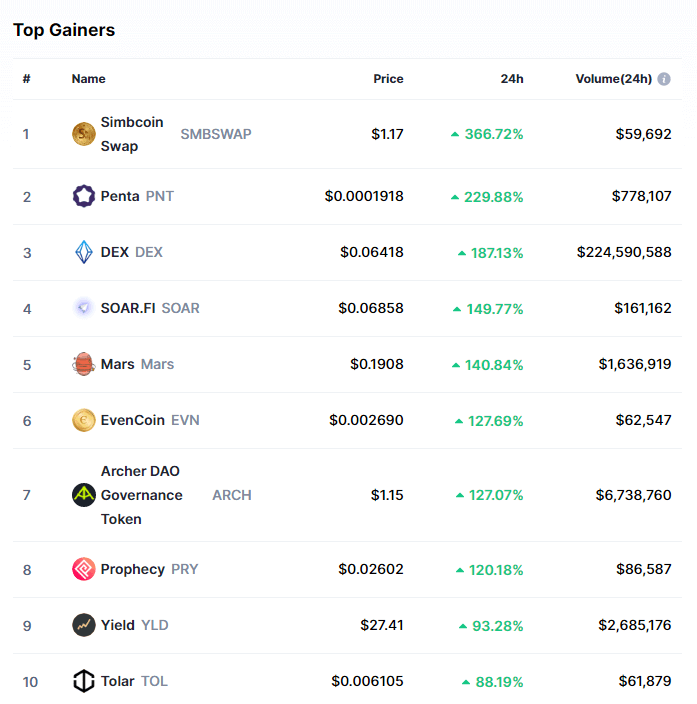
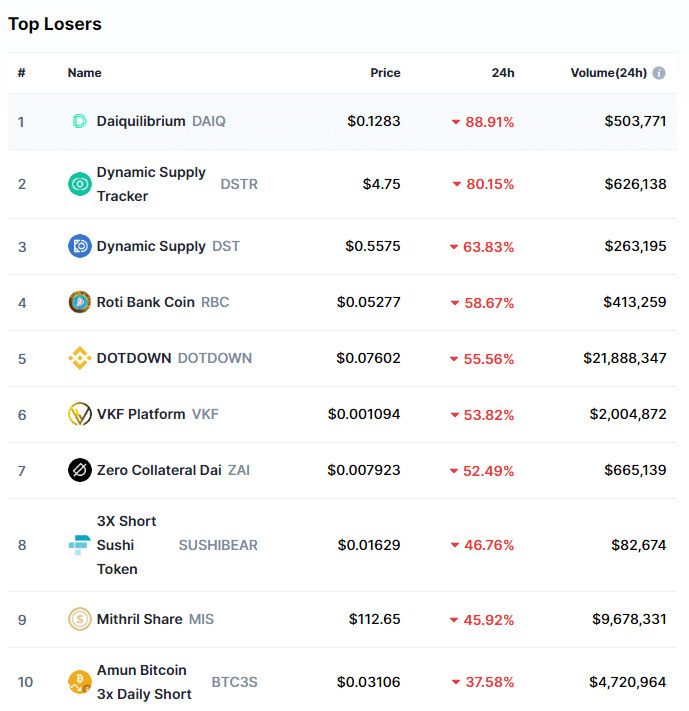
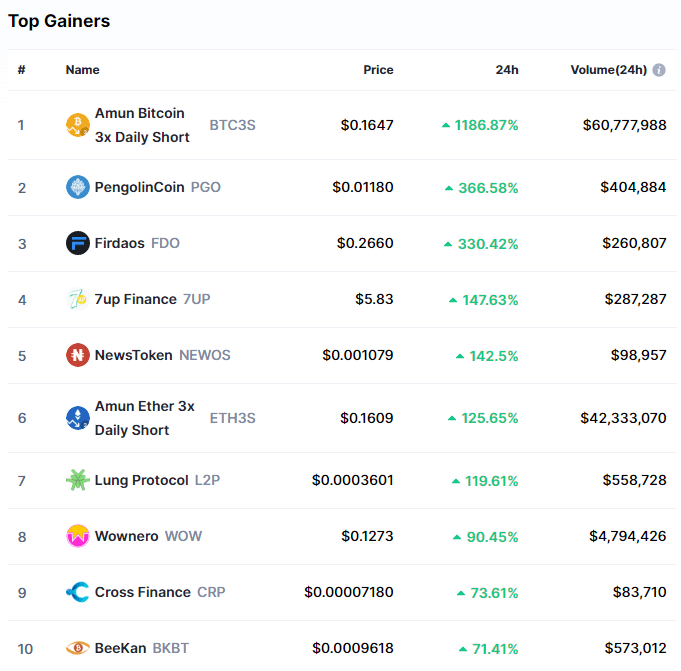
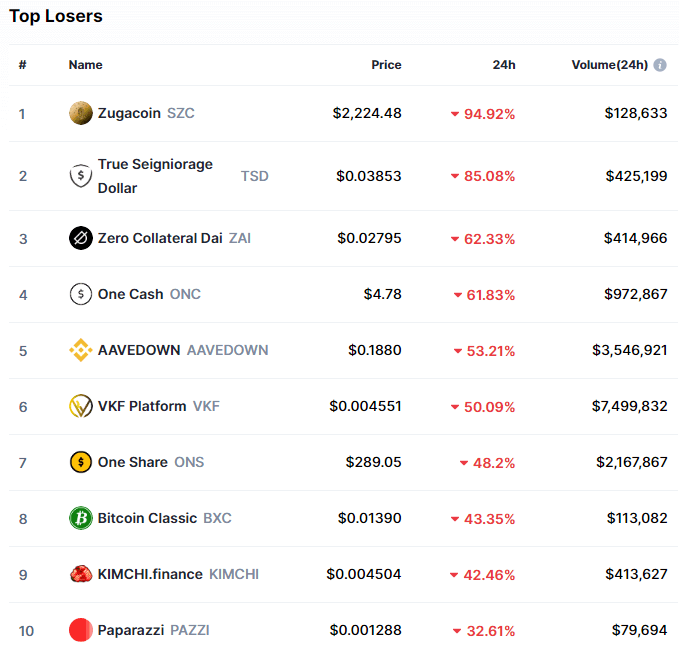
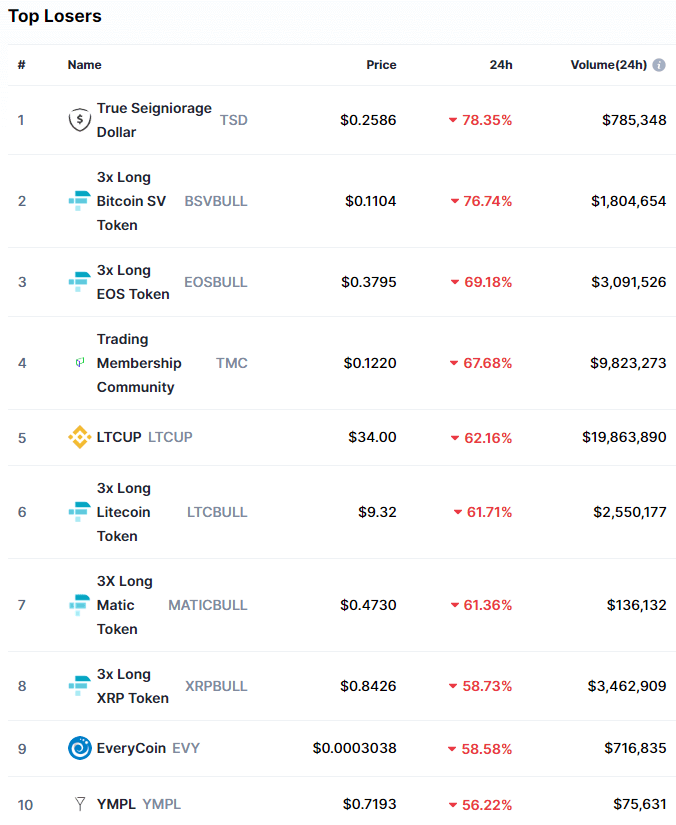
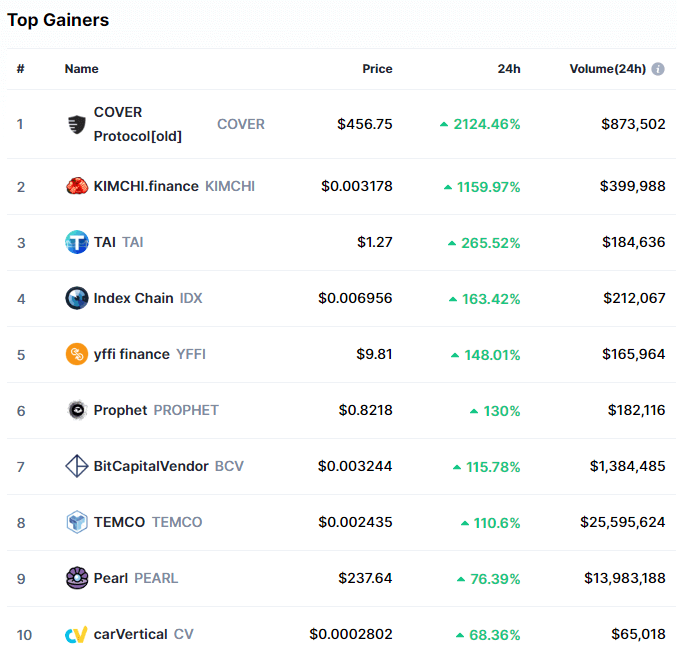
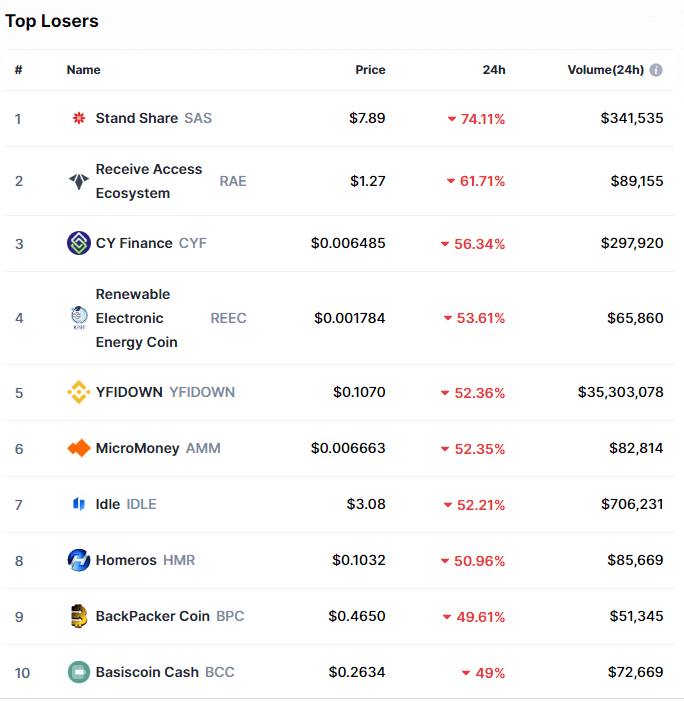
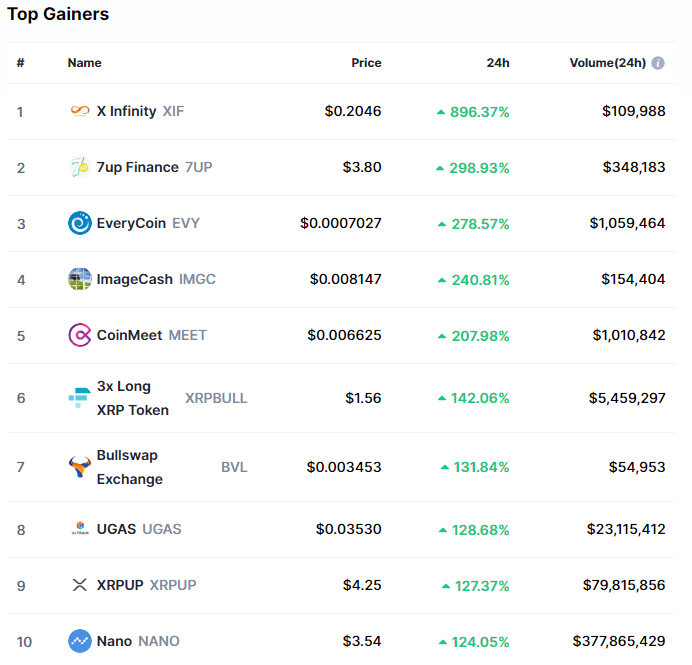
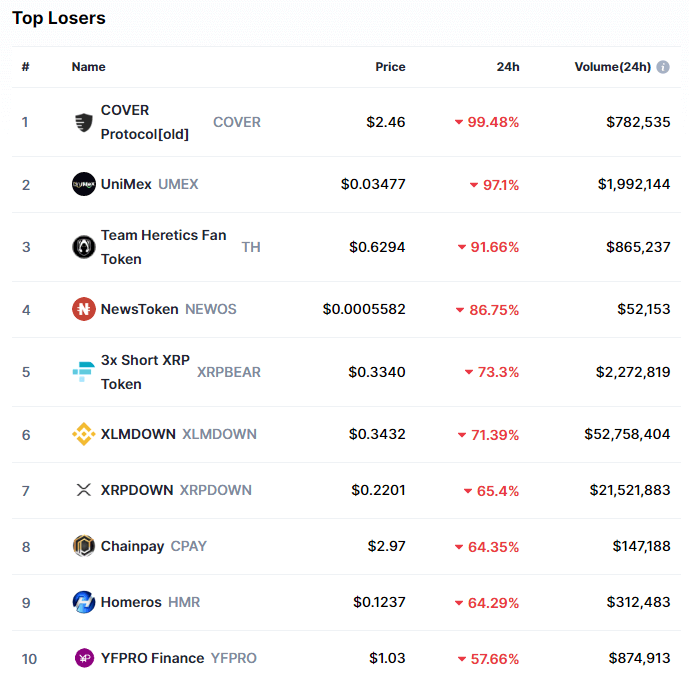
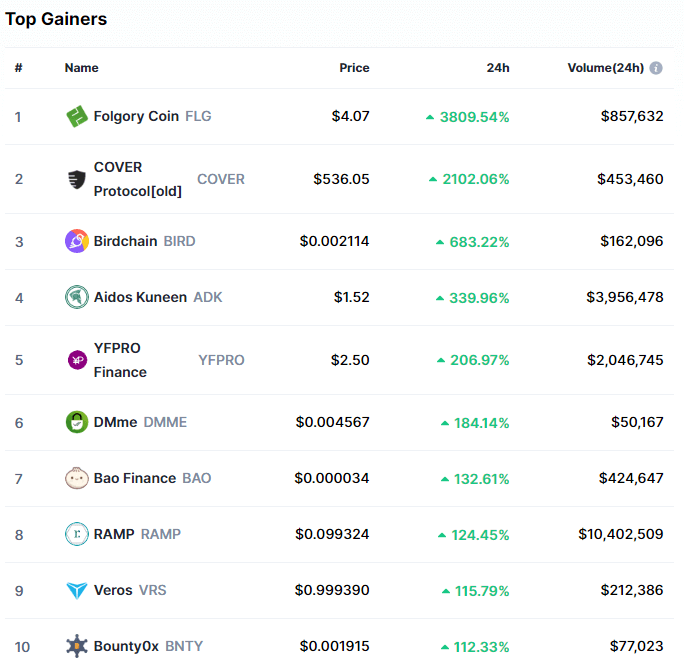
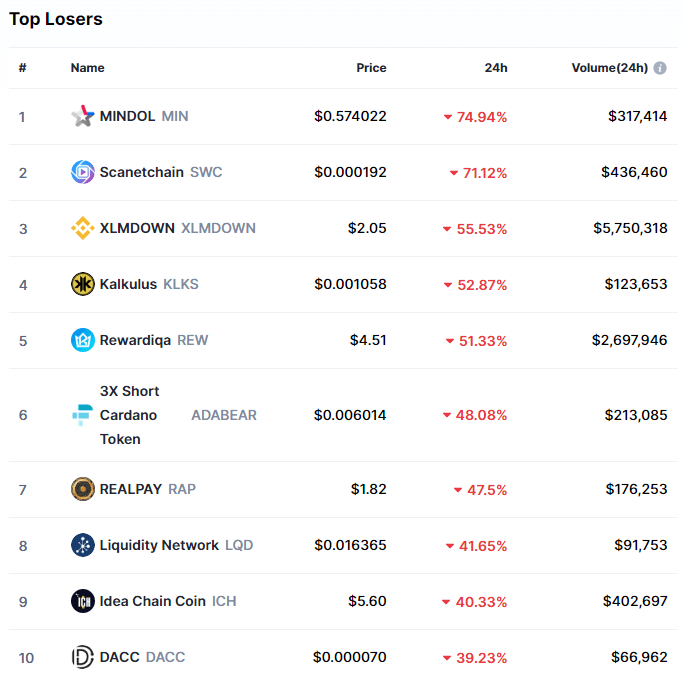
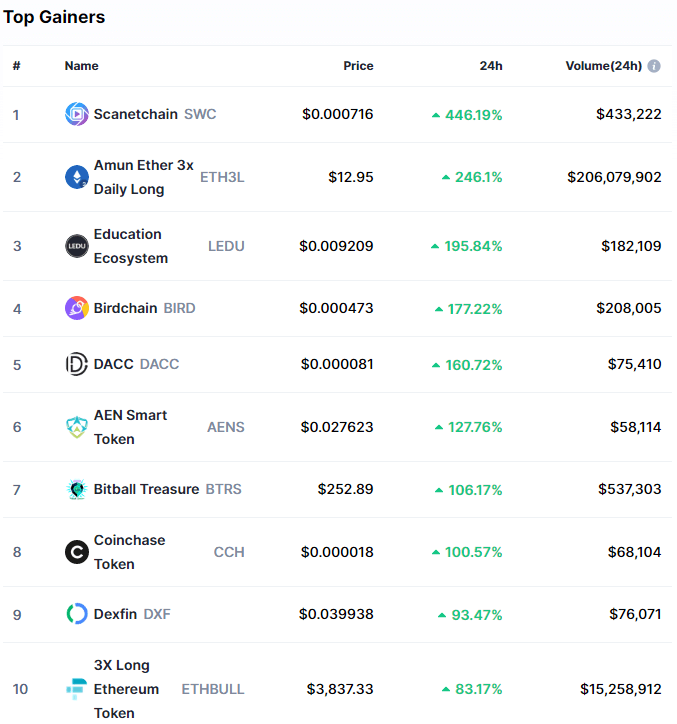
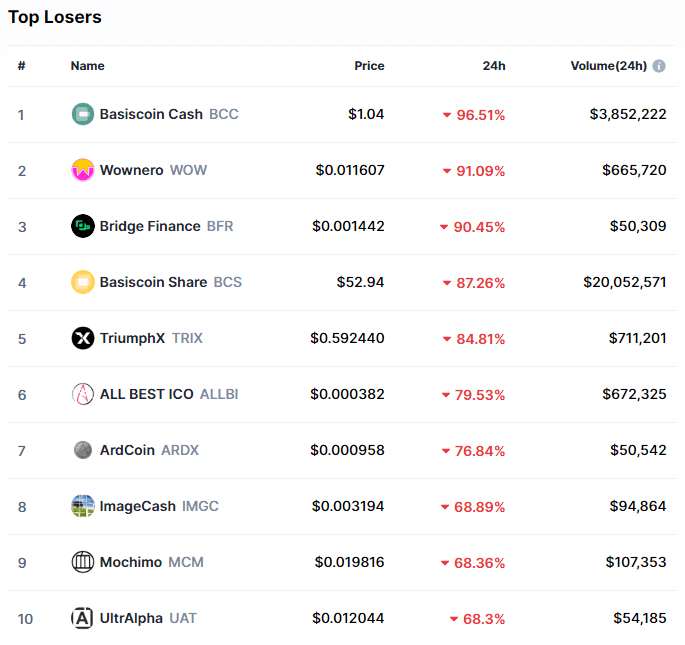
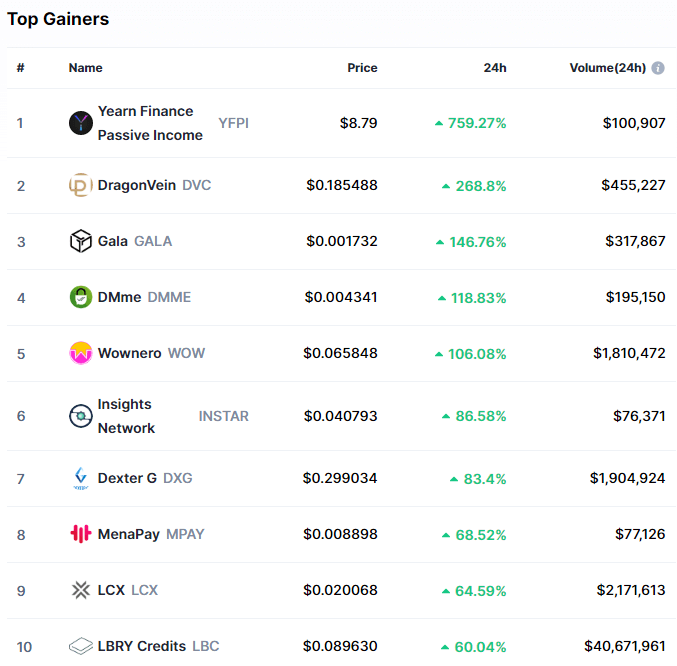
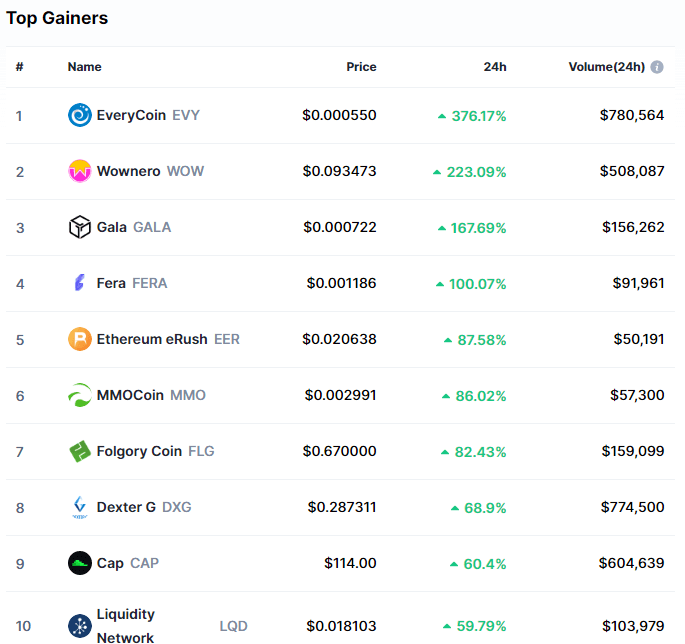
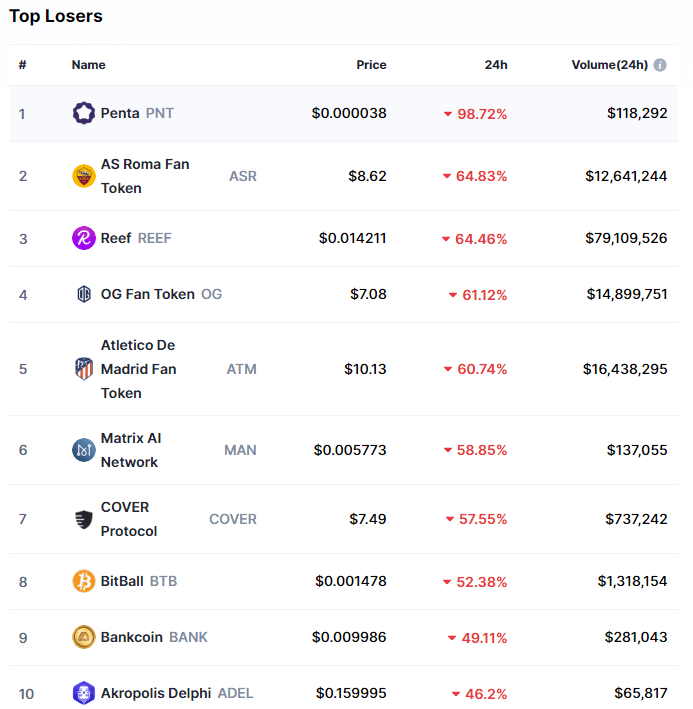
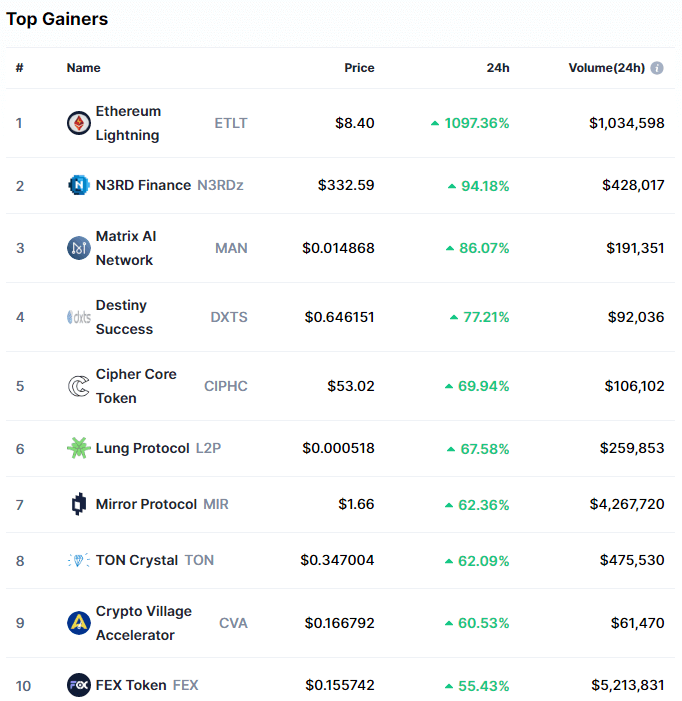
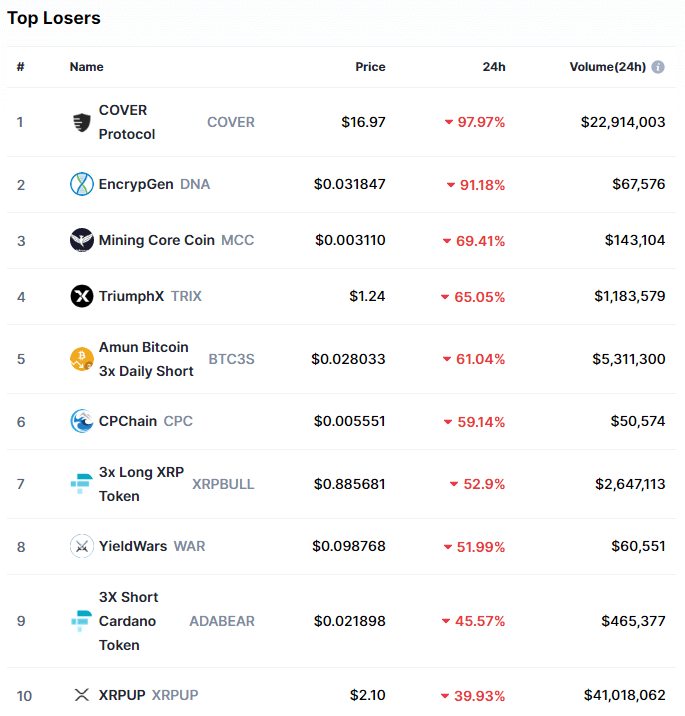
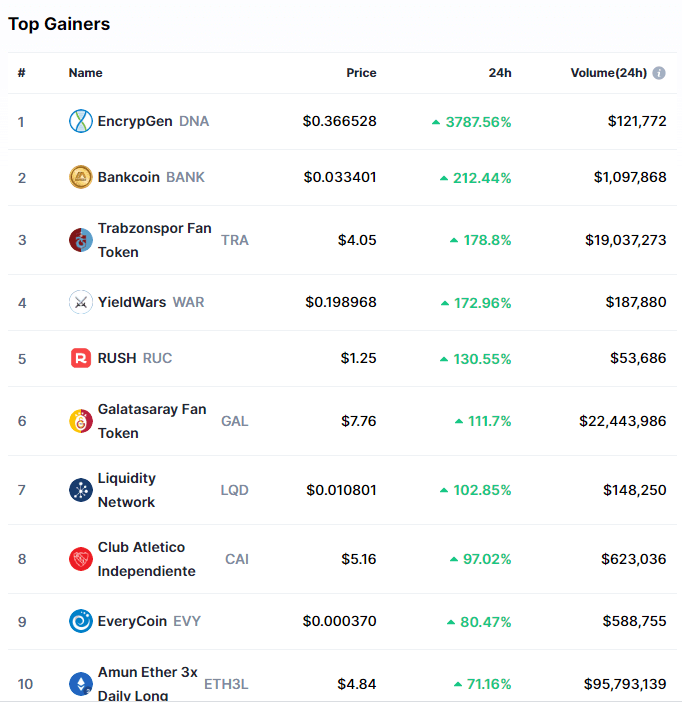
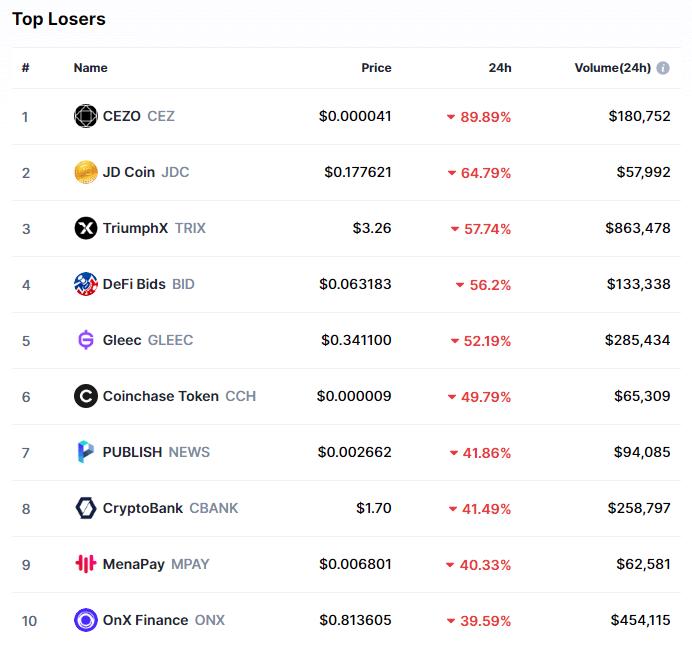
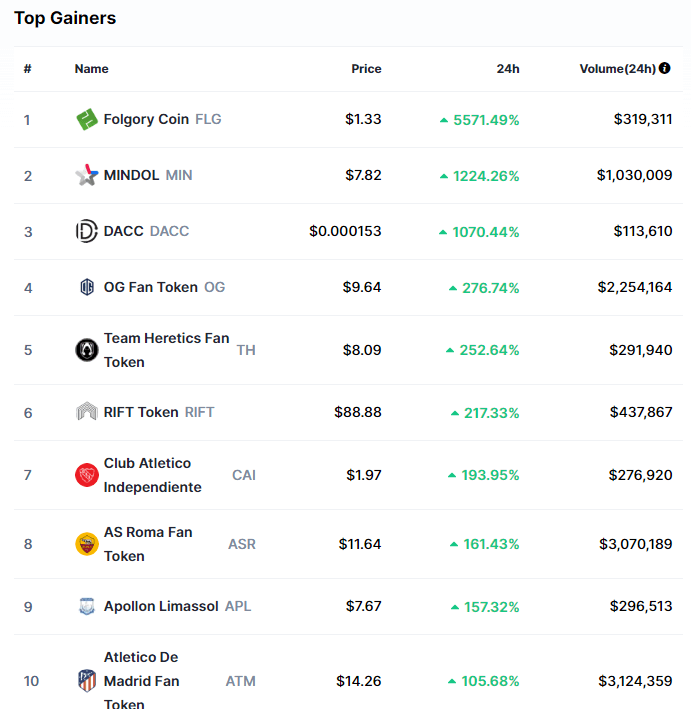
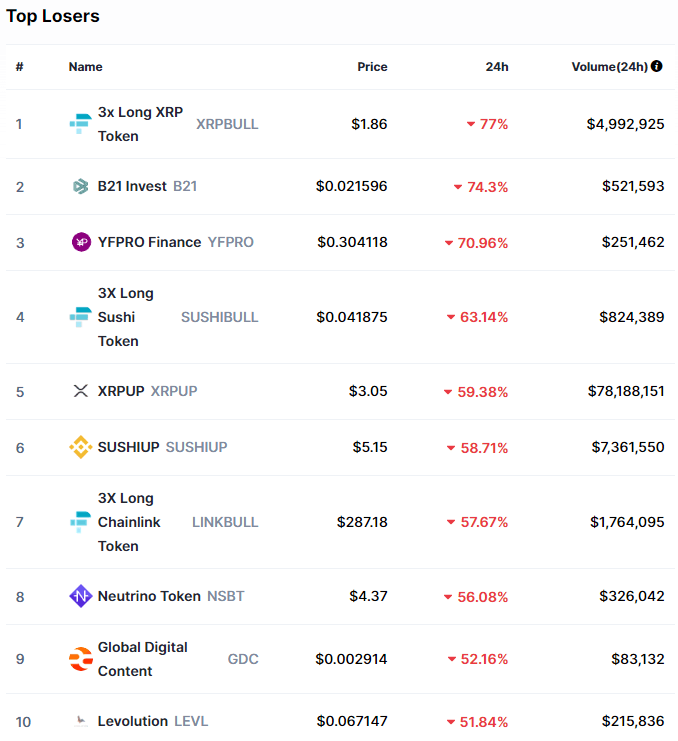
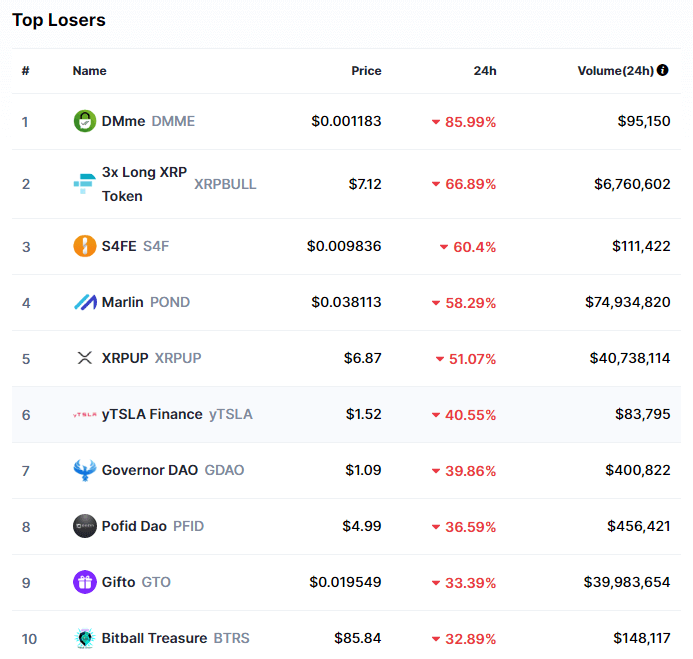
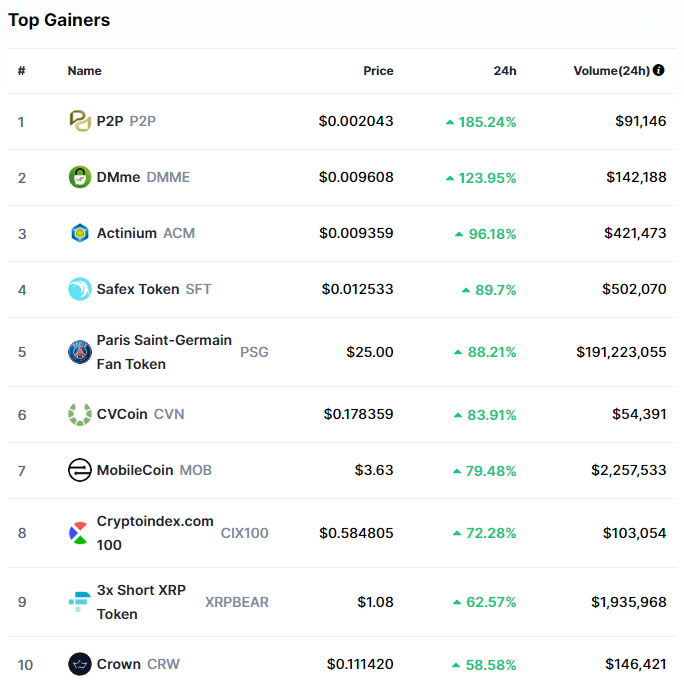
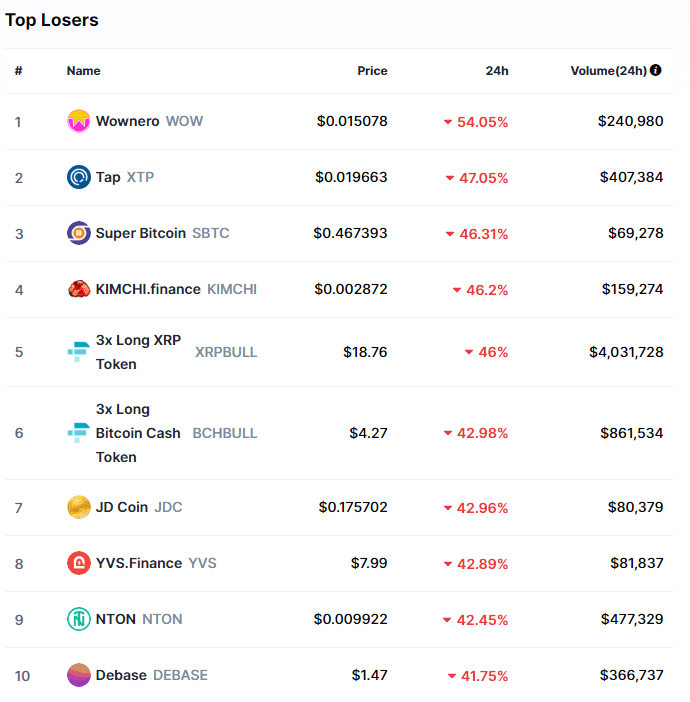
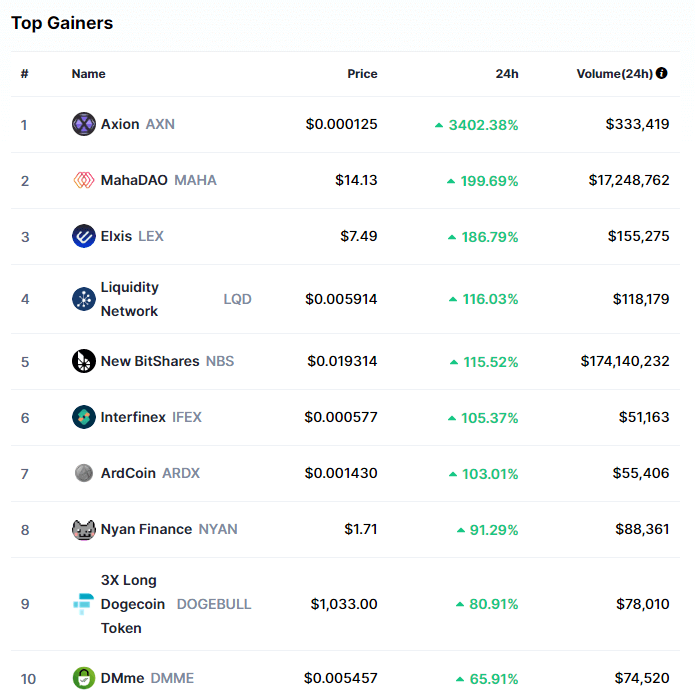
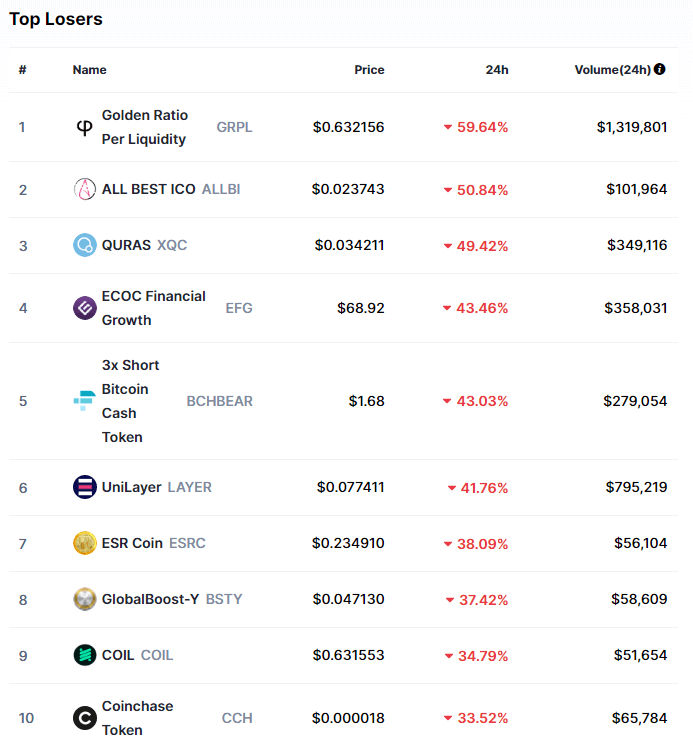
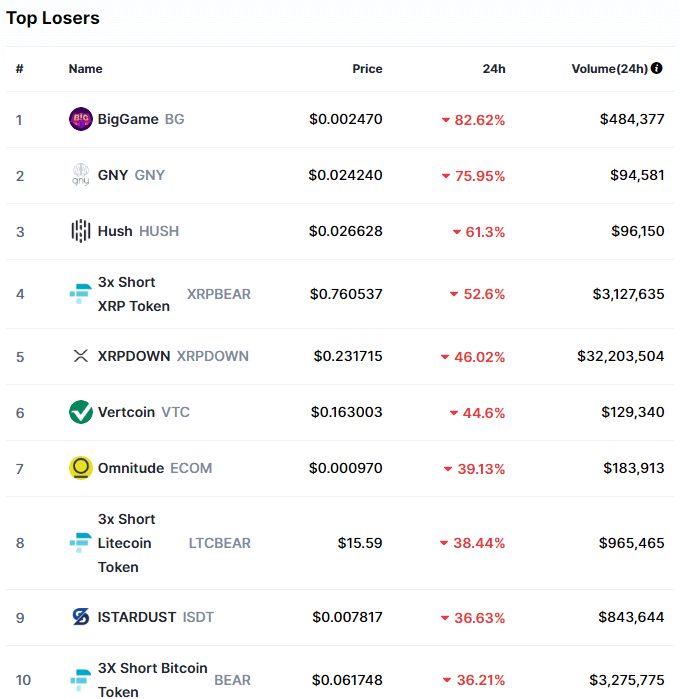
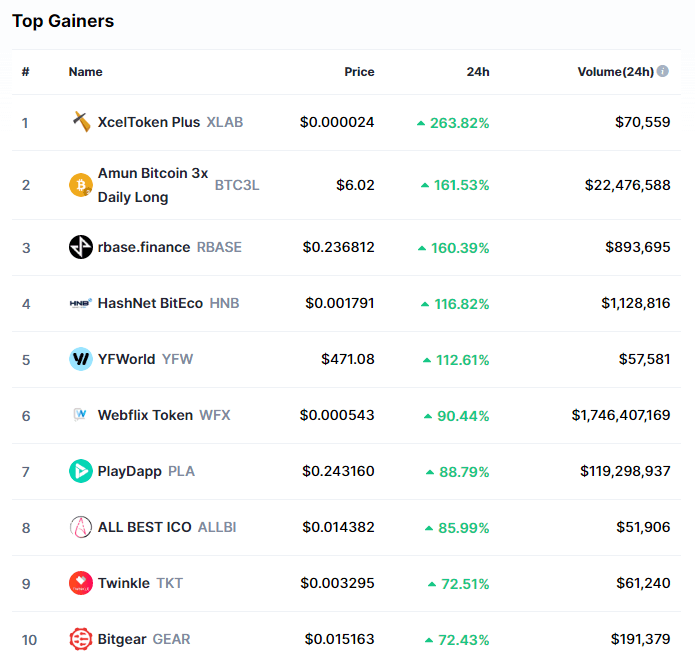
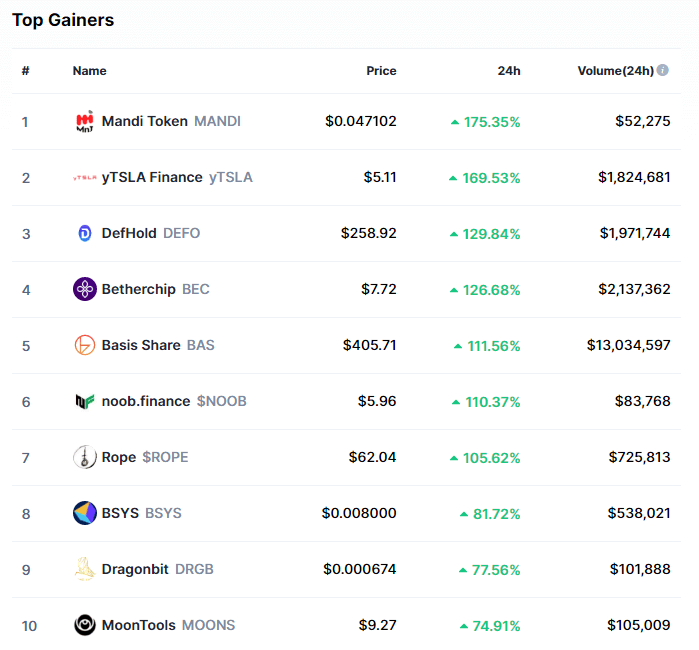
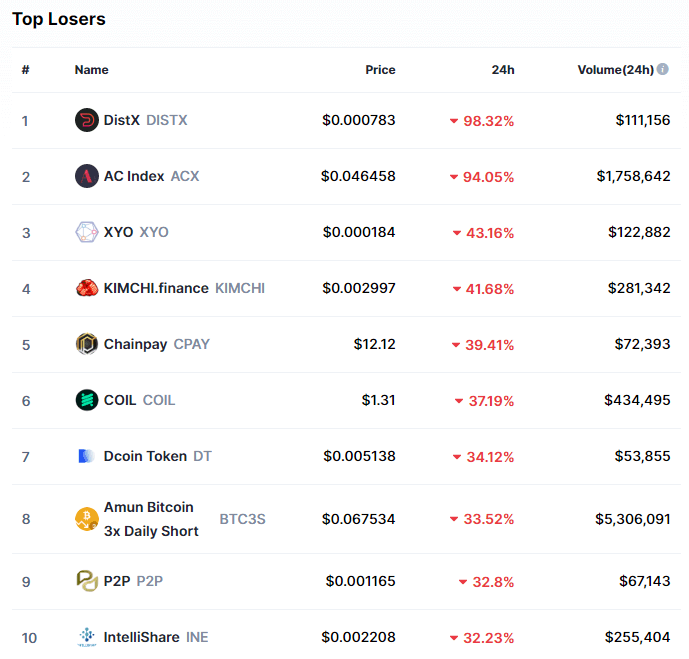
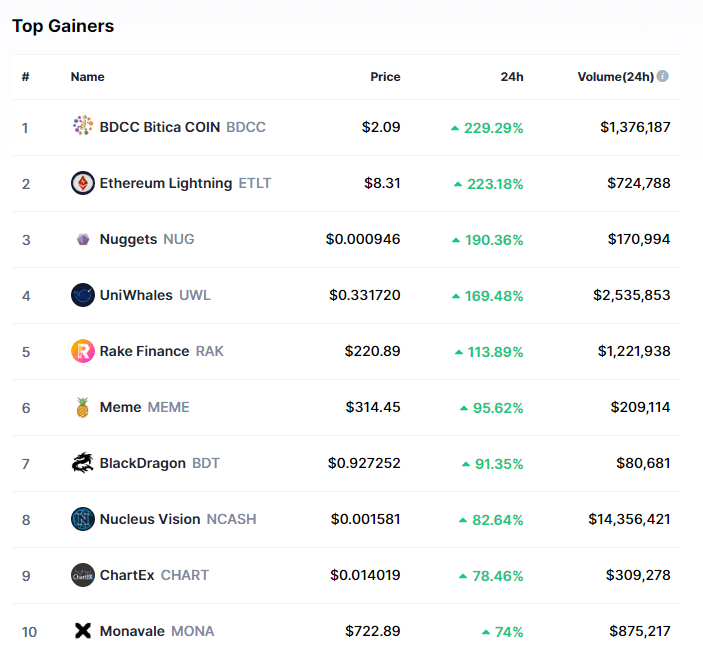
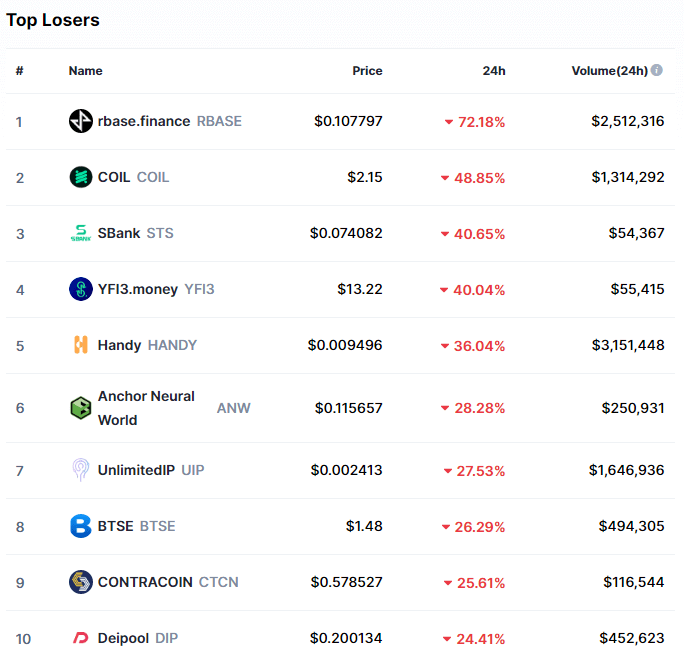
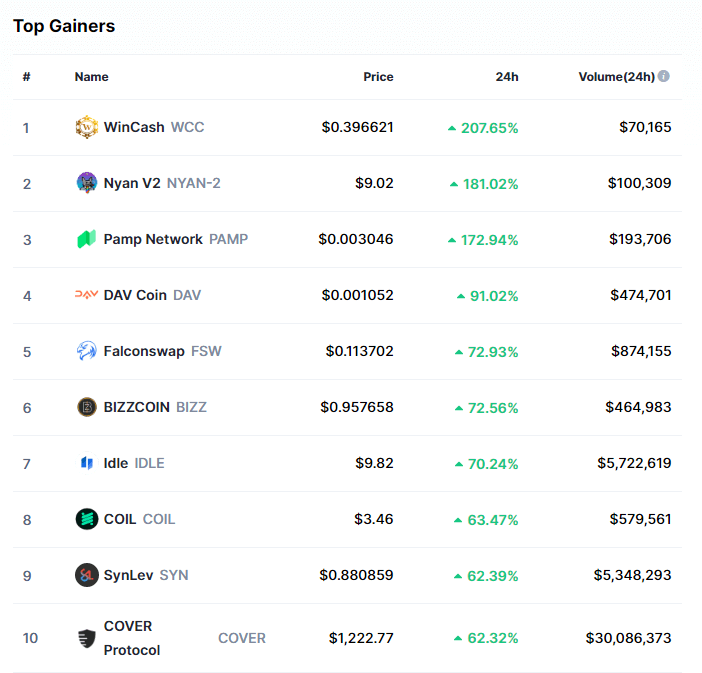
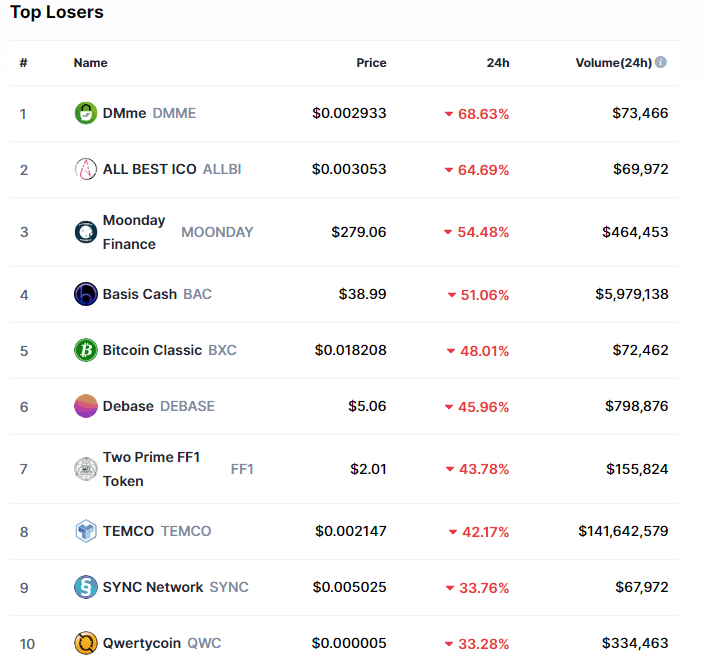
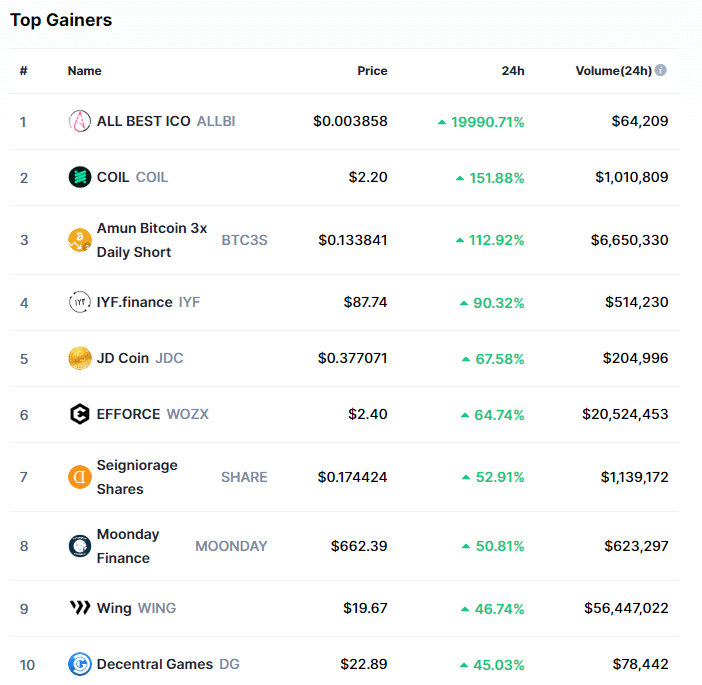
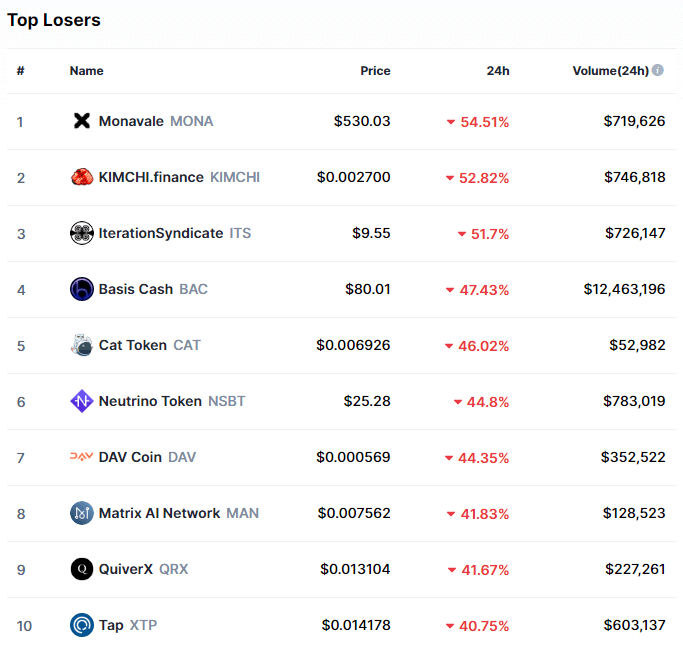
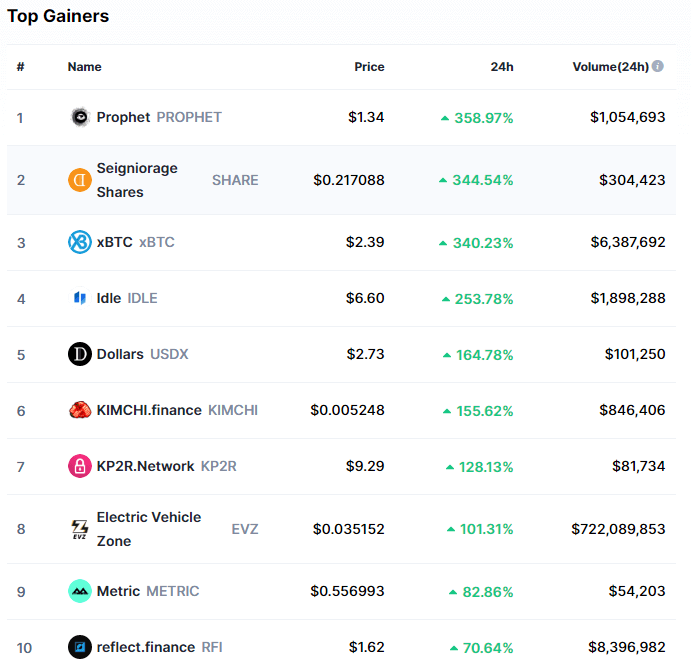
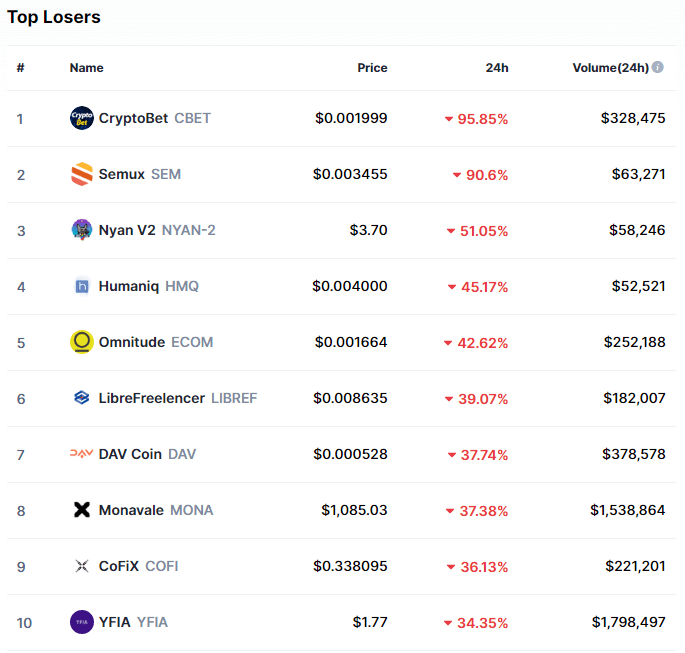
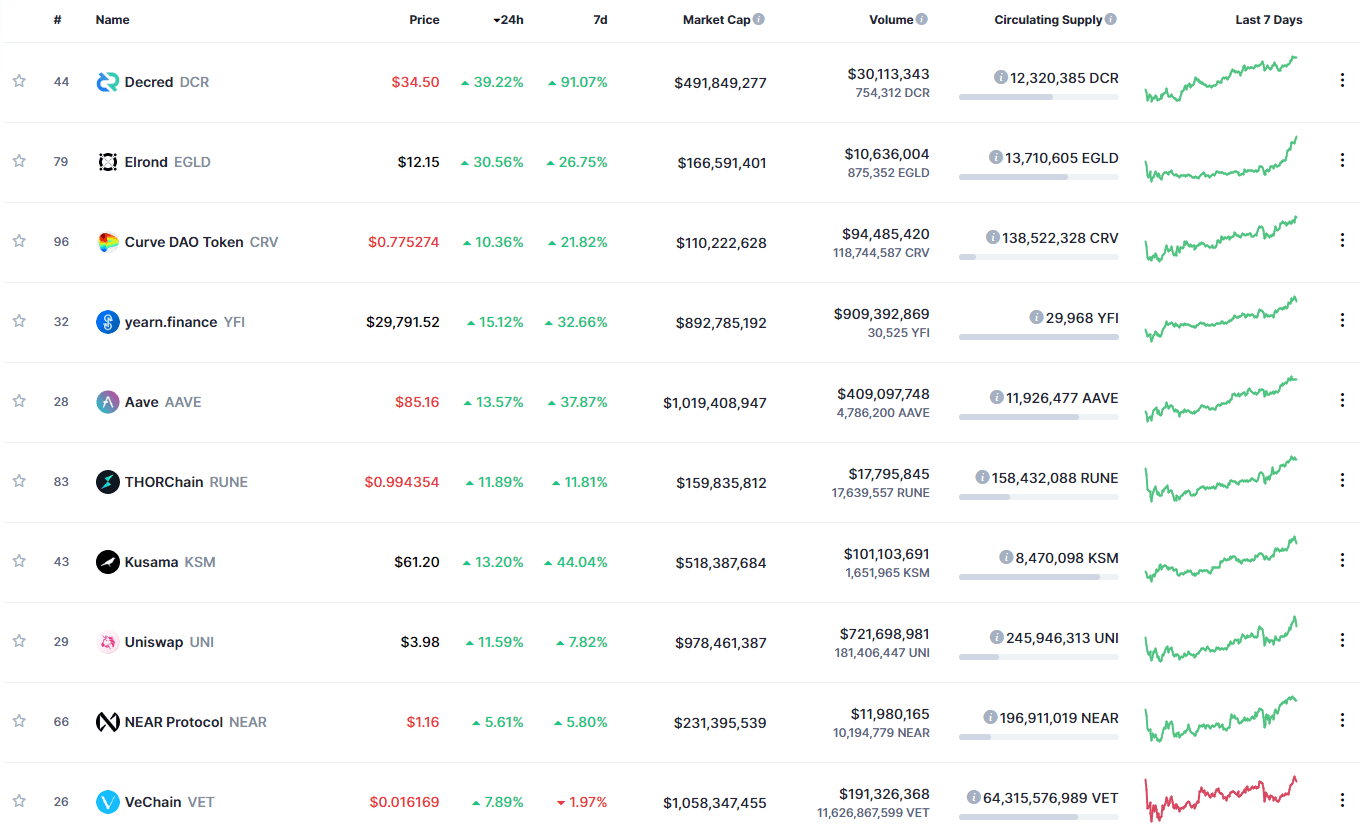
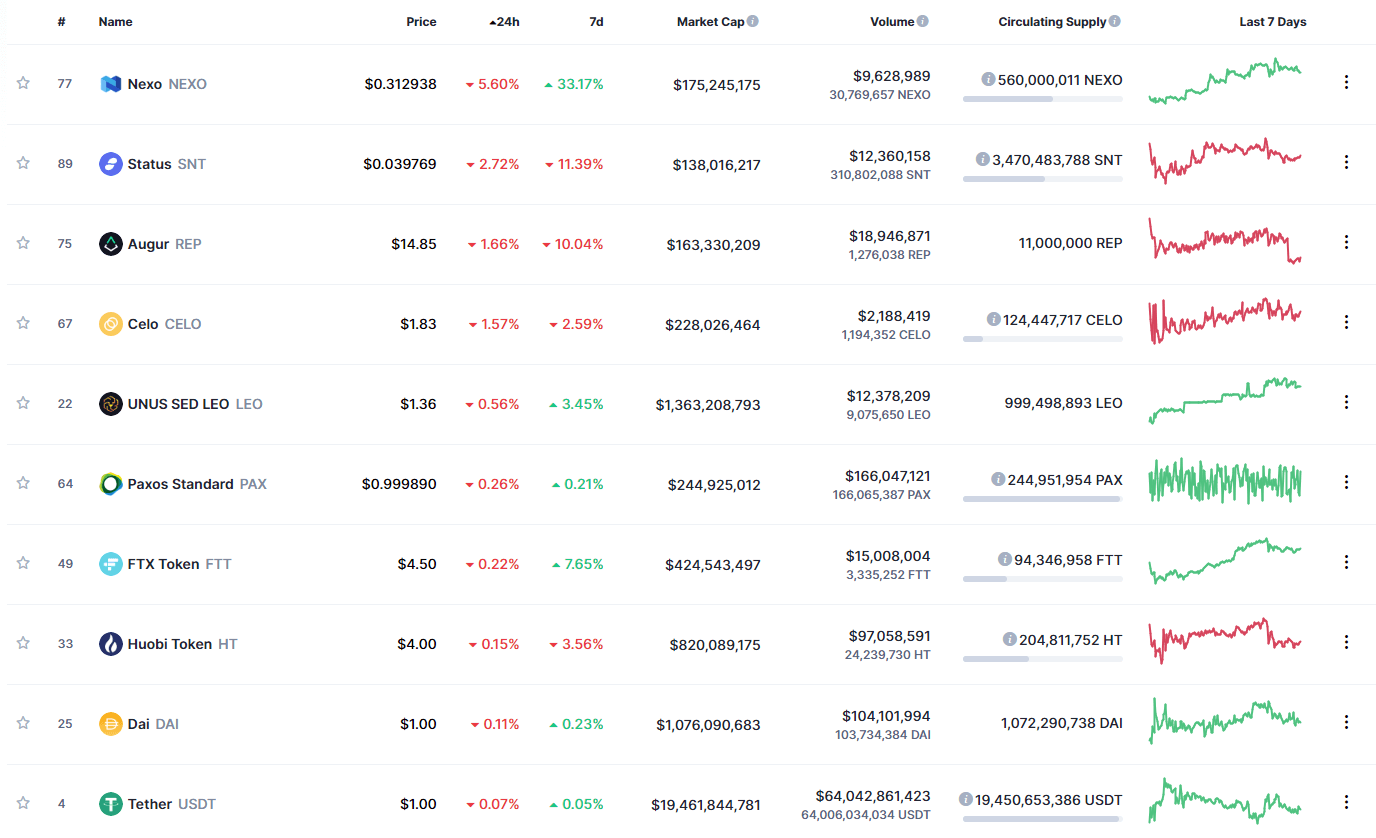
3X Long Dogecoin Token gained 905.02% in the past 24 hours, making it the most prominent daily crypto gainer by far. It is followed by Dogecoin’s 513.17% and DOGEFI’s 369.90% gain. On the other hand, 3X Short Dogecoin Token lost 99.85%, making it the most prominent daily loser. It is followed by Panda Yield’s loss of 83.13% and Psychic’s loss of 72.46%.
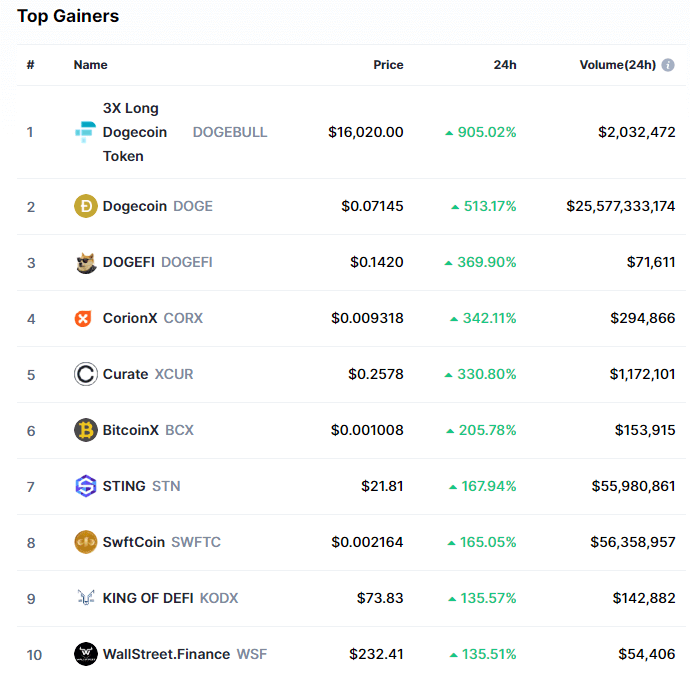
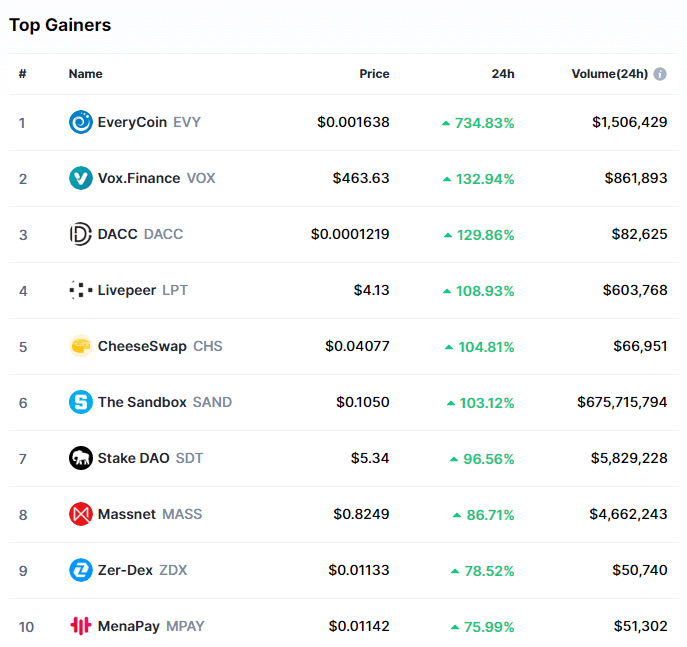
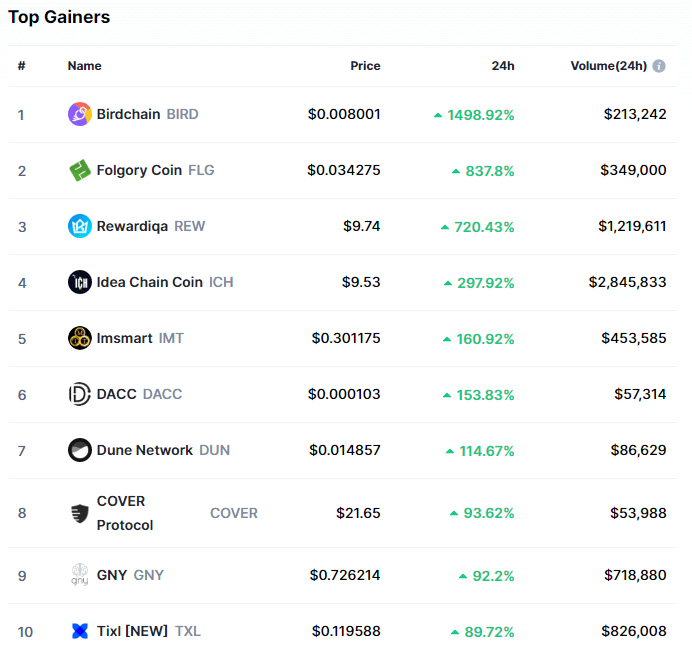
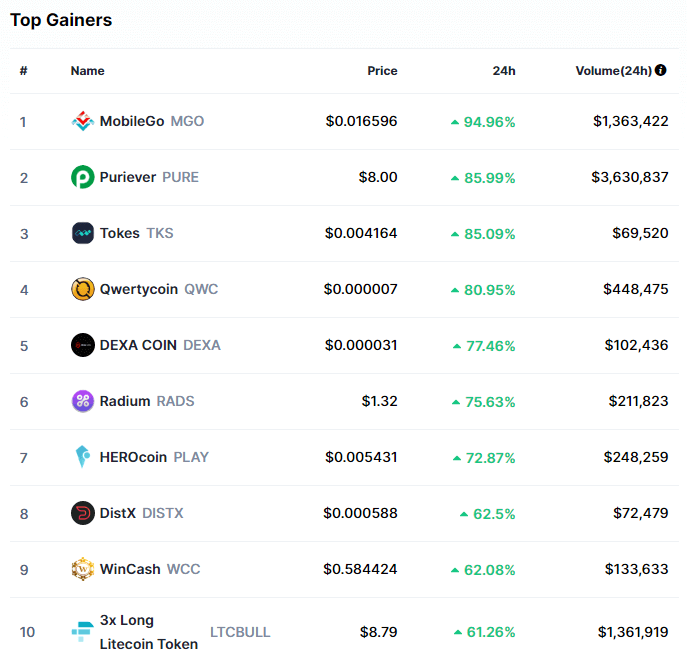
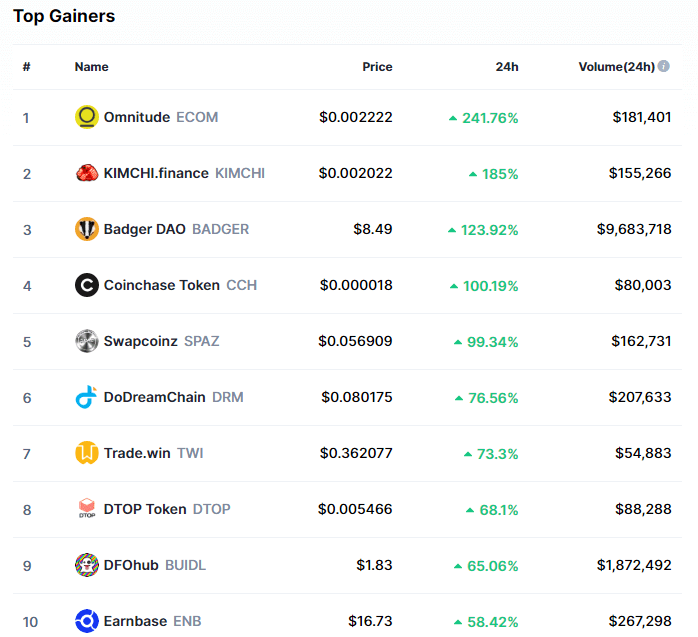
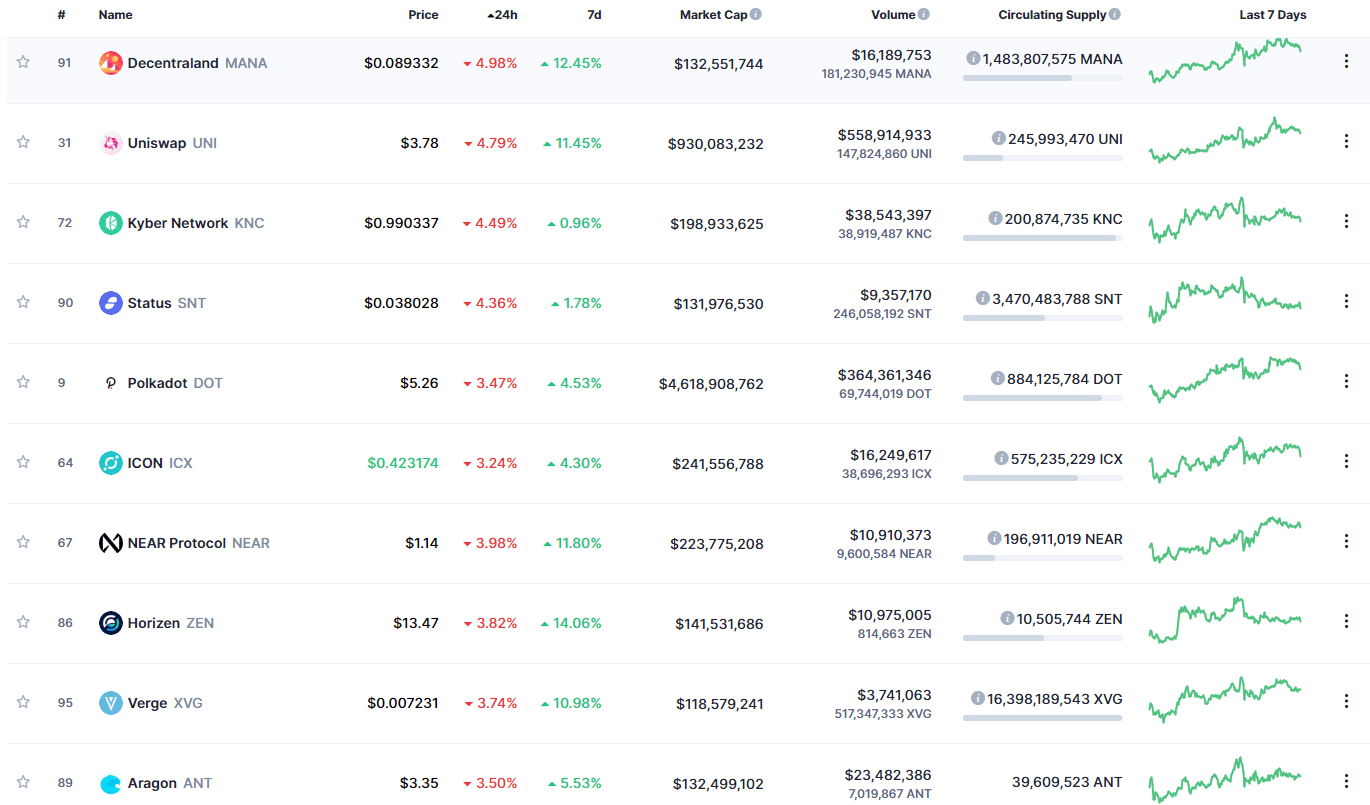
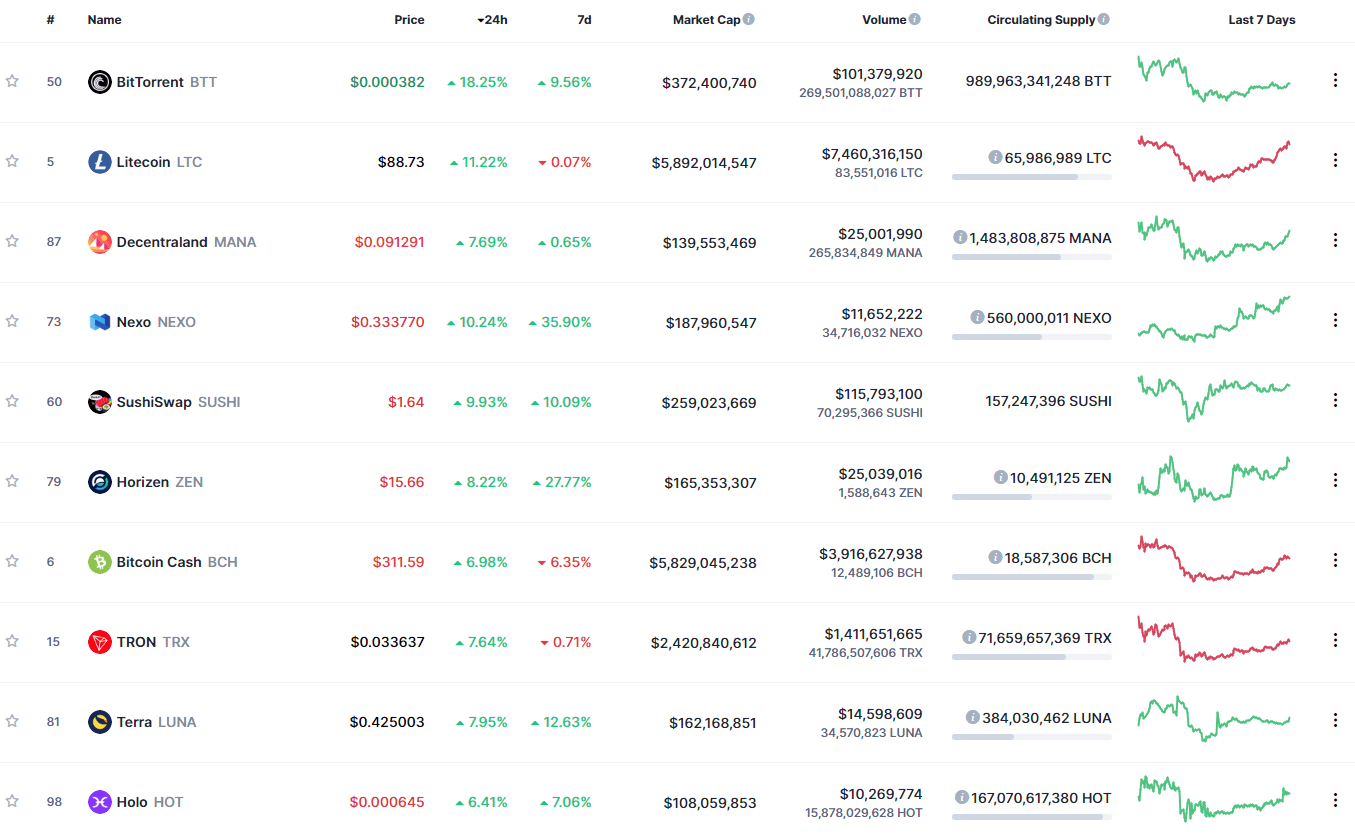
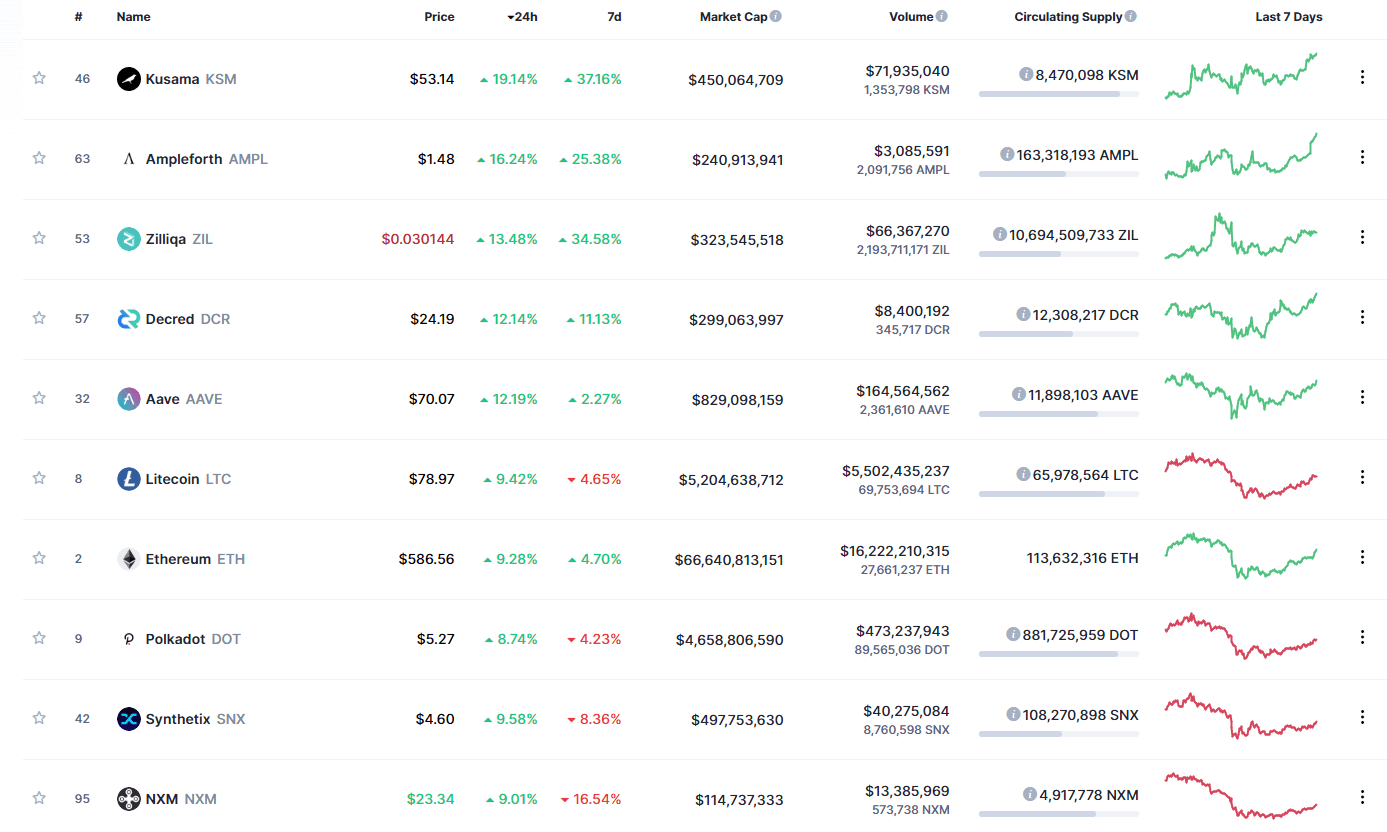
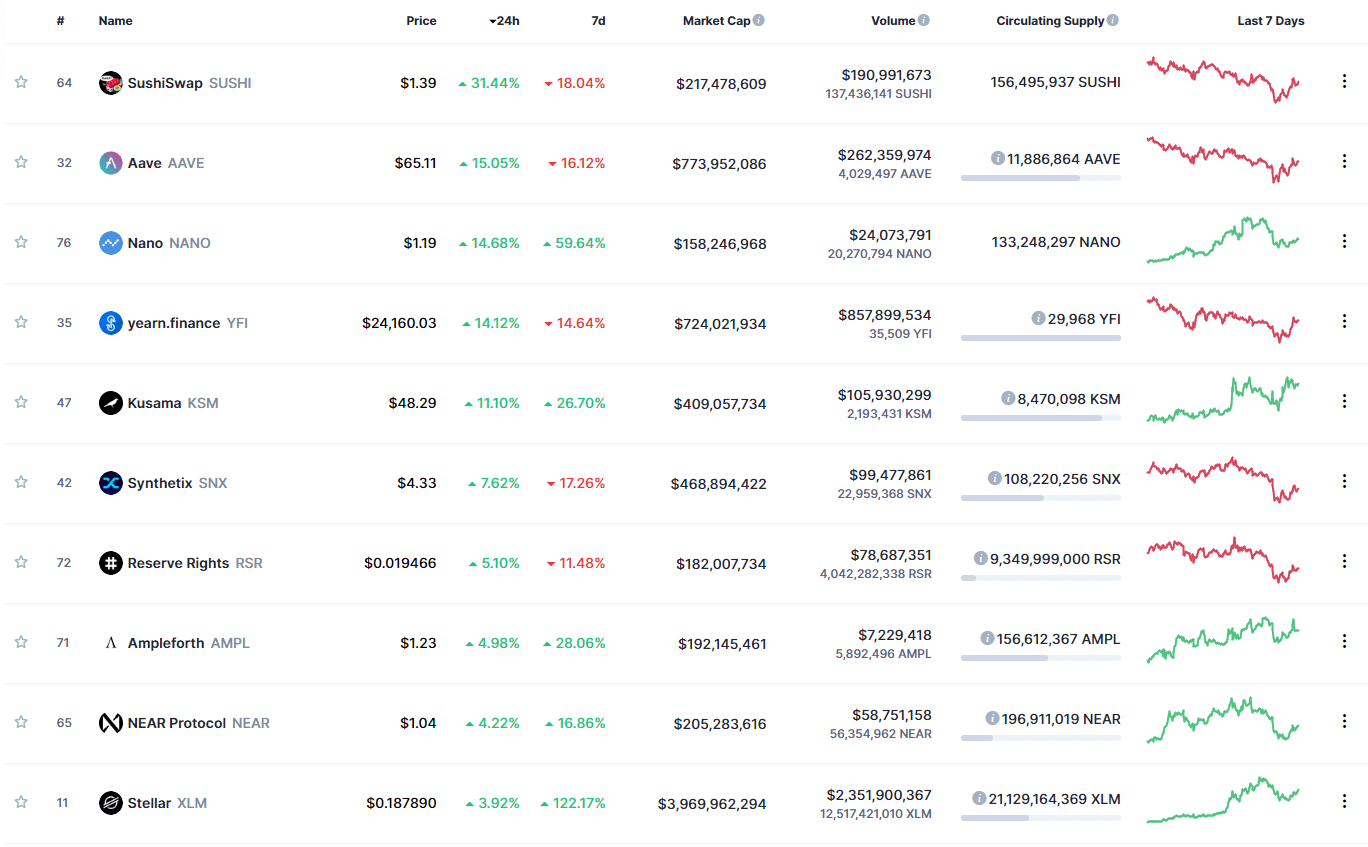
Top 10 24-hour Performers (Click to enlarge)
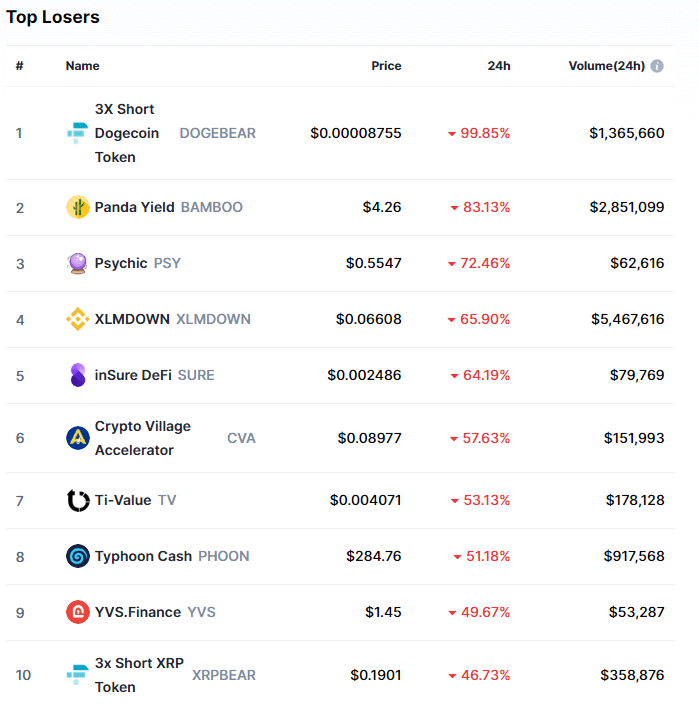
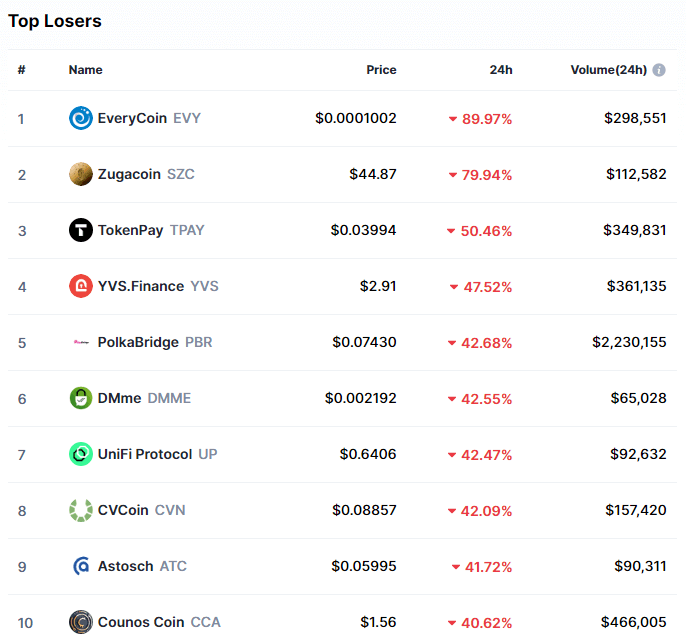
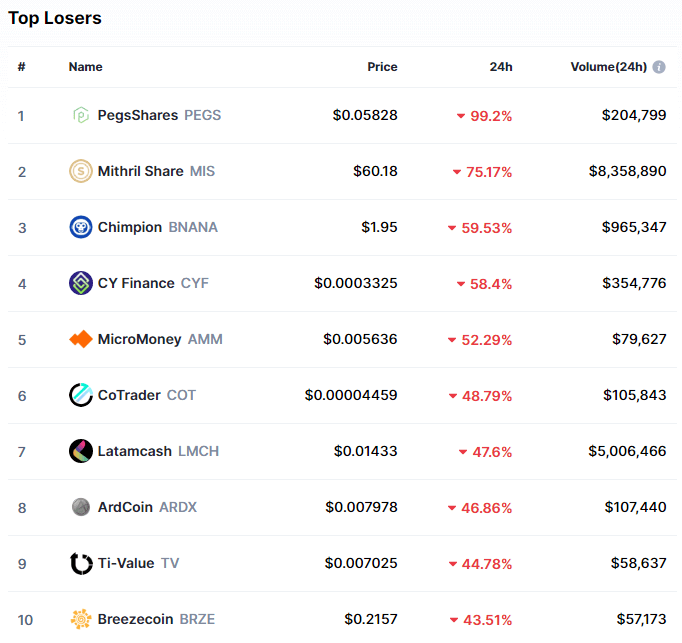
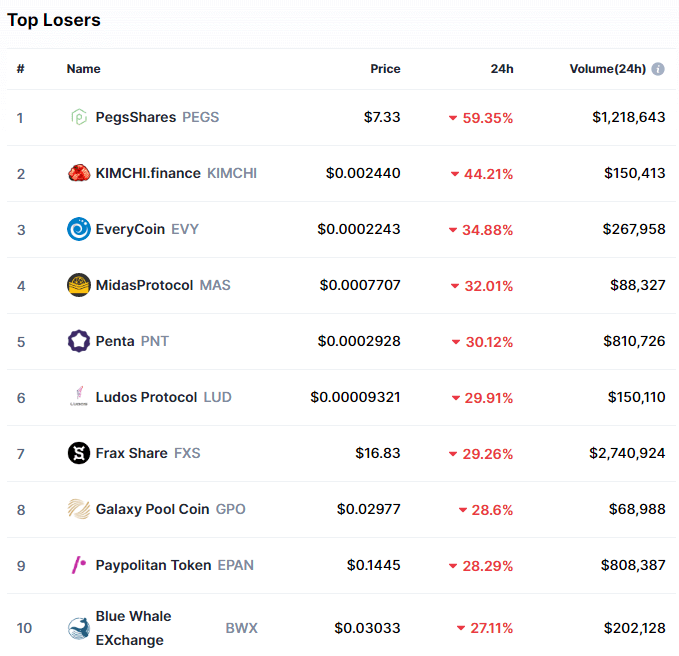
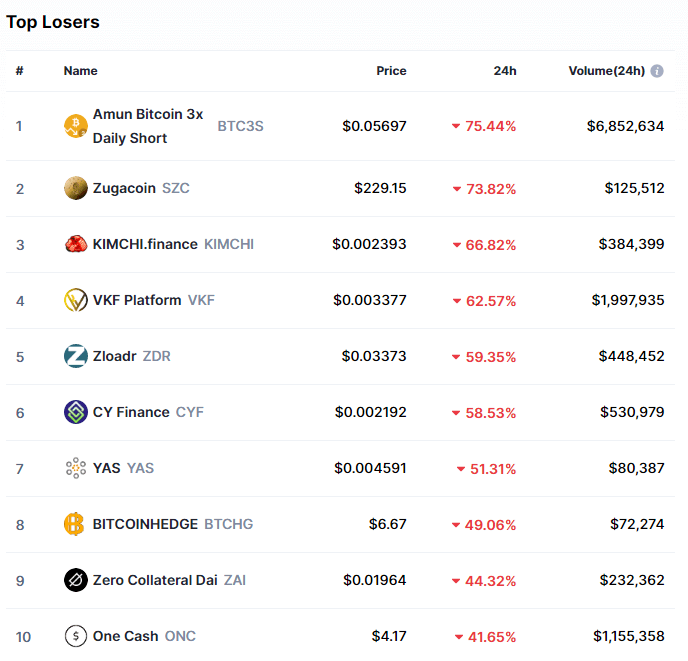
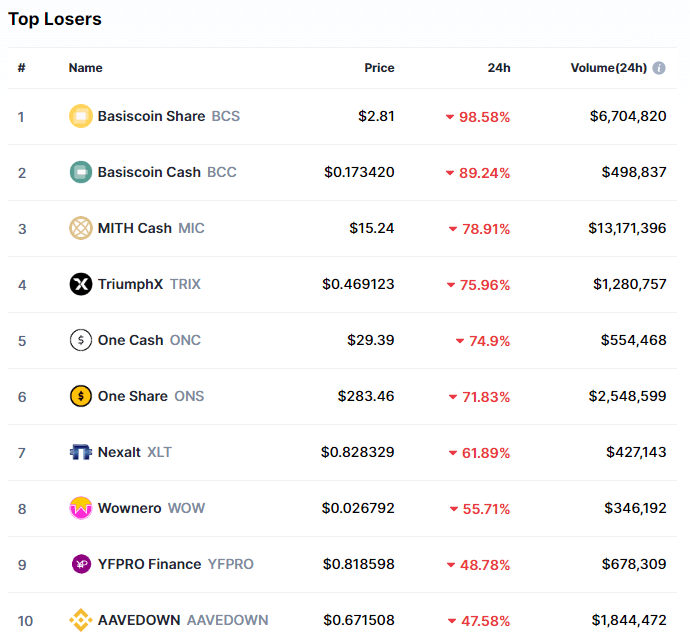
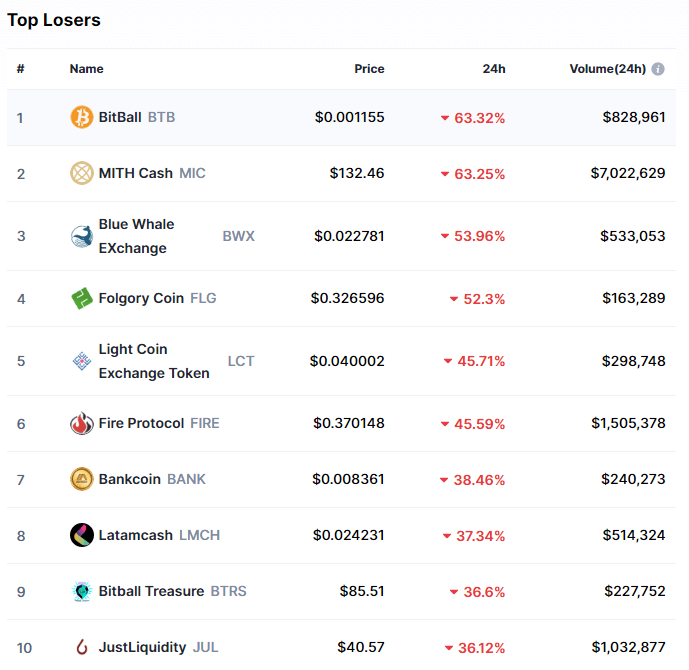
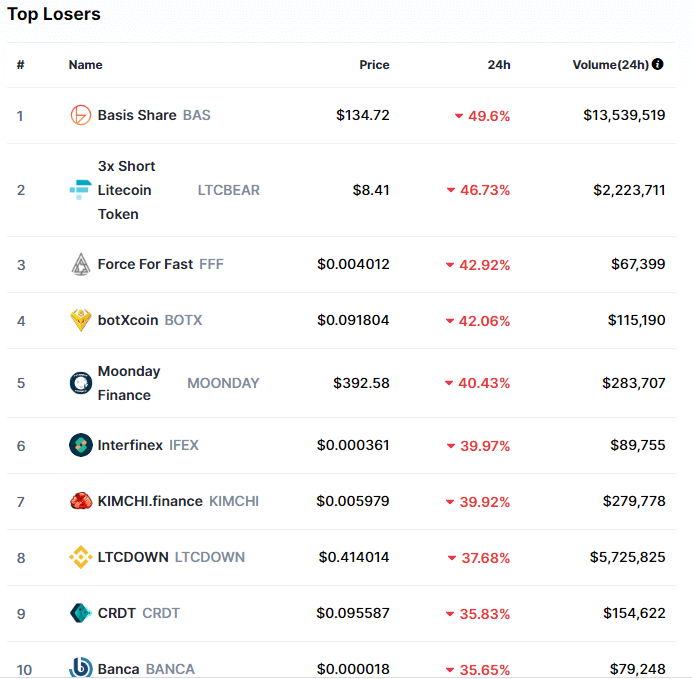
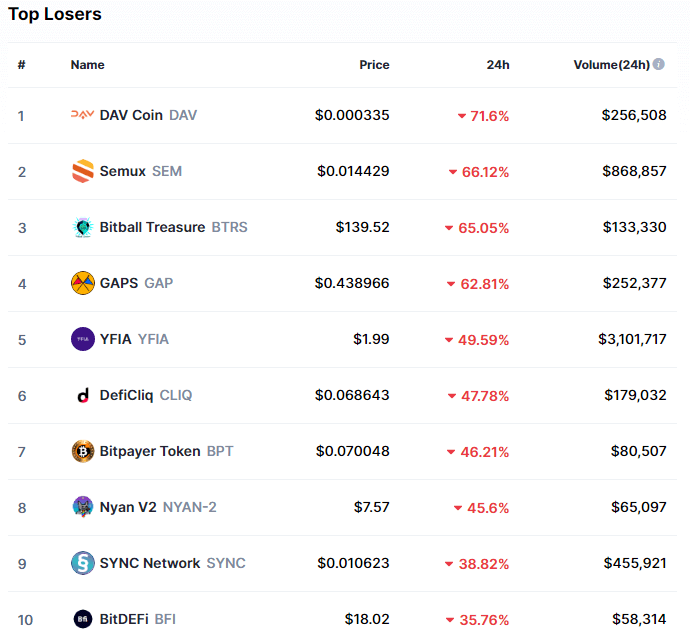
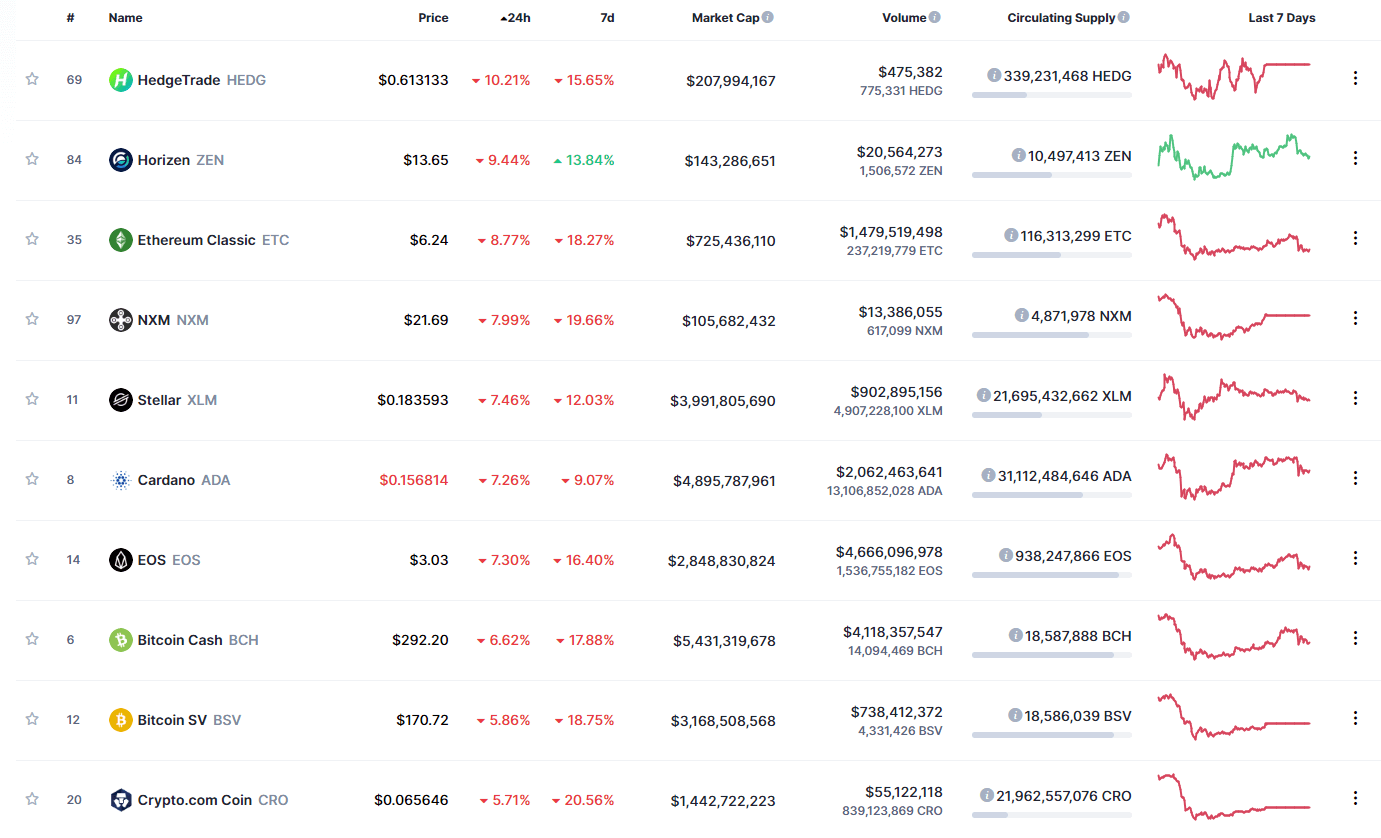
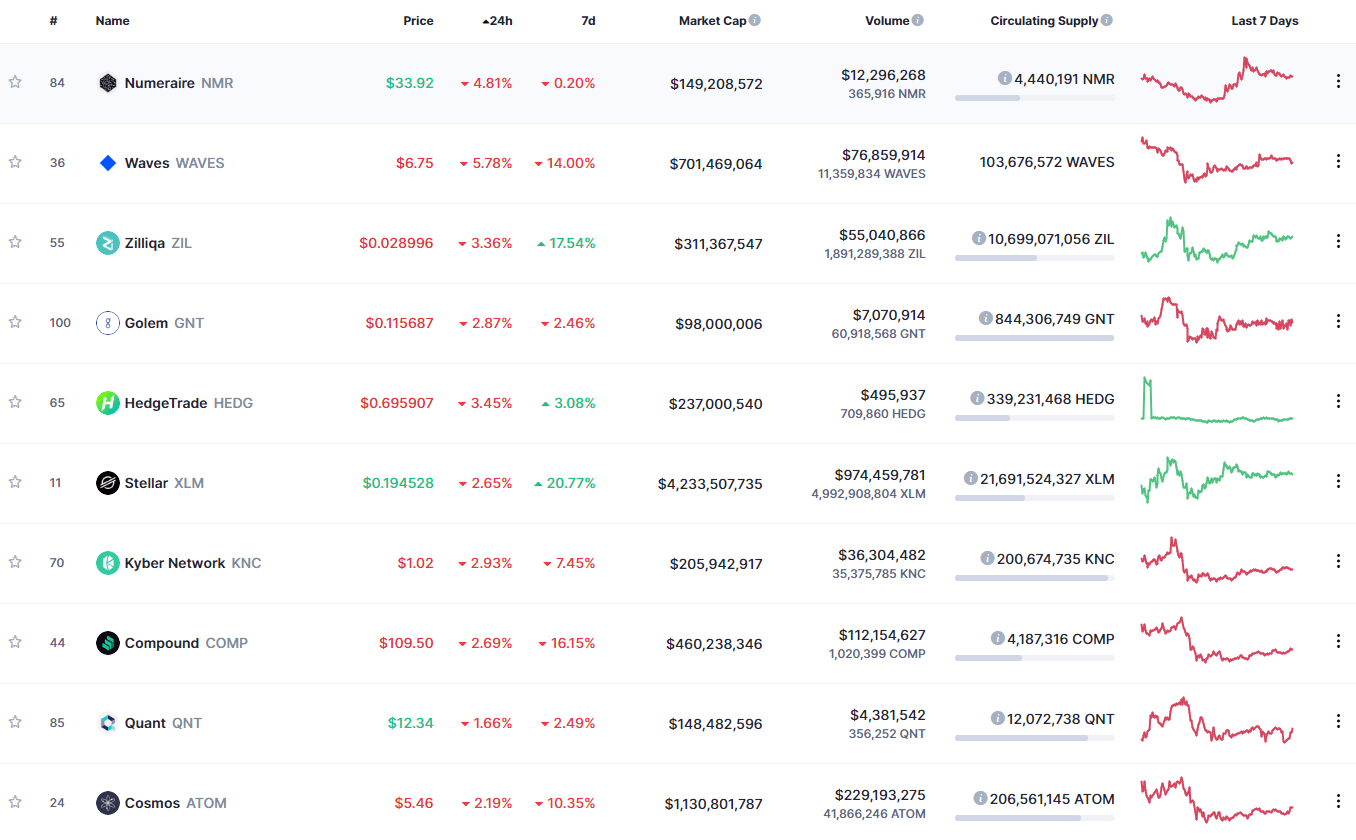
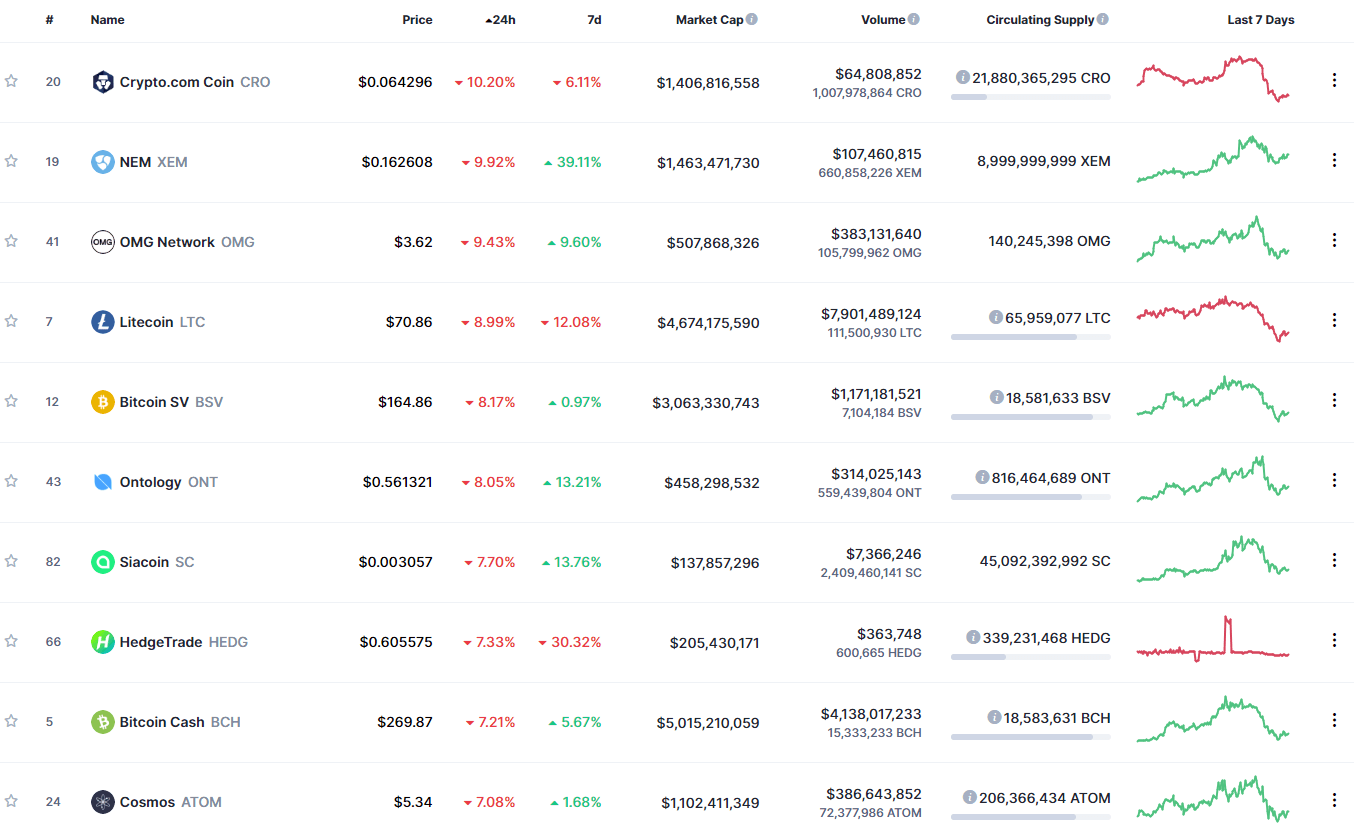
Bottom 10 24-hour Performers (Click to enlarge)
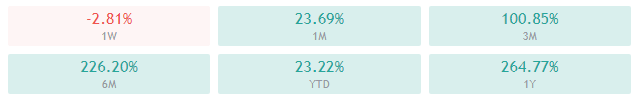
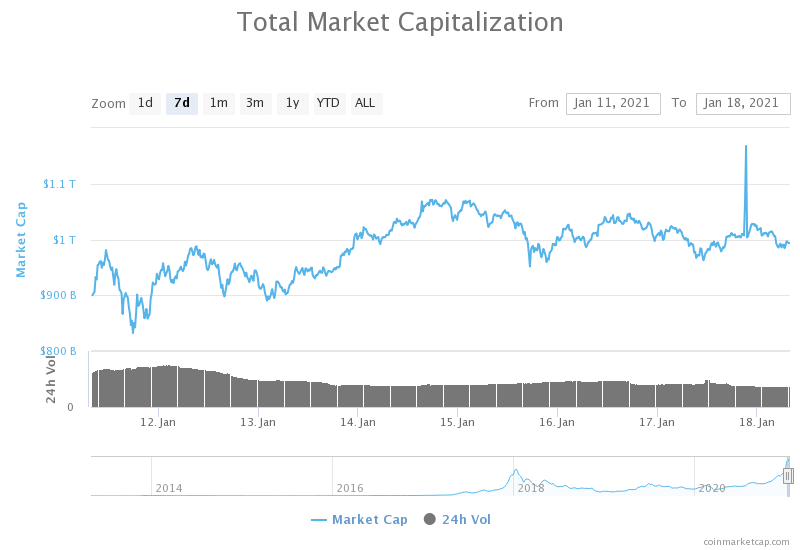
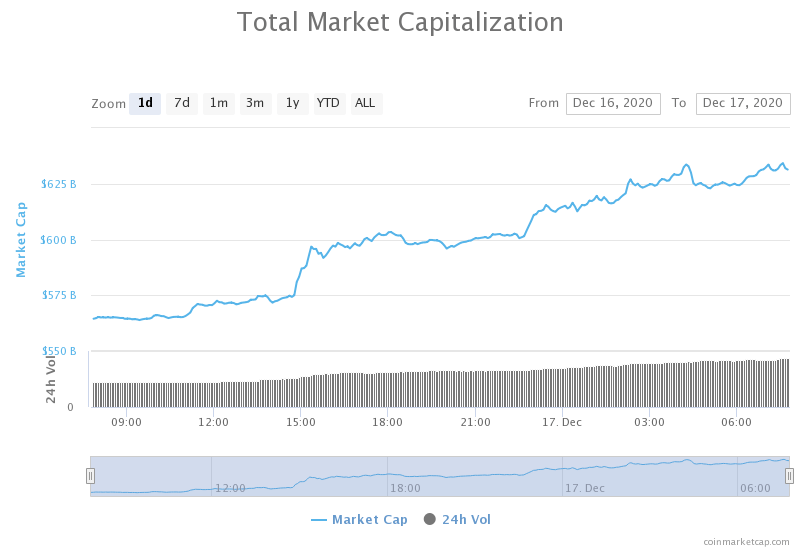
Bitcoin’s market dominance decreased slightly from when we last reported, currently 62.8%. This represents a 0.1% decrease from our previous report.
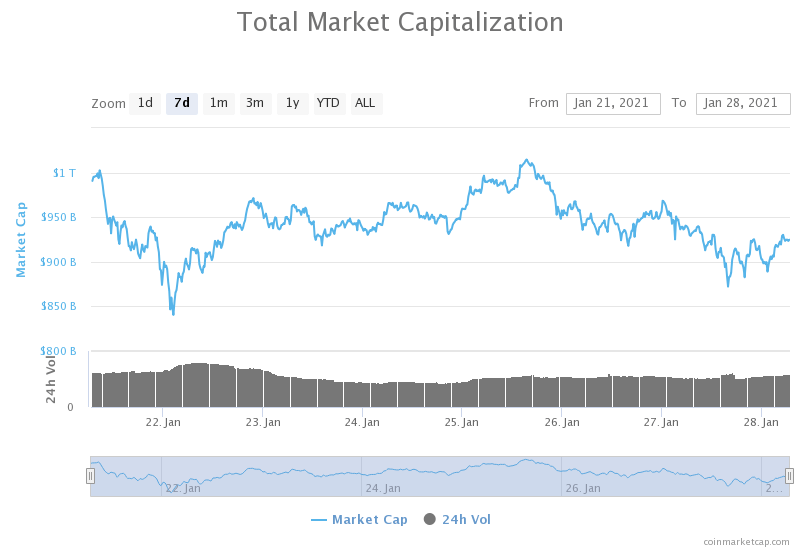
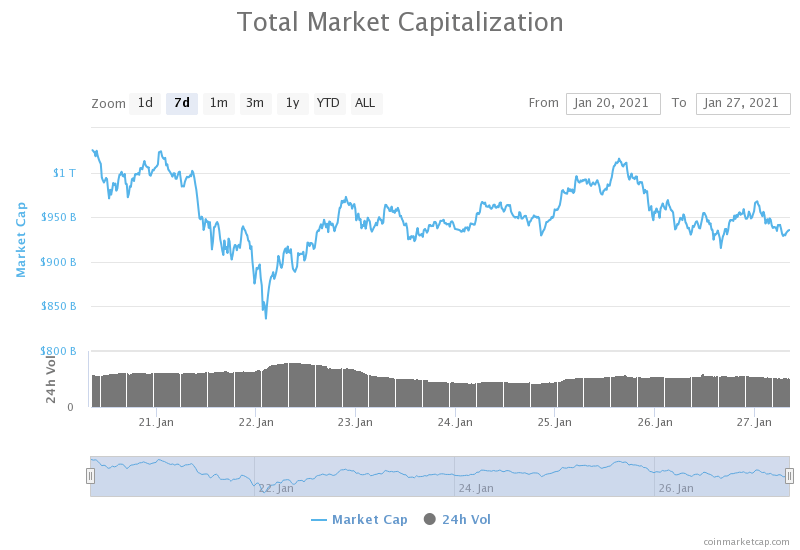
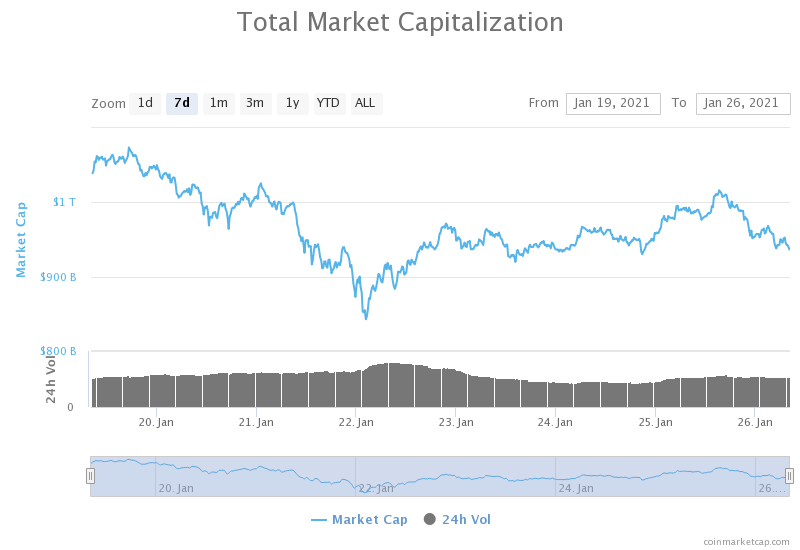
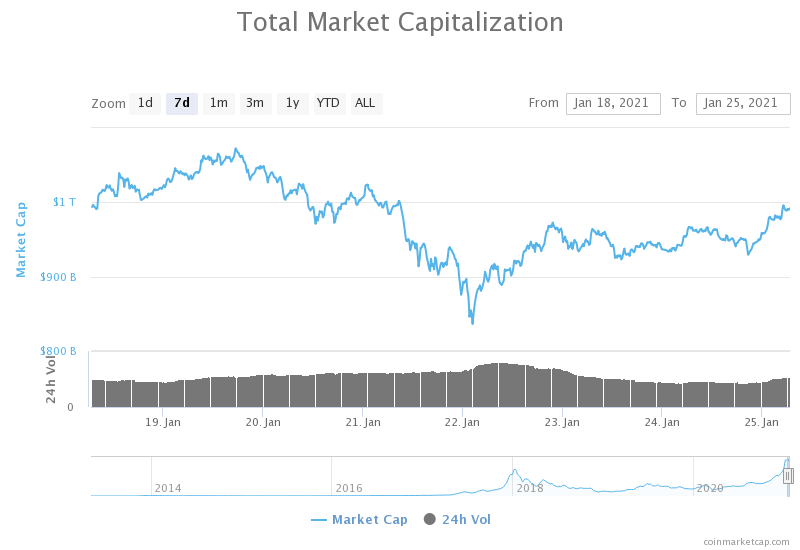
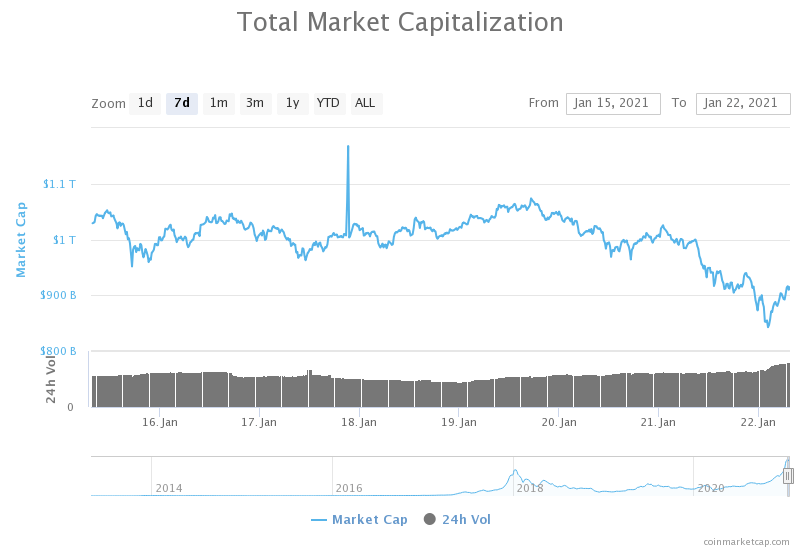
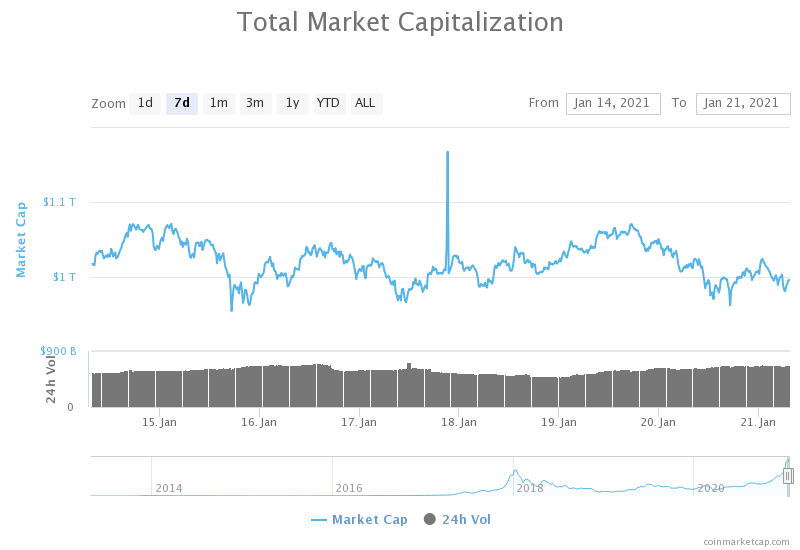
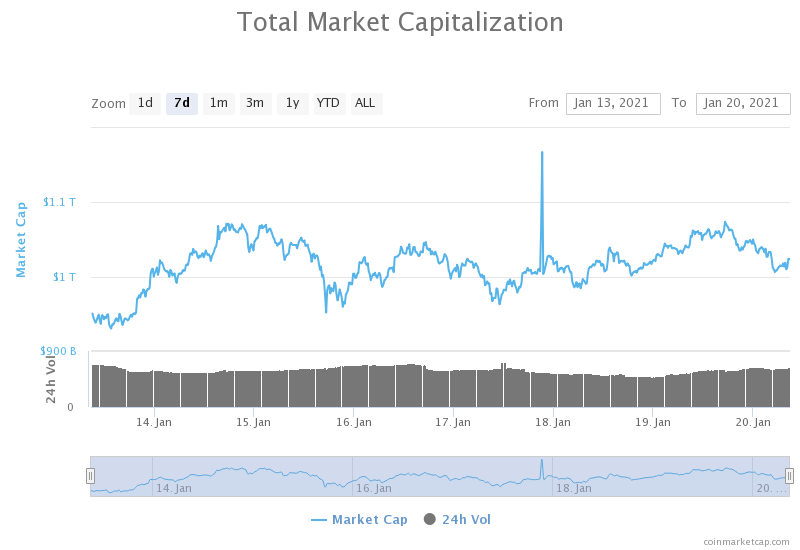
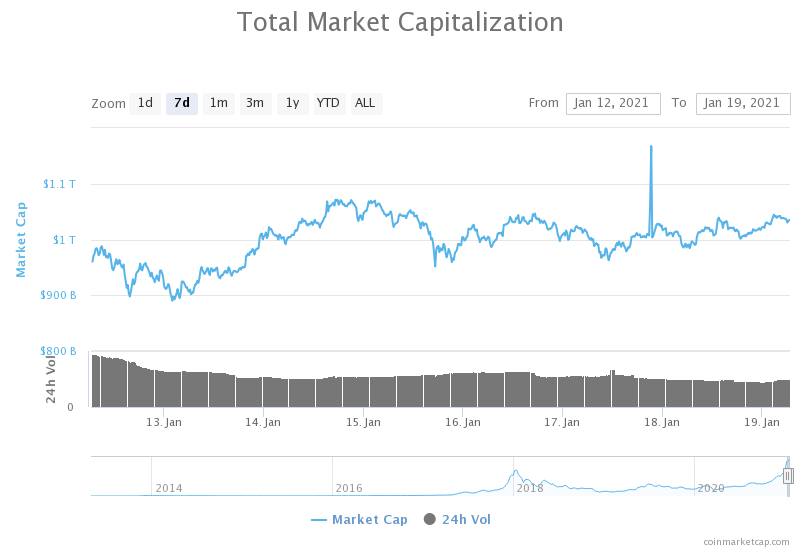
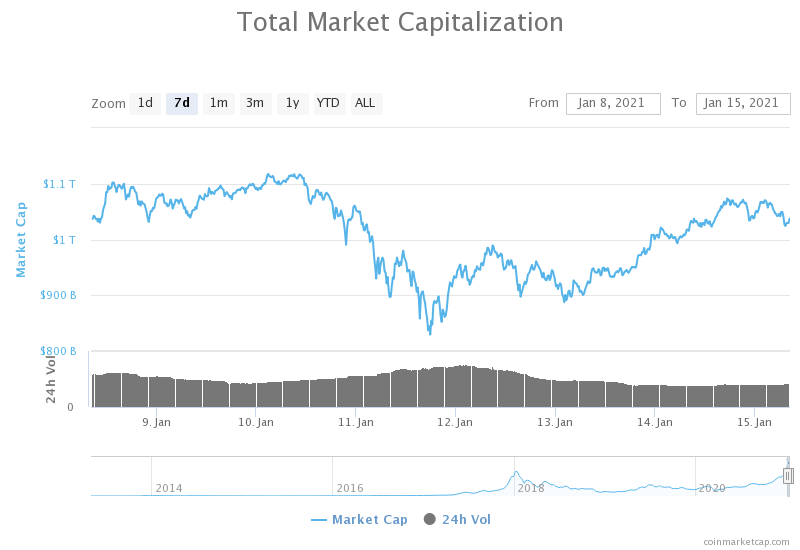
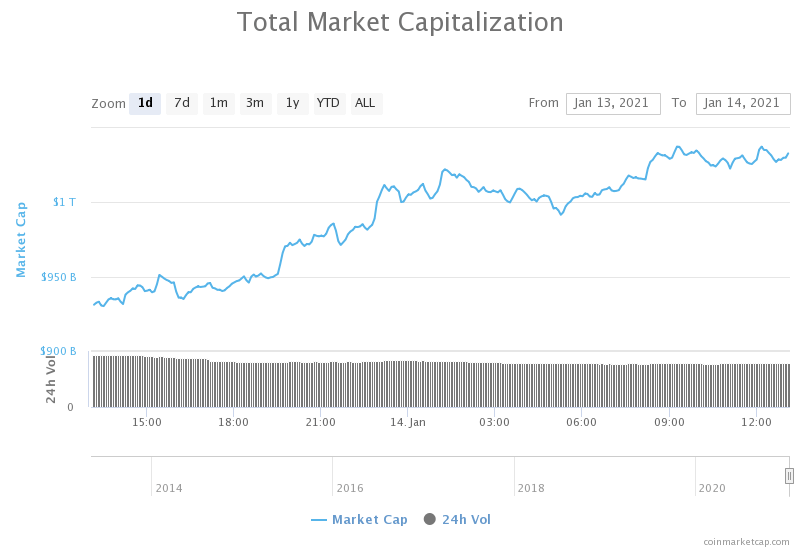
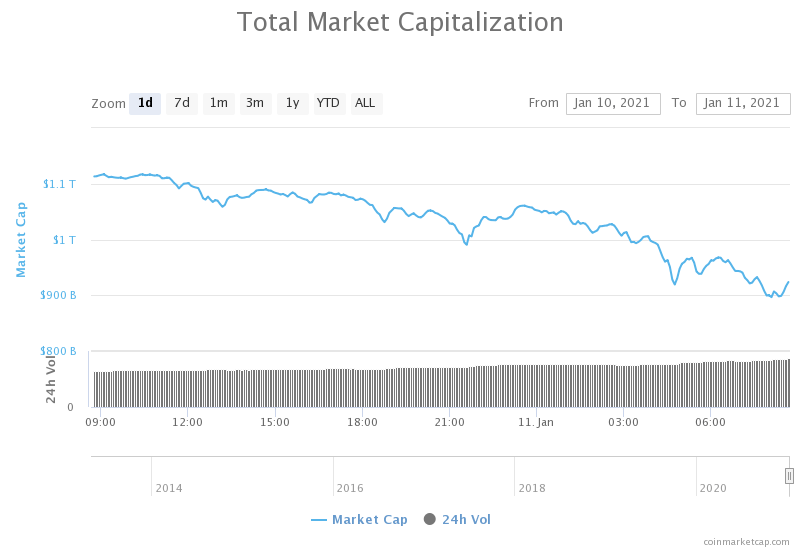
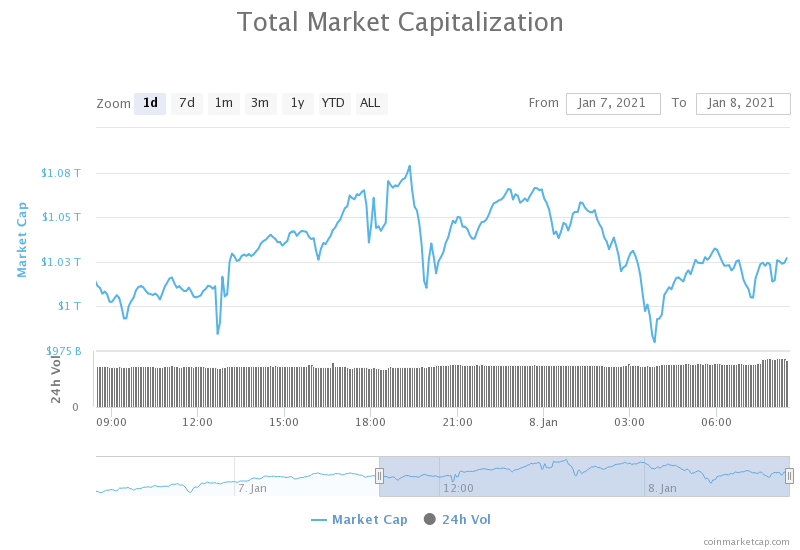
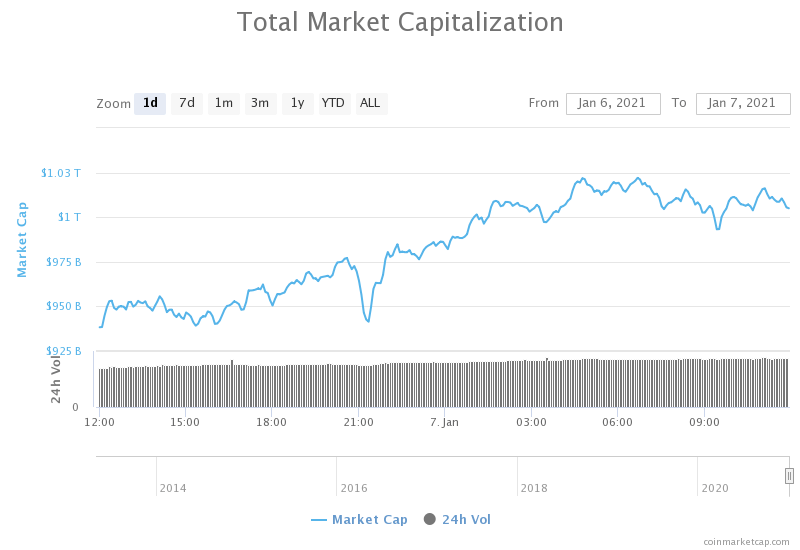
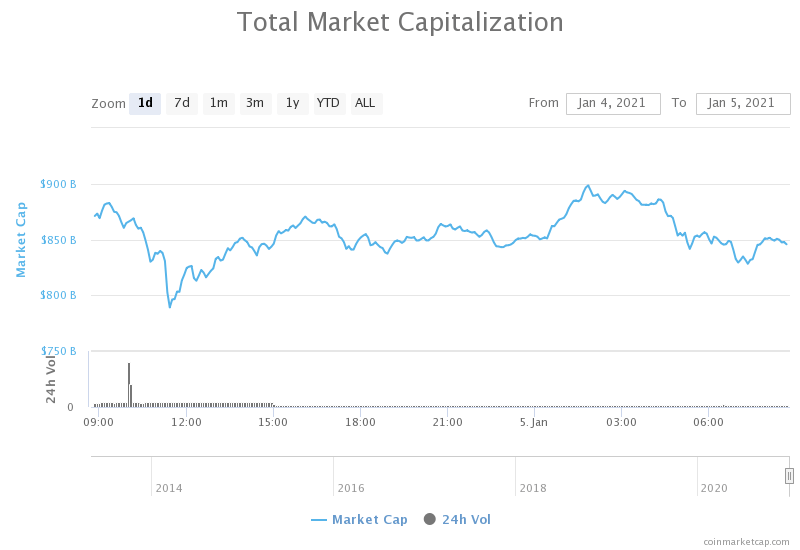
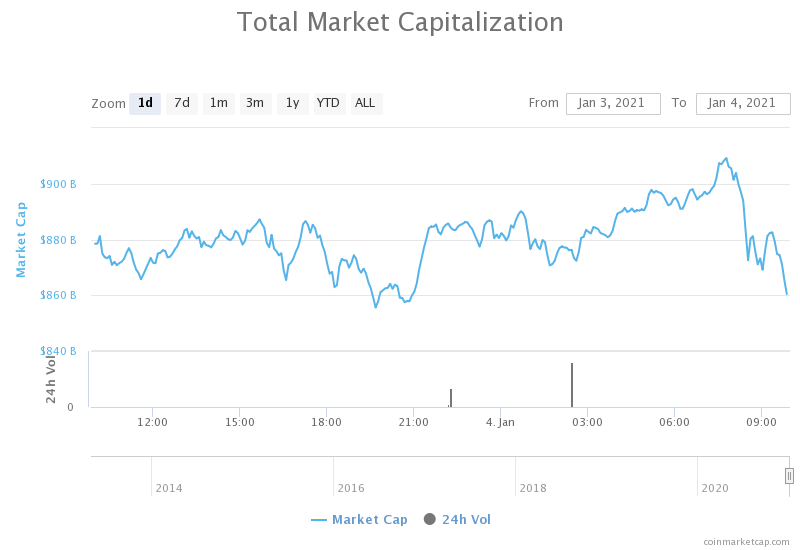
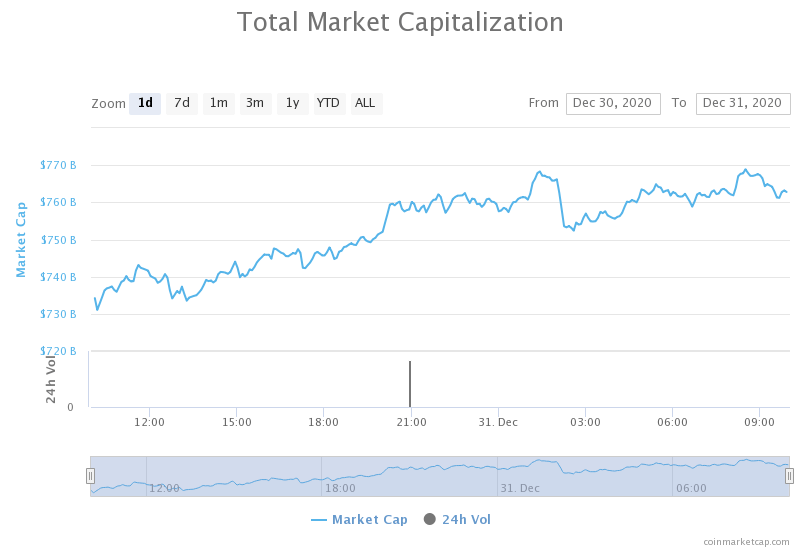
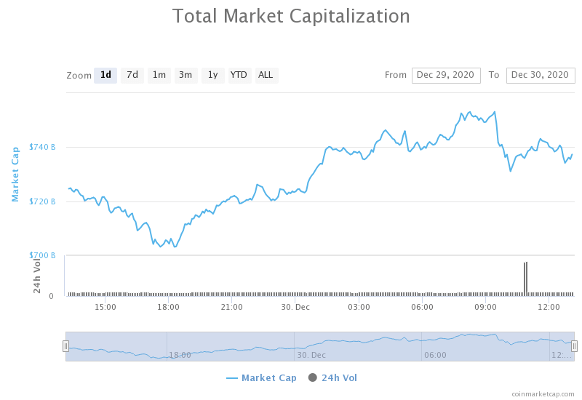
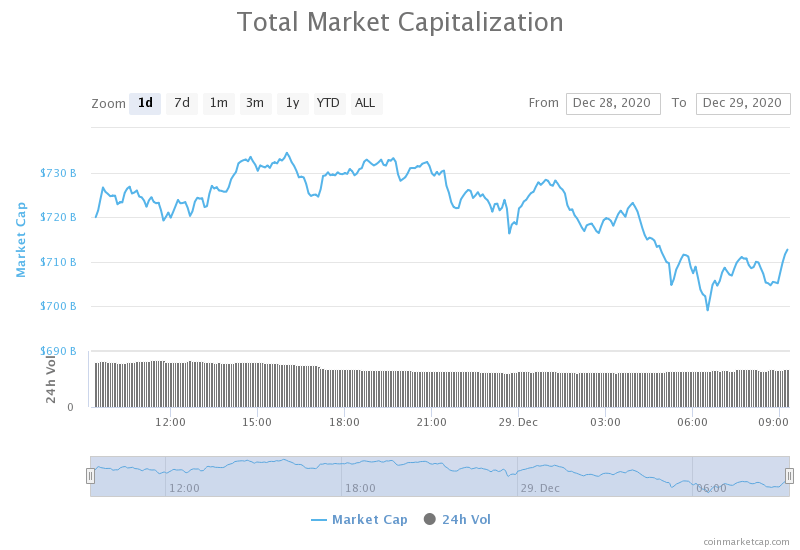
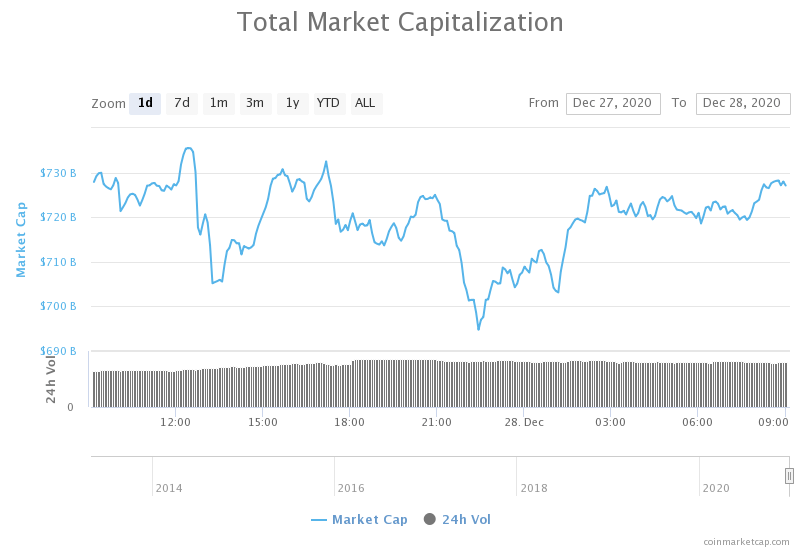
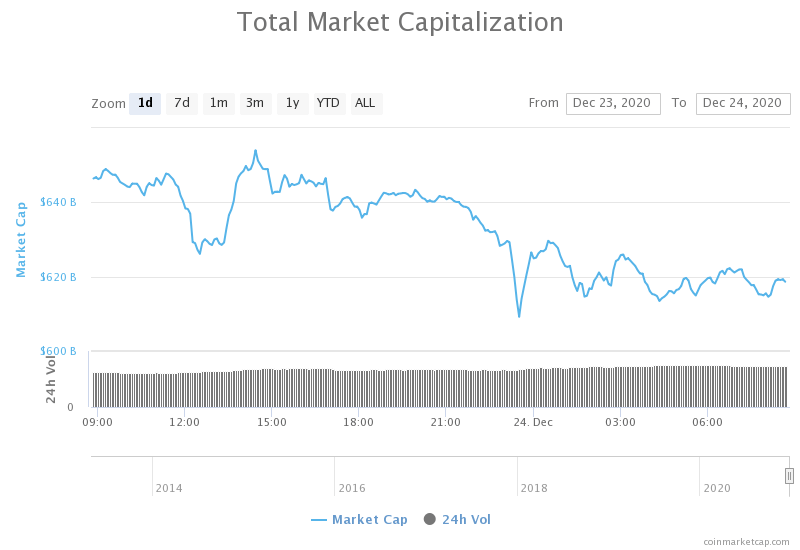
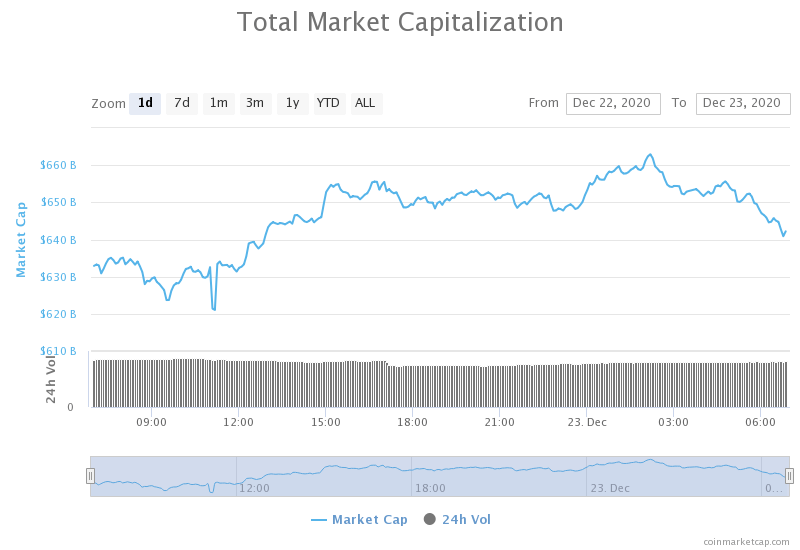
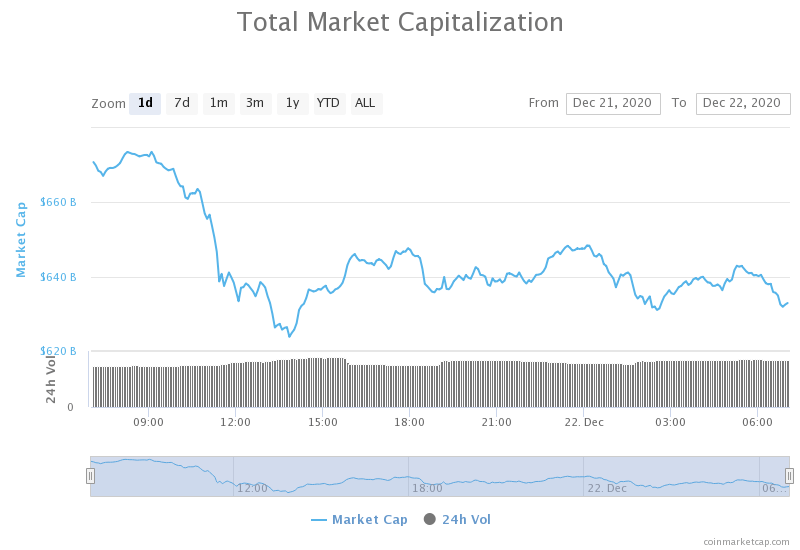
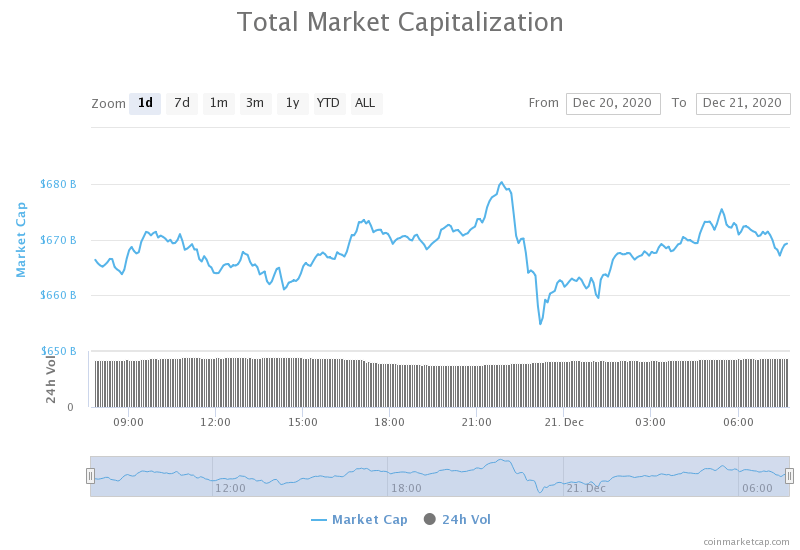
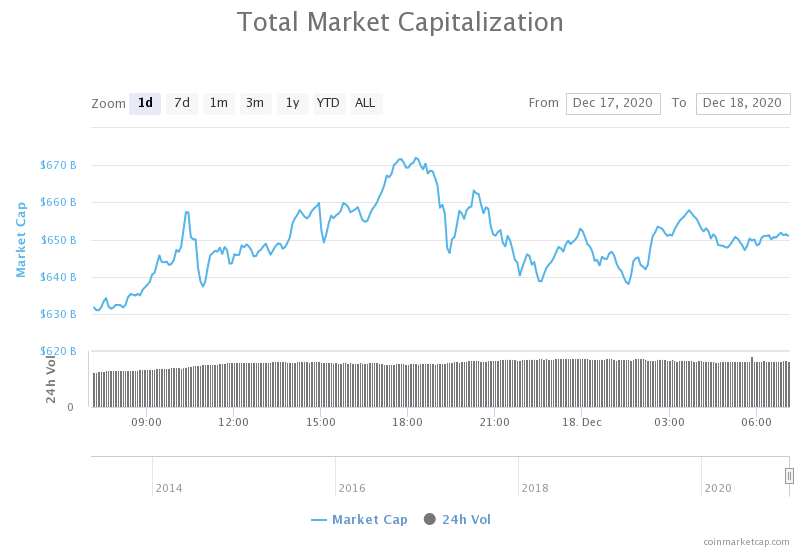
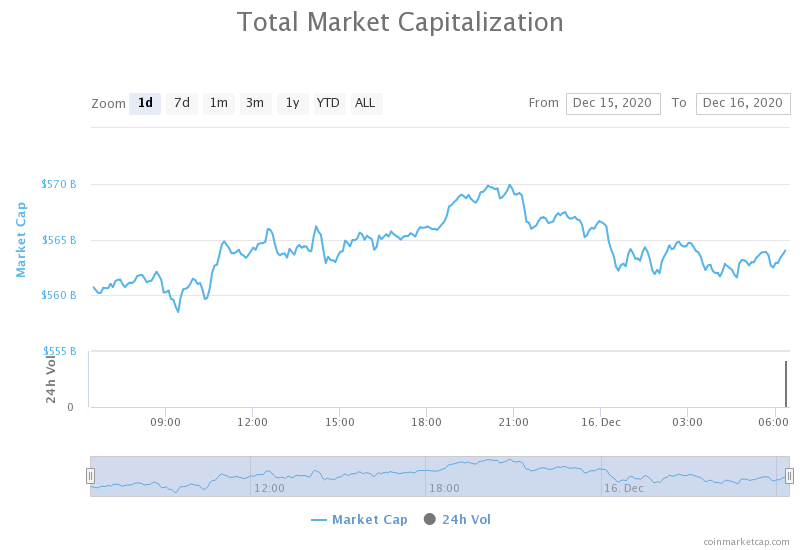
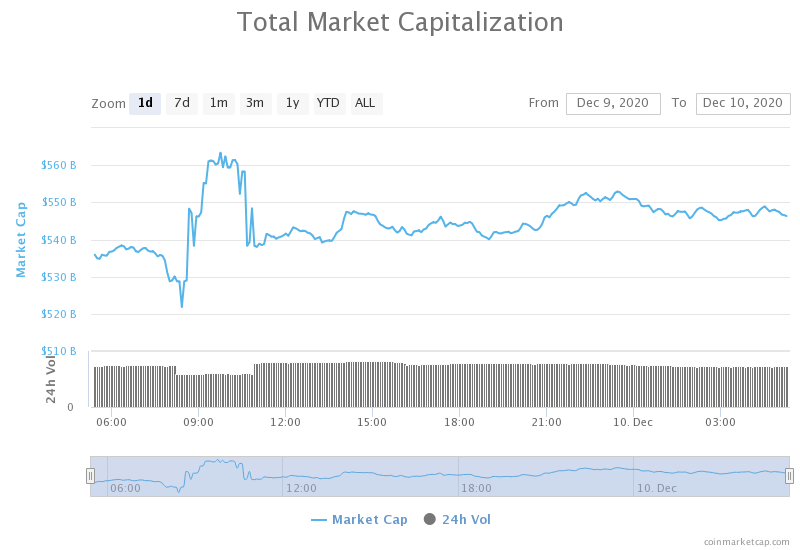
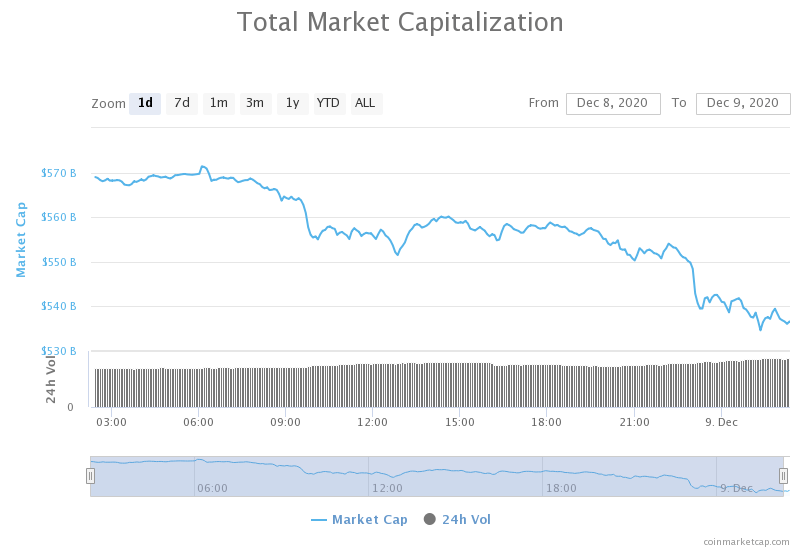
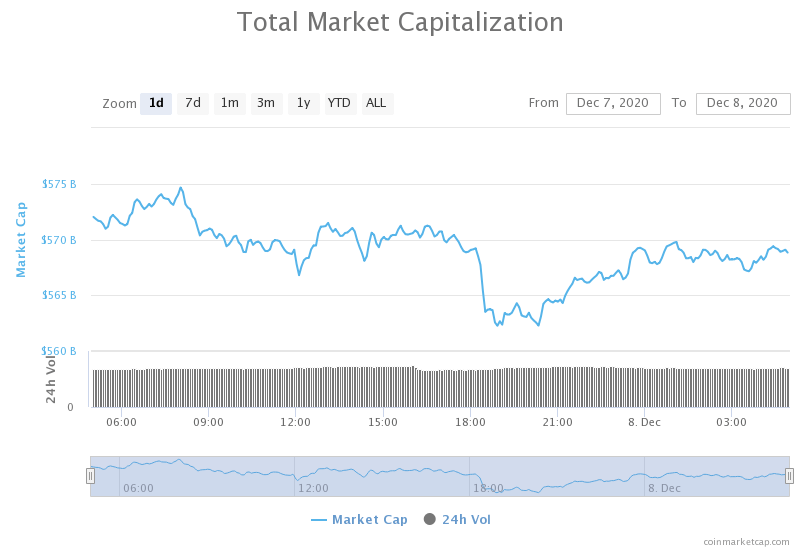
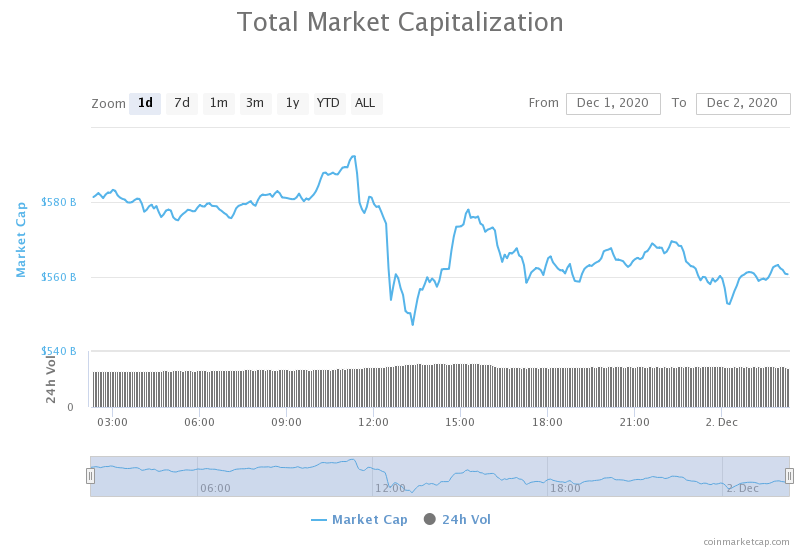
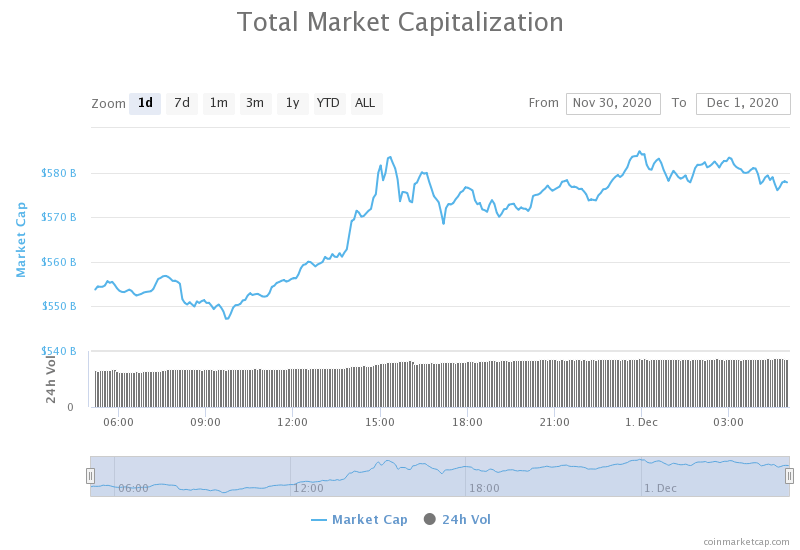
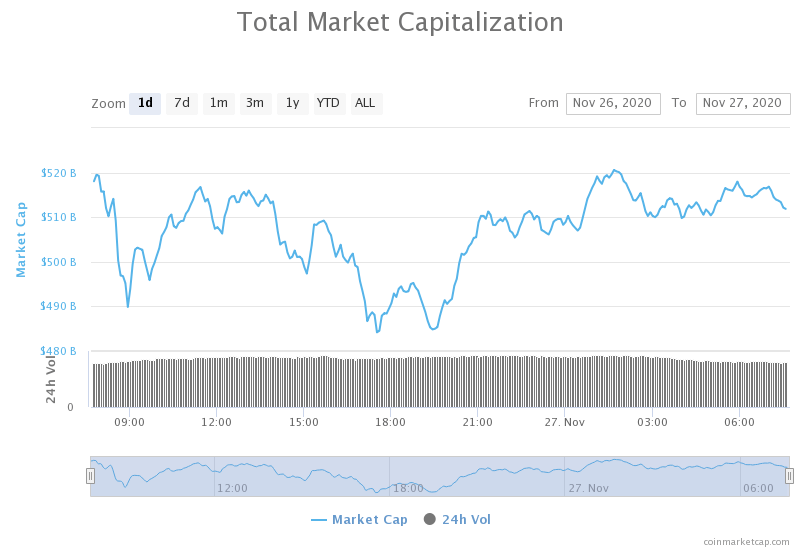
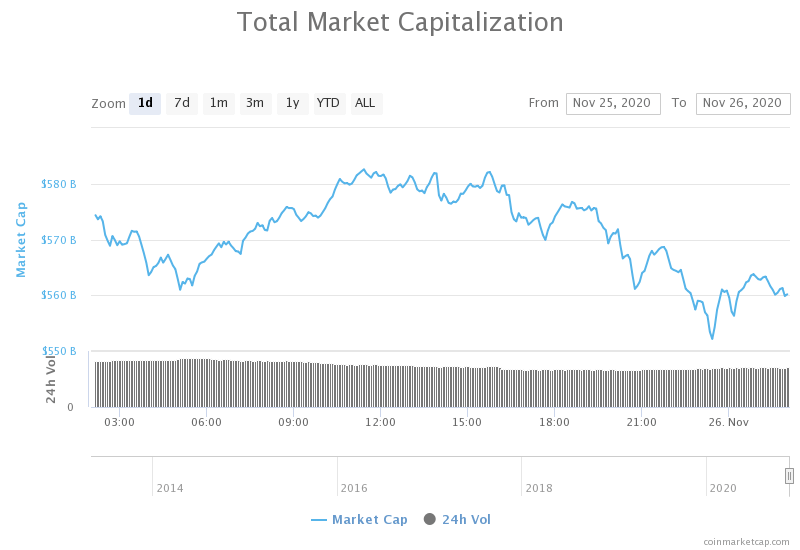
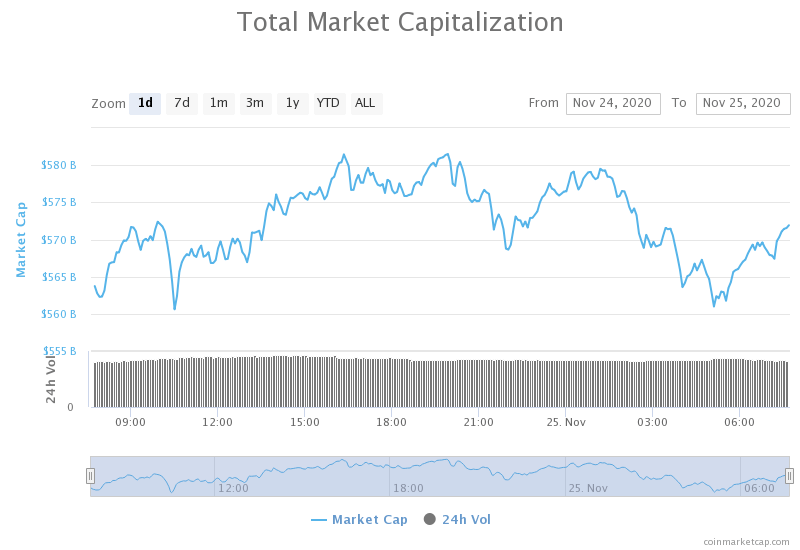
Weekly Crypto Market Cap Chart
The cryptocurrency sector’s market capitalization has increased greatly since we last reported, with its current value being $979.02 billion. This represents a $54.27billion increase when compared to our previous report.
_______________________________________________________________________
What happened in the past 24 hours?
_______________________________________________________________________
- MicroStrategy says it will look into ‘various approaches’ to obtain more bitcoin (The Block)
- Blockfolio launches zero-fee crypto trading on its app (The Block)
- Visa’s Q1 earnings call reveals details about its crypto strategy (The Block)
- Chainlink Must Slice Through Resistance Barrier (Cryptobriefing)
- Stellar Lumens Primed to Recover Lost Ground (Cryptobriefing)
- Robinhood Bans DOGE Trading After WallStreetBets Reddit Community Eyes Dogecoin (Cryptobriefing)
- New Grayscale trust filings spin rumour mill into overdrive for Cardano, Polkadot, Cosmos and more (Cryptoslate)
- Coinbase to Become Publicly Traded, Announces Proposed Direct Listing of Shares (Coindesk)
- Grayscale is buying BTC 54% faster than it is mined so far in 2021 (Cointelegraph)
- Crypto crime dropped 57% in 2020 but DeFi hacks surged: CipherTrace (Cointelegraph)
_______________________________________________________________________
Technical analysis
_______________________________________________________________________
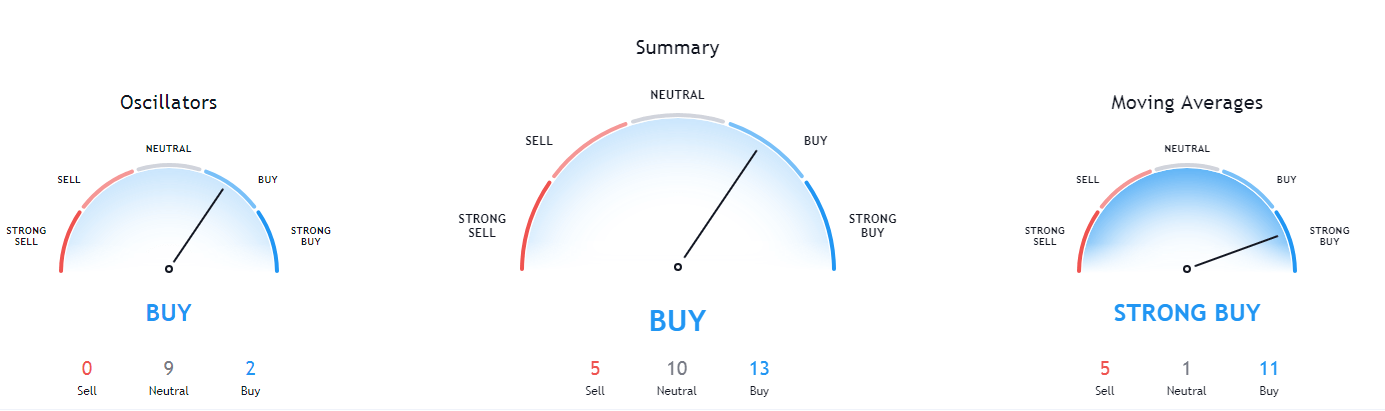
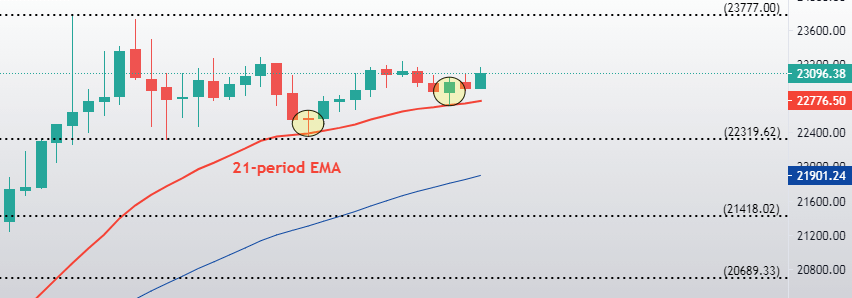
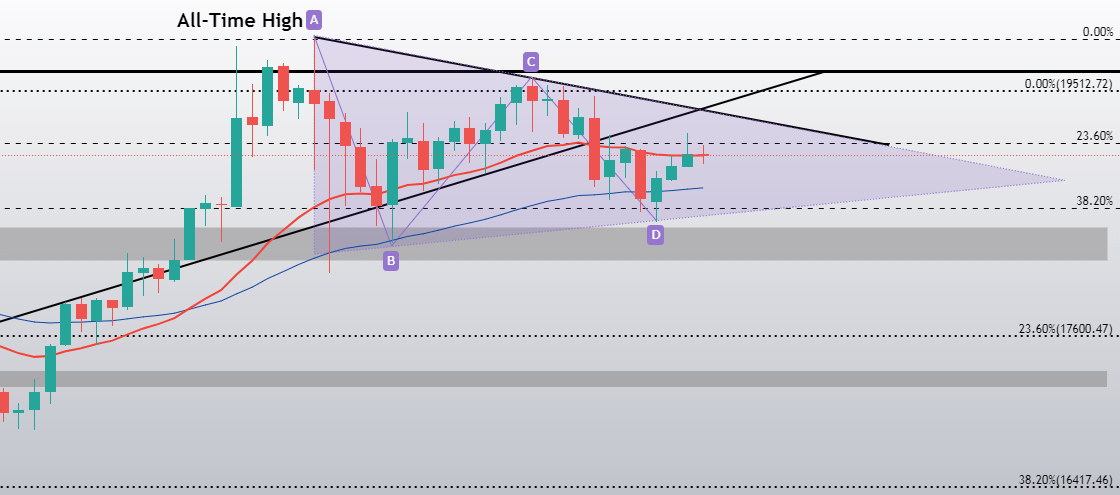
Bitcoin
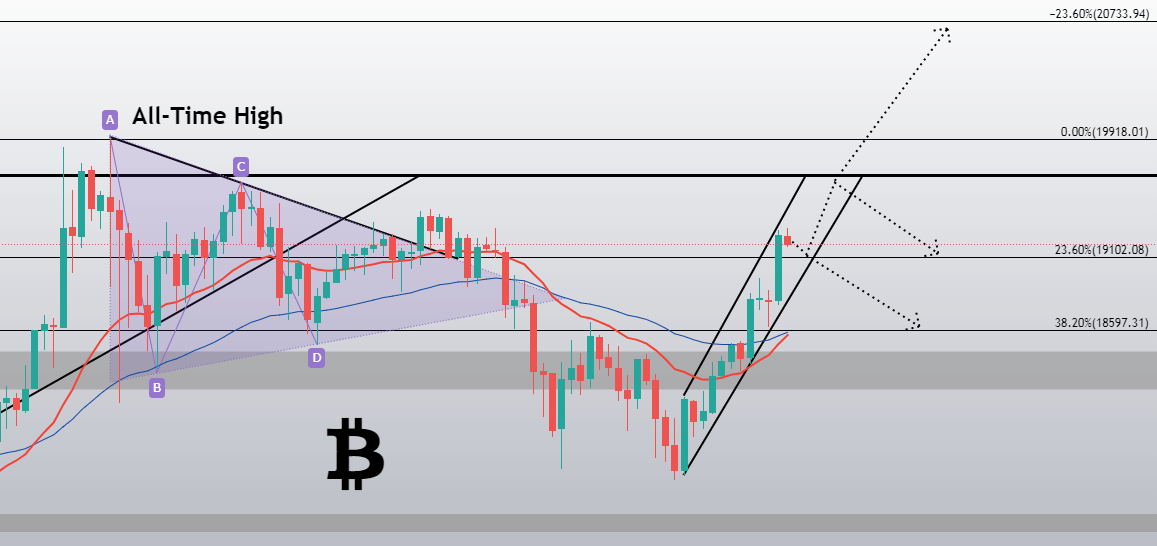
Bitcoin has spent the day attempting to push its price up as the market turned to green. Its price conquered the $32,350 level and pushed higher without hesitation. The move ended as bulls reached exhaustion near the $34,627 level. BTC’s inability to push past its immediate resistance has triggered a pullback, and the cryptocurrency is now most likely to retest the $32,350 level.
The overall change in market direction today came as a result of (as most speculate) Dogecoin’s insane upswing triggered by r/WallStreetBets.
BTC/USD 1-hour chart
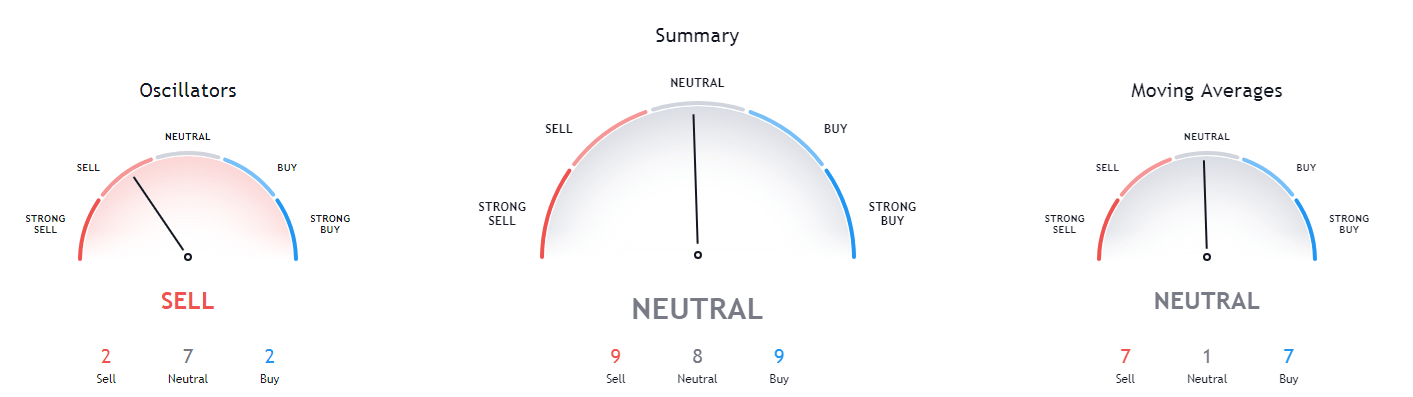
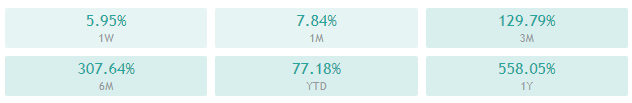
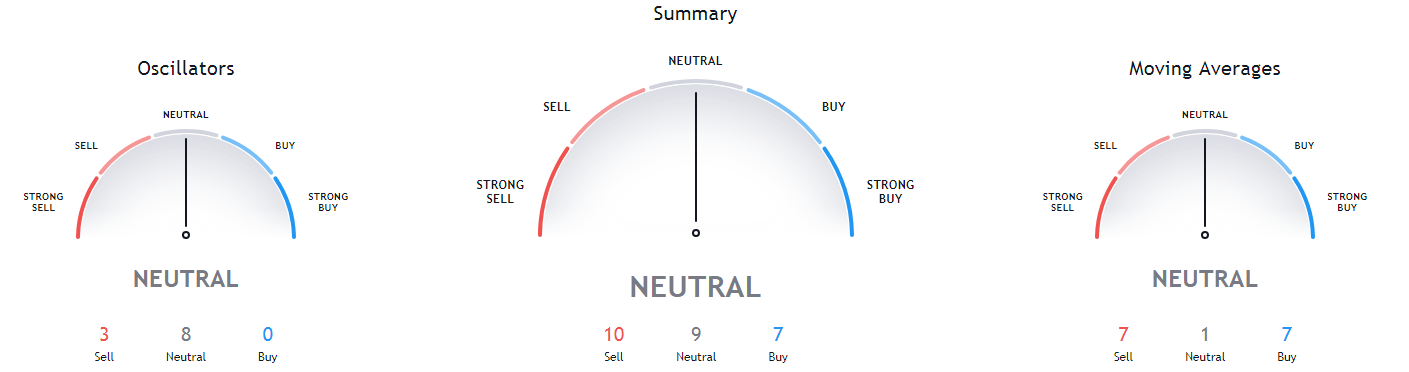
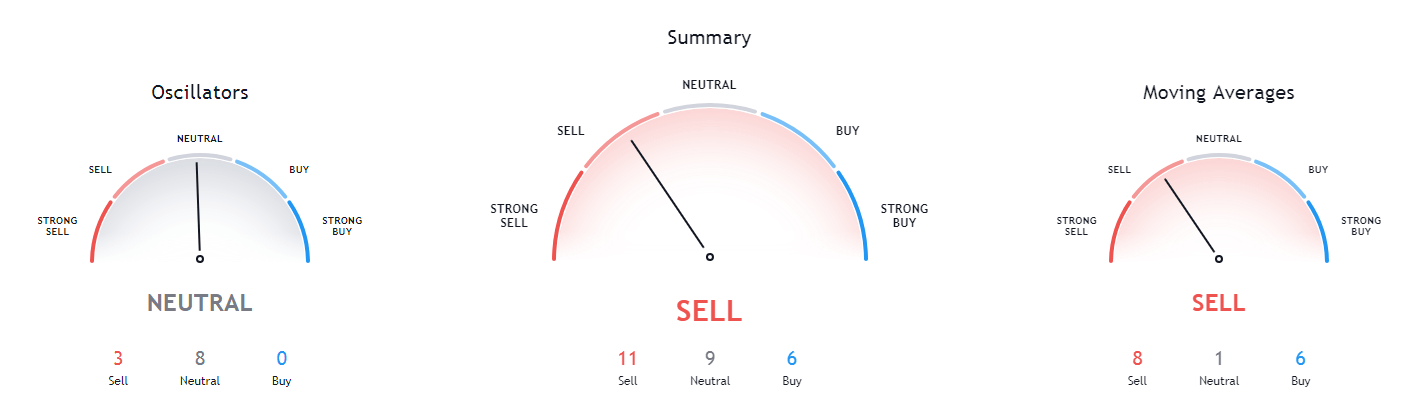
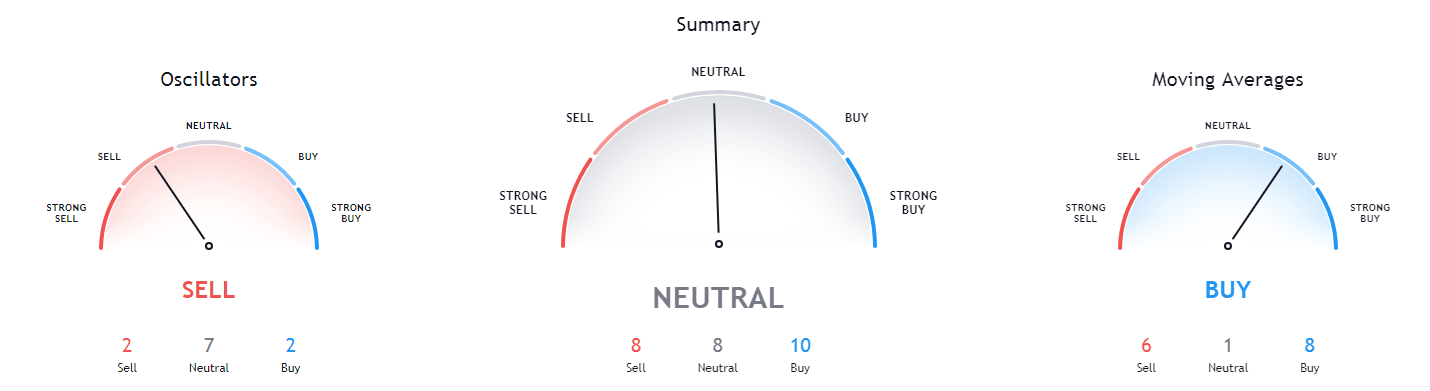
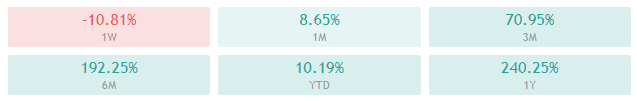
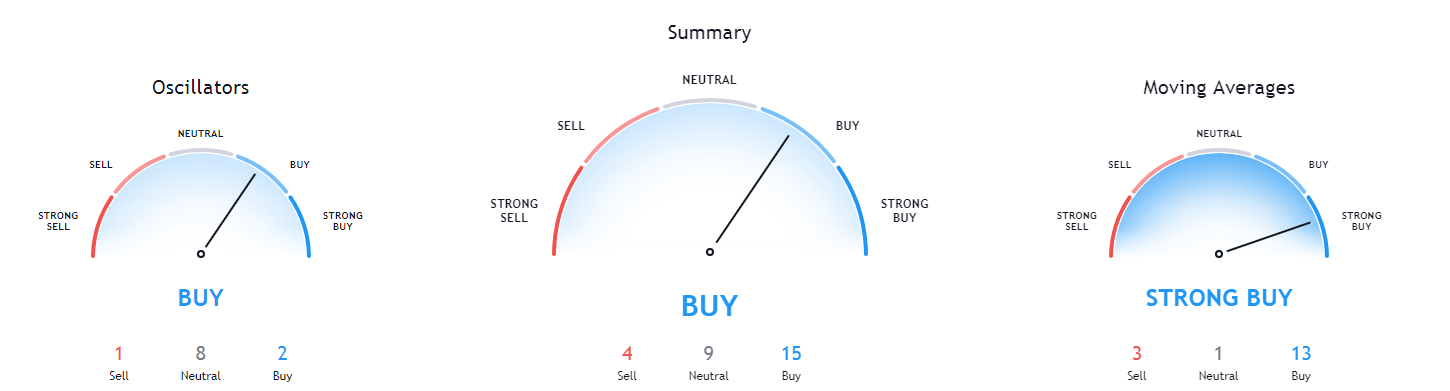
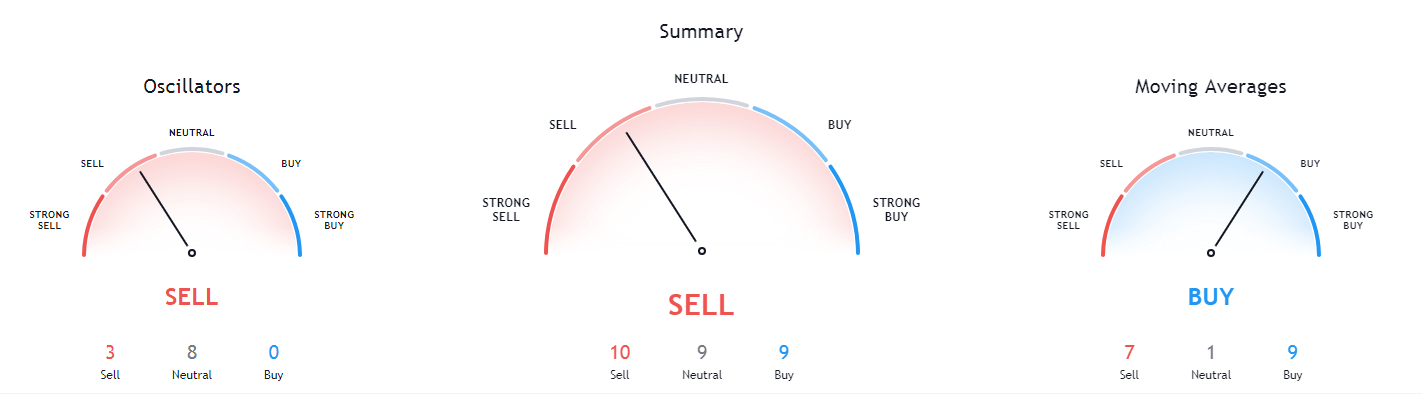
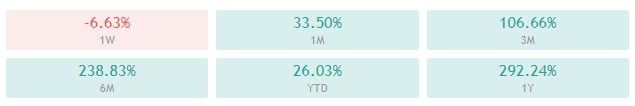
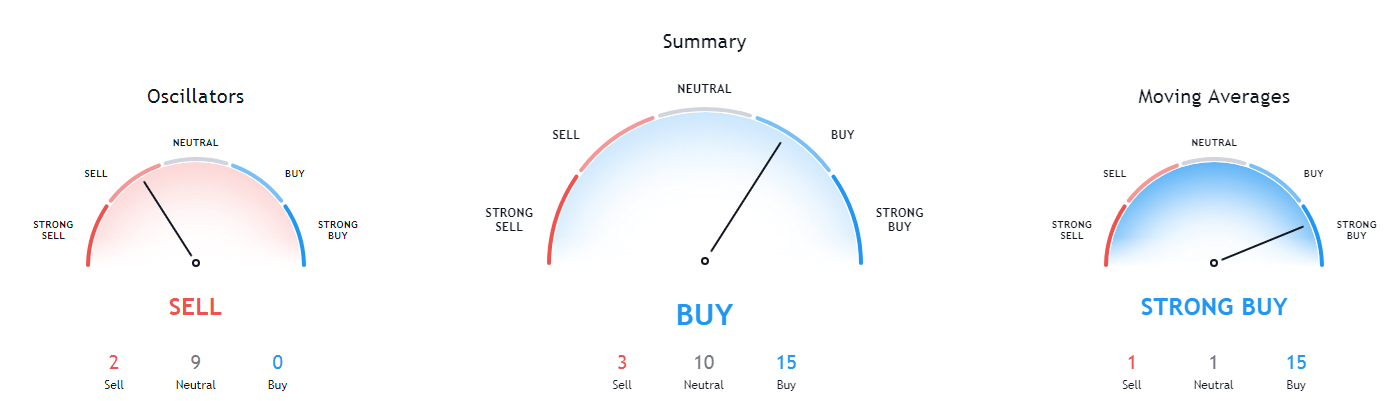
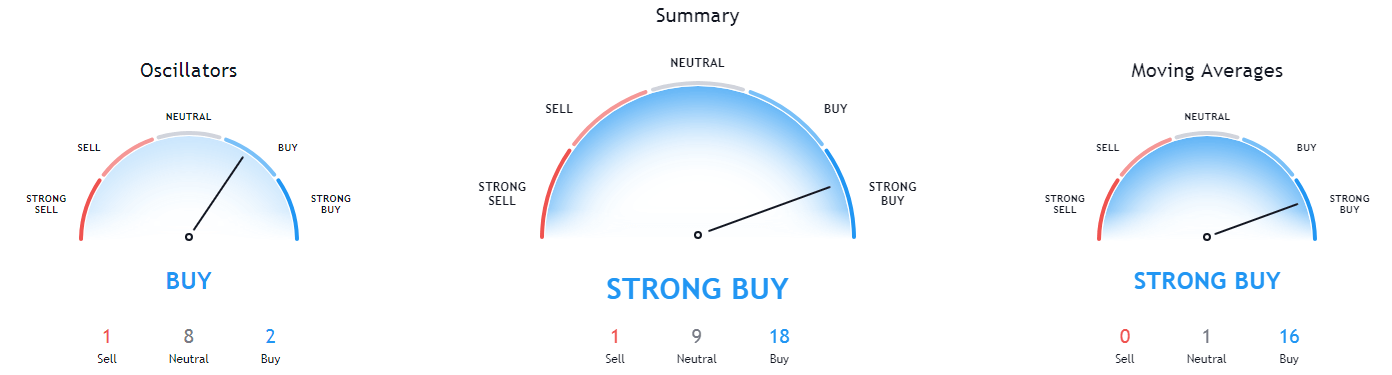
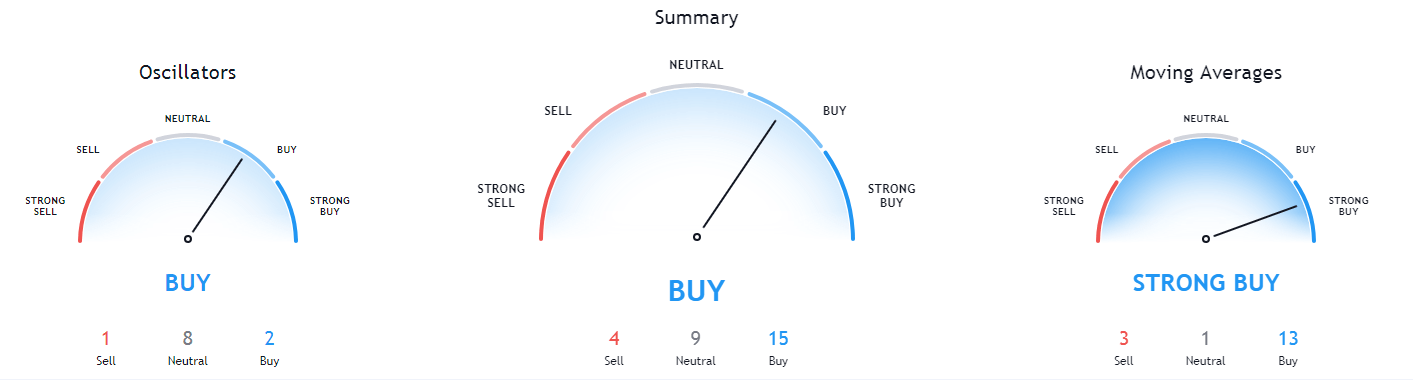
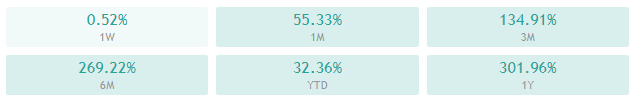
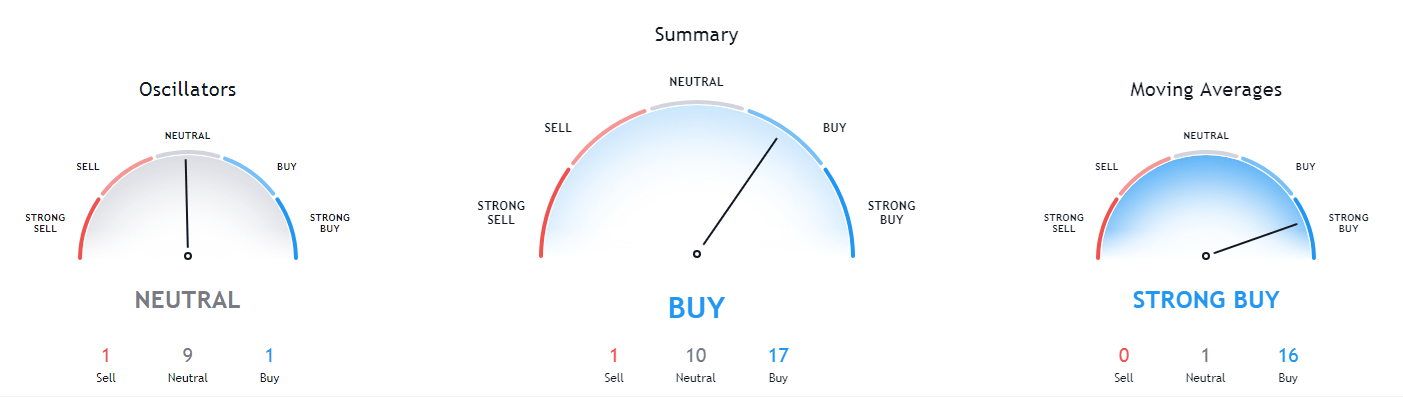
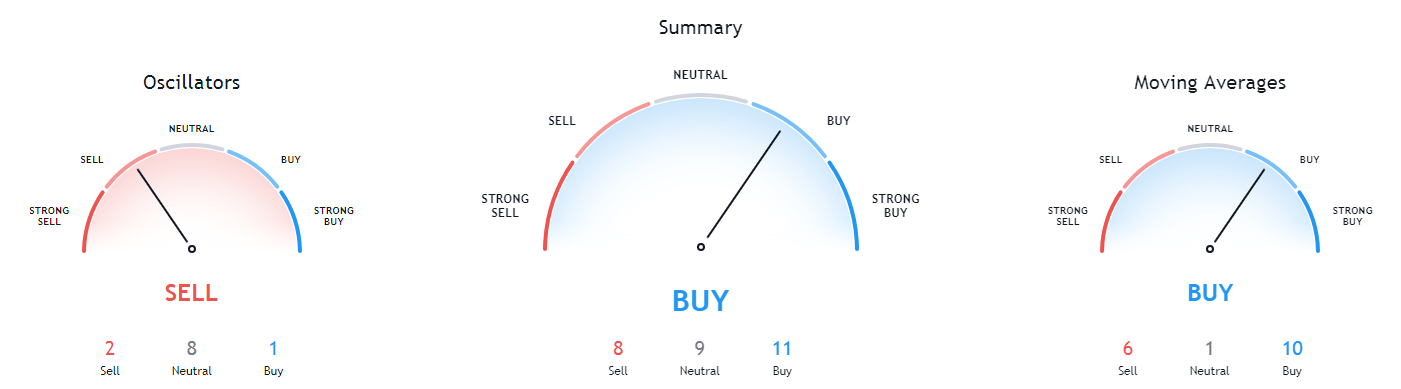
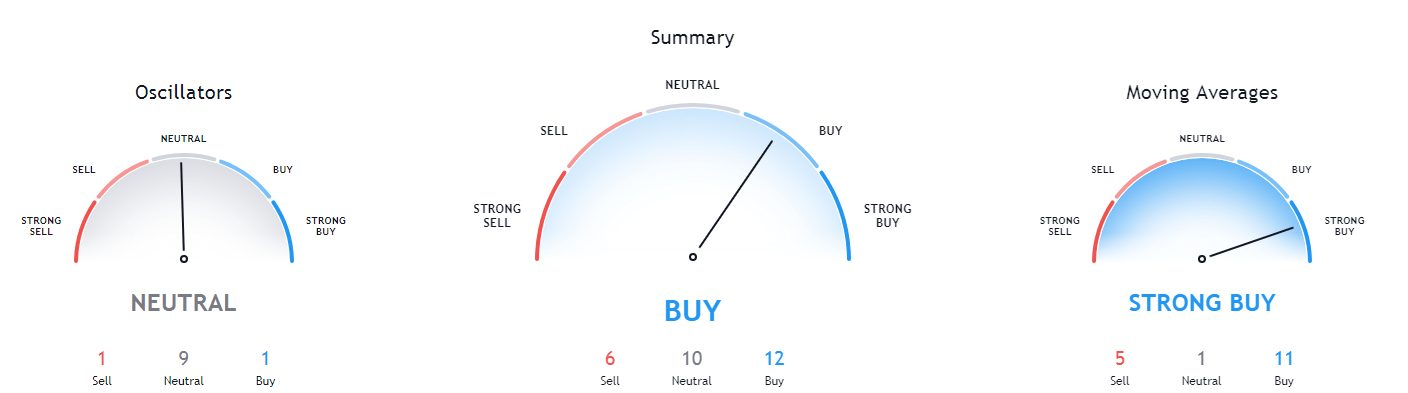
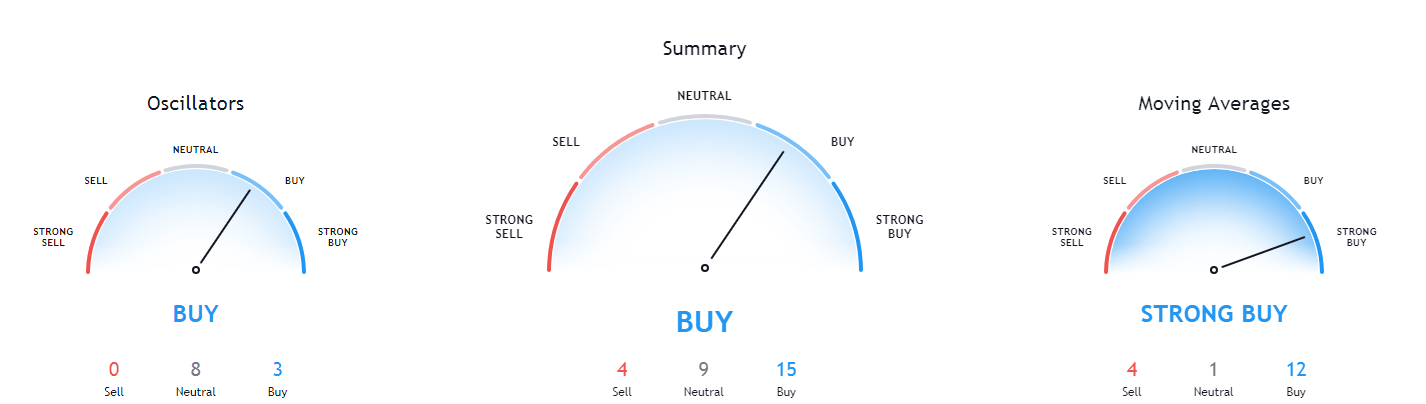
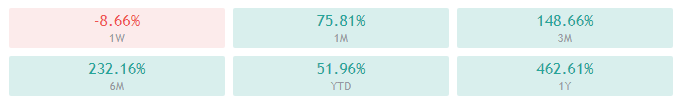
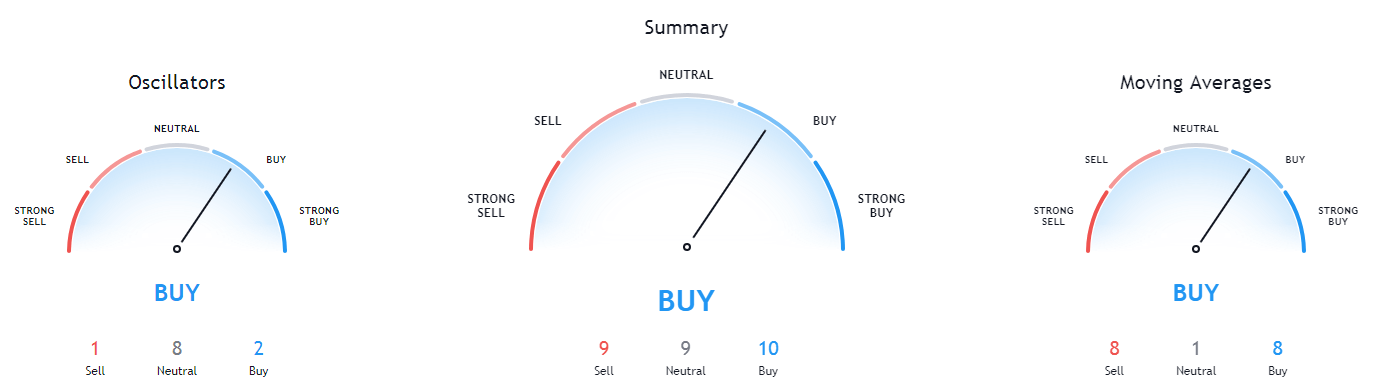
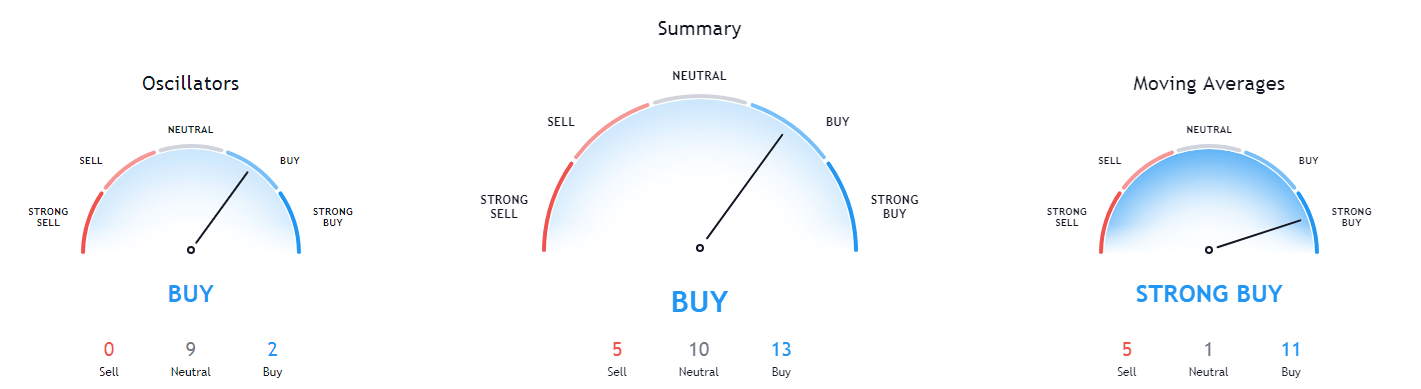
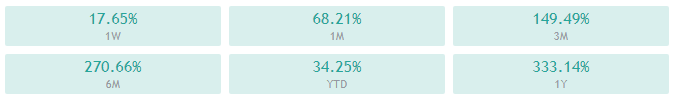
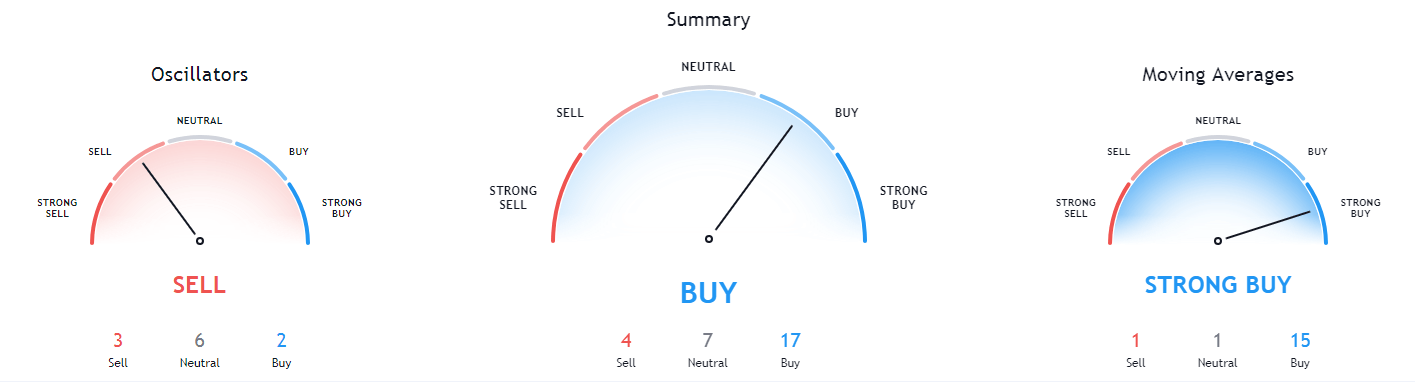
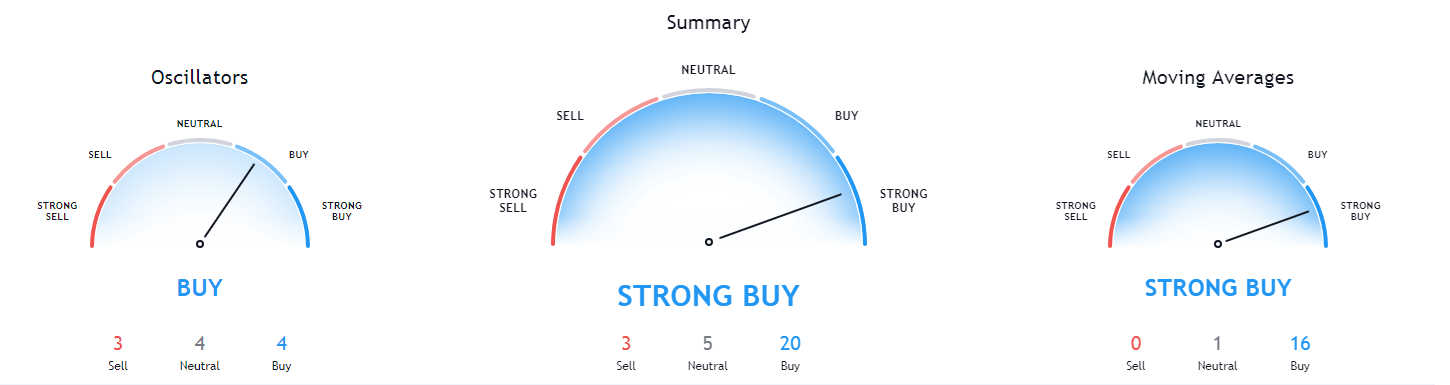
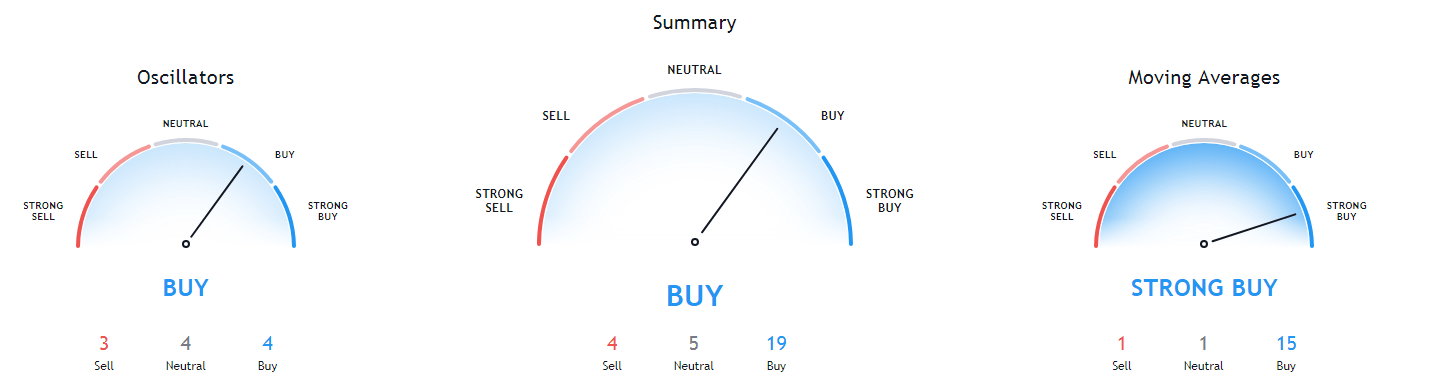
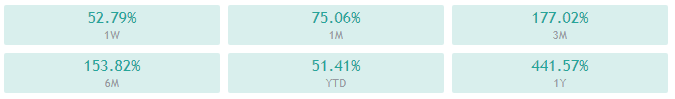
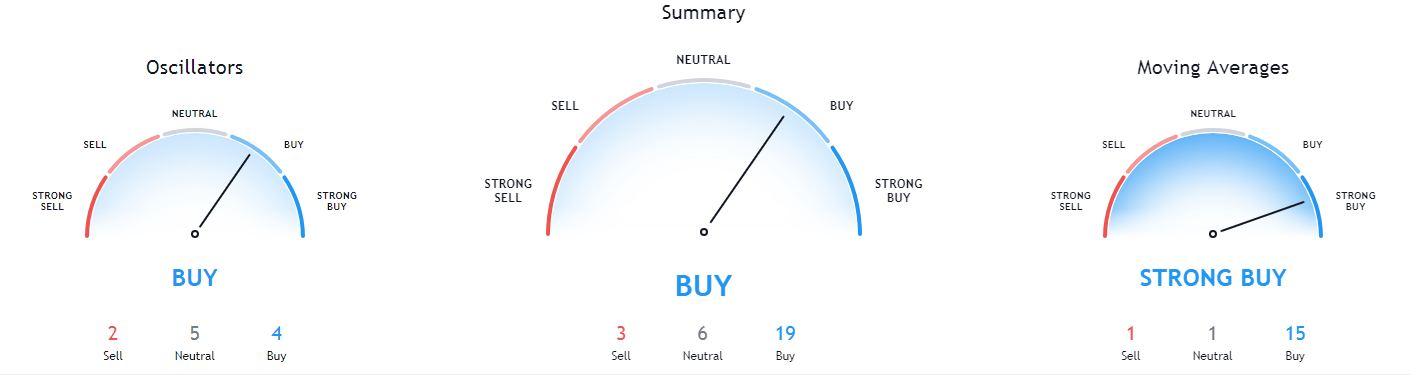
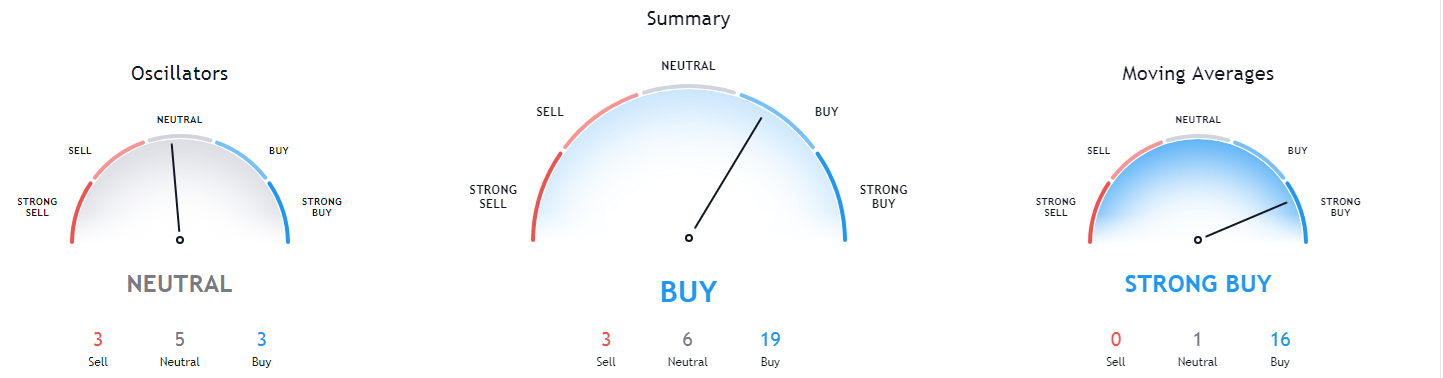
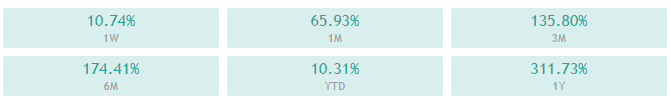
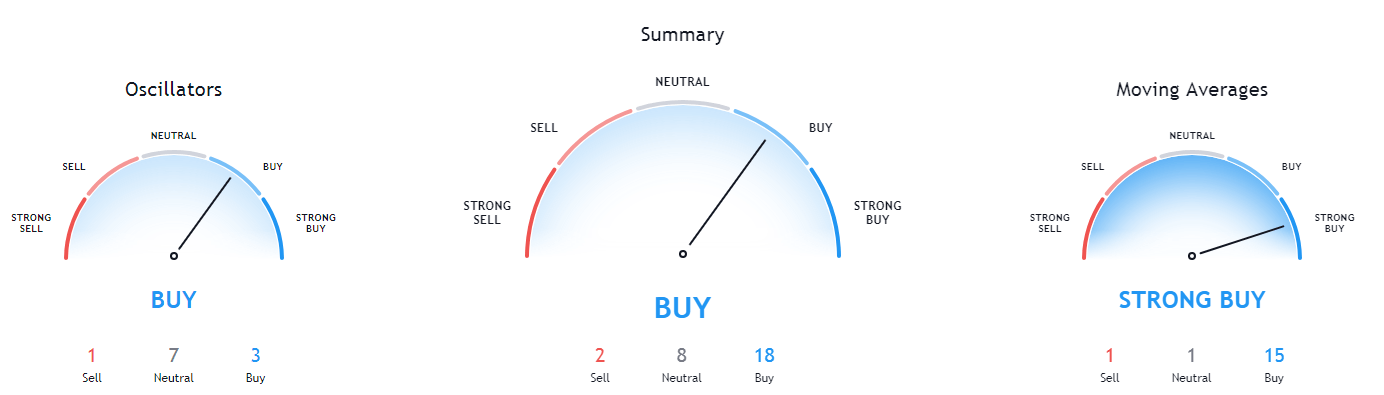
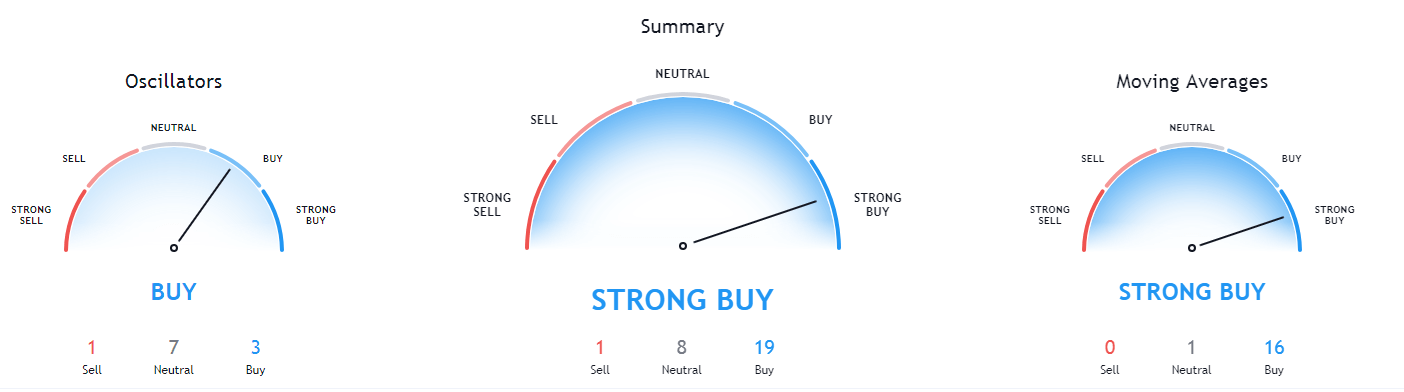
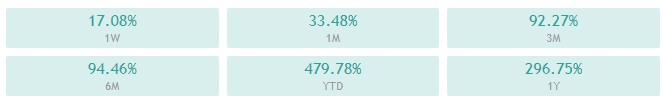
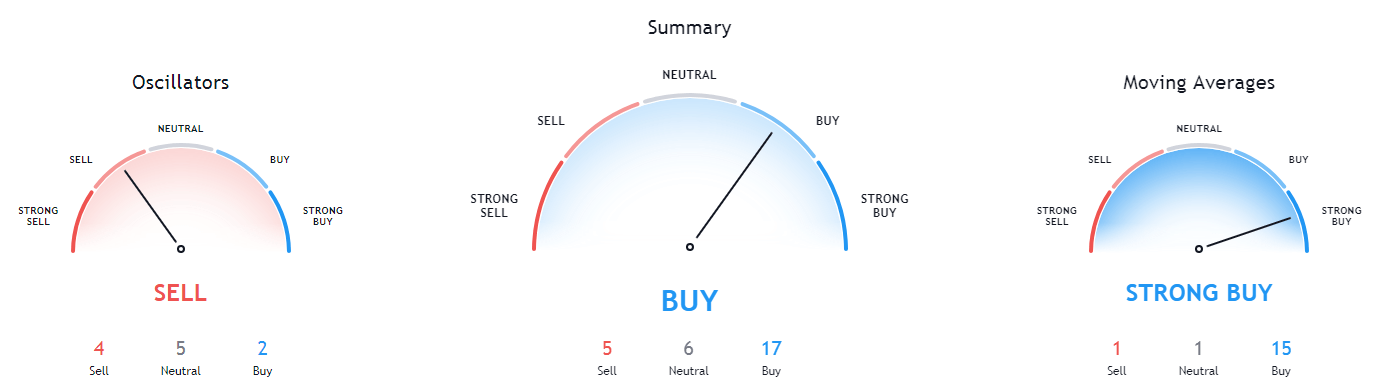
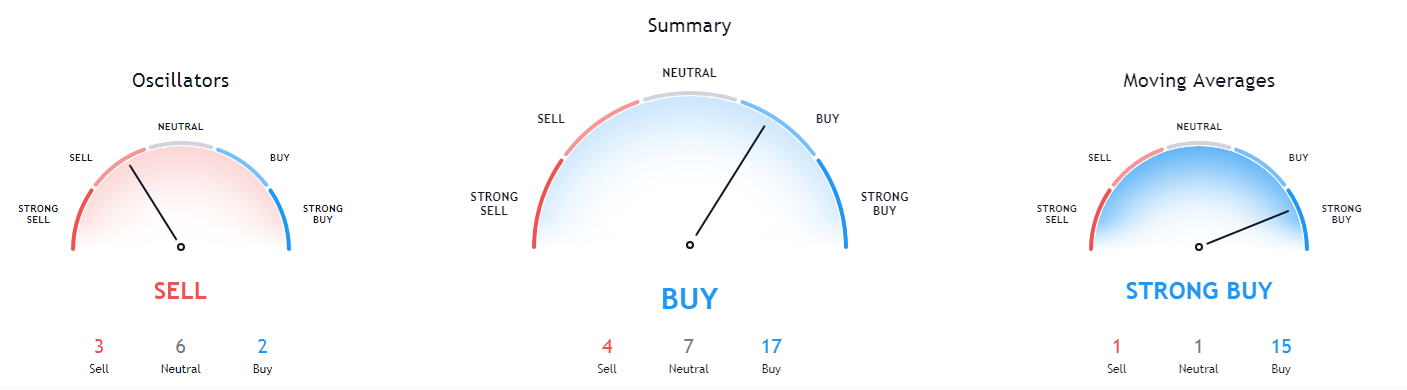
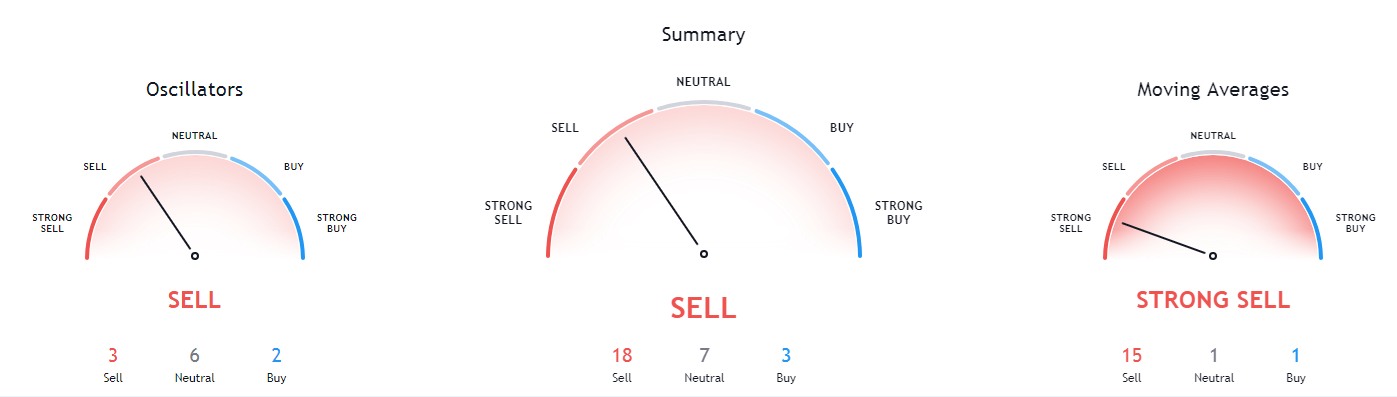
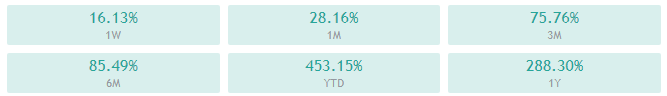
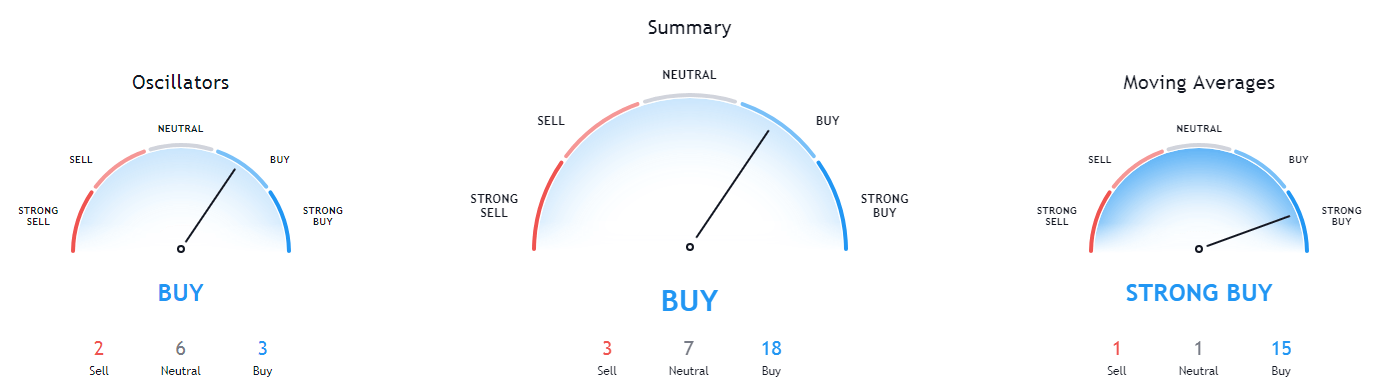
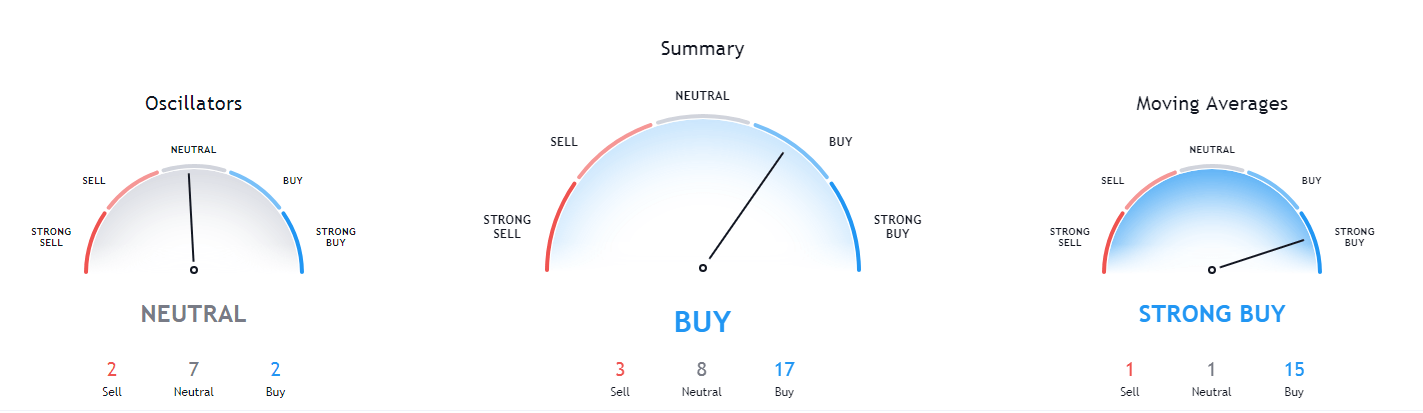
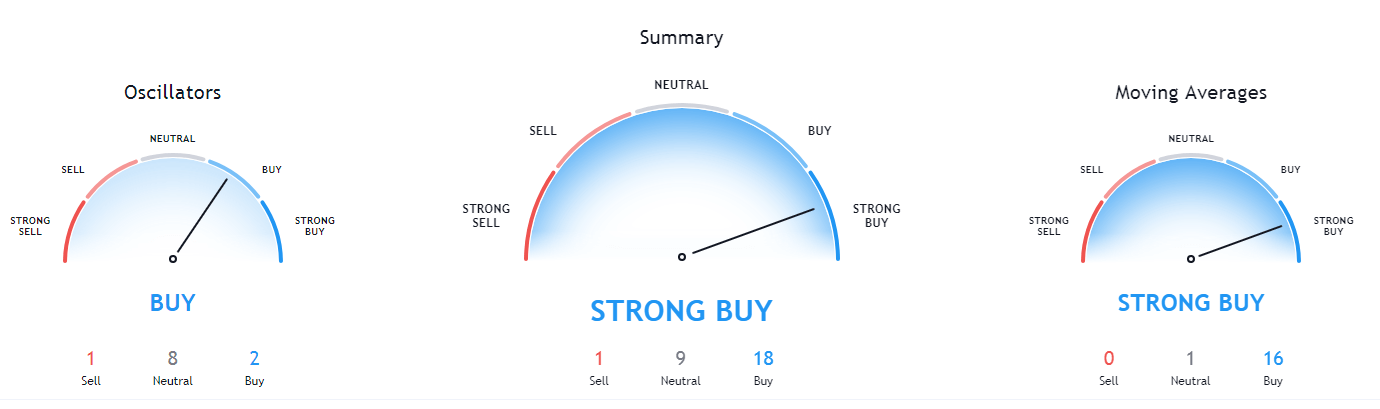
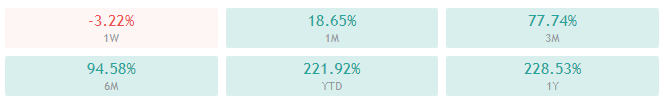
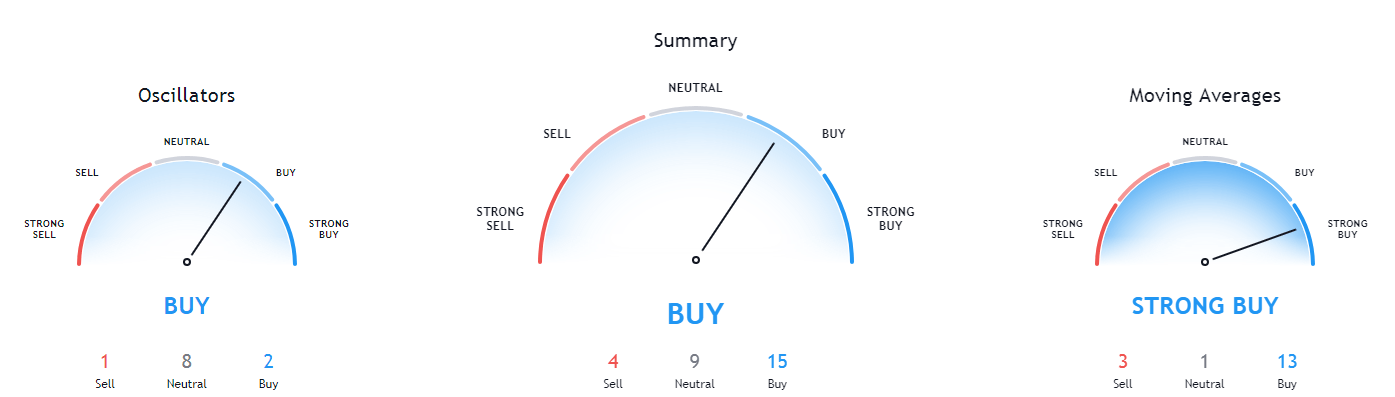
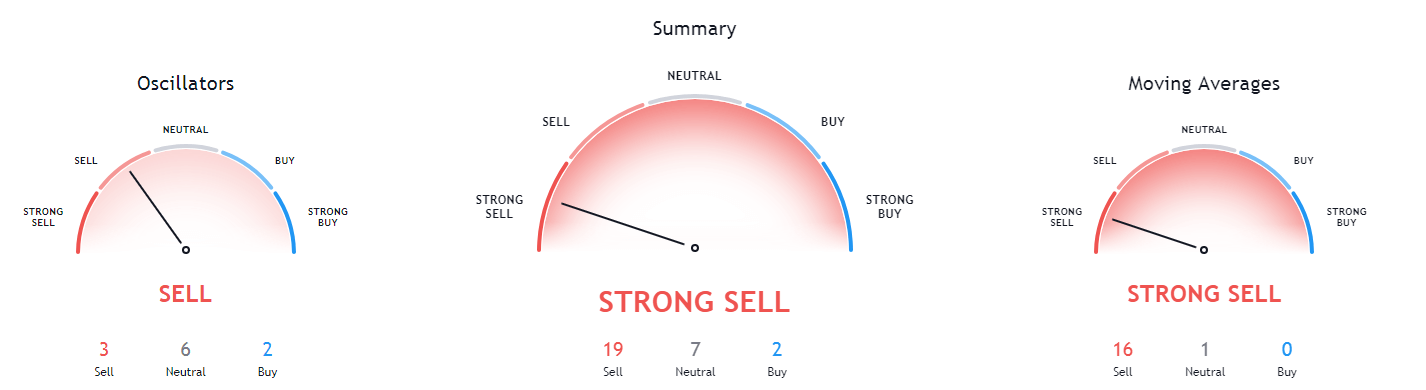
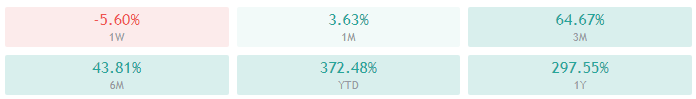
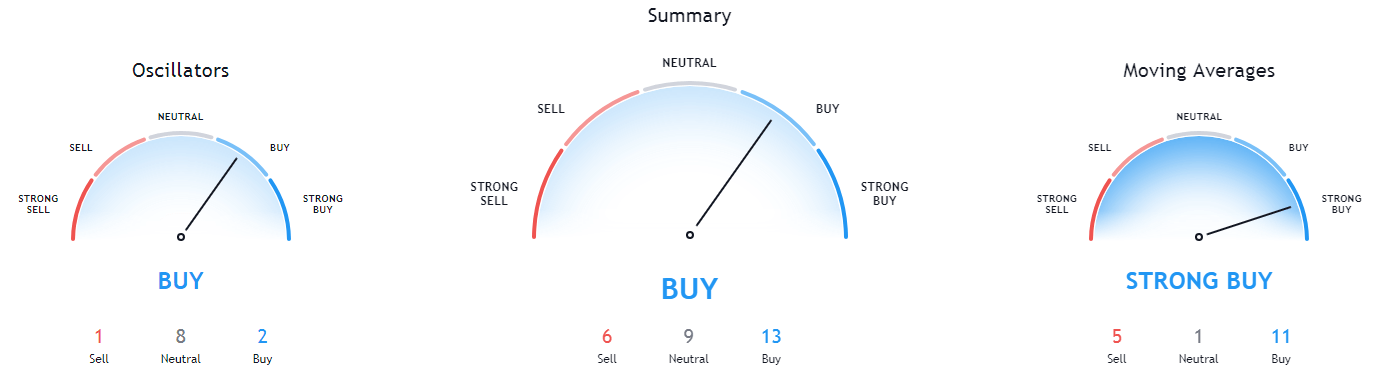
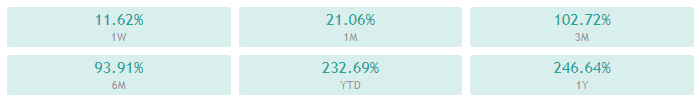
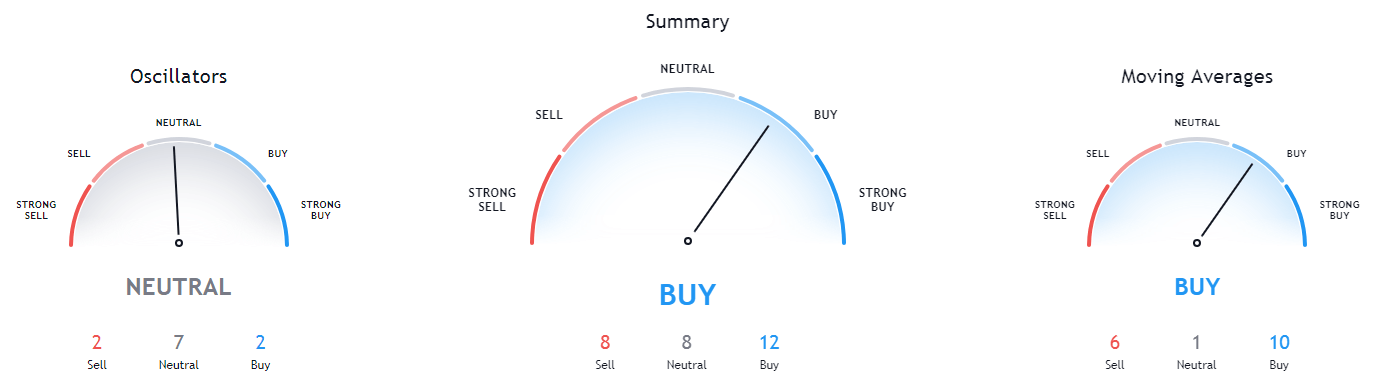
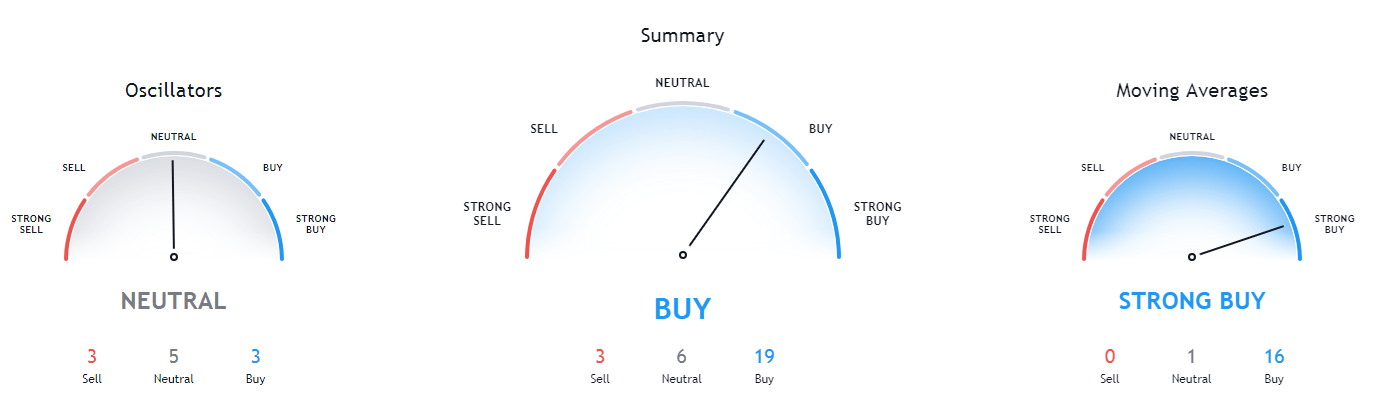
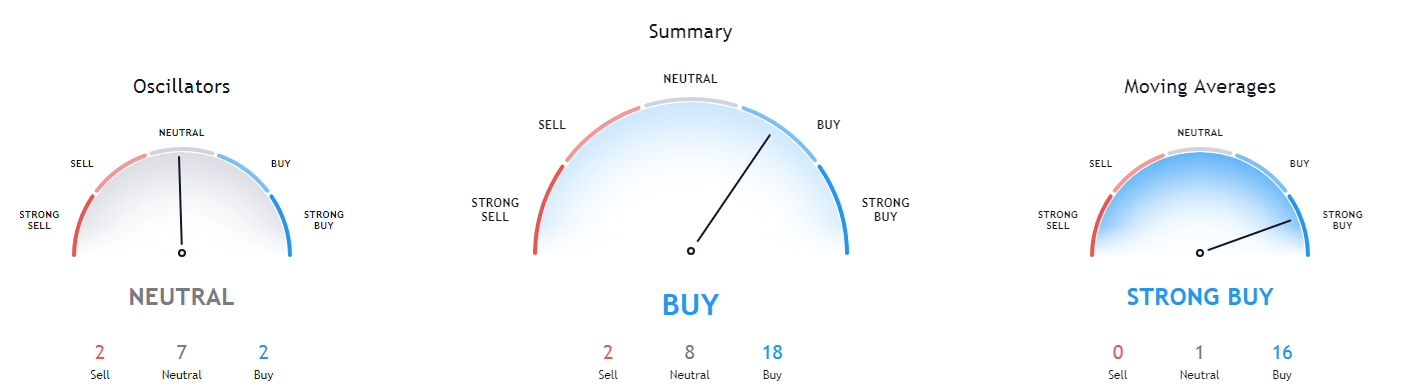
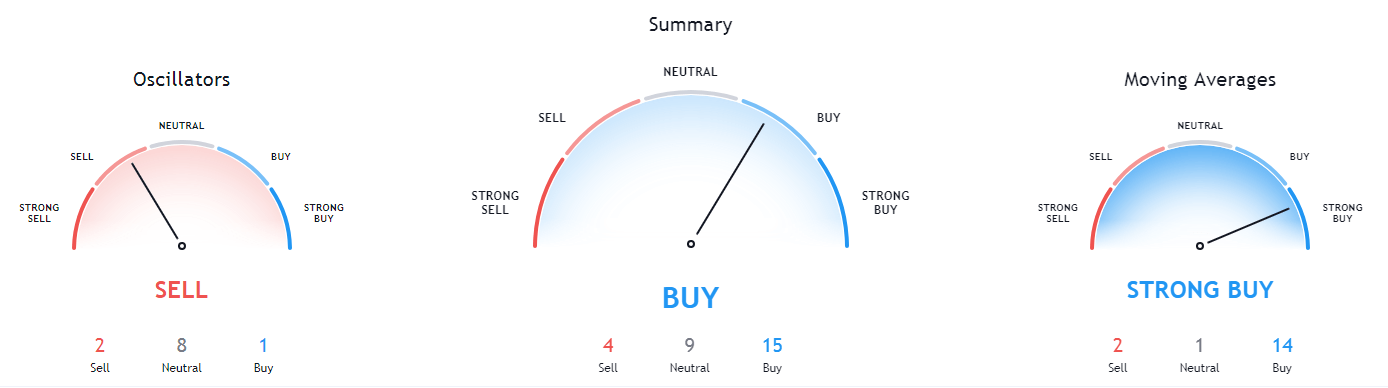
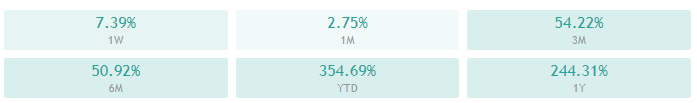
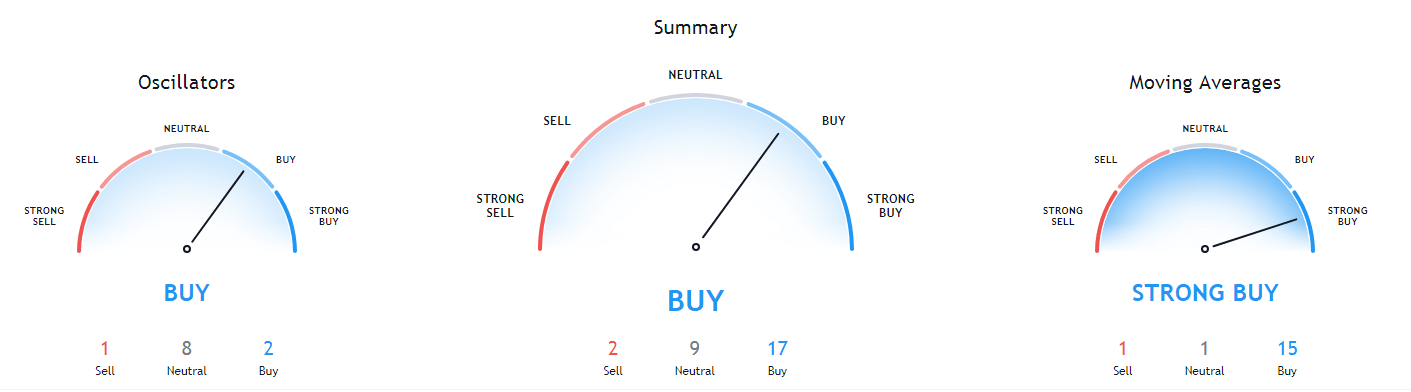
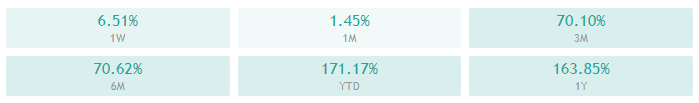
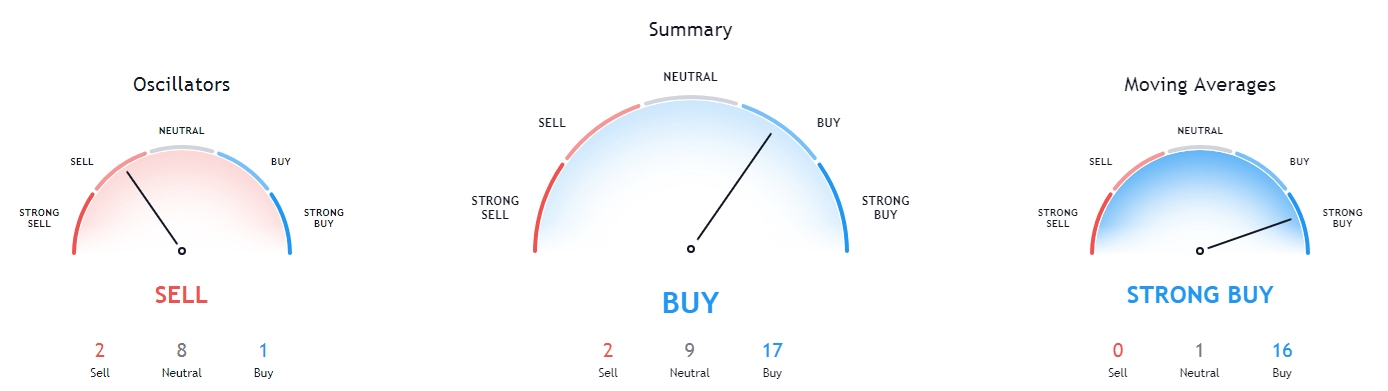
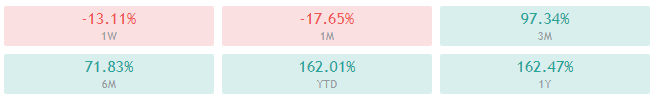
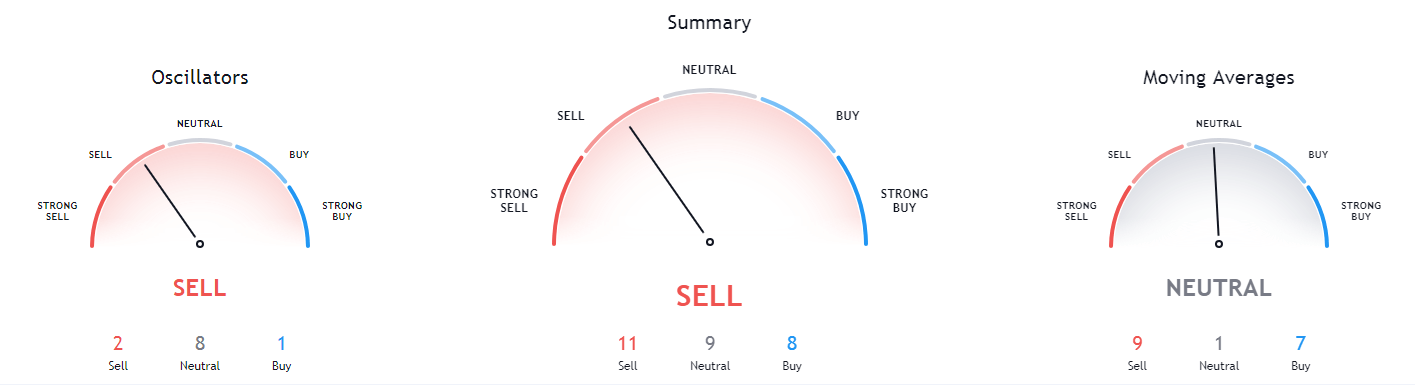
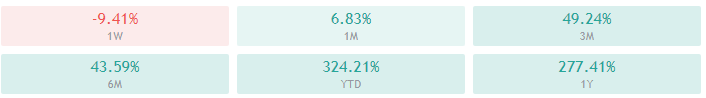
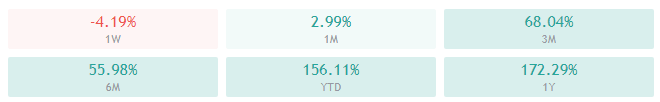
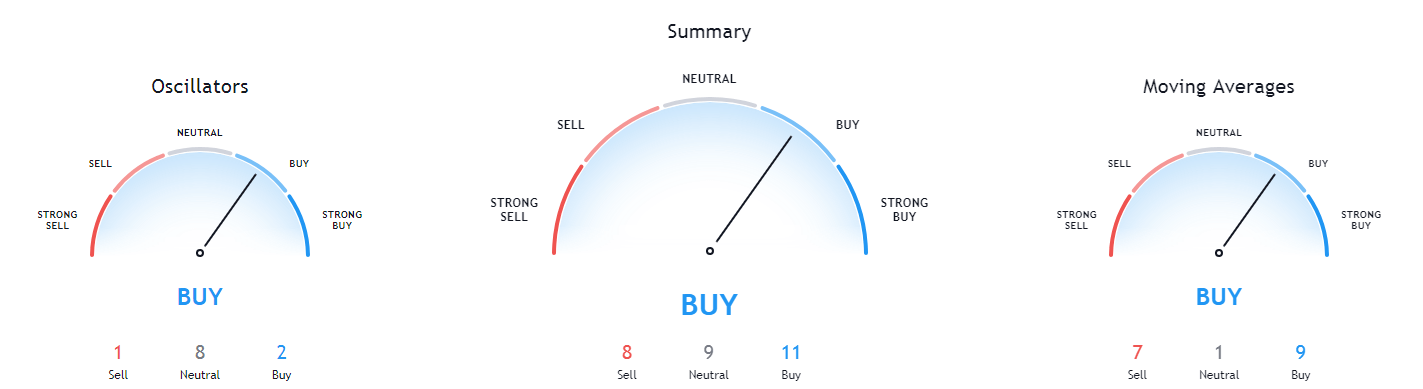
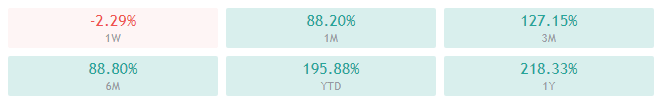
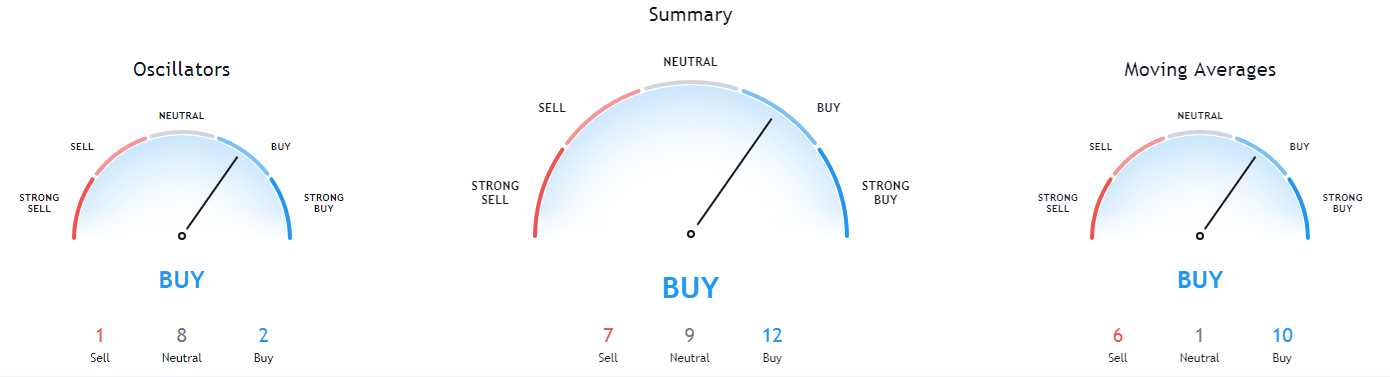
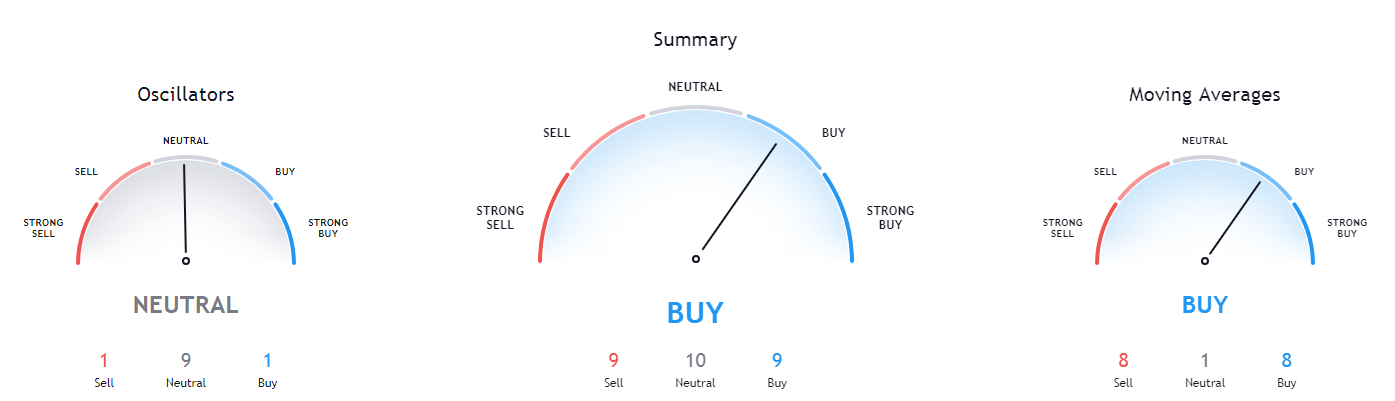
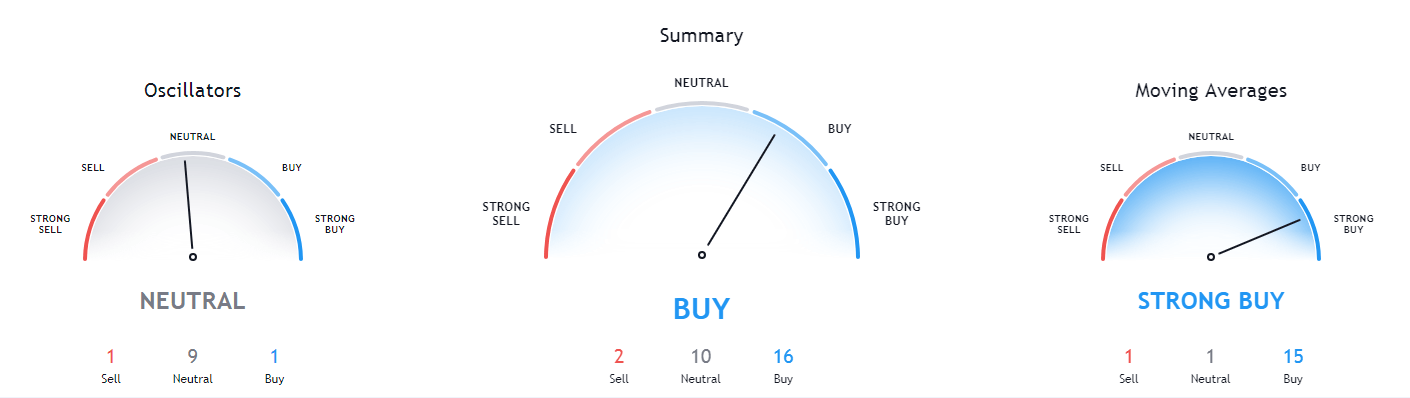
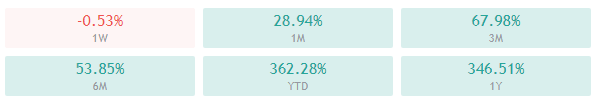
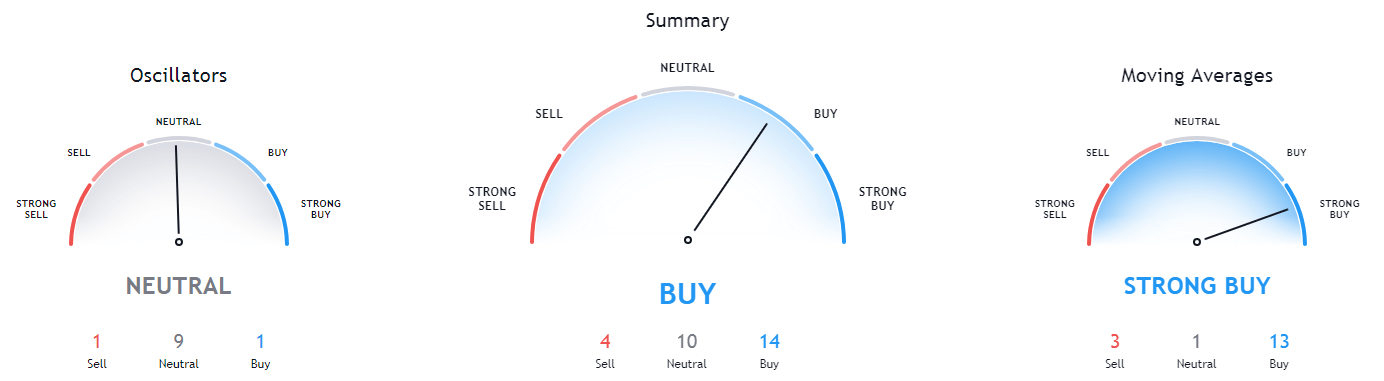
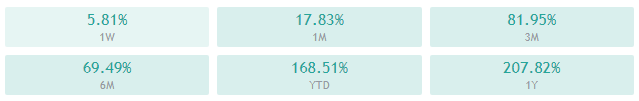
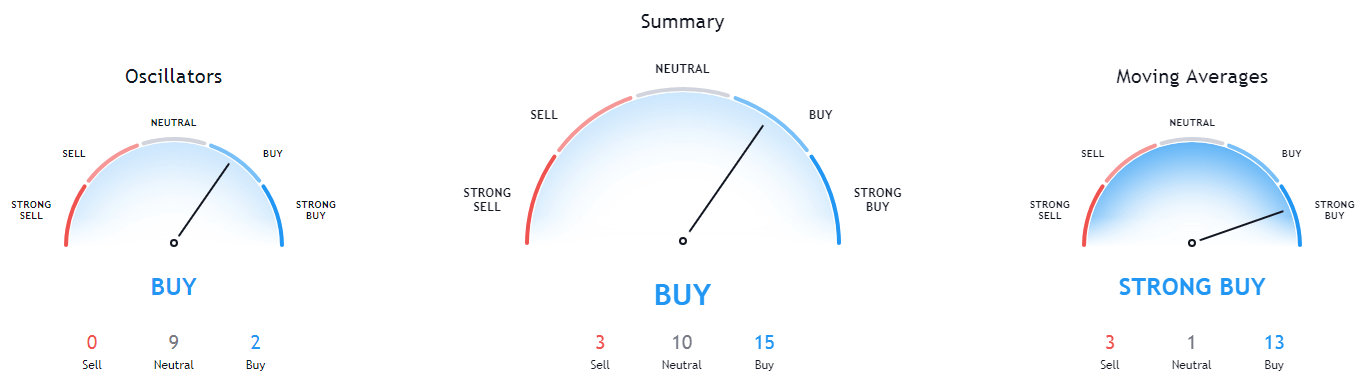
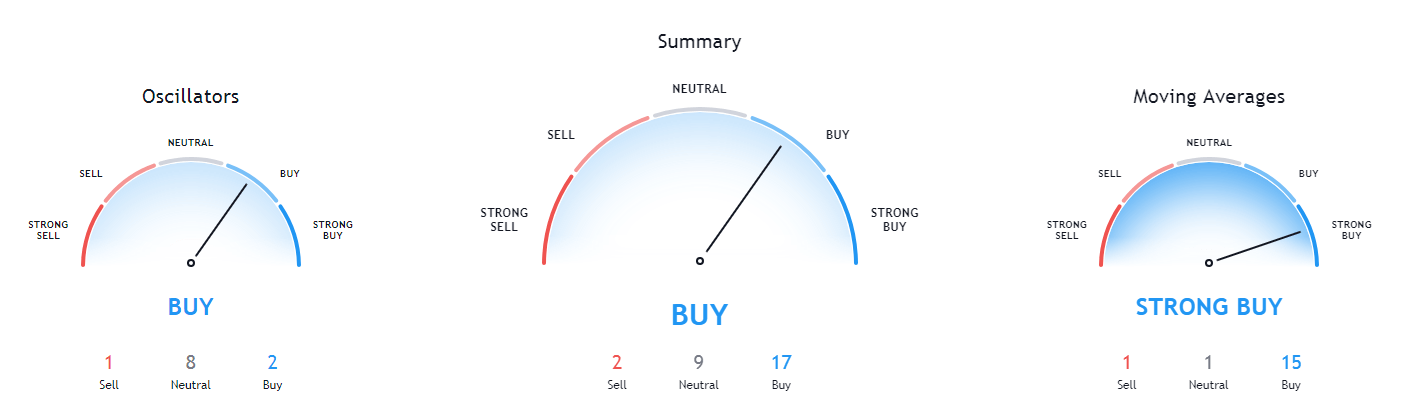
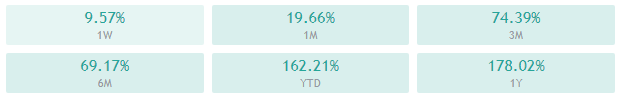
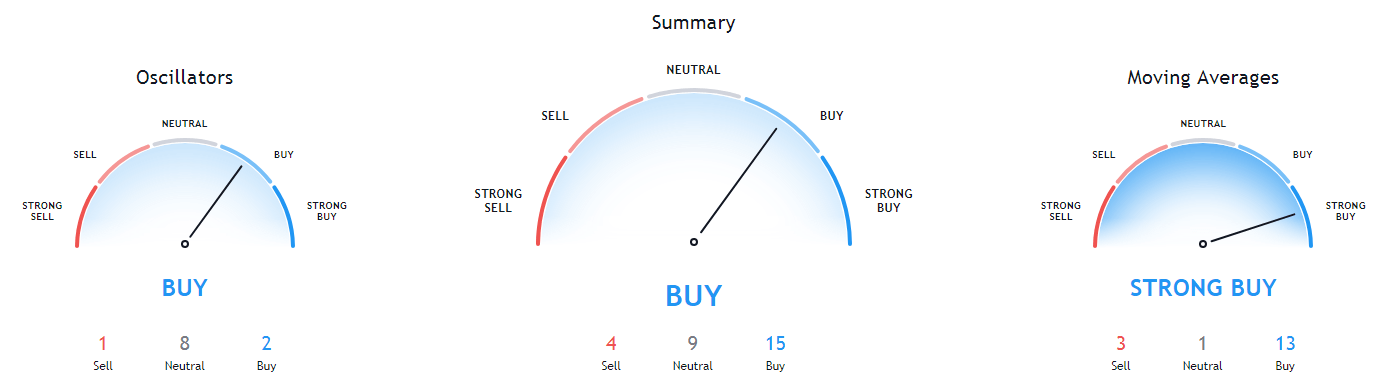
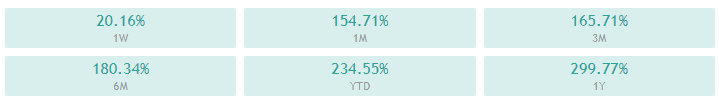
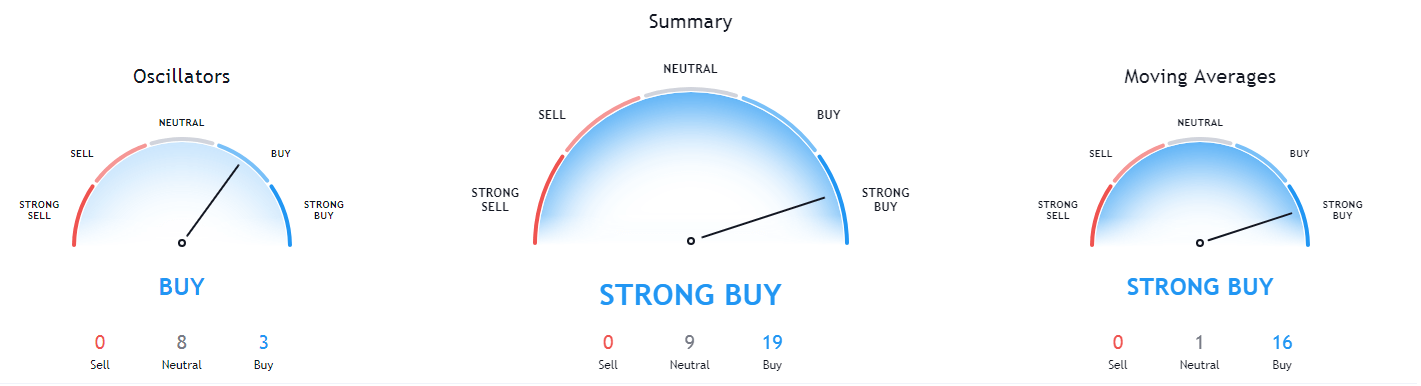
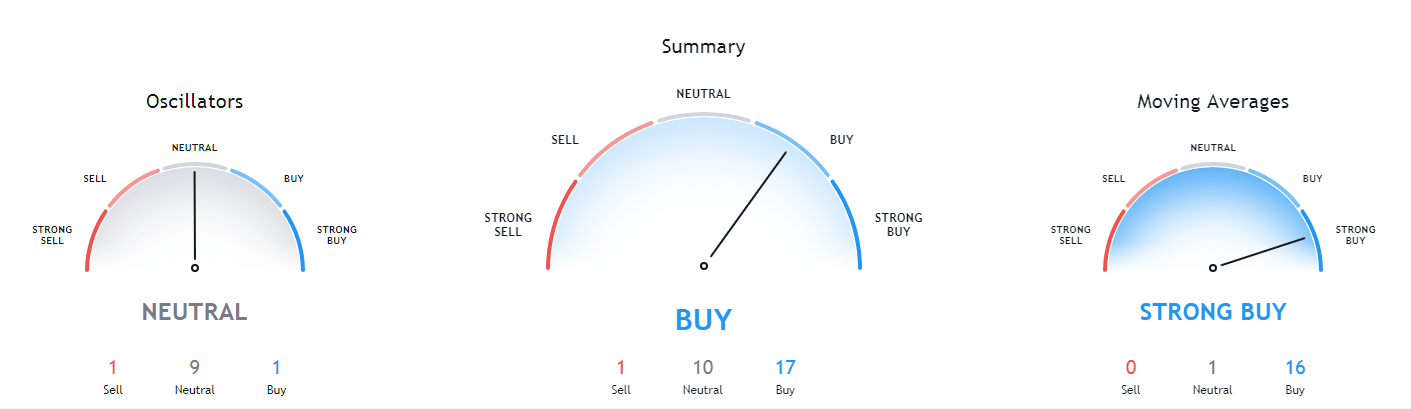
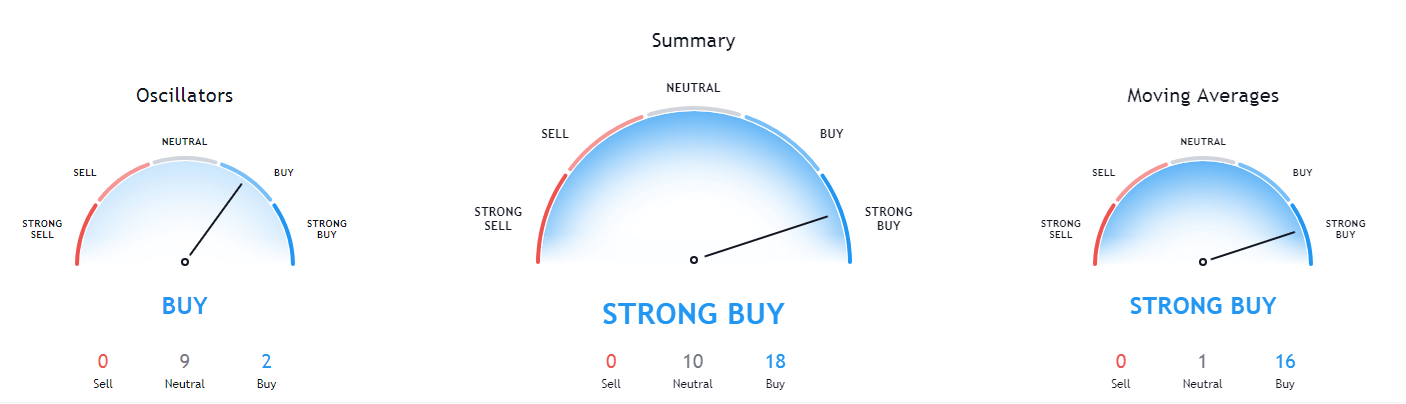
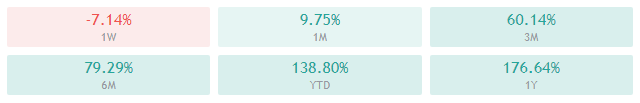
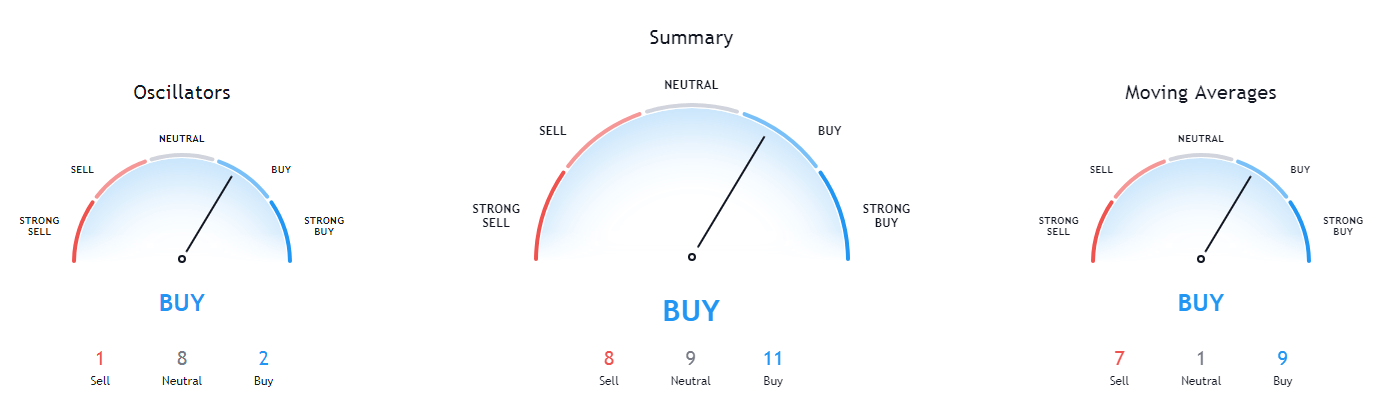
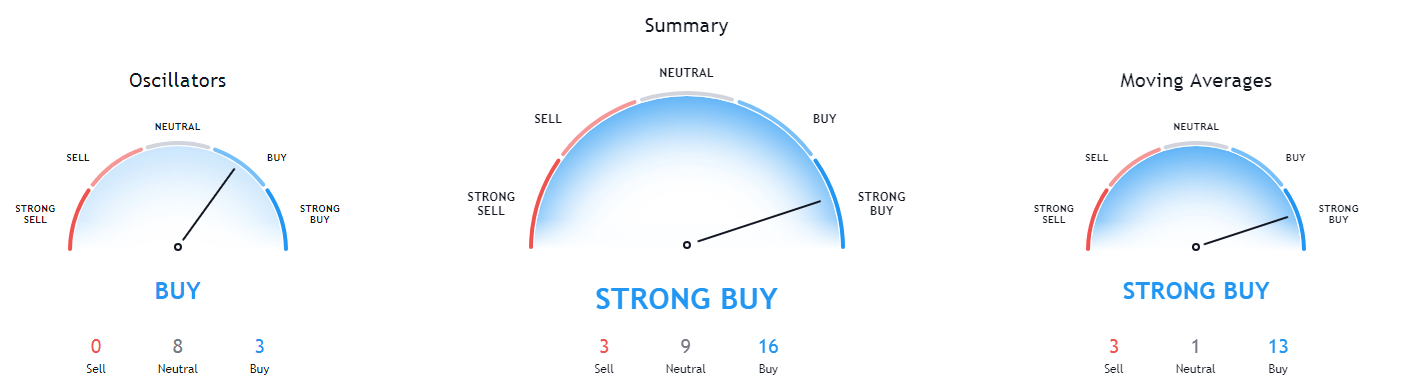
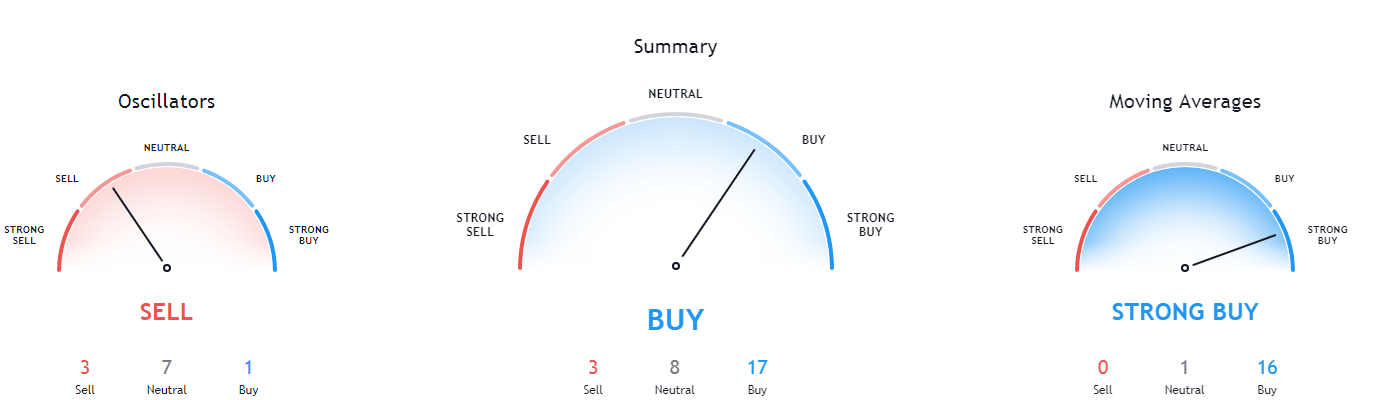
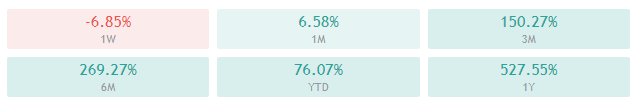
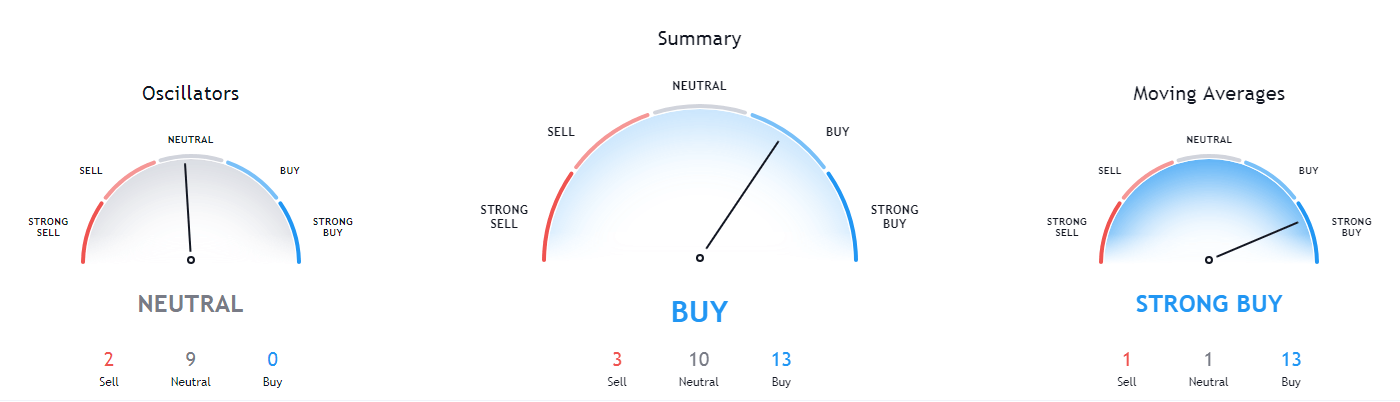
Bitcoin’s technicals on all time-frames are either neutral with a slight hint of bullishness or bullish with a slight hint of neutrality.
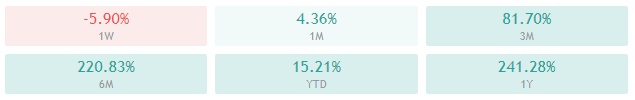
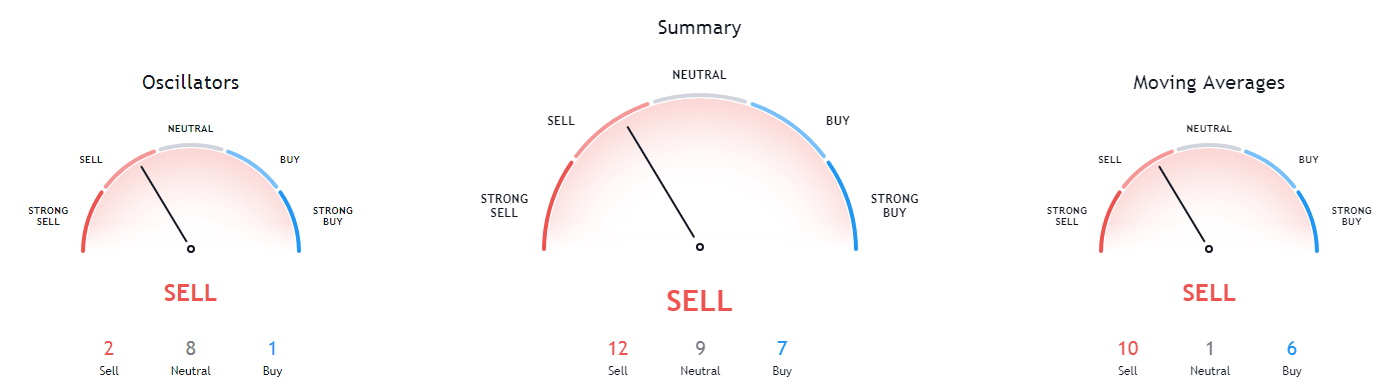
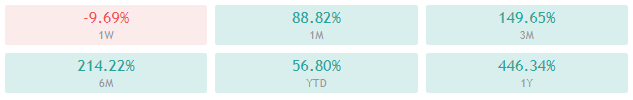
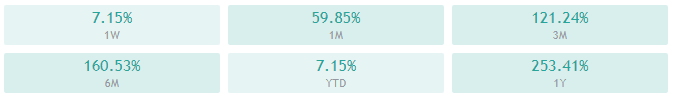
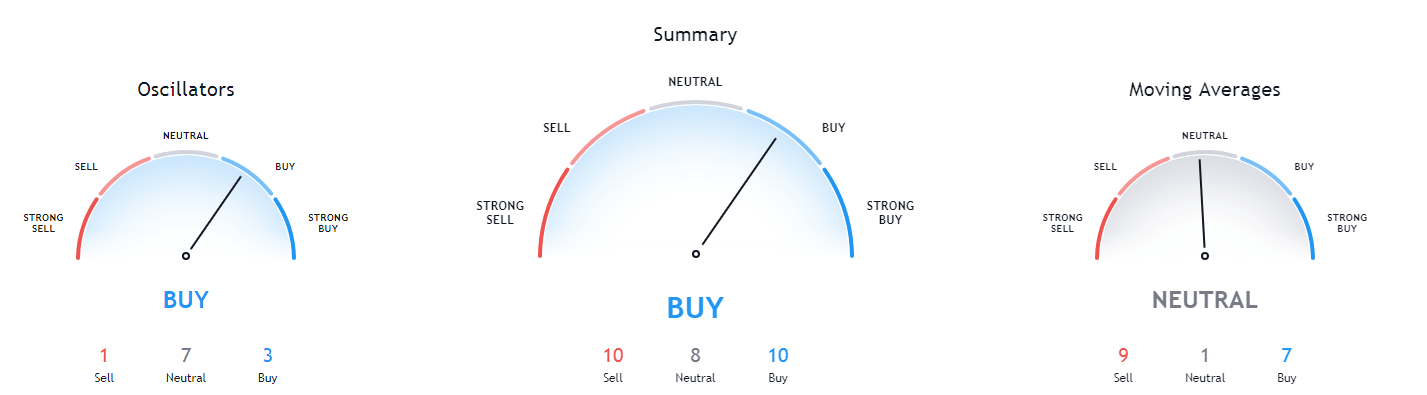
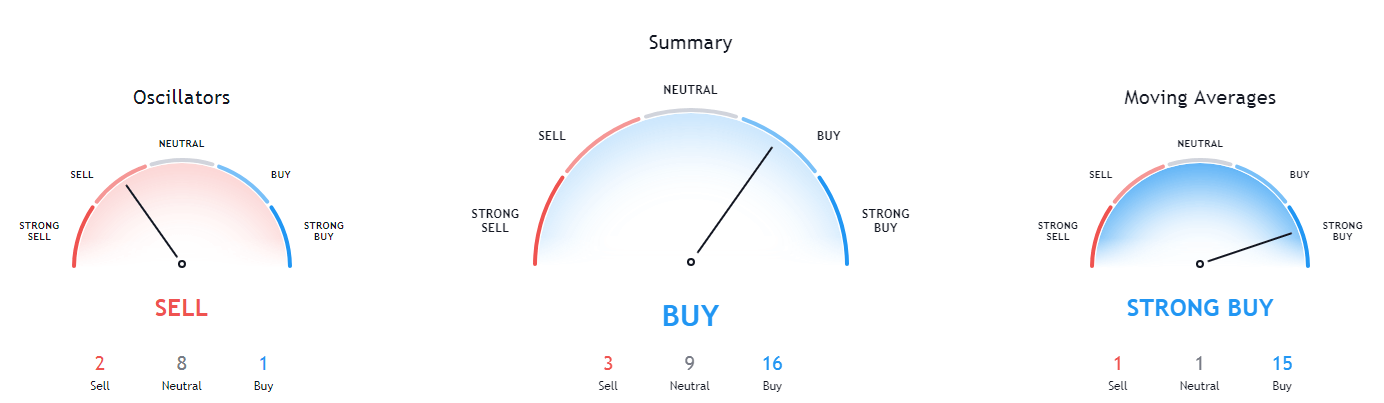
BTC/USD 1-day Technicals
Technical factors (1-hour Chart):
- Price is above its 50-period EMA and at its 21-period EMA
- Price is at its middle Bollinger band
- RSI is neutral (51.01)
- Volume is above average
Key levels to the upside: Key levels to the downside:
1: $34,627 1: $32,350
2: $37,445 2: $30,072
3: $38,000 3: $27,960
Ethereum
After yesterday’s failed break of the top downtrend line, the second-largest cryptocurrency by market cap pushed past and broke its descending pattern. Its price (at one point) went past the $1,350 level, but as bulls couldn’t confidently hold this level, bears initiated a pullback.
Ethereum’s short-term price direction will be dictated by how the cryptocurrency handles the top downtrend line (which is now a support rather than a resistance line) as well as by Bitcoin’s price direction.
ETH/USD 1-hour Chart
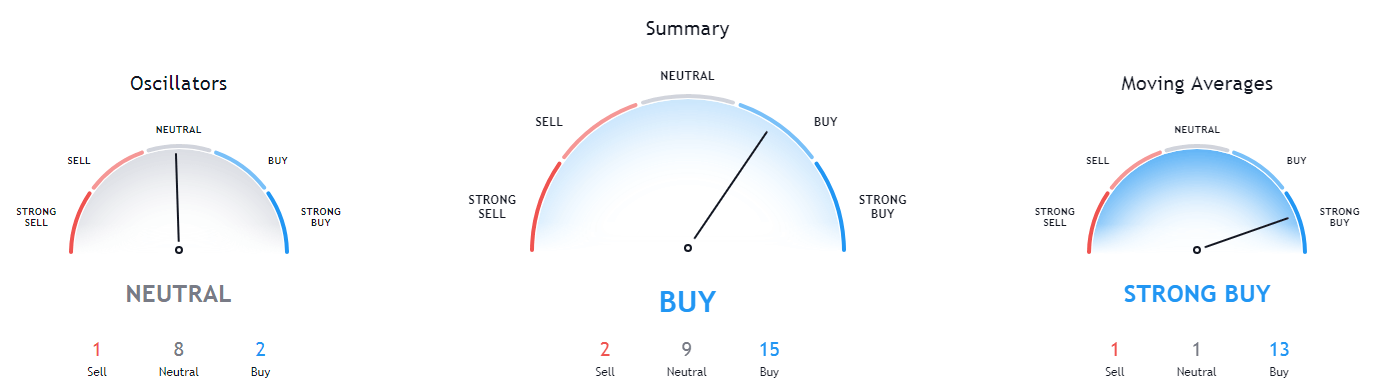
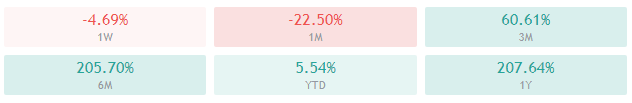
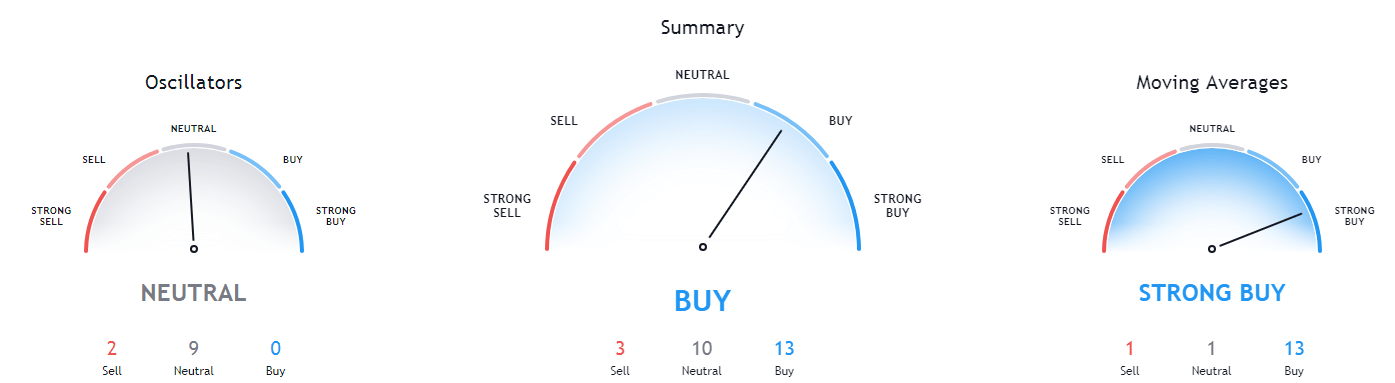
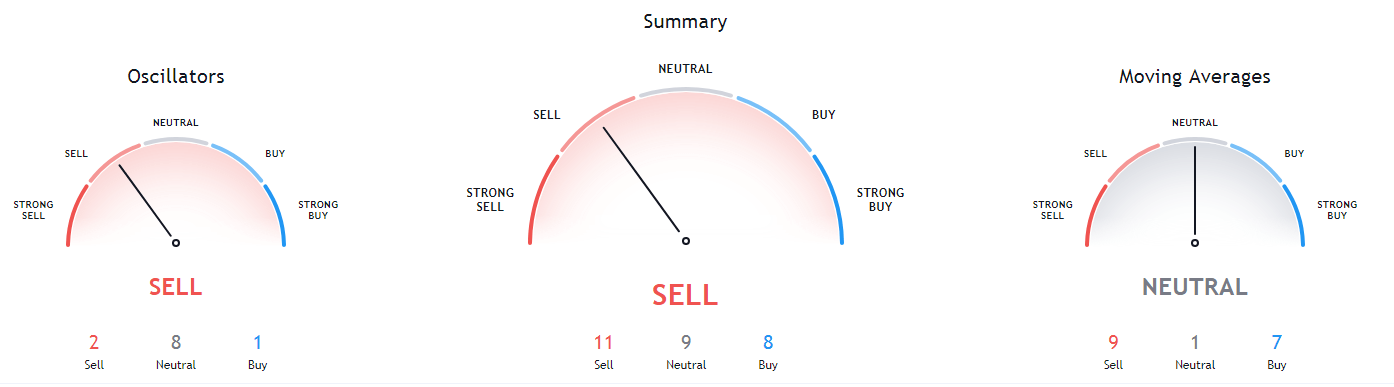
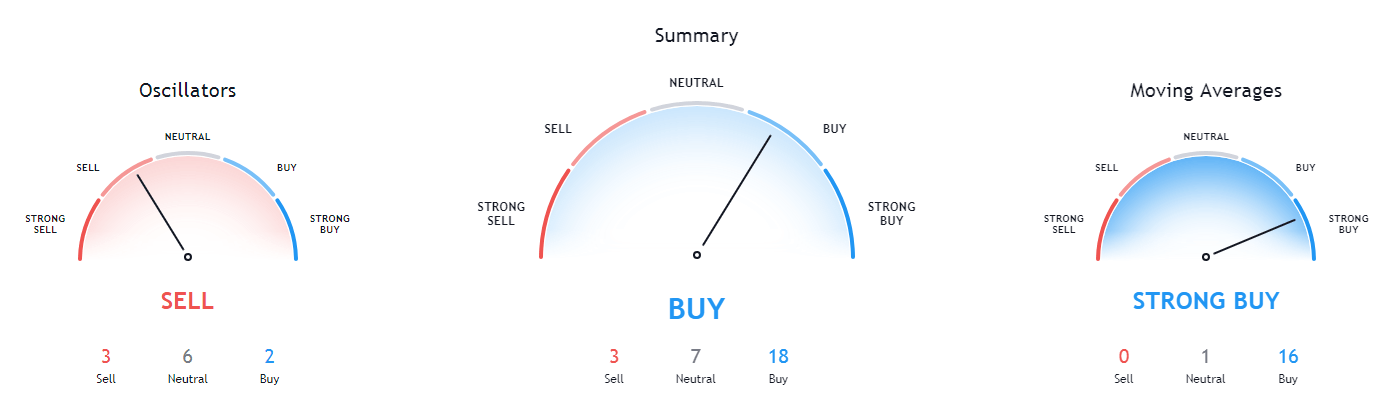
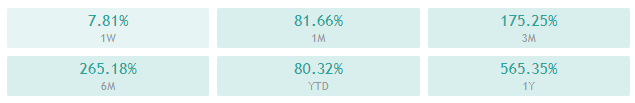
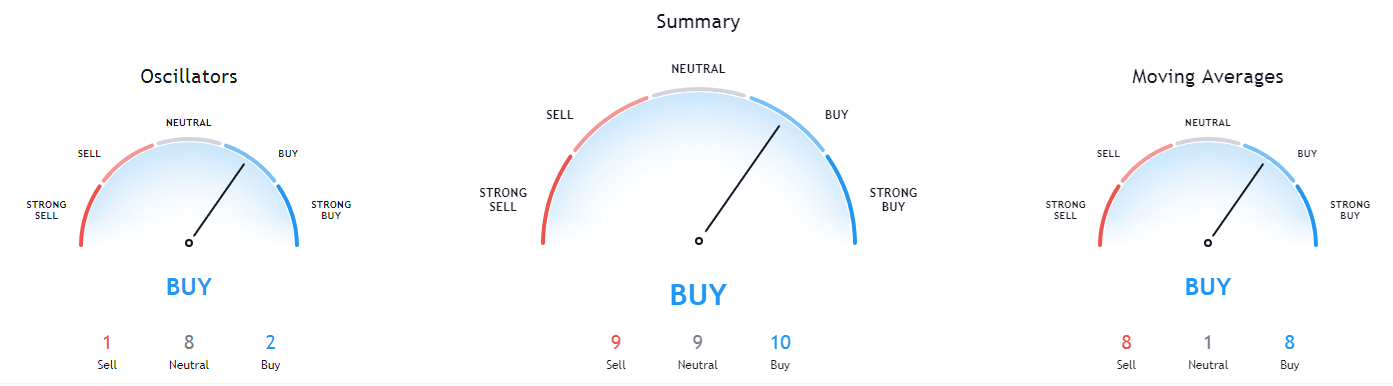
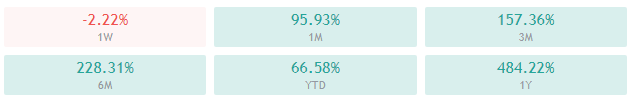
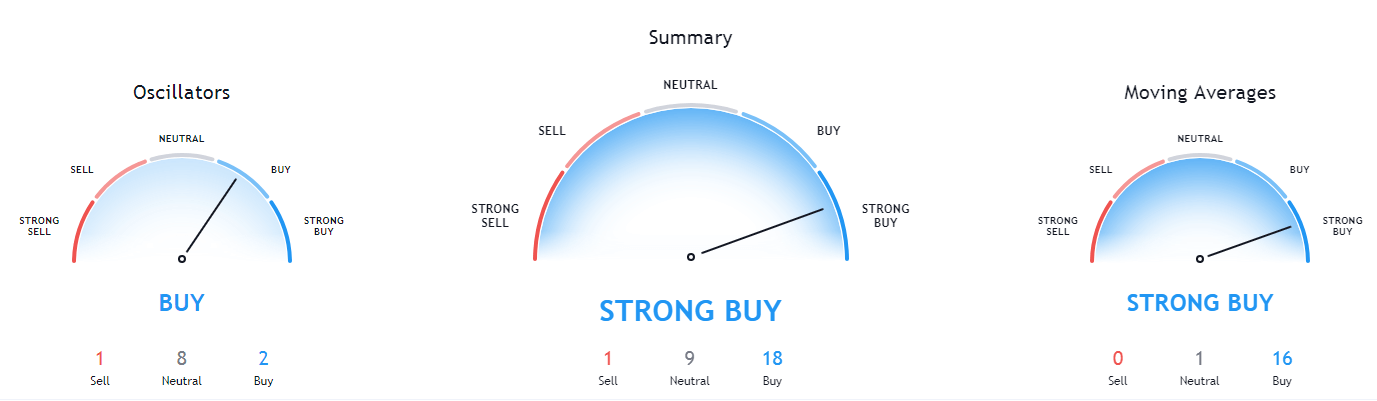
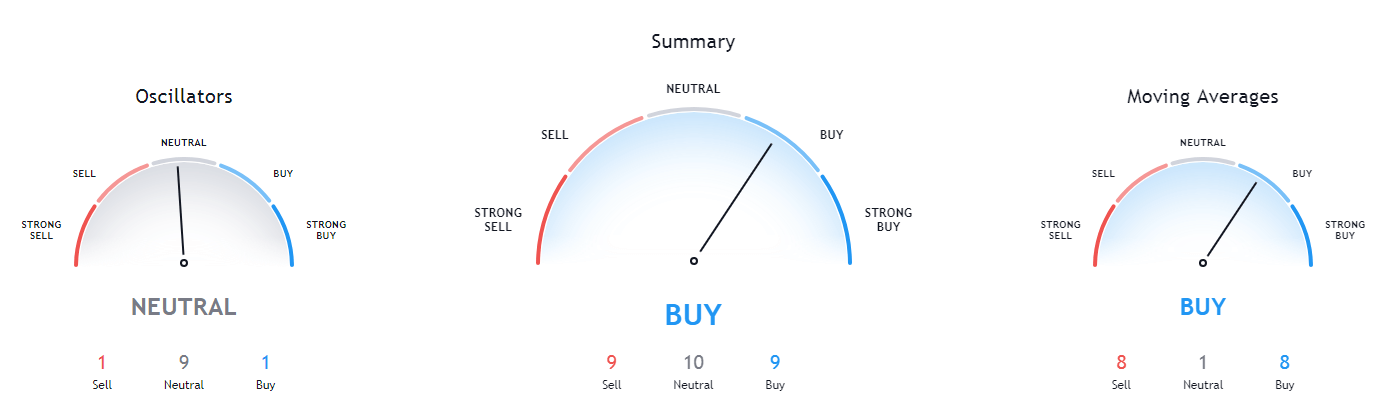
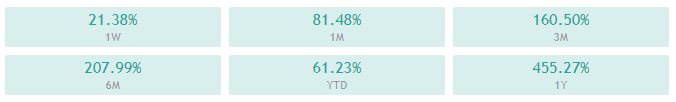
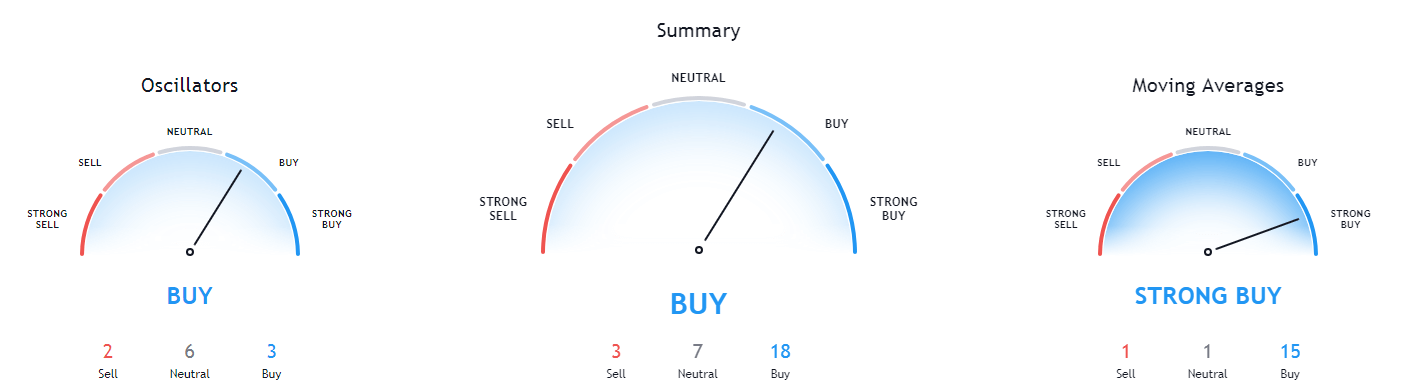
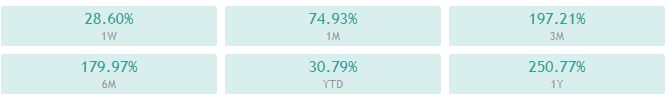
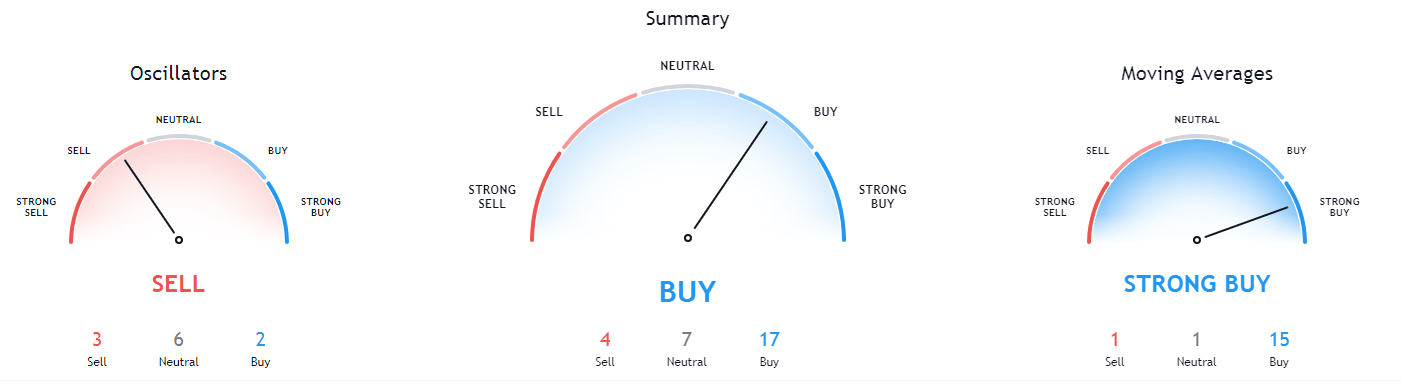
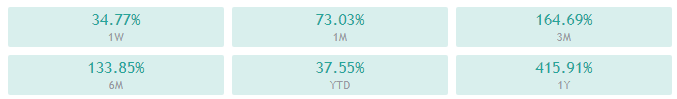
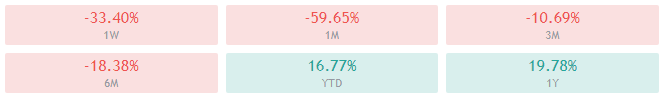
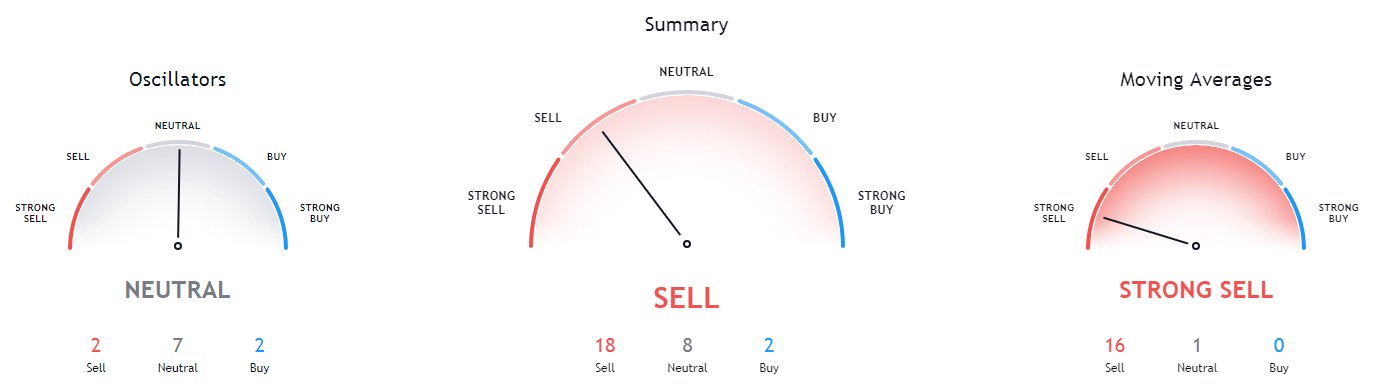
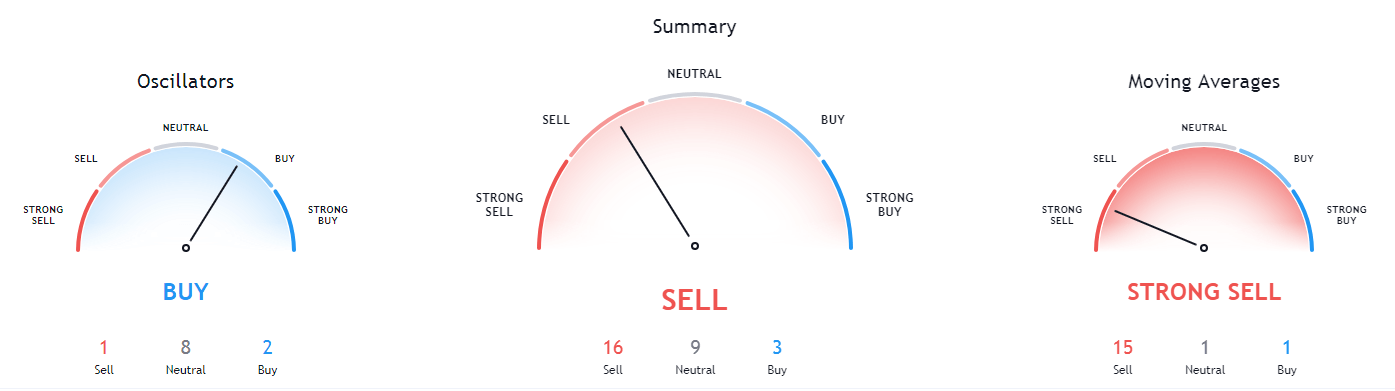
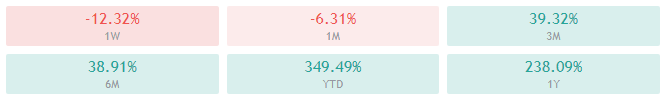
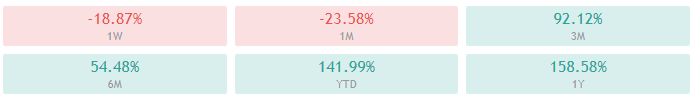
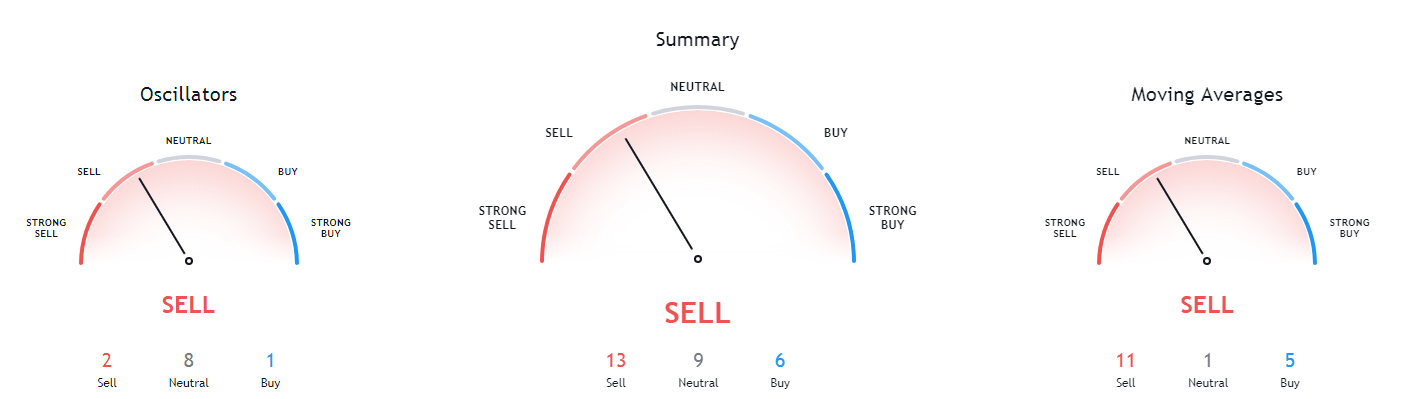
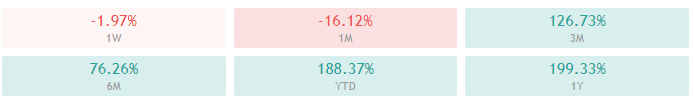
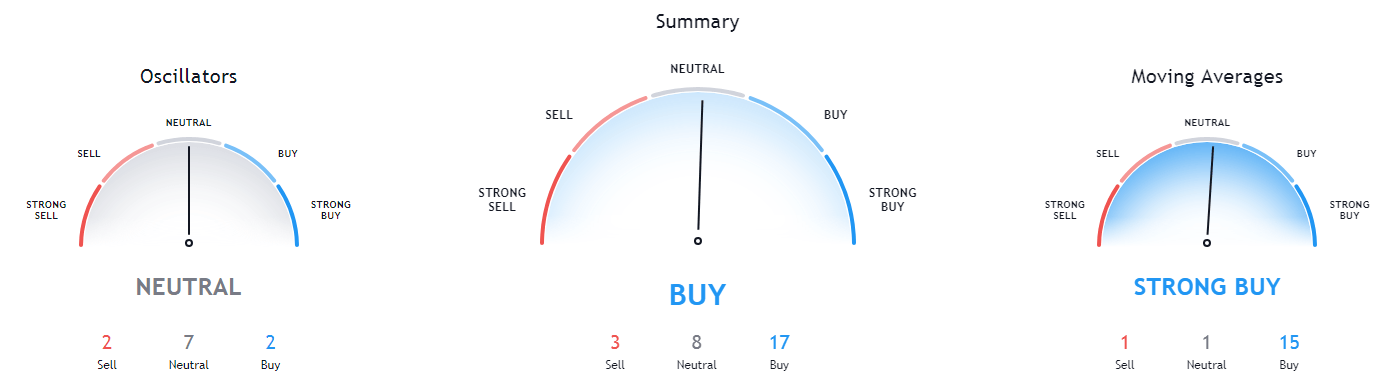
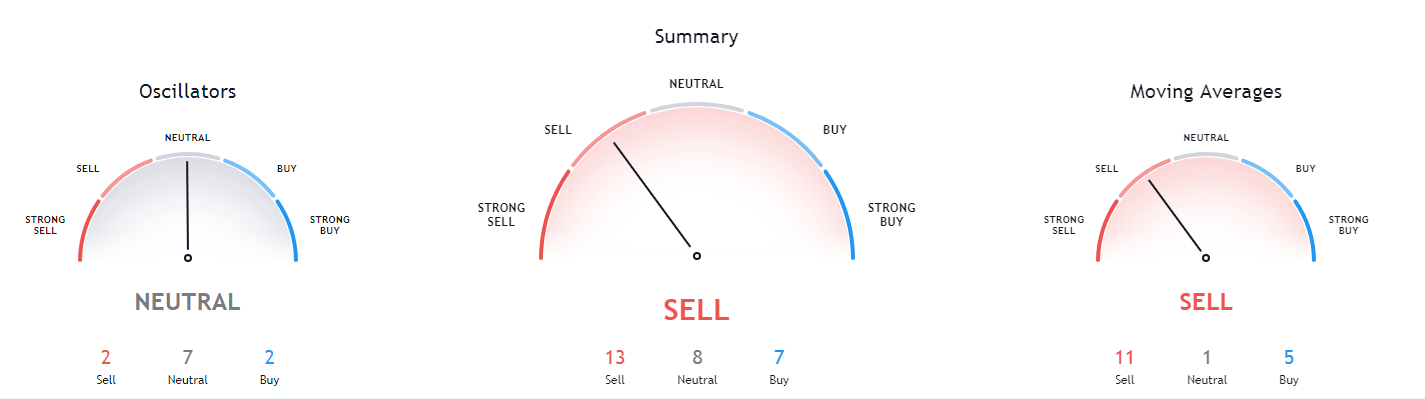
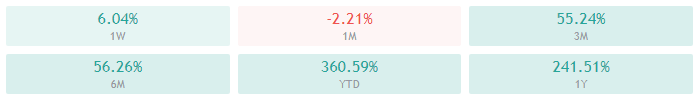
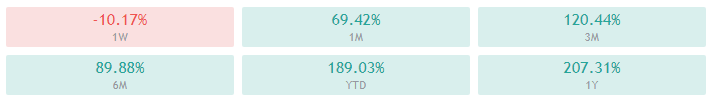
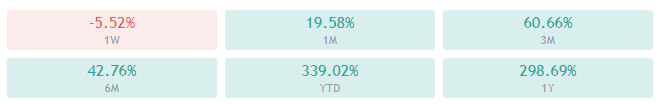
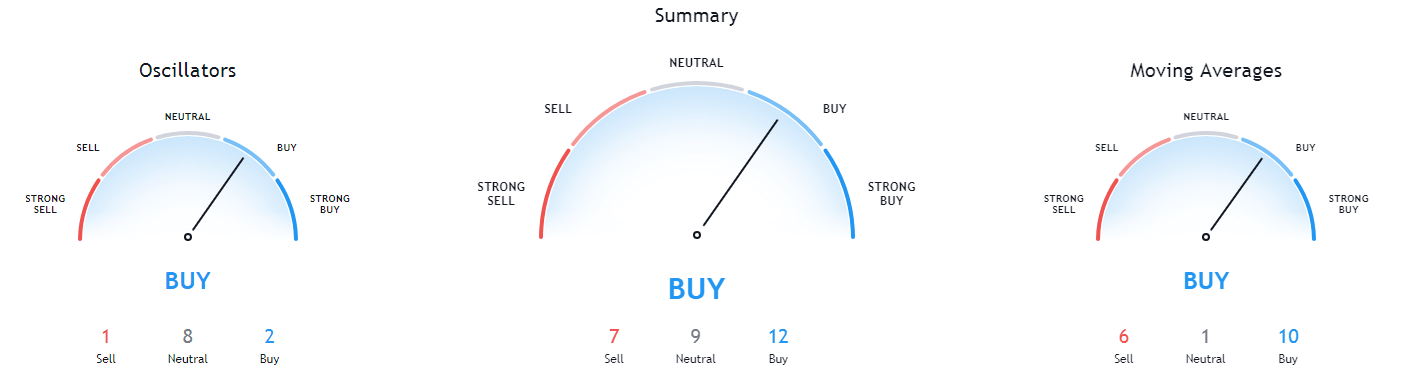
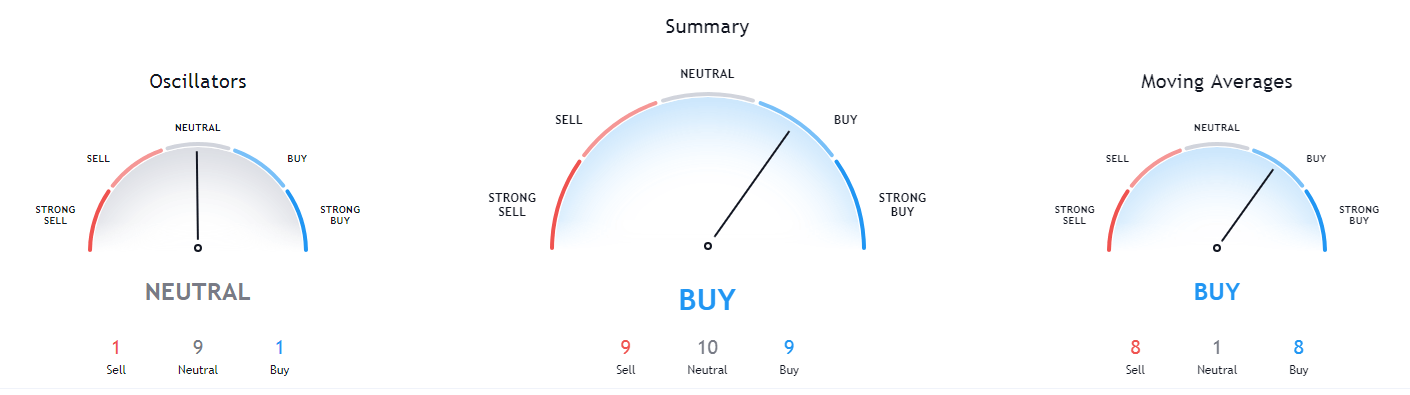
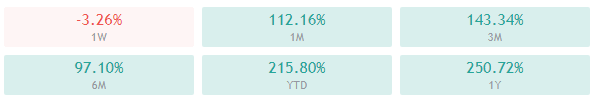
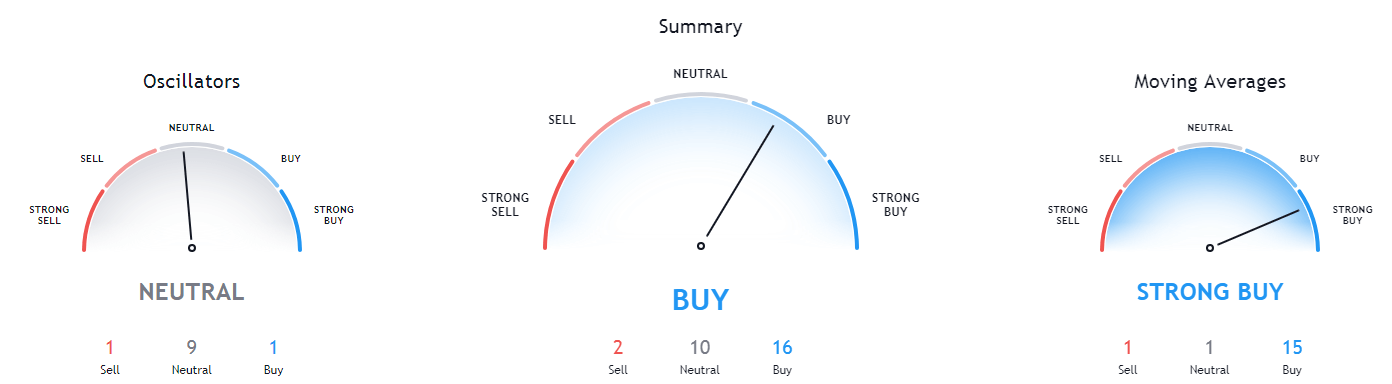
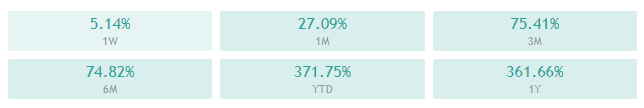
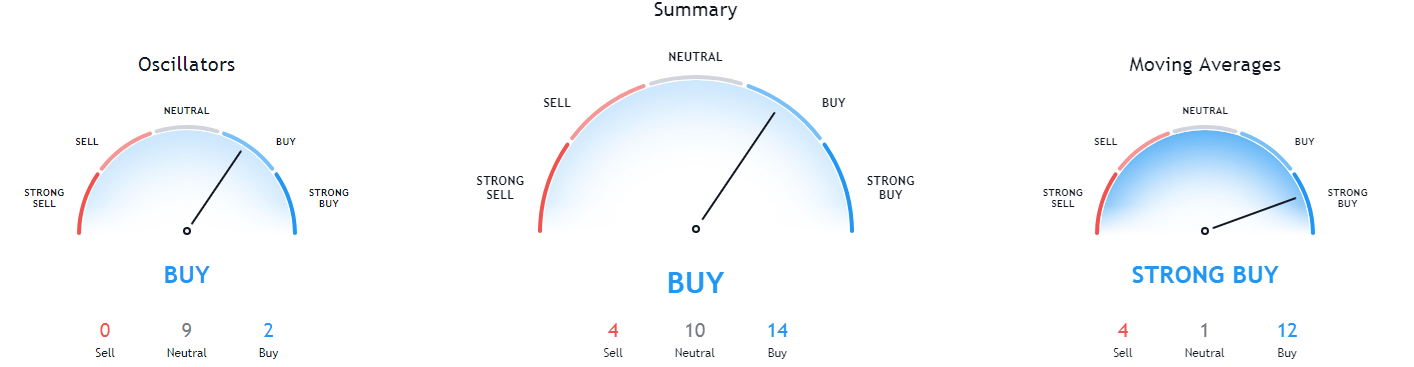
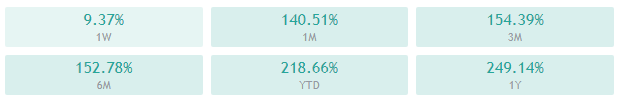
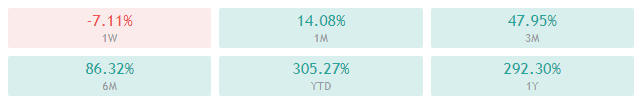
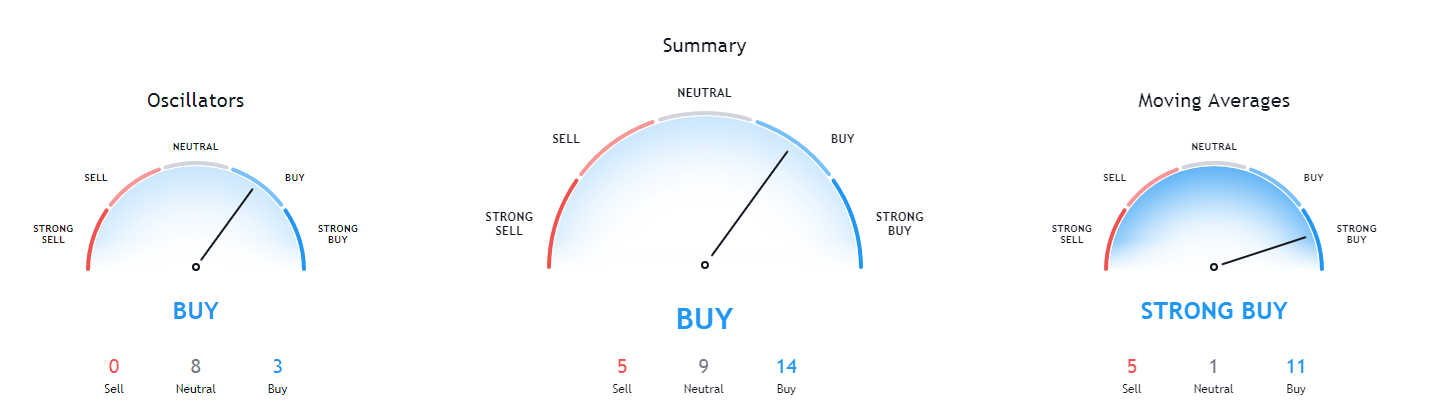
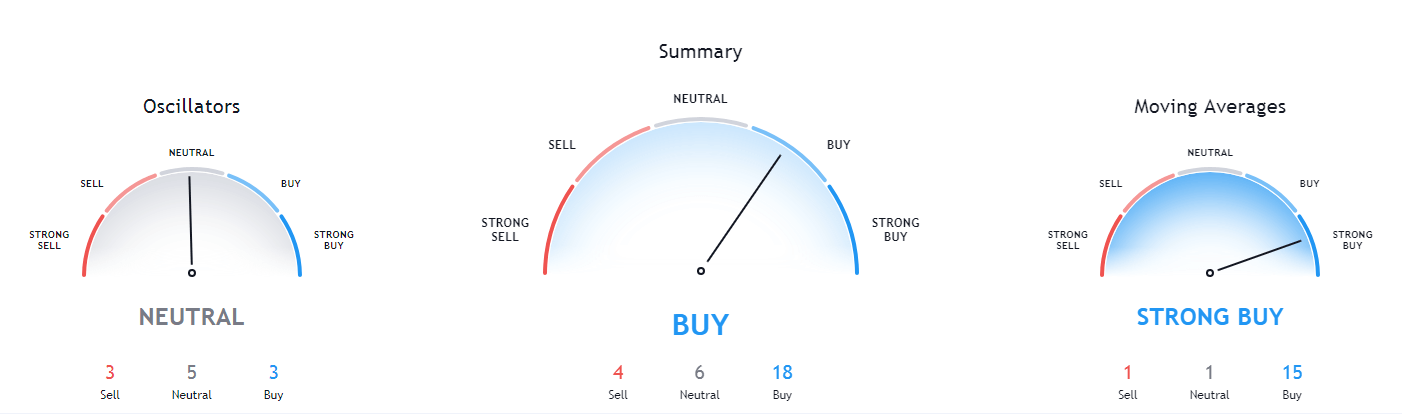
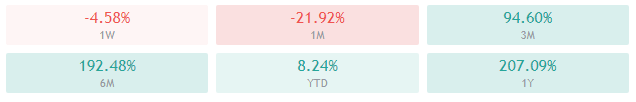
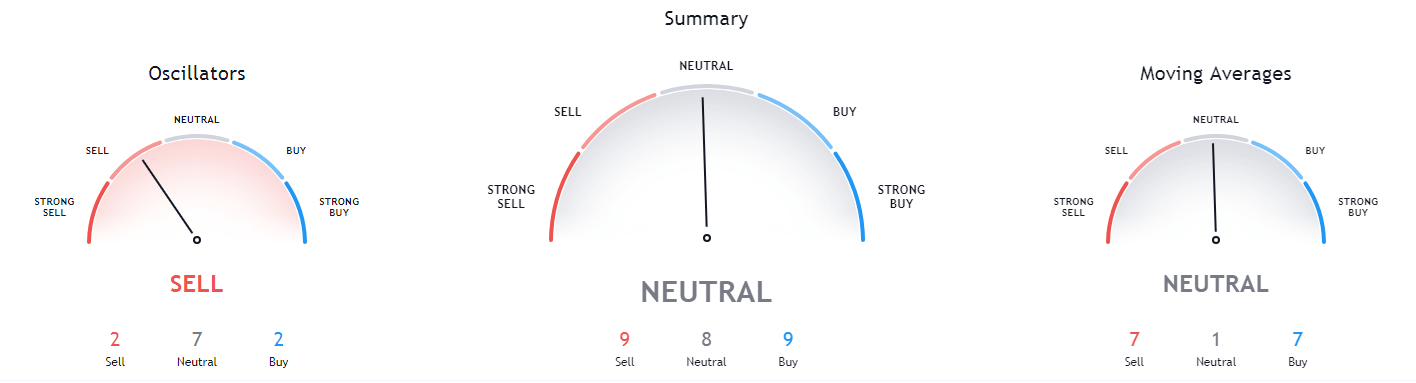
Ethereum’s technicals on all time-frames are bullish but also show a hint of bearishness.
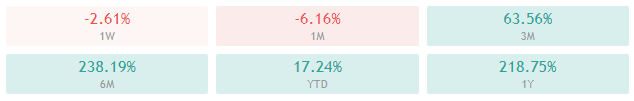
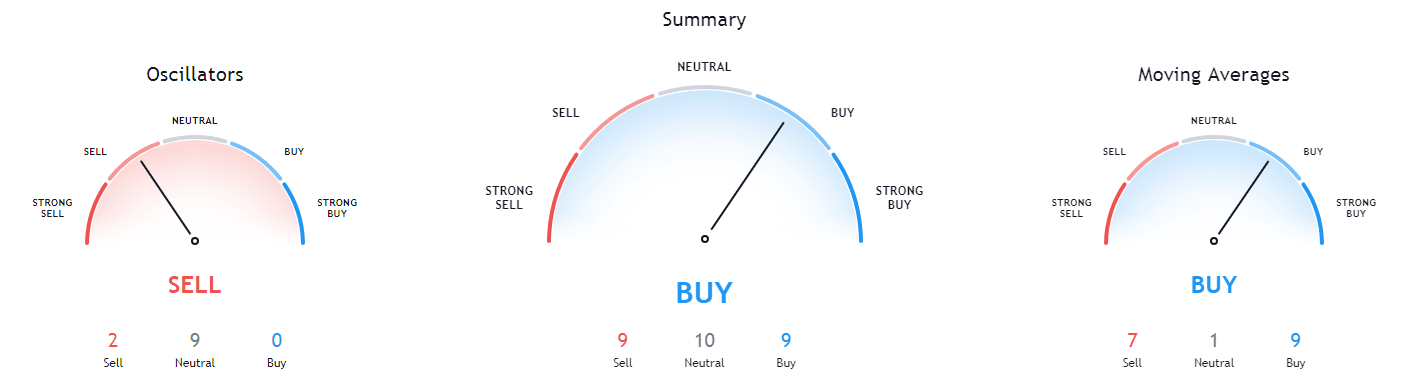
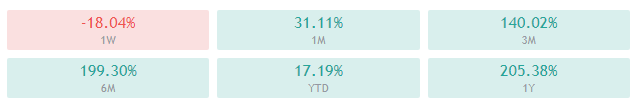
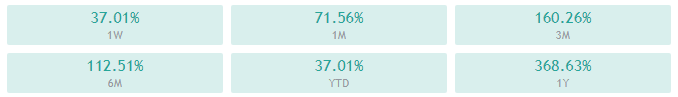
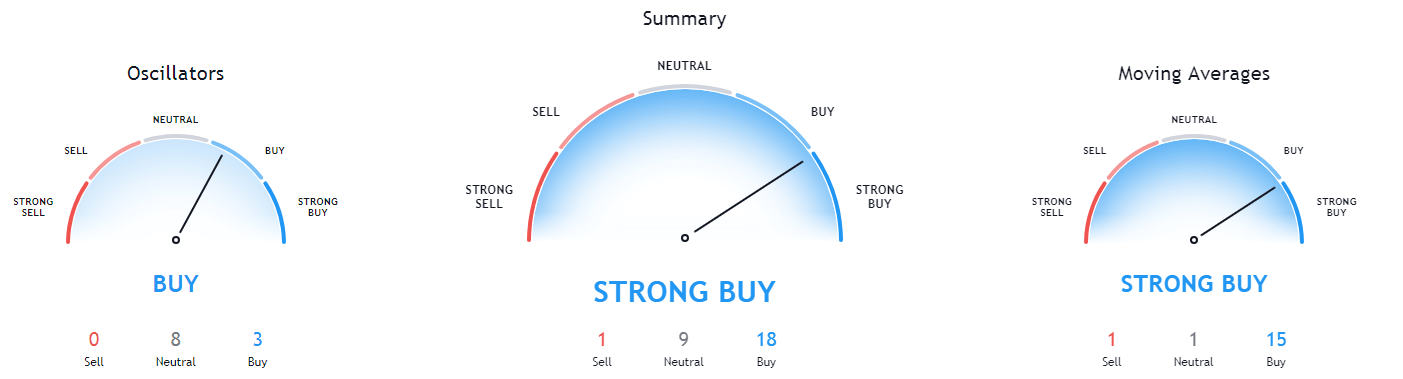
ETH/USD 1-day Technicals
Technical Factors (1-hour Chart):
- Price is slightly below both its 50-period and its 21-period EMA
- Price slightly below its middle Bollinger band
- RSI is neutral (45.66)
- Volume is average
Key levels to the upside: Key levels to the downside:
1: $1,350 1: $1,211
2: $1,420 2: $1,183.85
3: $1,440 3: $1047.6
Litecoin
Litecoin has confirmed its position above the $128.4 level after pushing its price above it yesterday. LTC is now in consolidation mode and is currently testing the 21-hour EMA. Its recent moves seem slightly unenthusiastic, meaning that its short-term price direction will most likely be determined by other cryptocurrencies’ movements.
LTC/USD 1-hour Chart
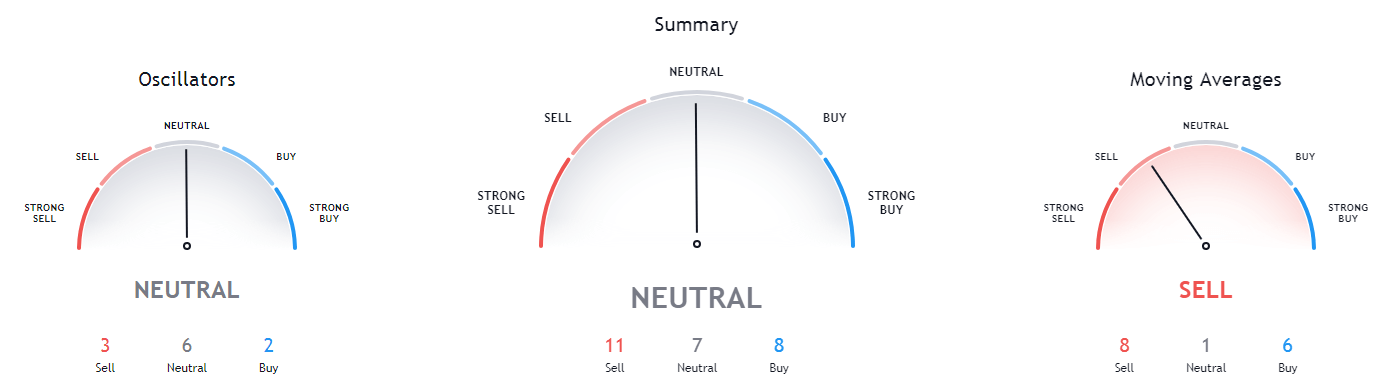
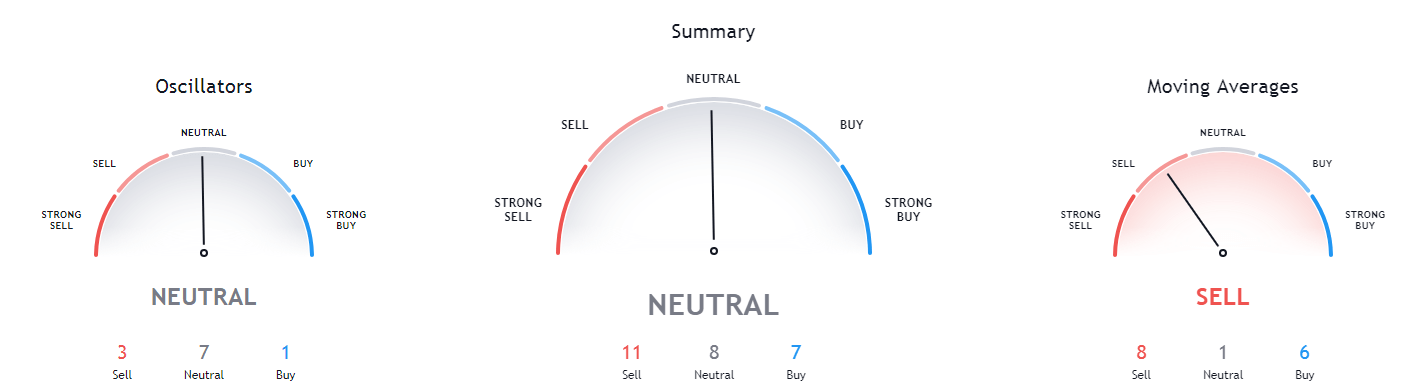
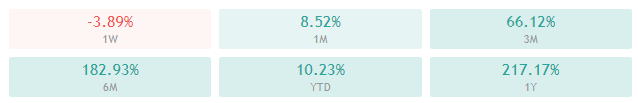
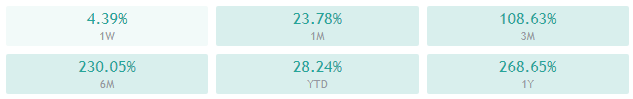
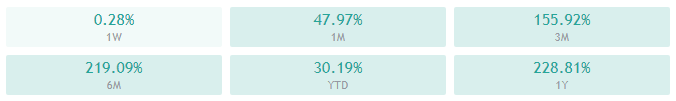
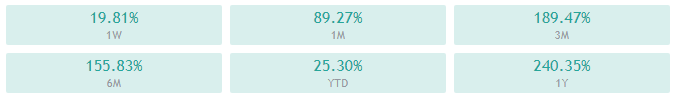
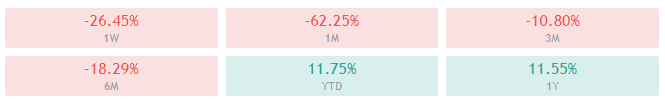
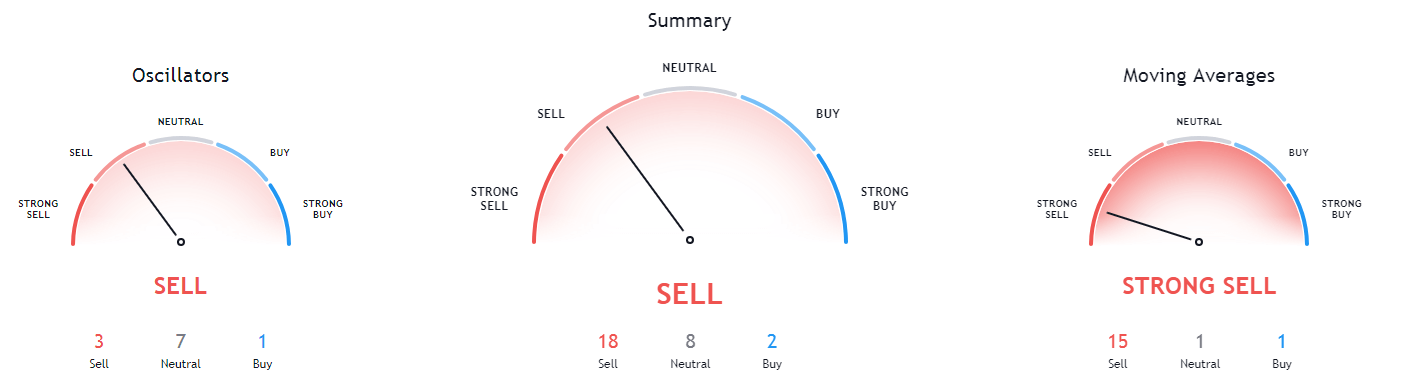
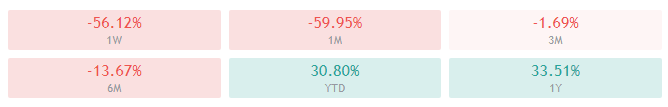
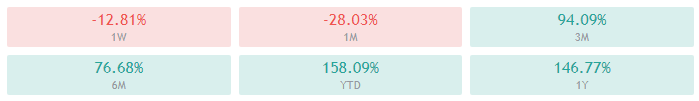
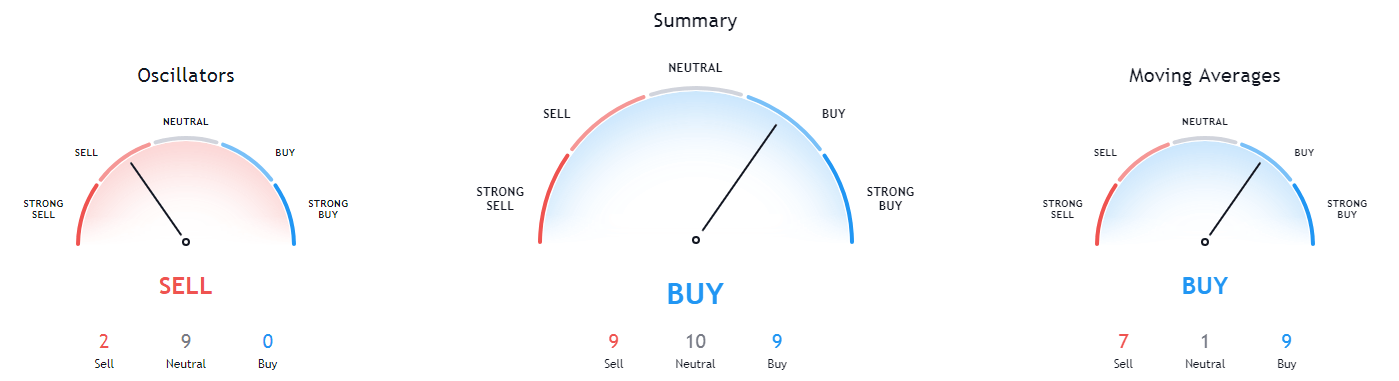
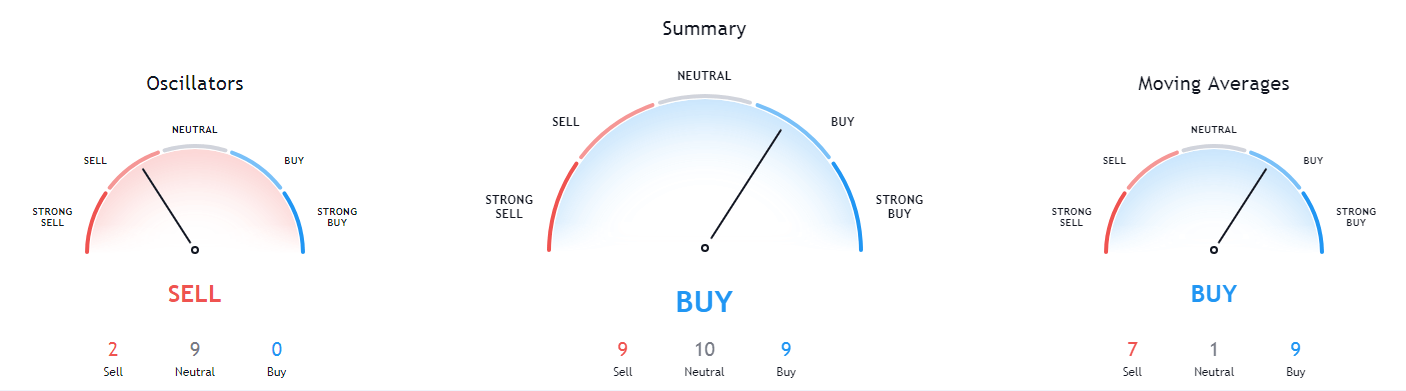
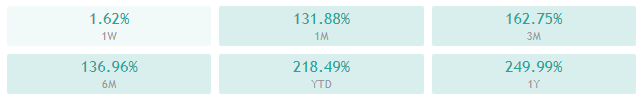
Litecoin’s 4-hour and daily overviews are neutral/bearish, while its weekly and monthly overviews are completely bullish.
LTC/USD 1-day Technicals
Technical factors (1-hour Chart):
- Its price is slightly above both its 50-period EMA and its 21-period EMA
- Price slightly above its middle Bollinger band
- RSI is neutral (55.45)
- Volume is average
Key levels to the upside: Key levels to the downside:
1: $142.1 1: $128.42
2: $161.5 2: $120
3: $181.3 3: $114.75