Categories
Crypto Daily Topic Cryptocurrencies

How Does Ripple (XRP) Fare against the Rising Stablecoins?

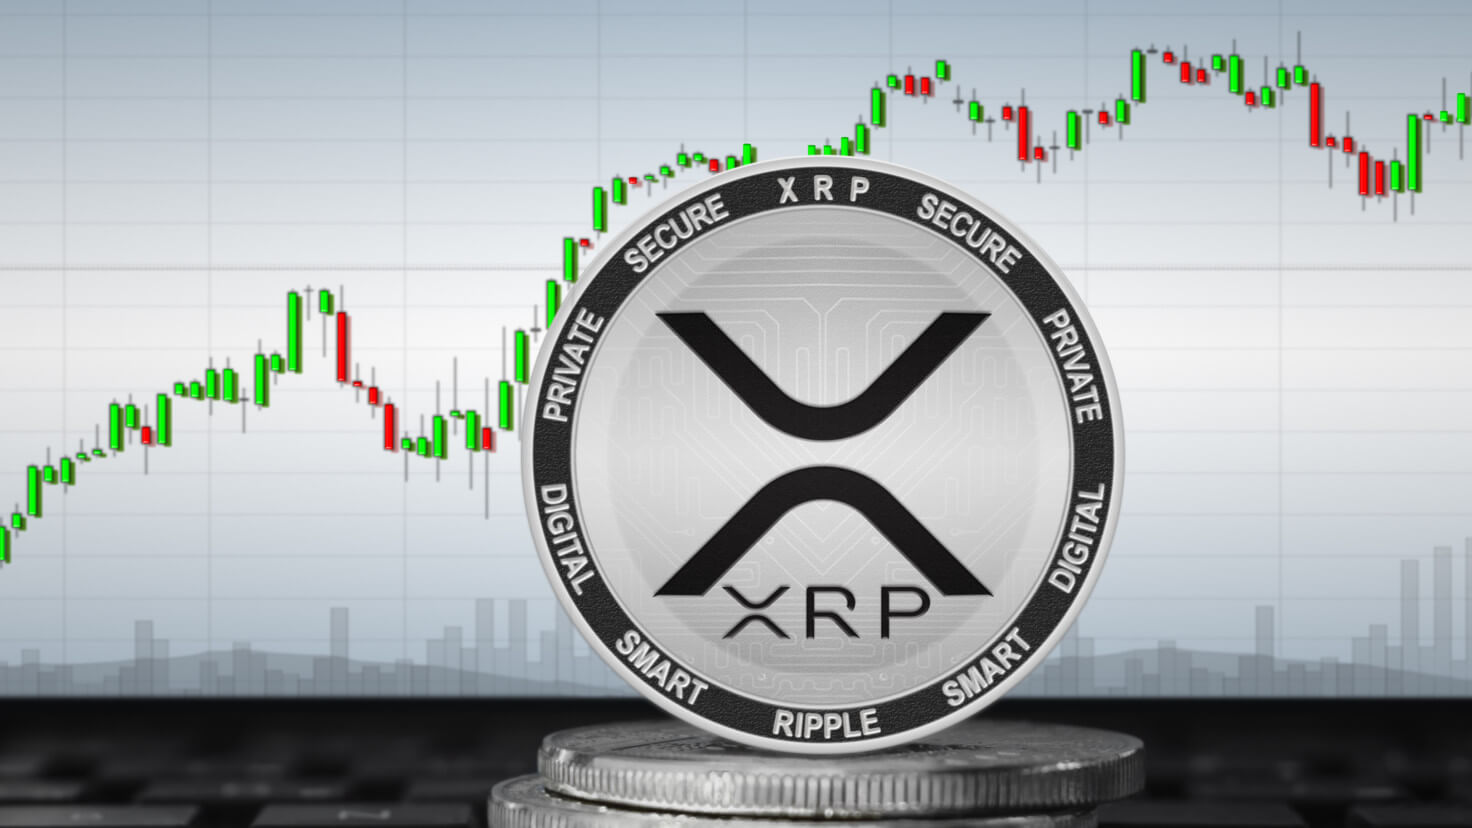
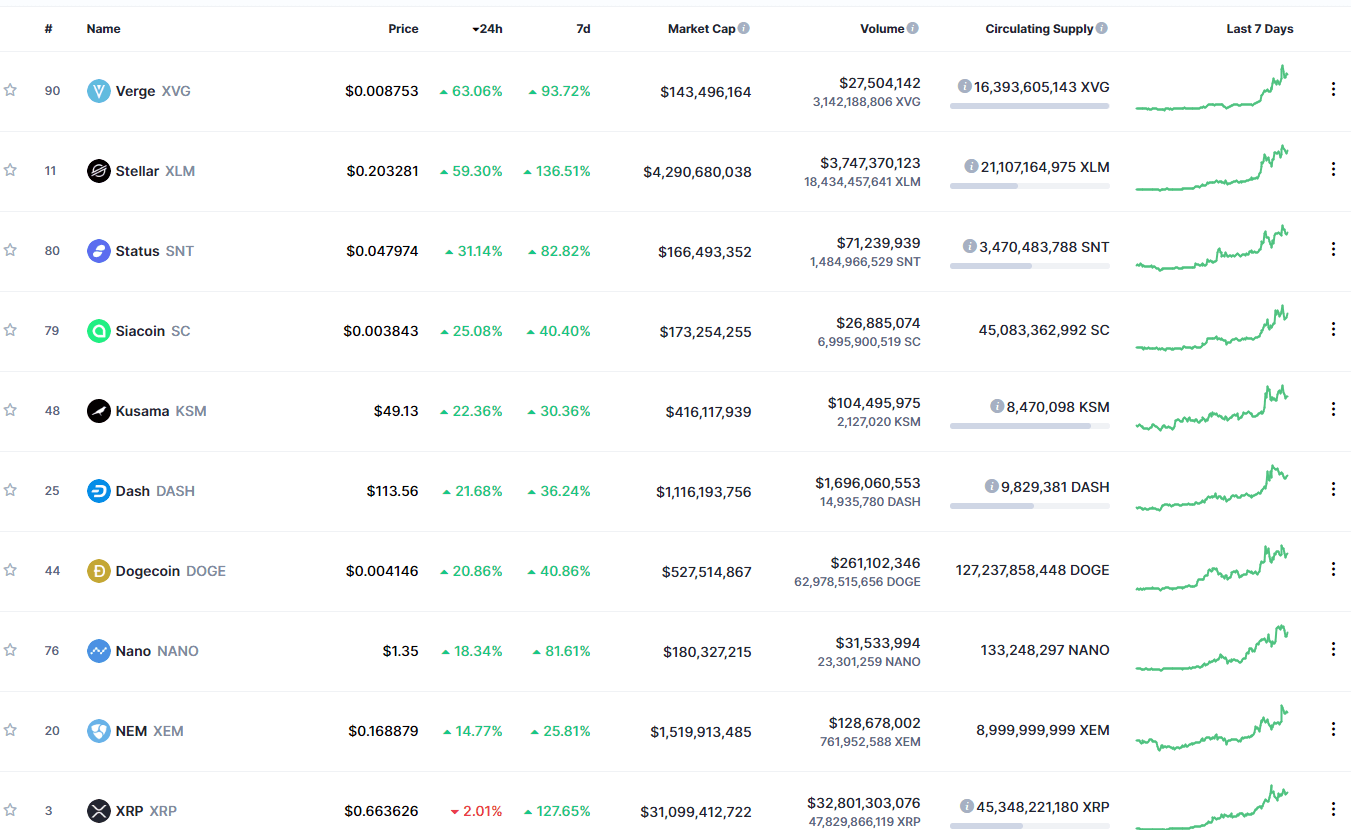
Ripple Labs was poised to overtake the bitcoin network because of its fast speeds and cost-effective transaction framework. Ripple’s XRP promised to convert crypto assets from mere investment options to viable, widespread means of digitized, global payments.

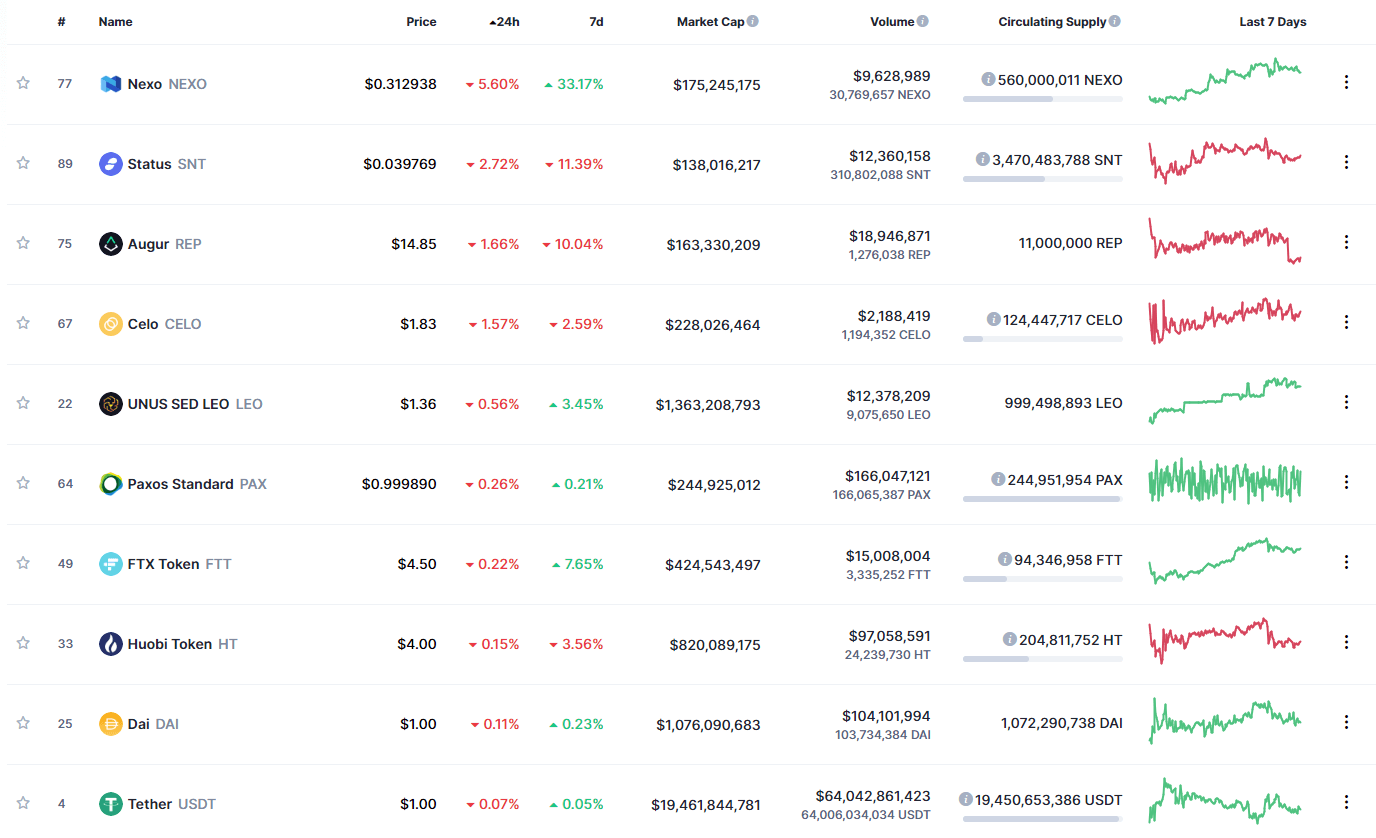
Another form of cryptocurrencies emerged as designers grew wary of regulatory gaps and volatility in crypto markets. Stablecoins are digital currencies whose value is pegged on national fiat currencies. They are designed to diminish the volatility of crypto assets.

Some stablecoins have their value pegged on other cryptocurrencies. Other coins are backed by asset-buying algorithms. Therefore, stablecoins can be backed by gold, a basket of fiat currencies, other crypto assets, and stable investment commodities.

The Ripple payment protocol has been in the markets since 2012, and we’ve had enough time to observe the rise and fall of the XRP currency. Ripple Labs enjoyed phenomenal, initial success in the markets because of its low-cost, global transactions that don’t allow chargebacks.

So, what is Ripple’s market position in contrast to stablecoins? Empower yourself by understanding the differences between traditional cryptocurrencies and stablecoins. How else will you make insightful investment decisions with long-term benefits?

Understanding the Rise of Stablecoins

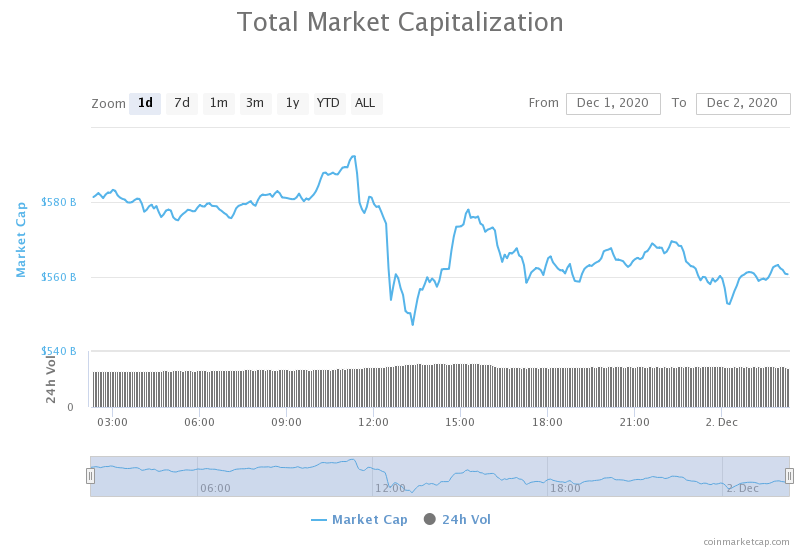
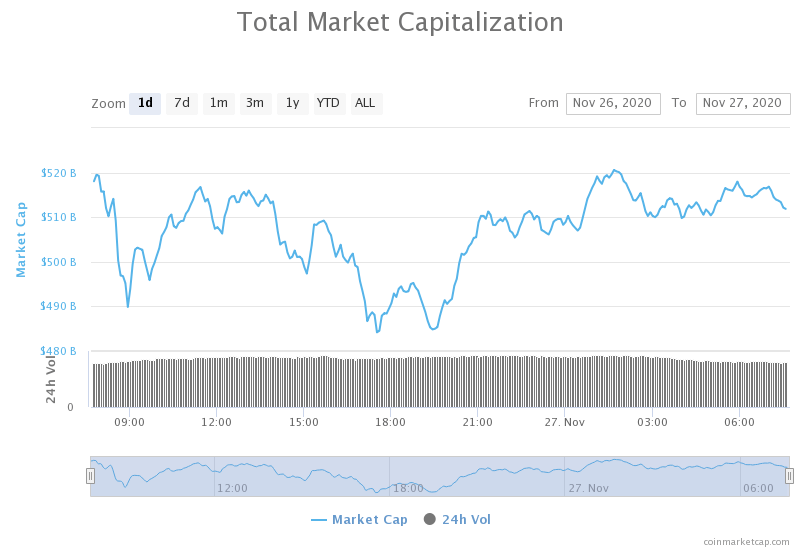
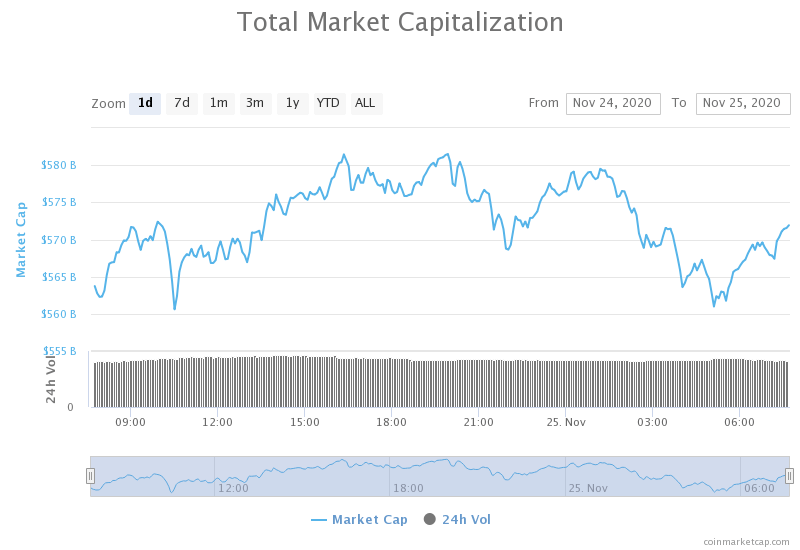
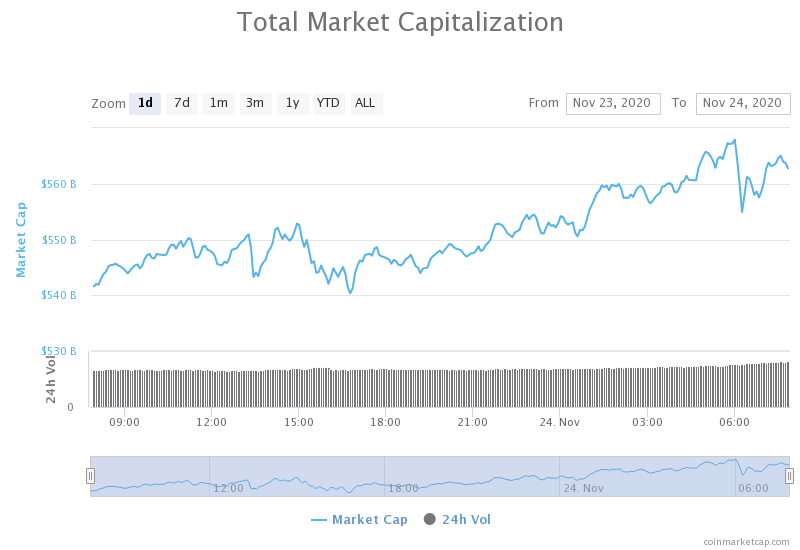
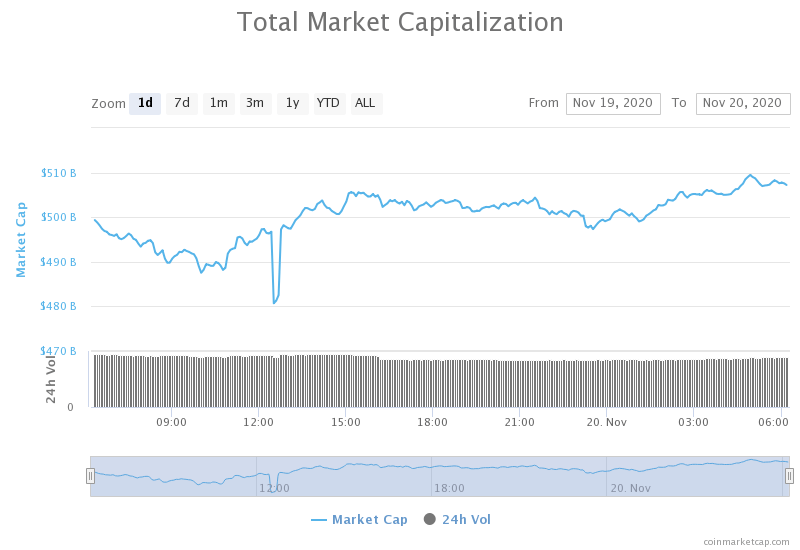
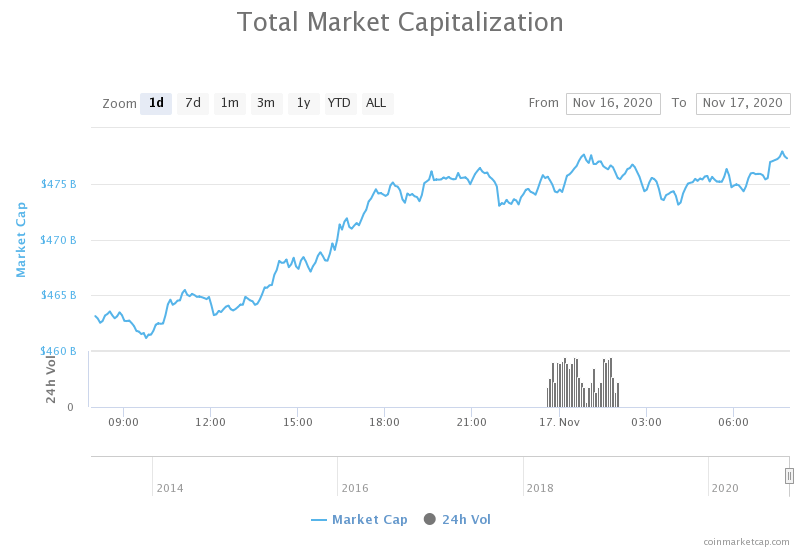
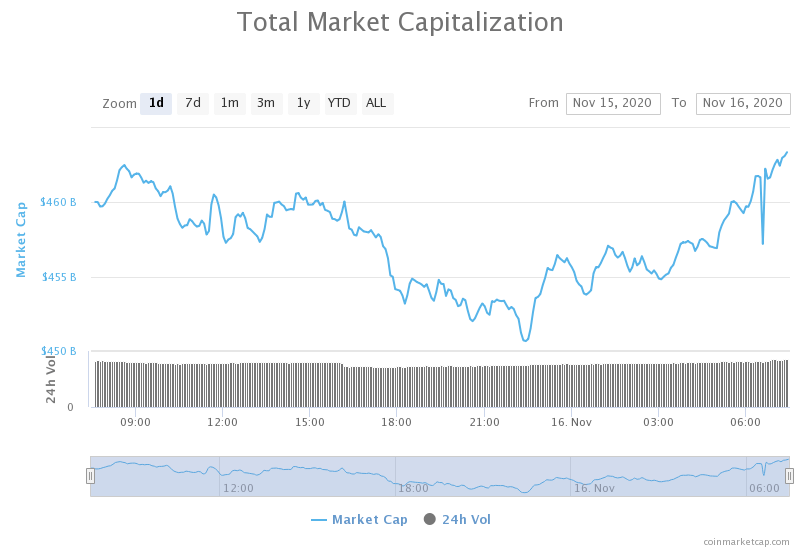
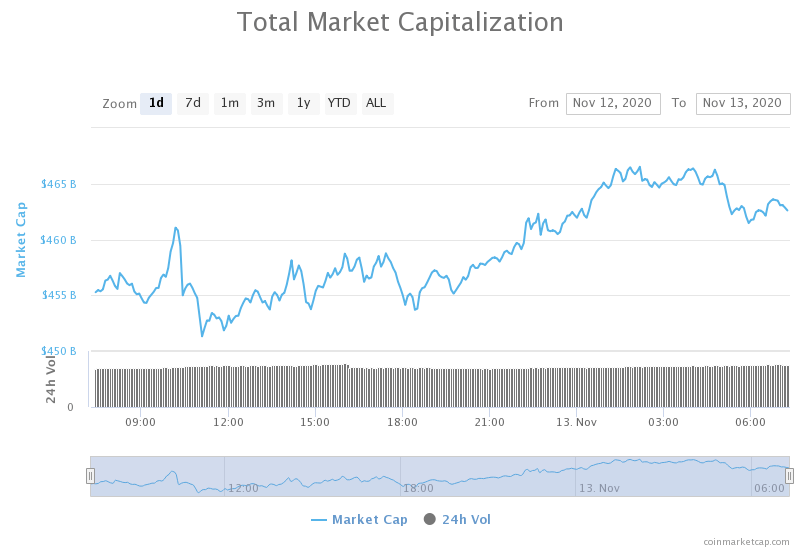
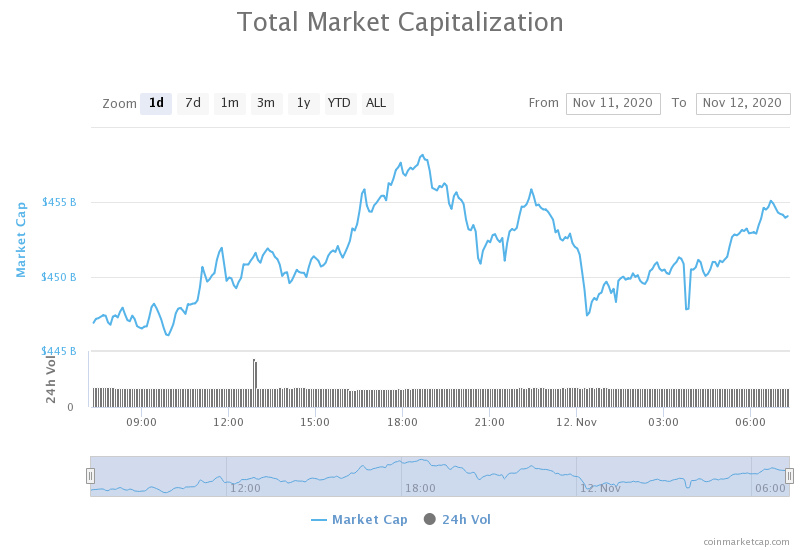
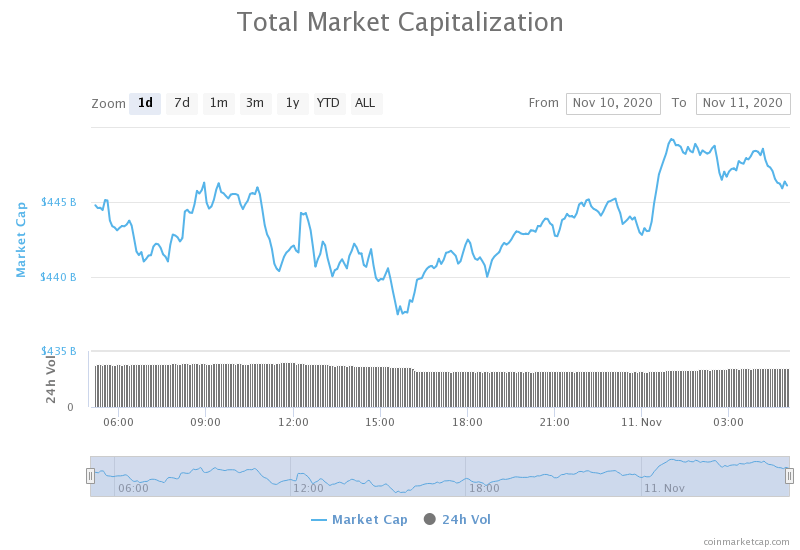
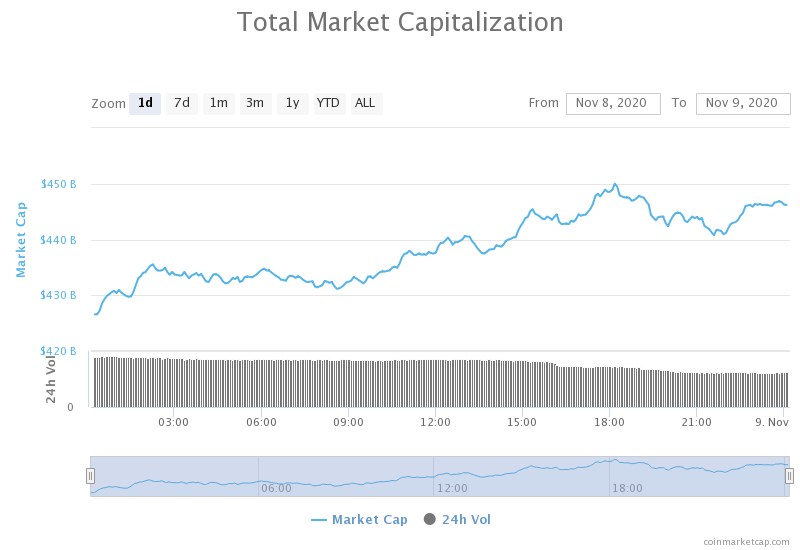
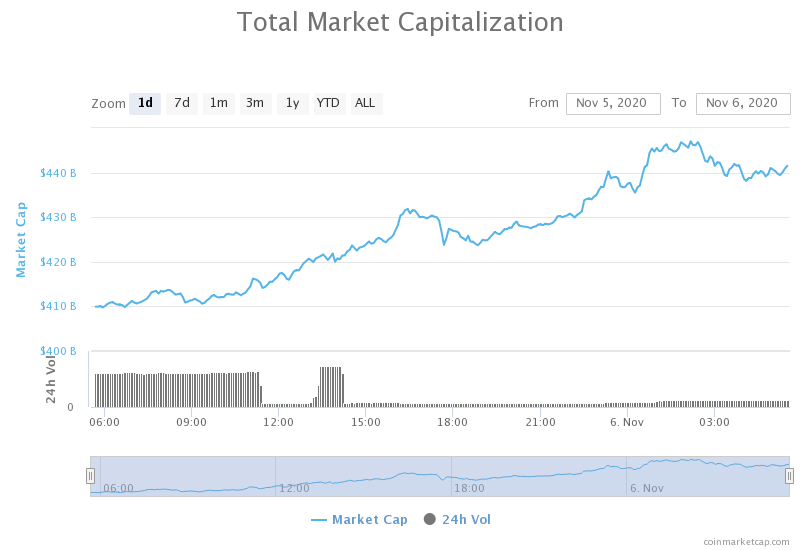
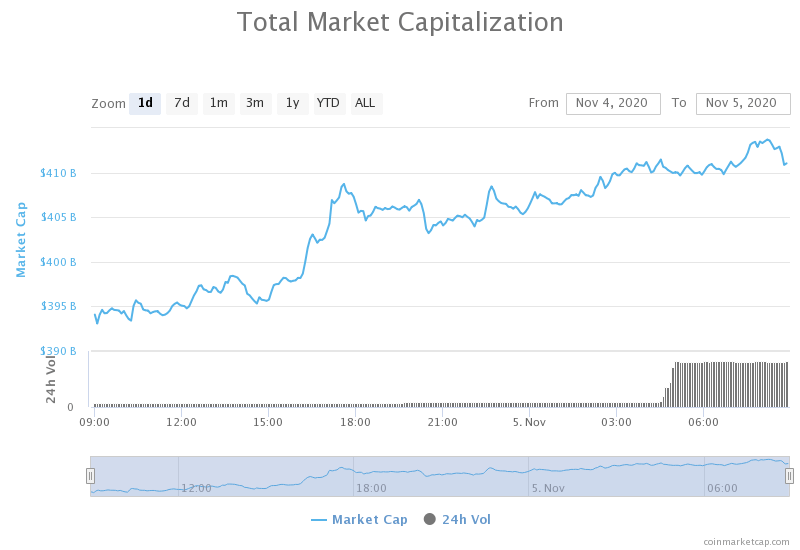
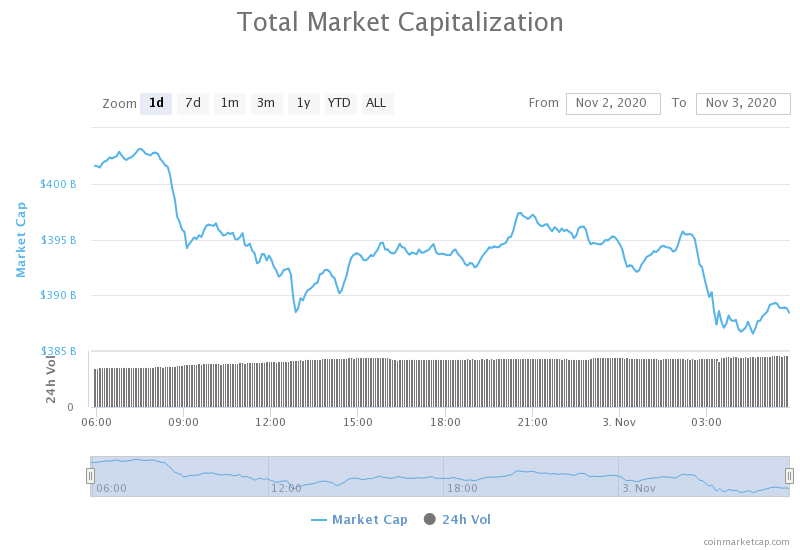
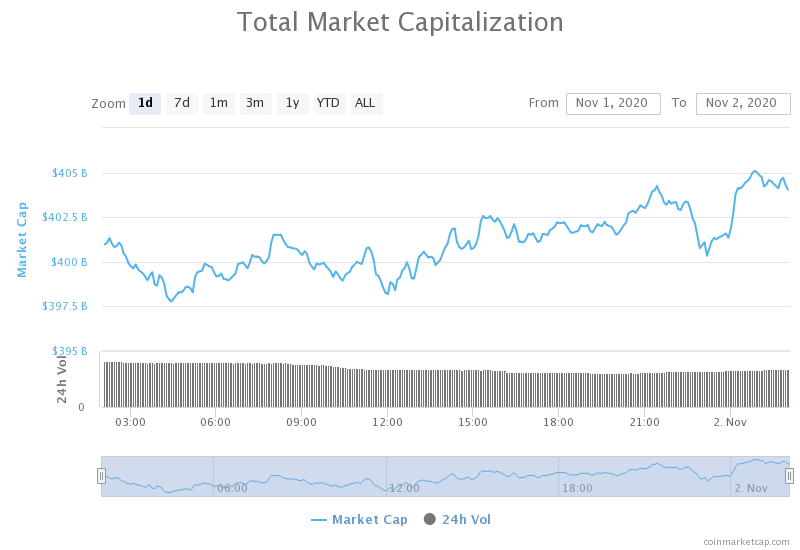
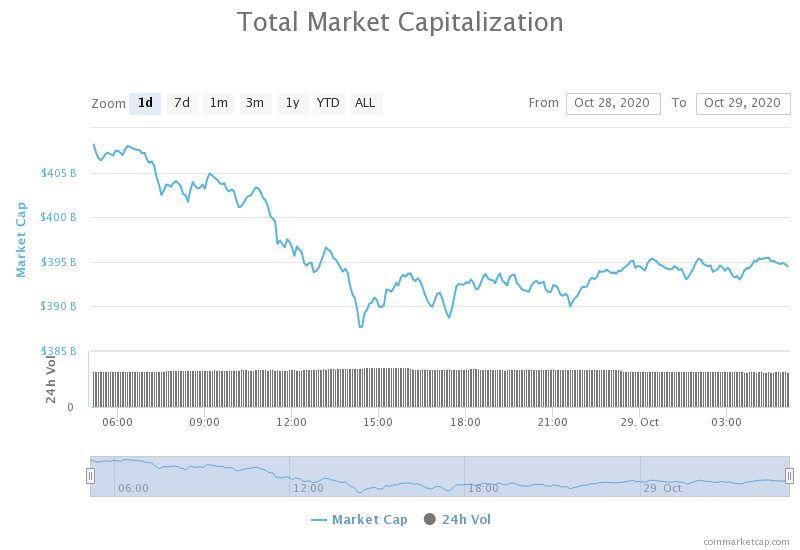
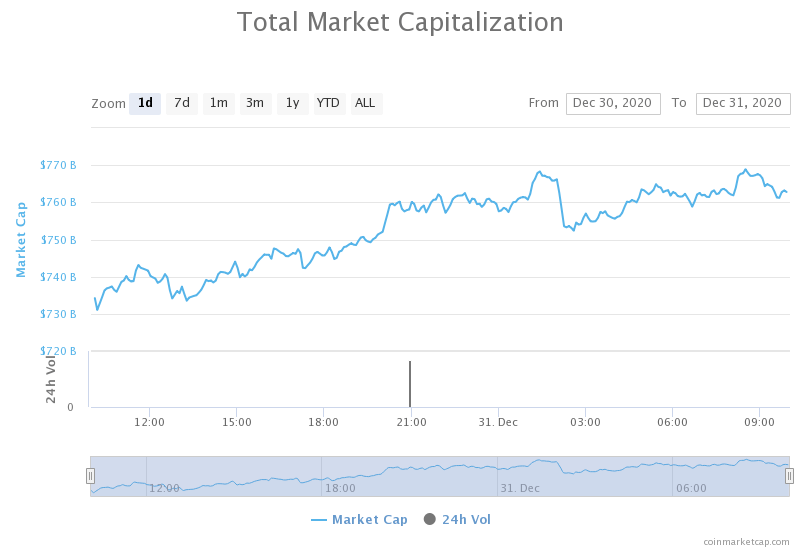
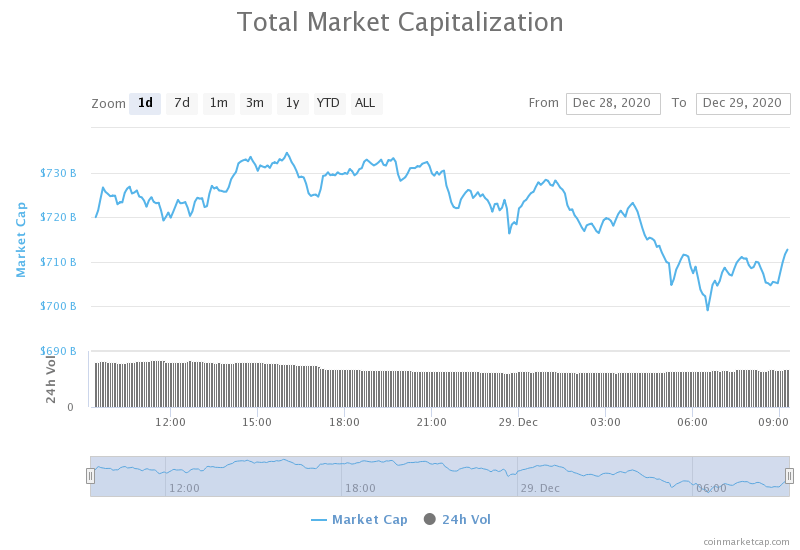
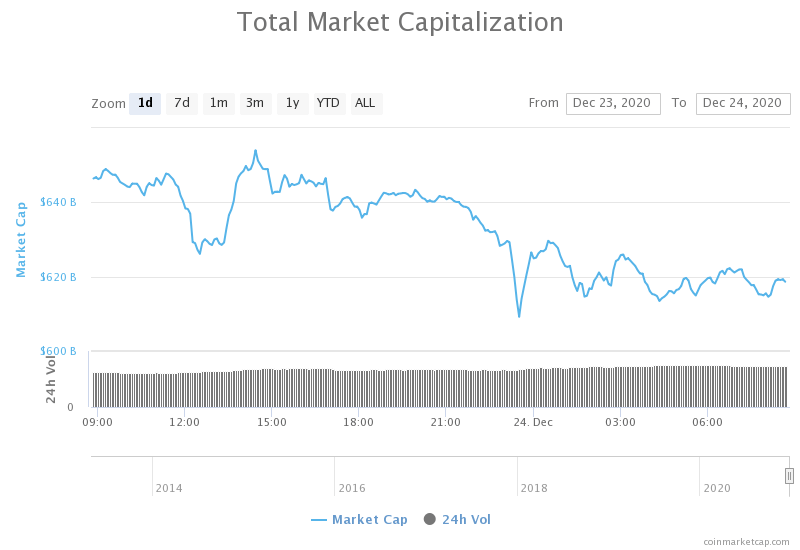
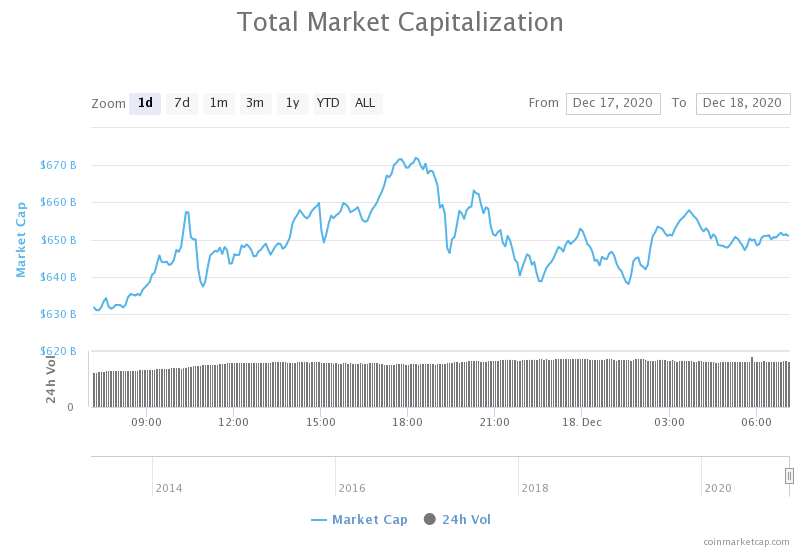
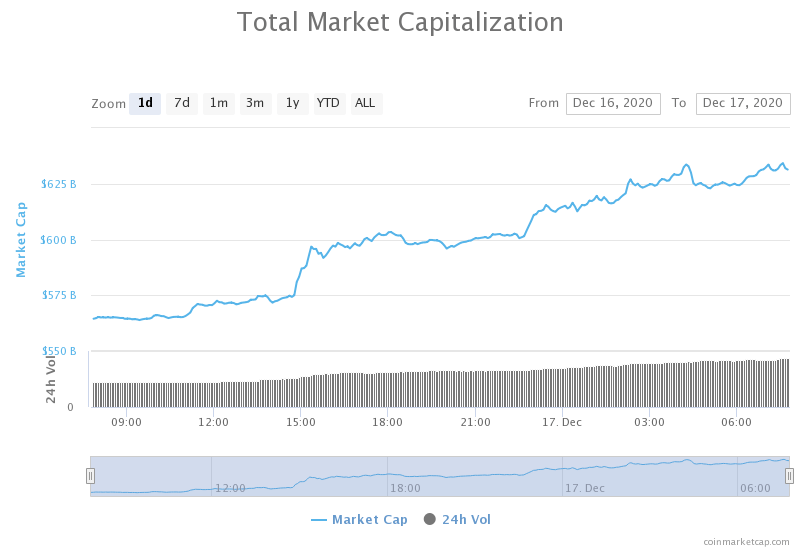
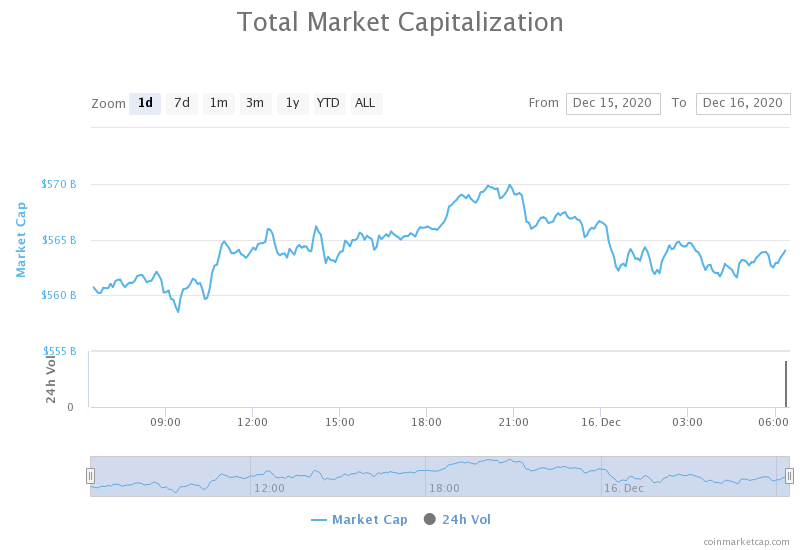
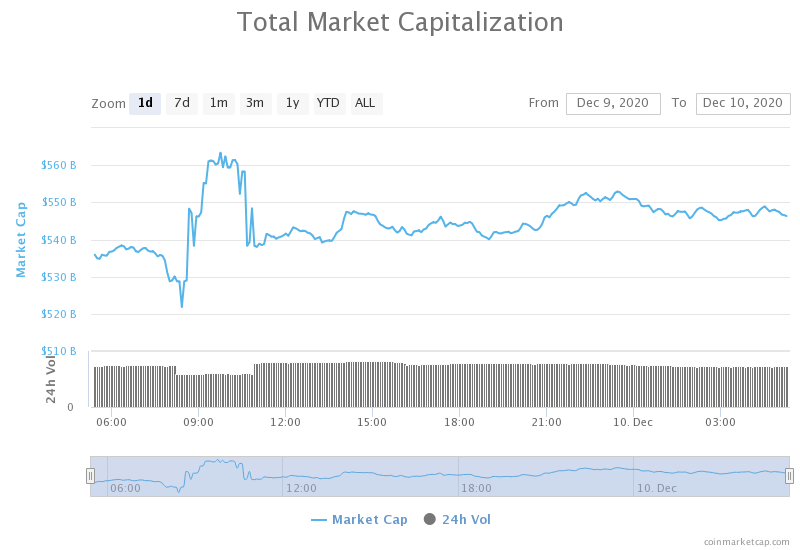
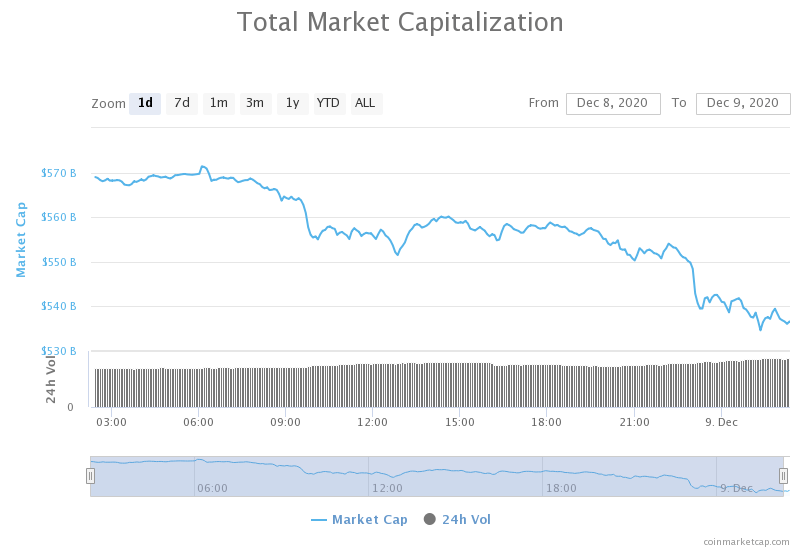
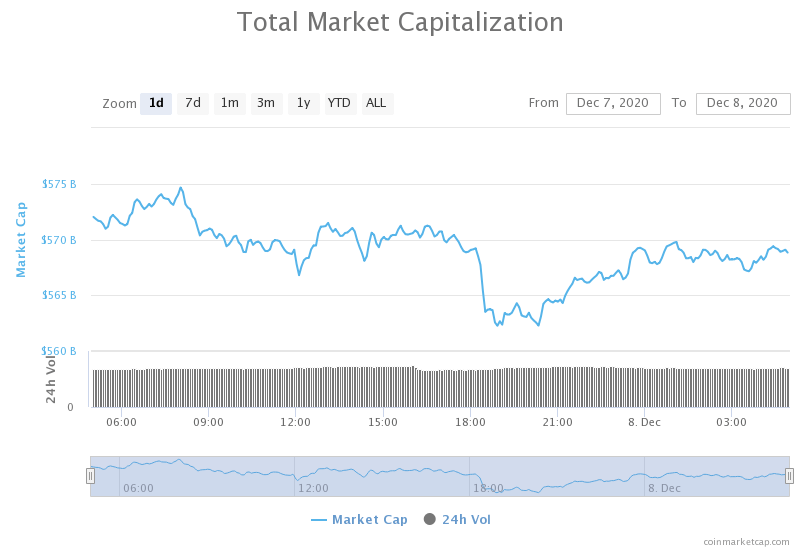
The year 2020 saw a tremendous rise in the overall market cap of stablecoins, from $5.3 billion to $13 billion. The Coronavirus pandemic caused widespread volatility of assets, and investors moved to stablecoins in search of stability.

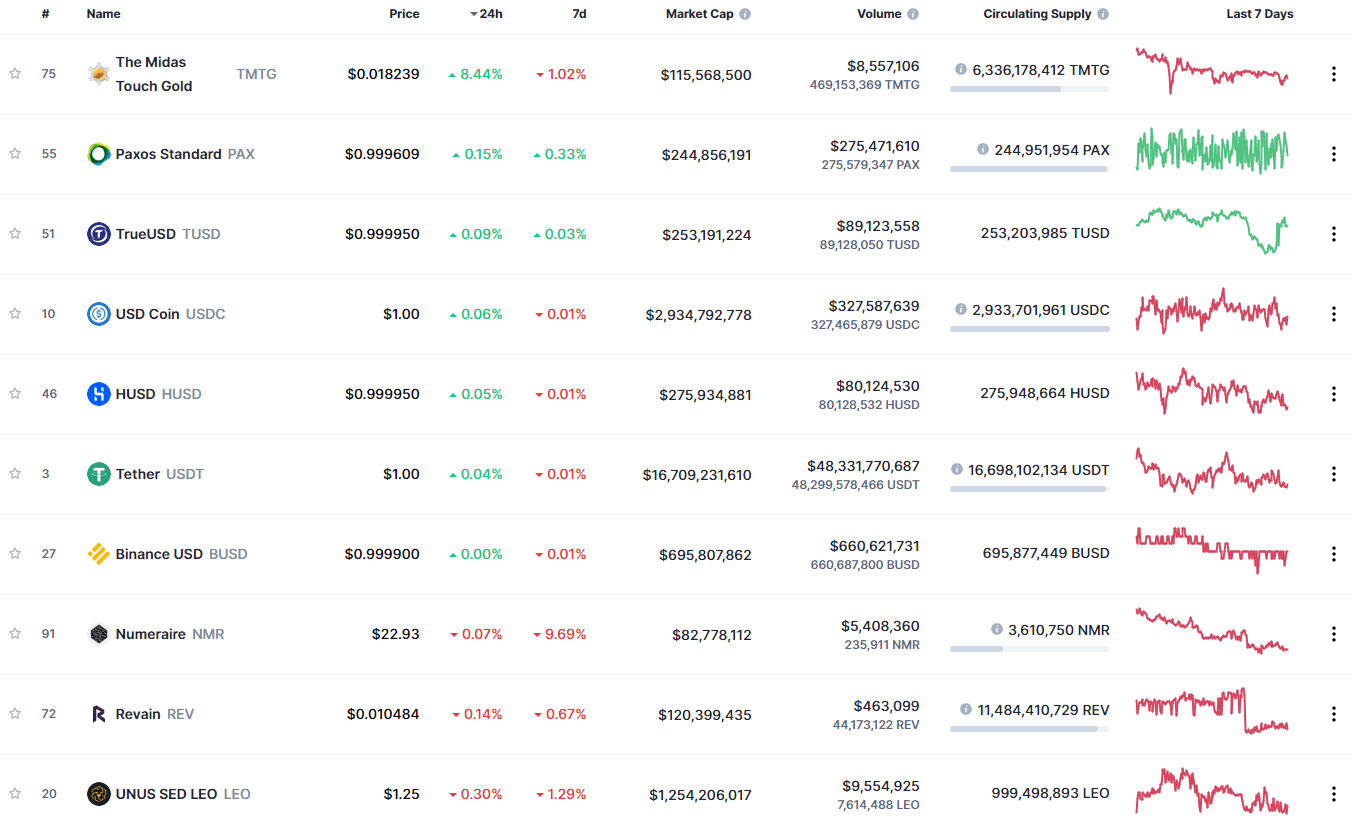
Investors prefer stablecoins because these currencies exist in environments that are free from speculation. Stablecoins maintain a value close to real-world assets, and you can predict your financial future with these assets.

With volatility out of the picture, stablecoins present the best investment options for folks pursuing decentralized finance. These digital currencies apply smart contracts, making them viable, more convenient replacements for banks and other third parties. You can save time and money by cutting out intermediaries.

Stablecoin providers are innovative, and they use algorithms to buy and sell assets for stability. The process is known as collateralization.

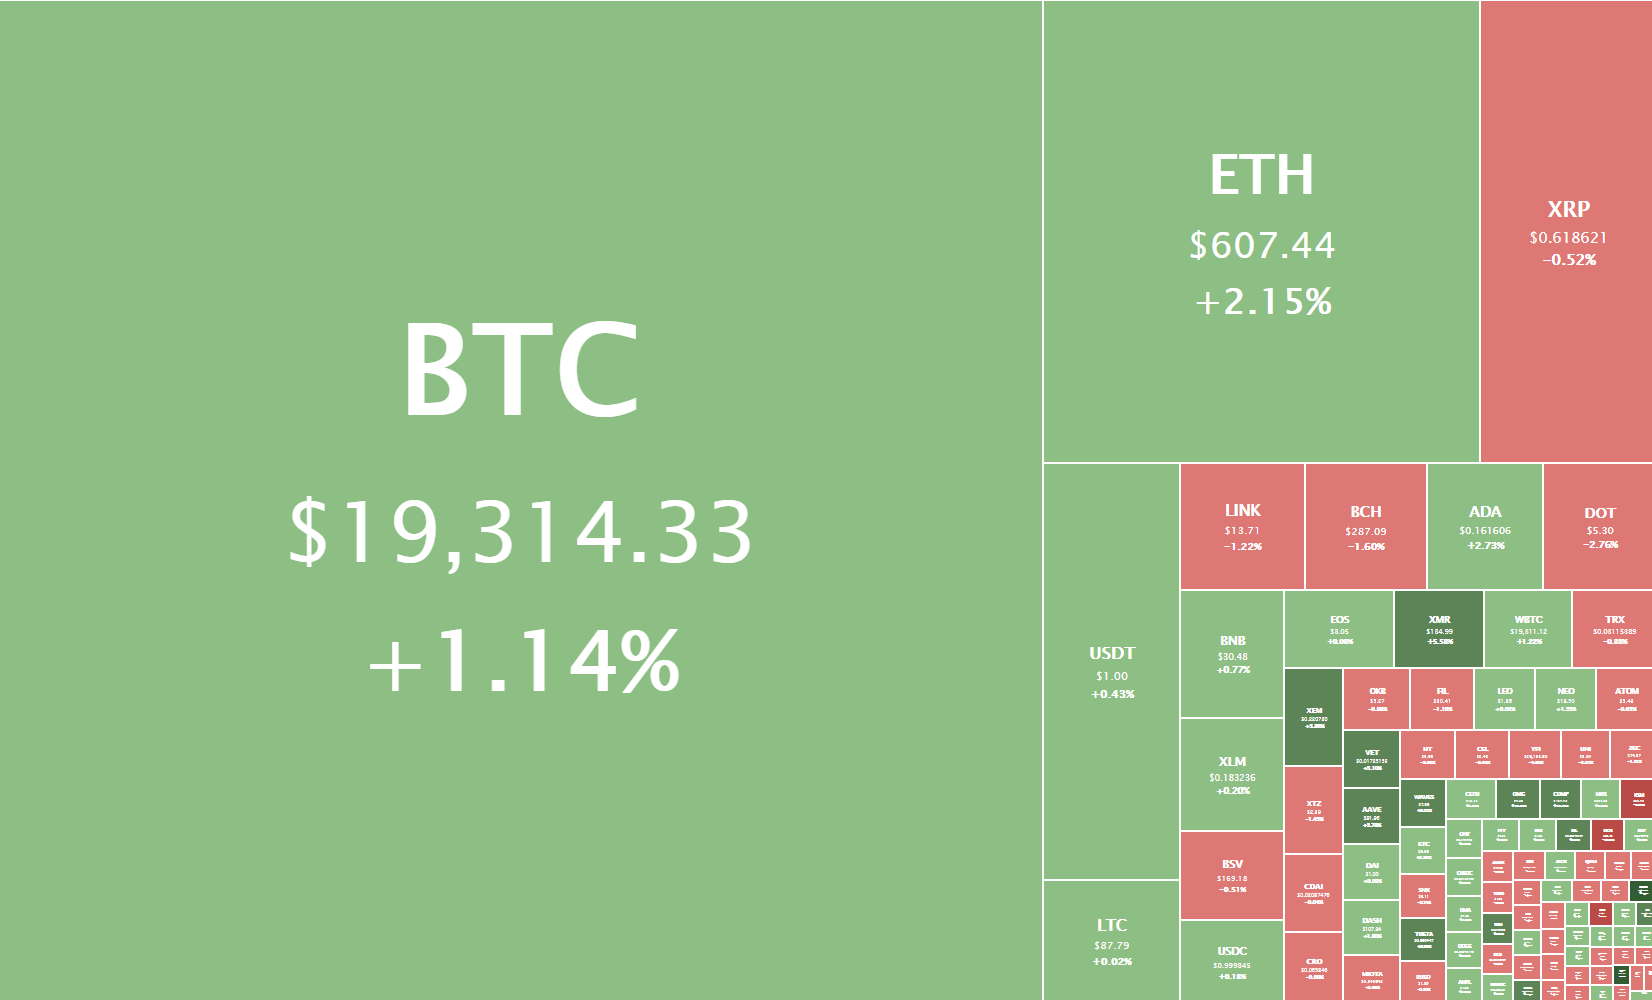
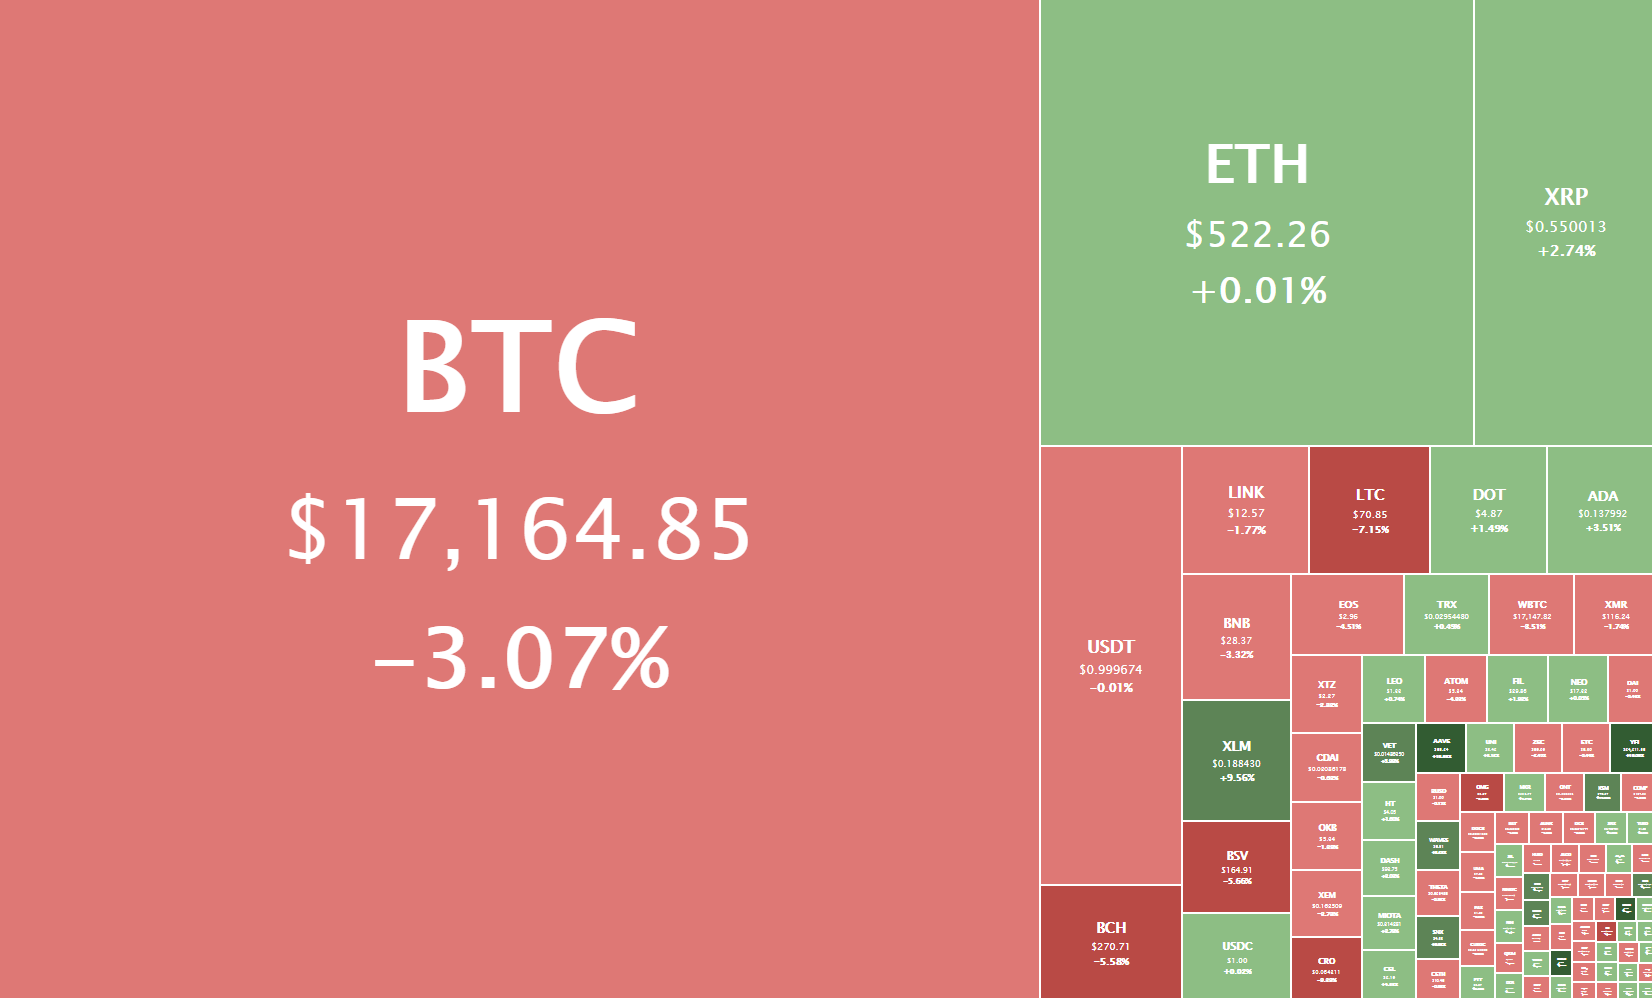
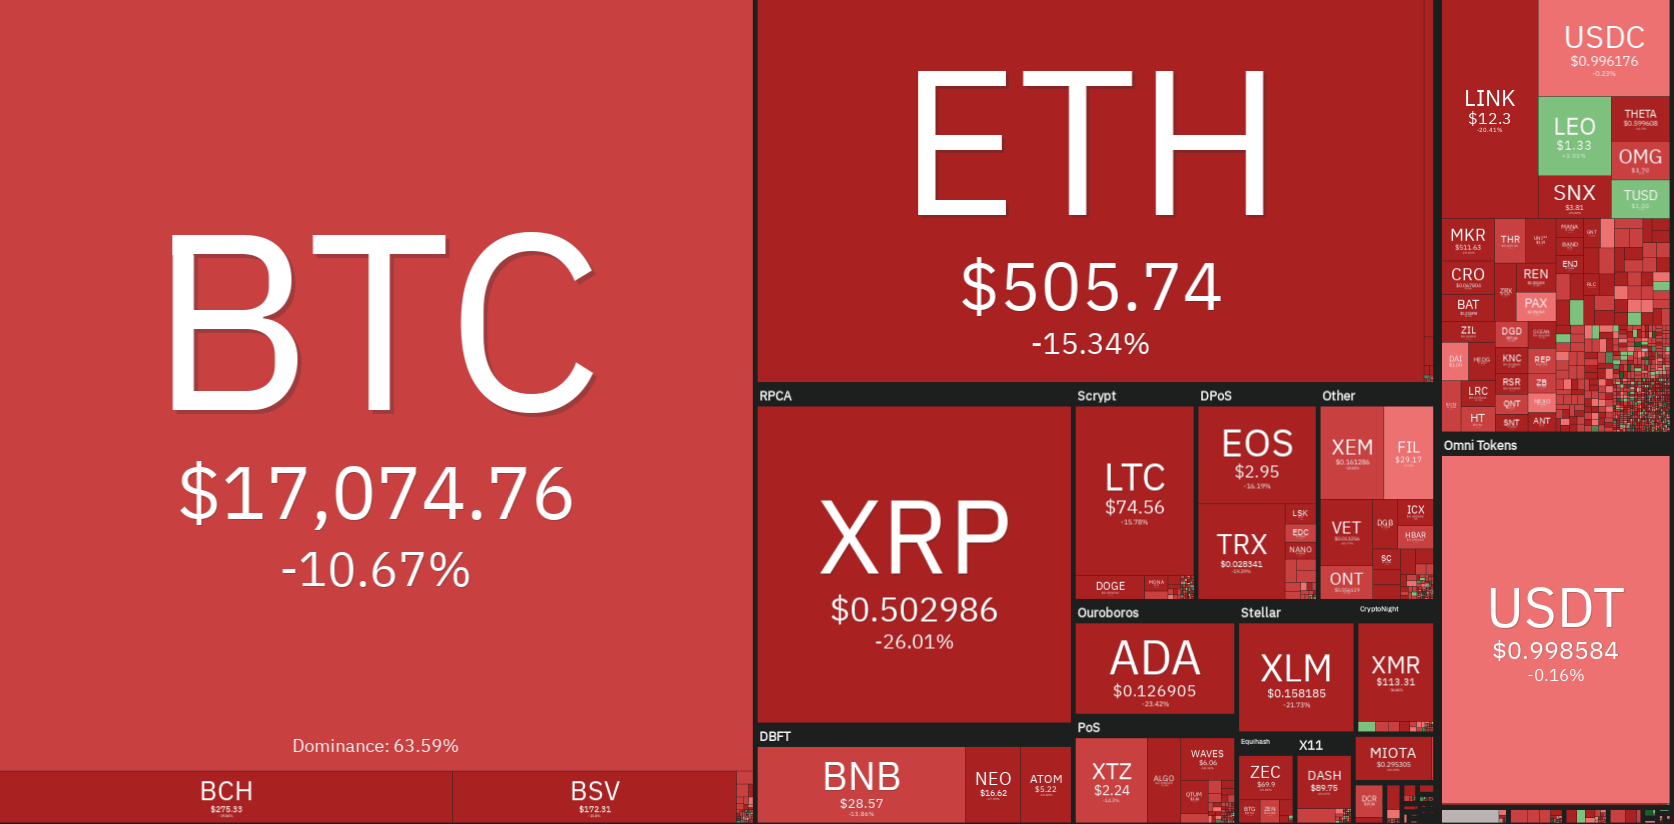
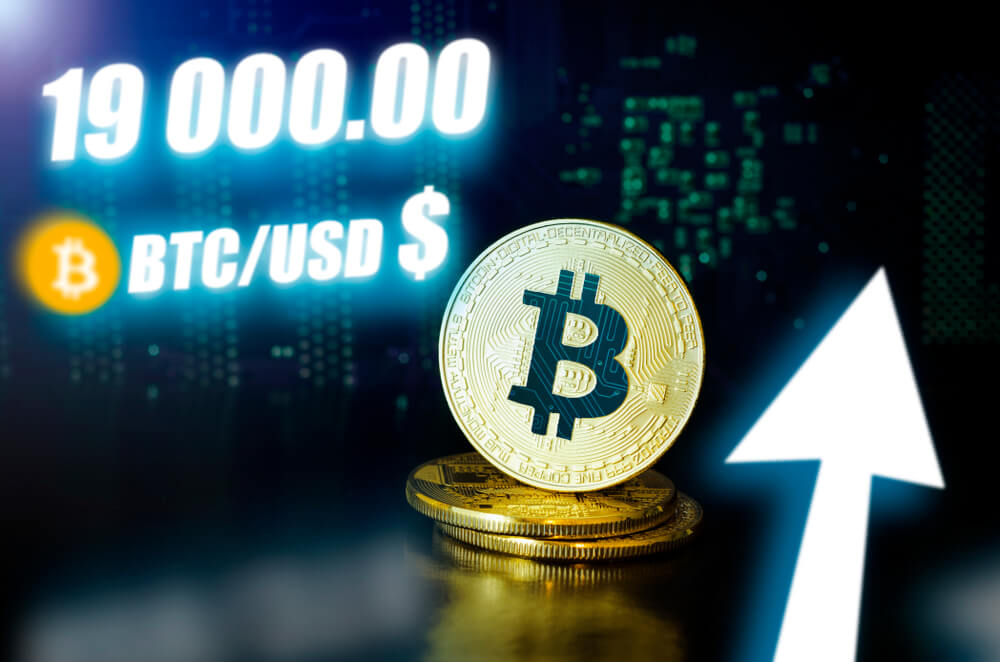
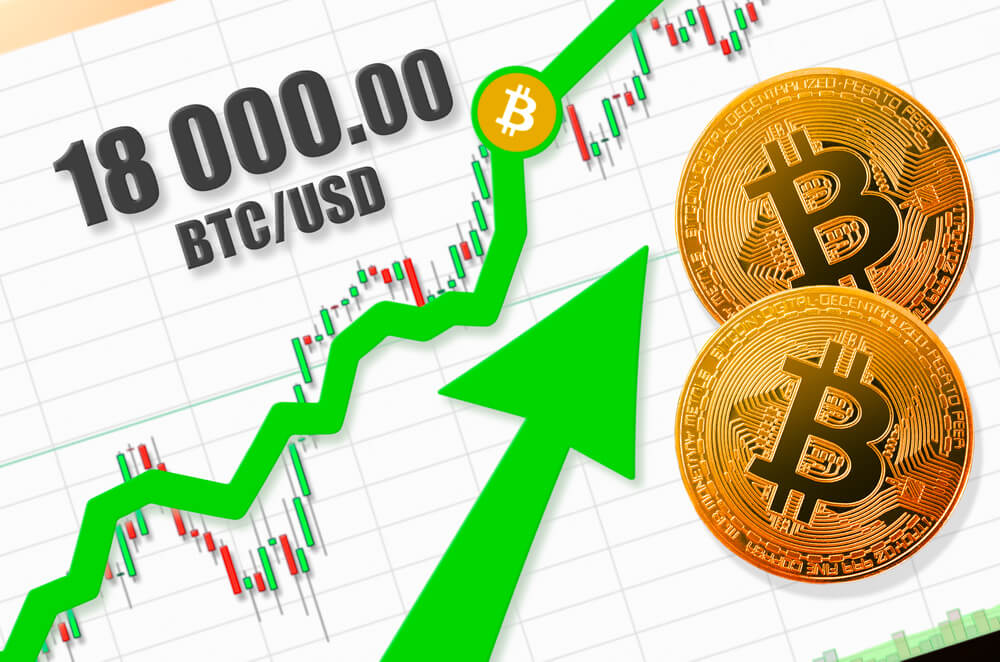
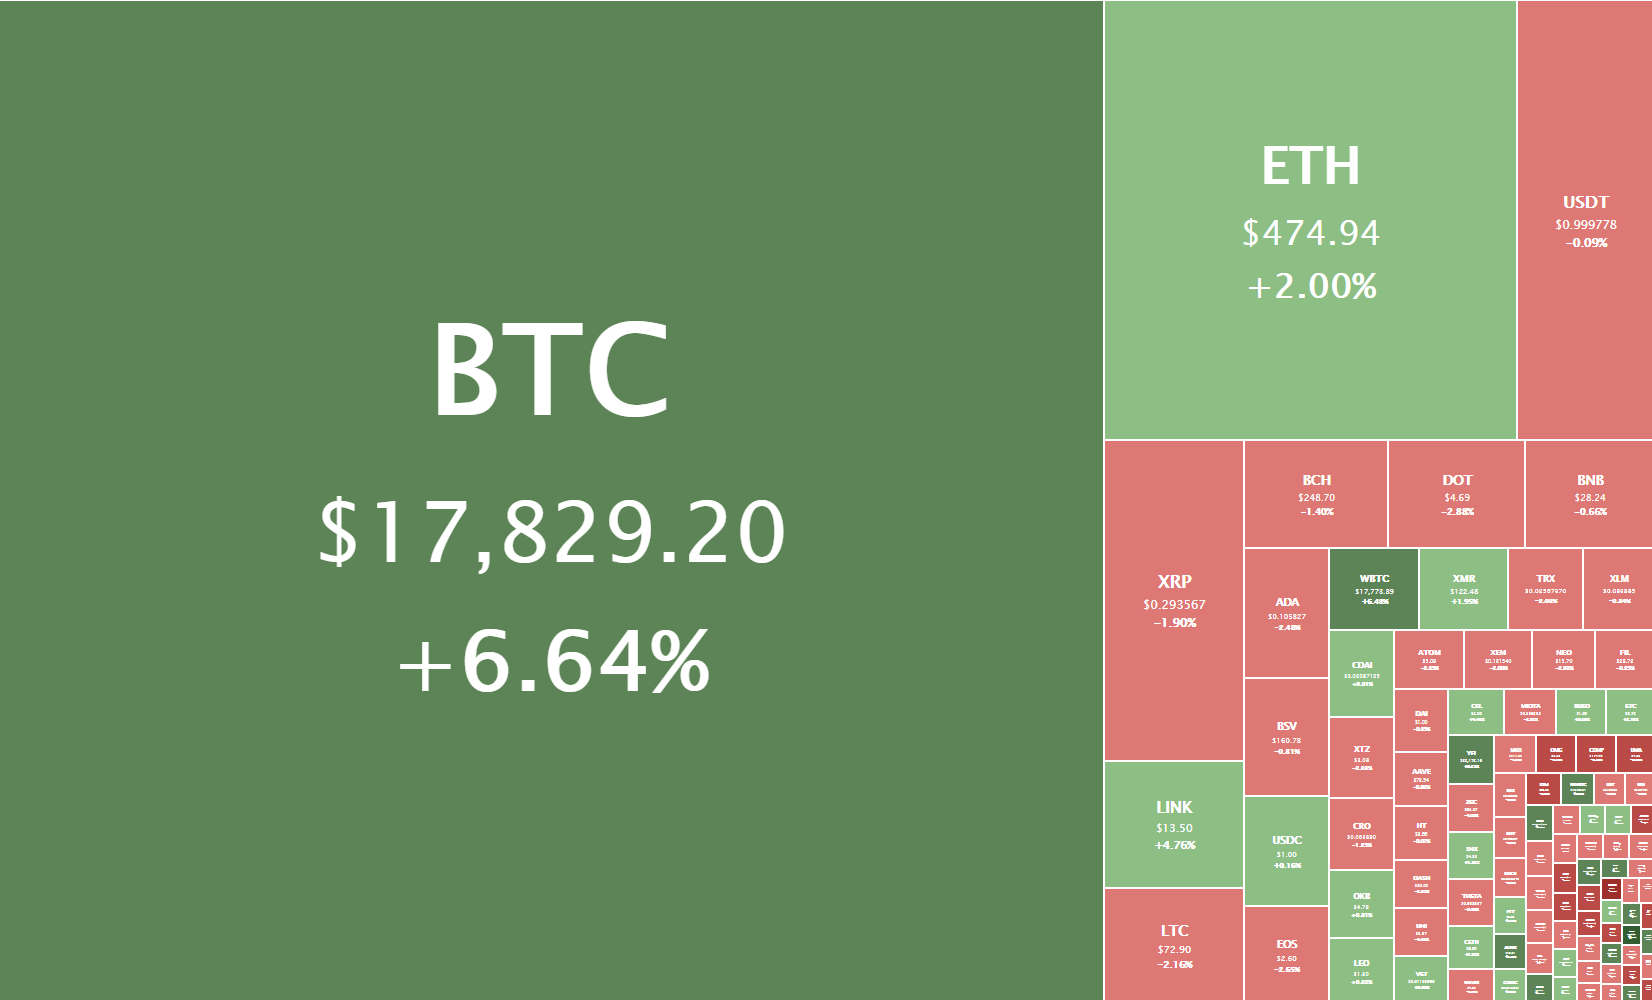
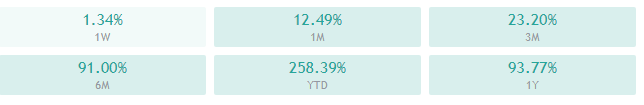
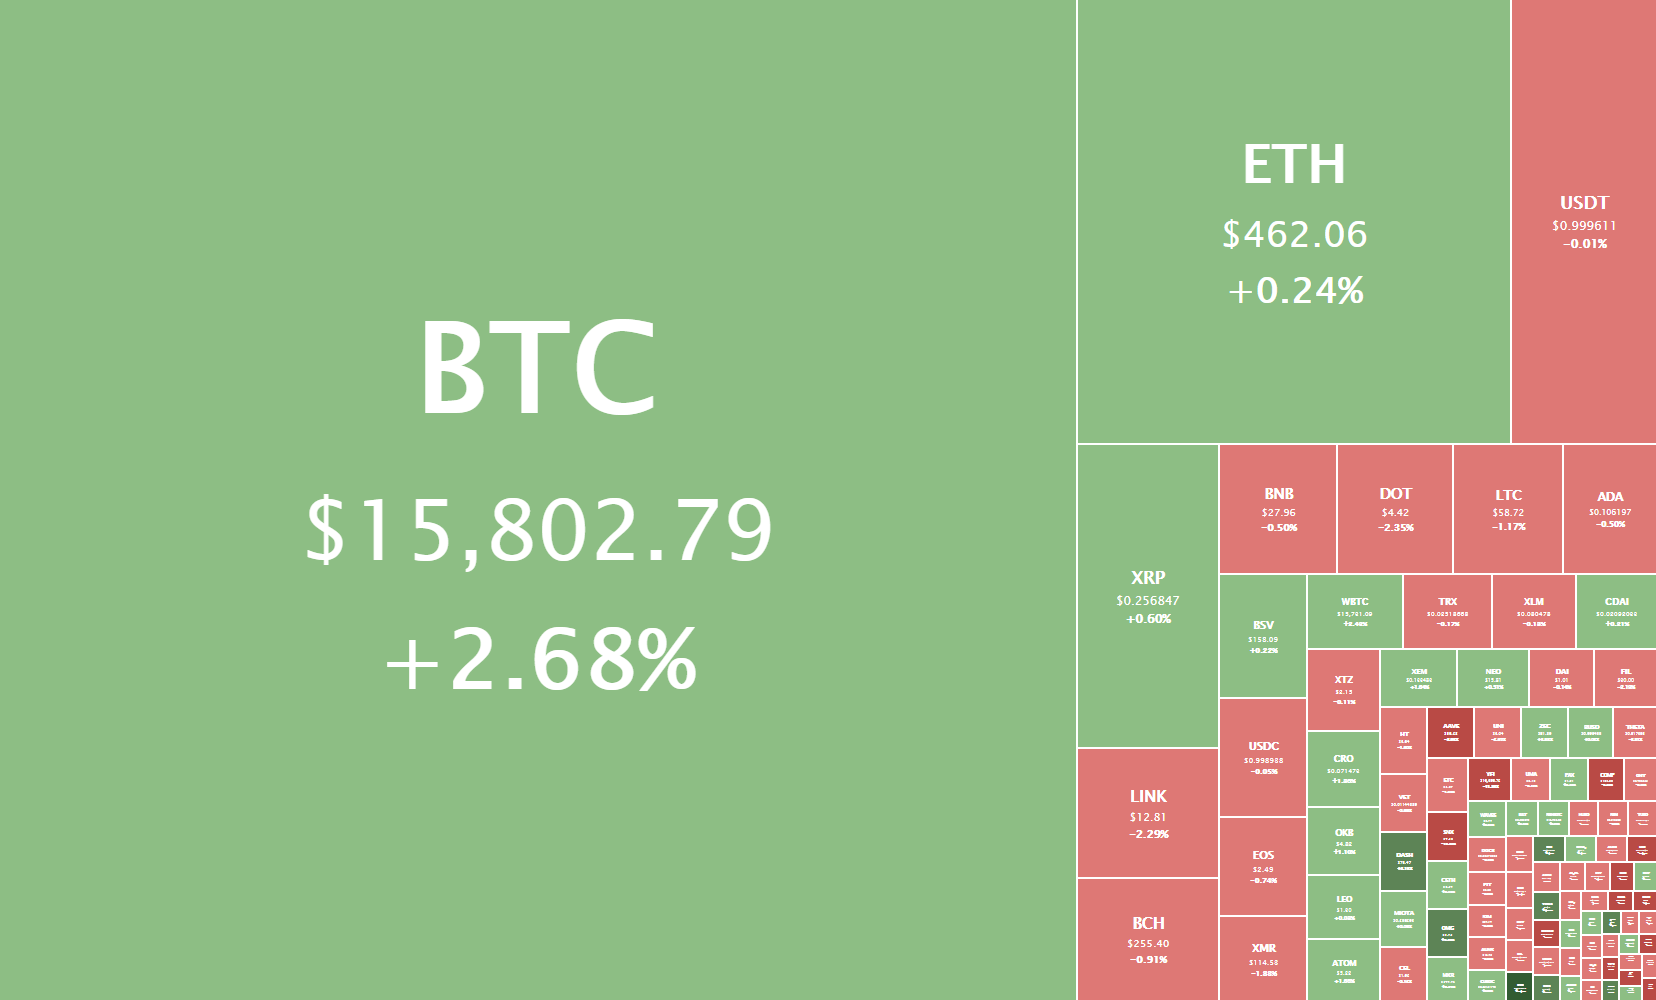
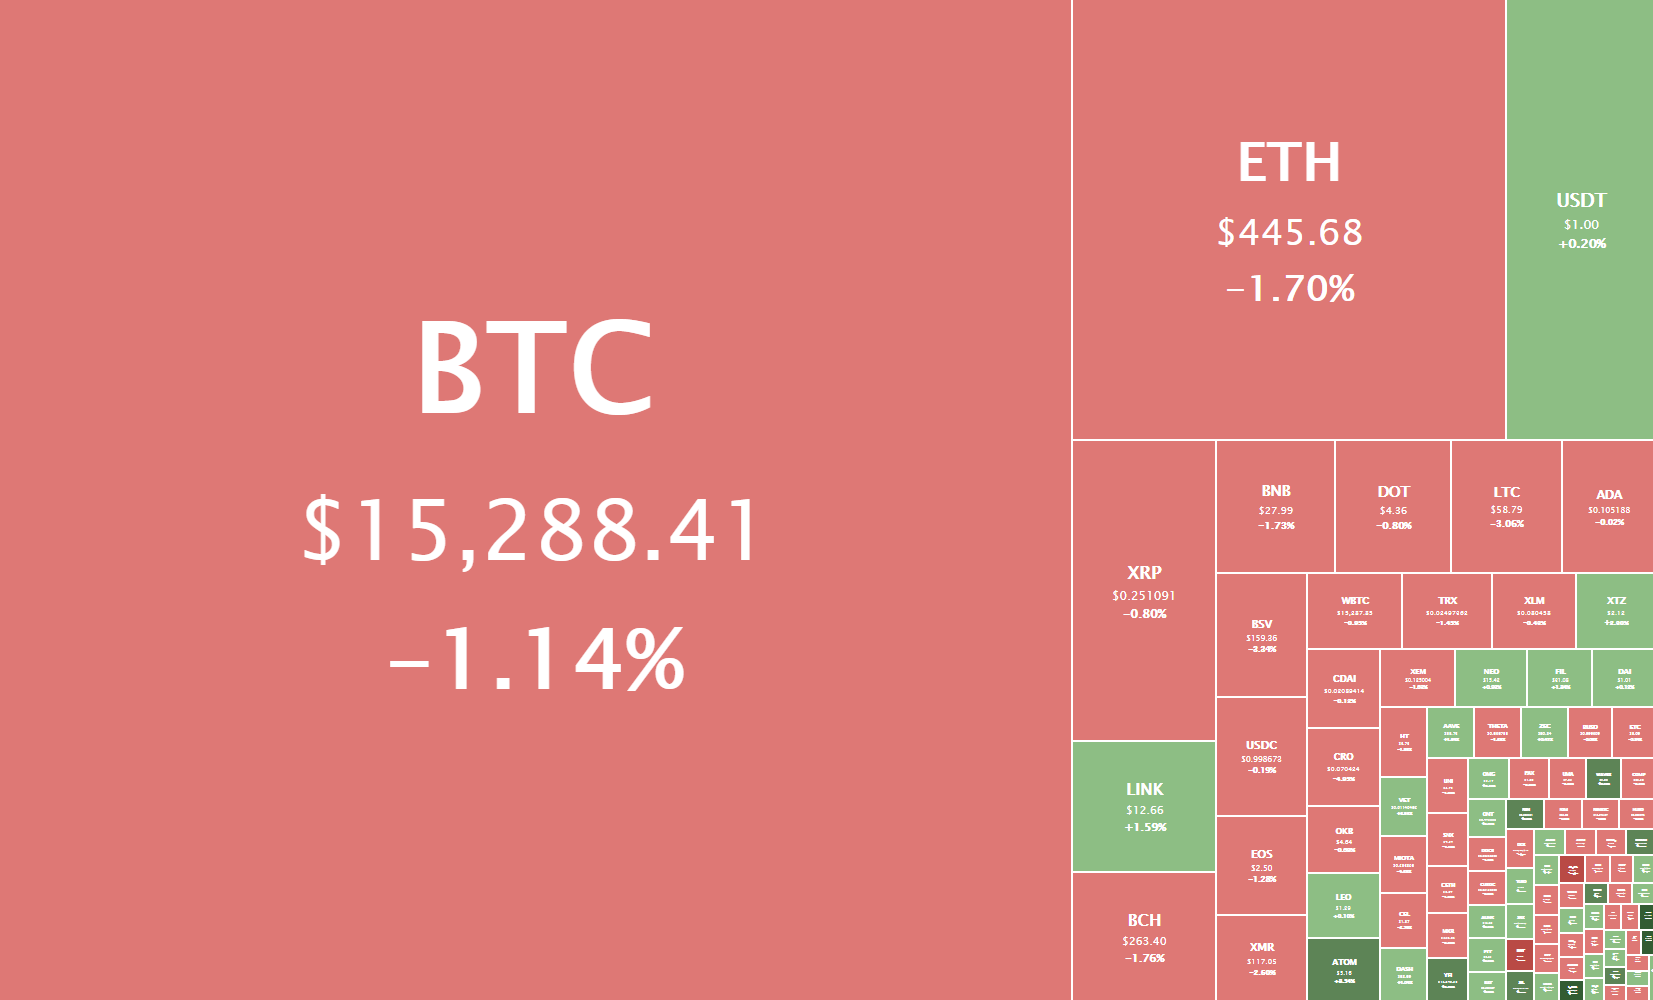
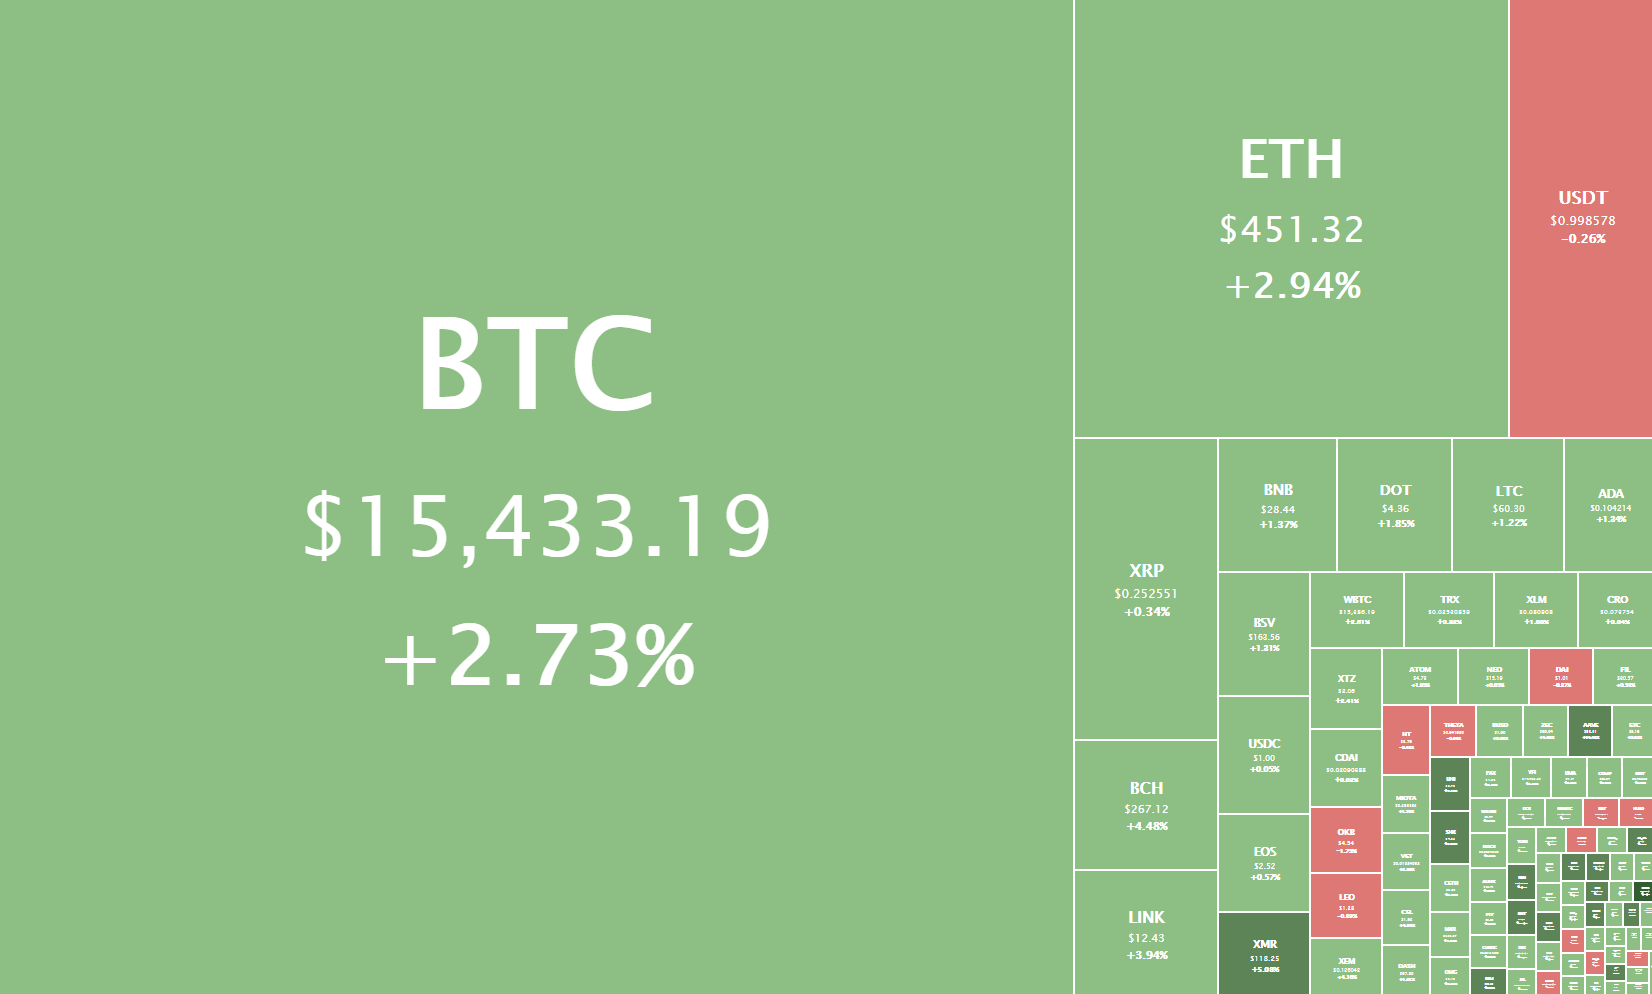
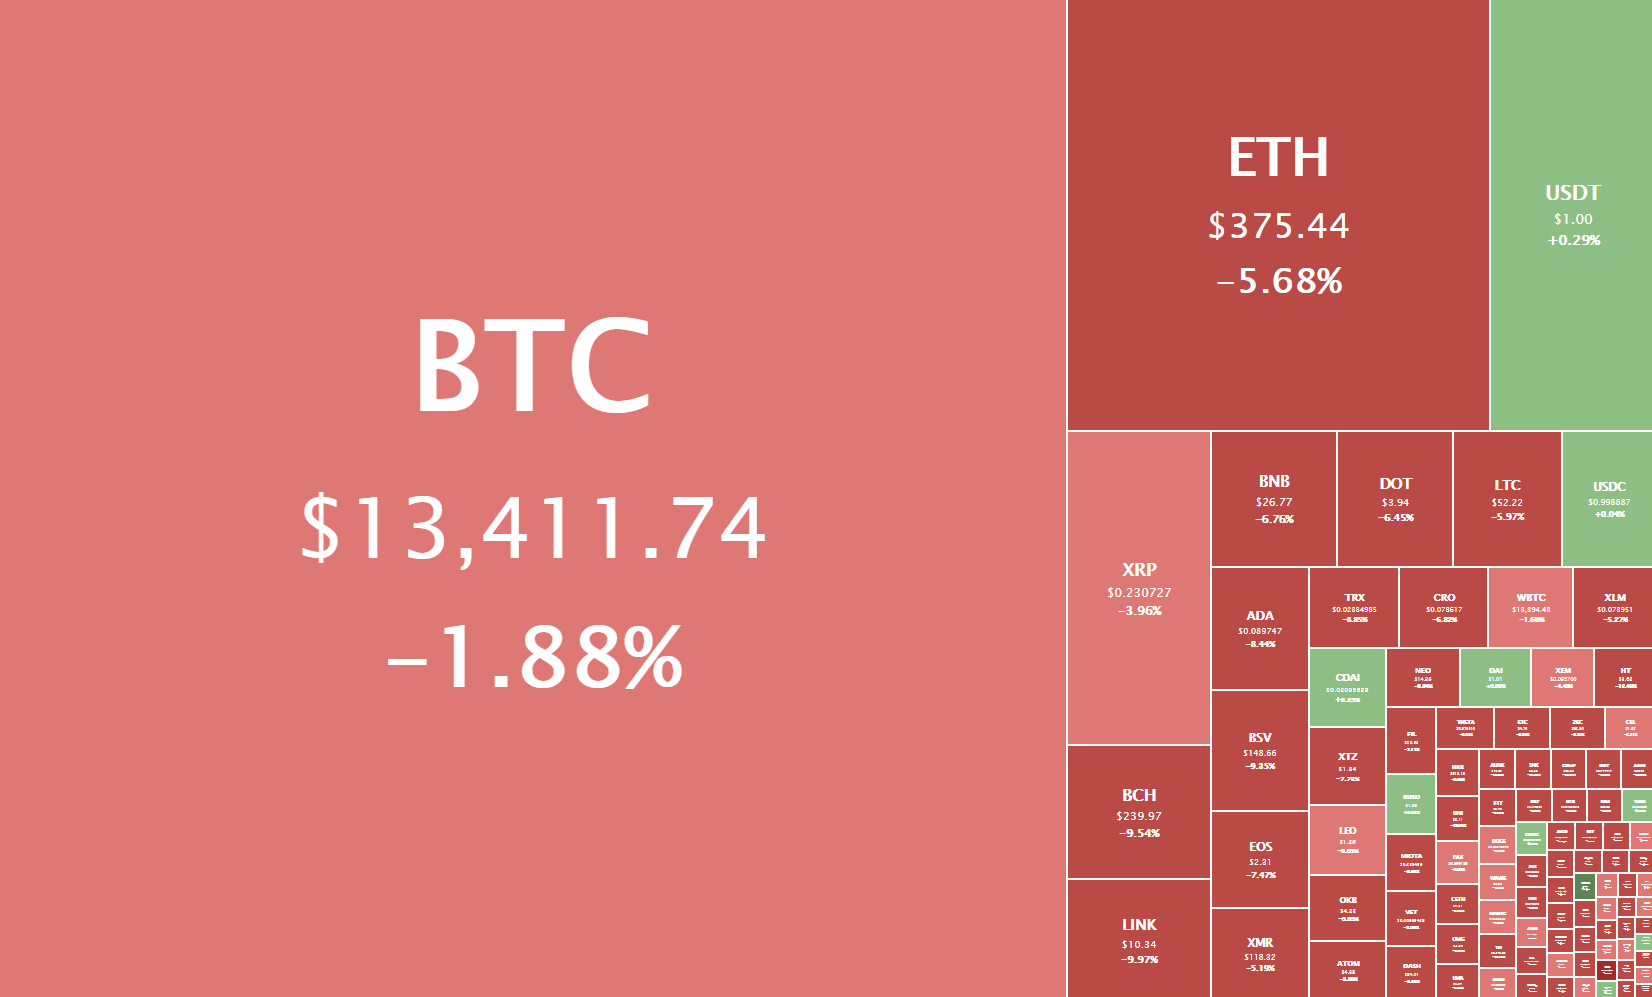
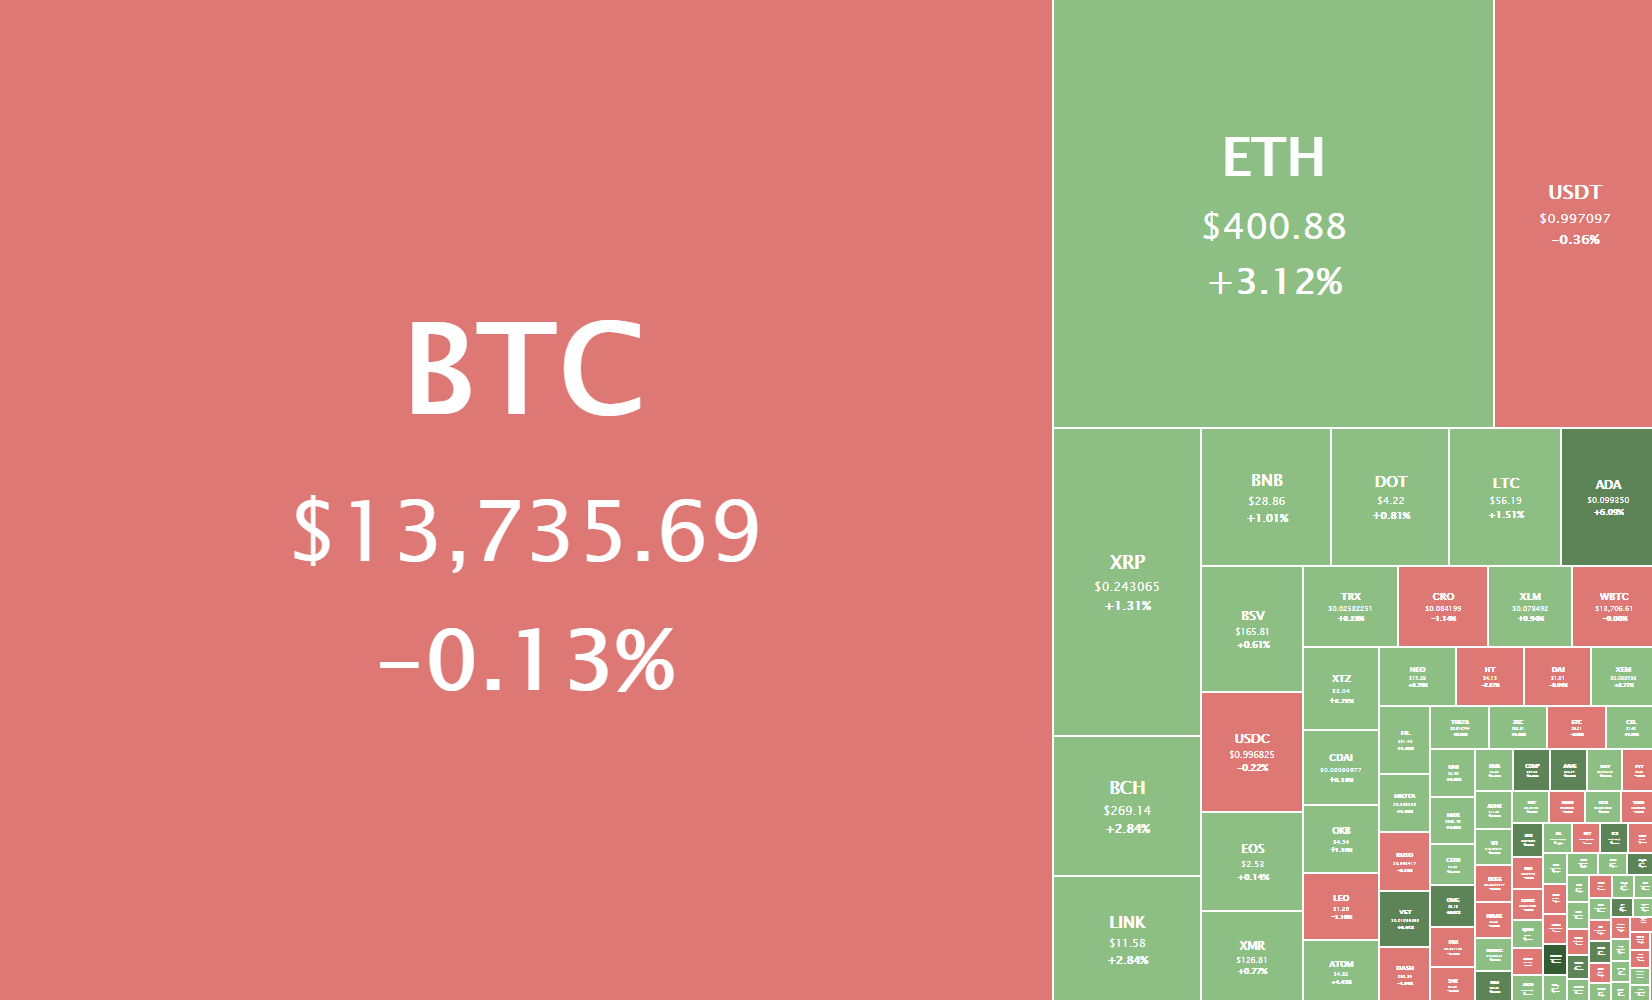
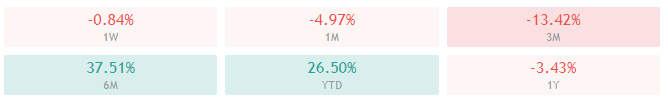
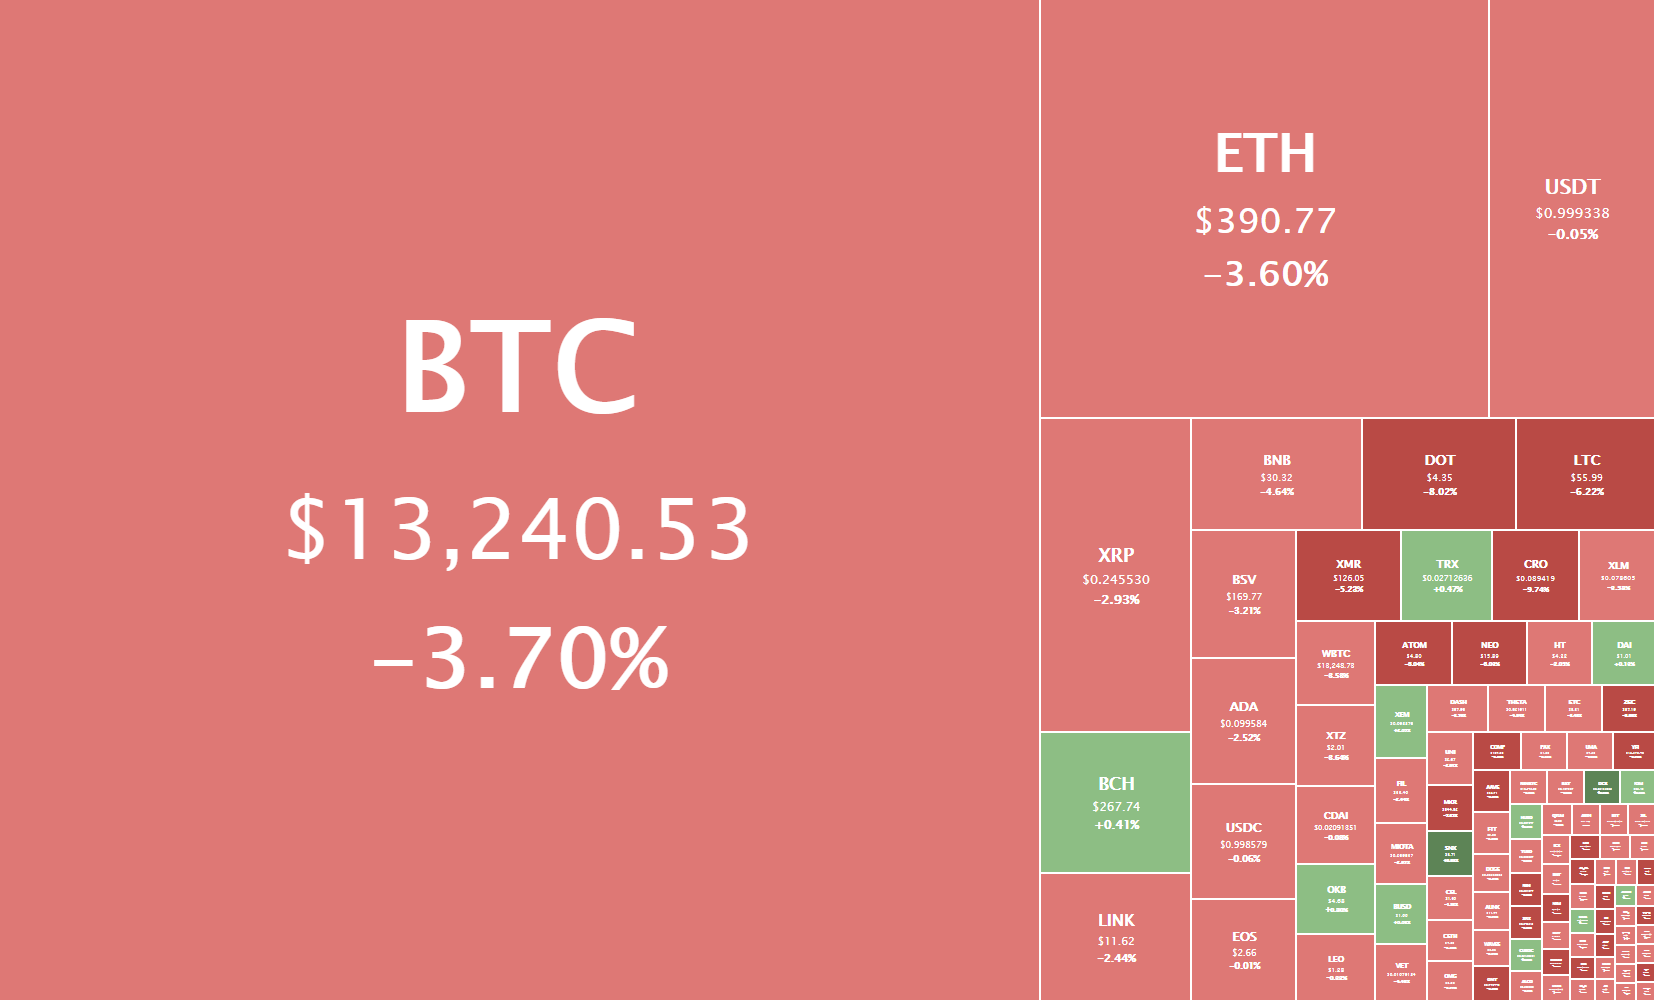
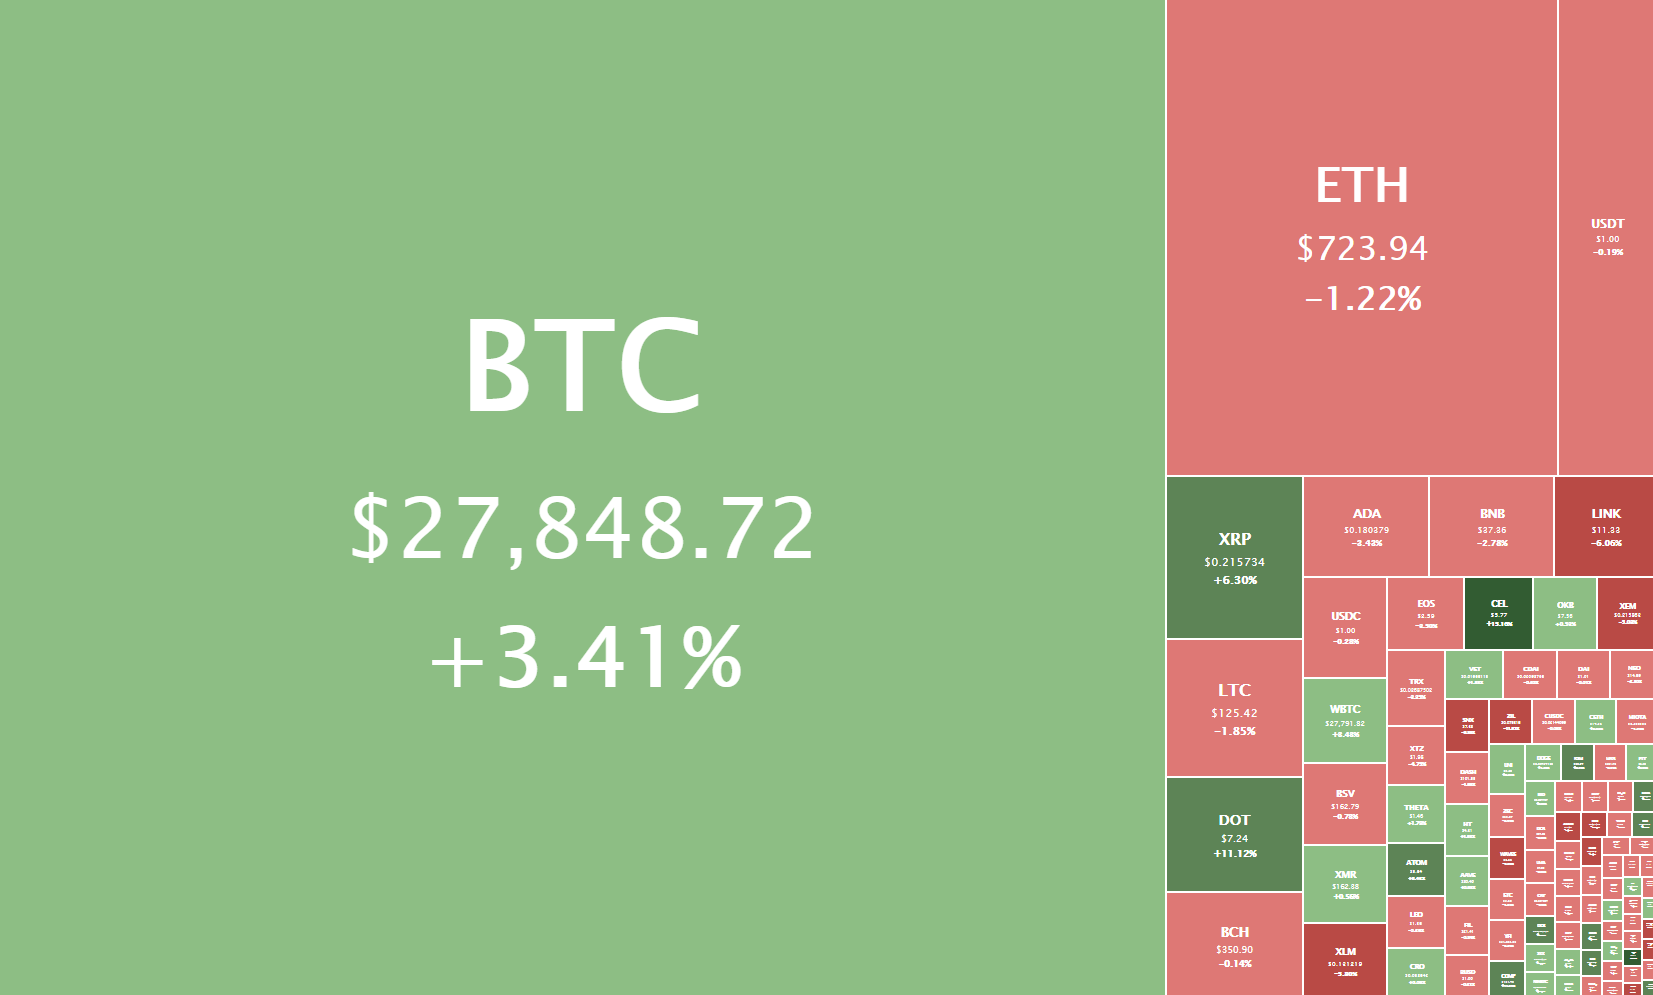
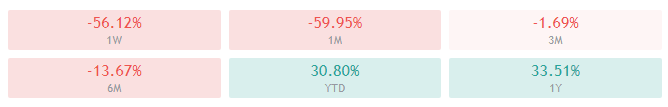
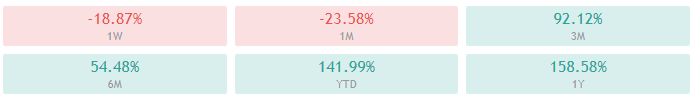
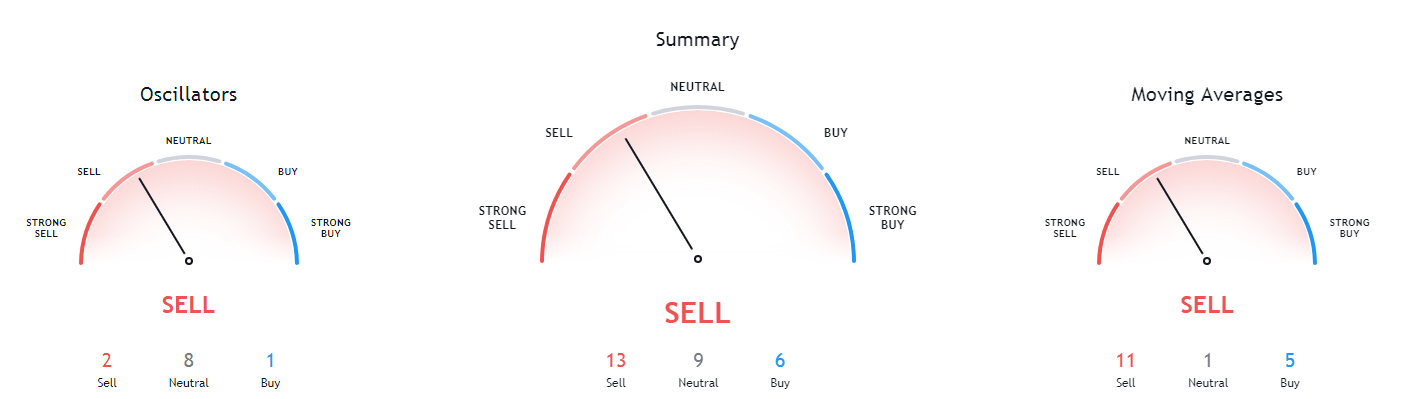
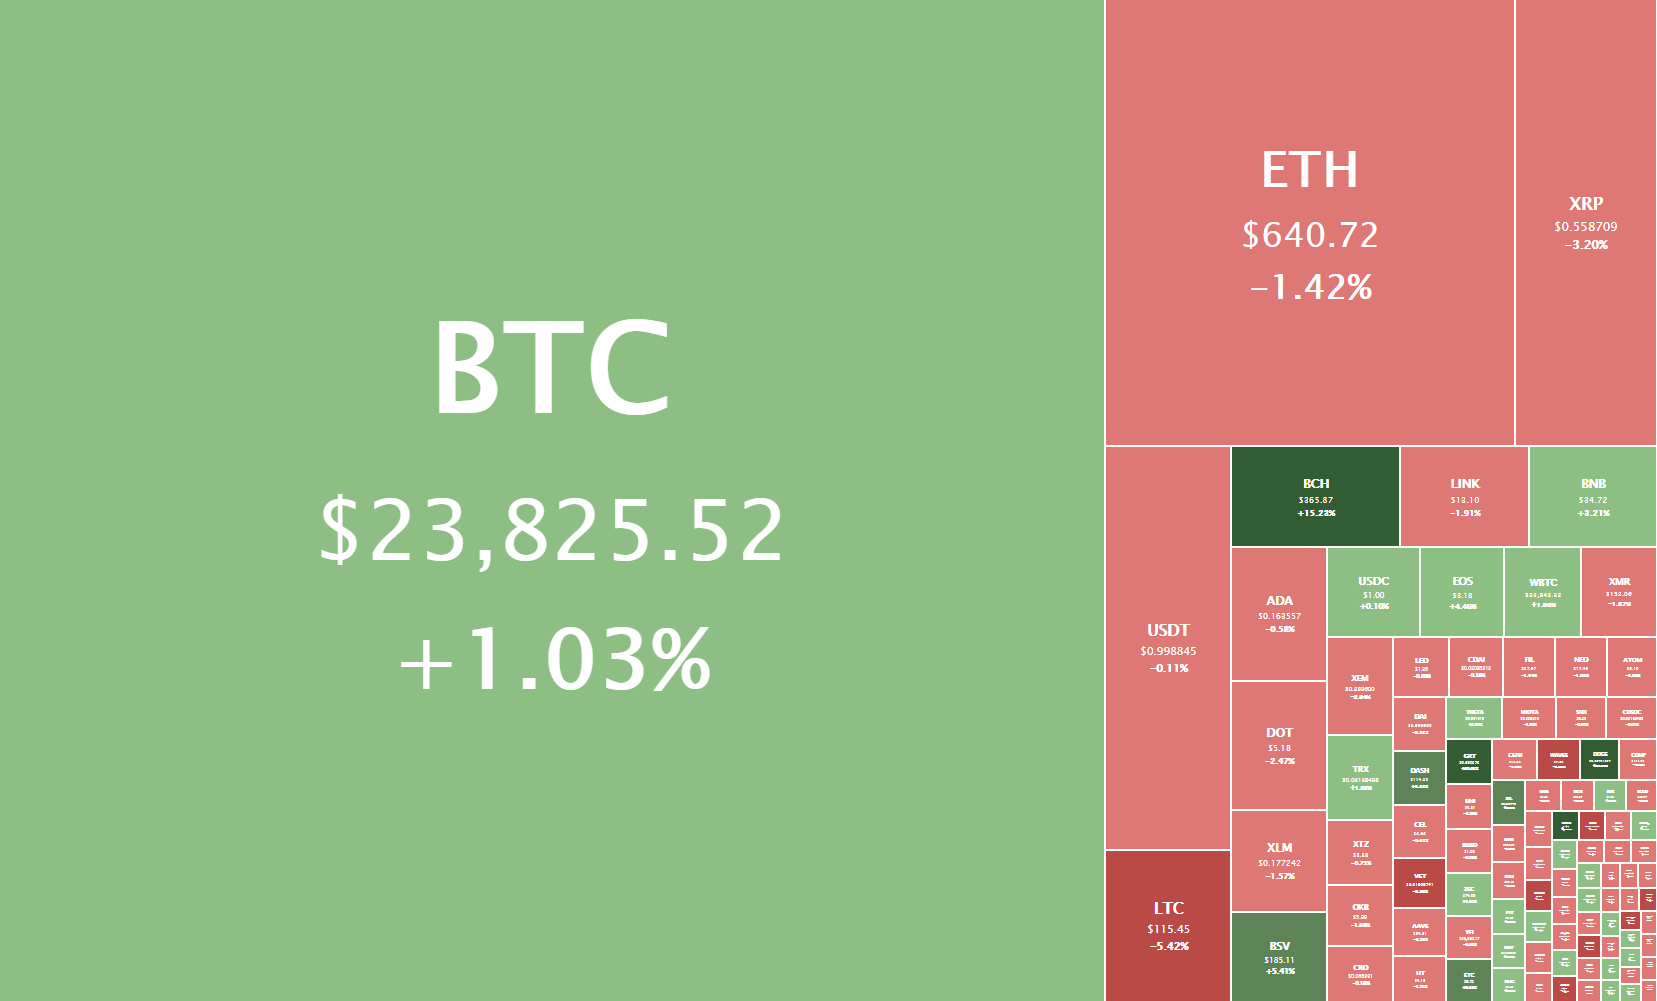
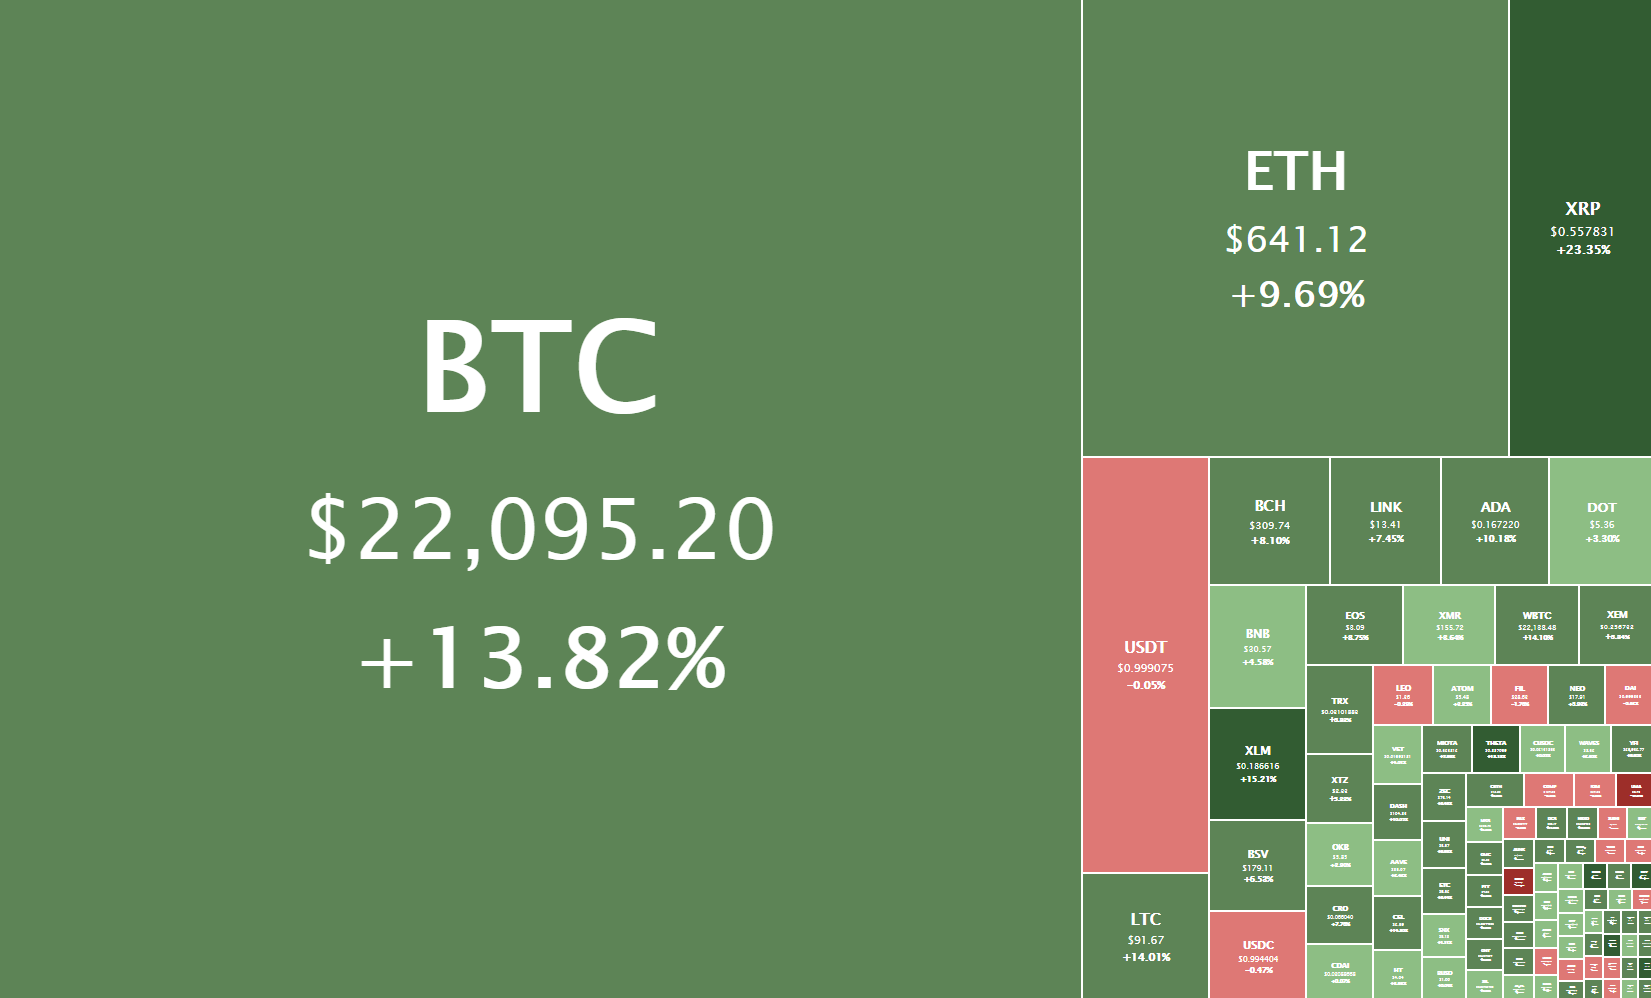
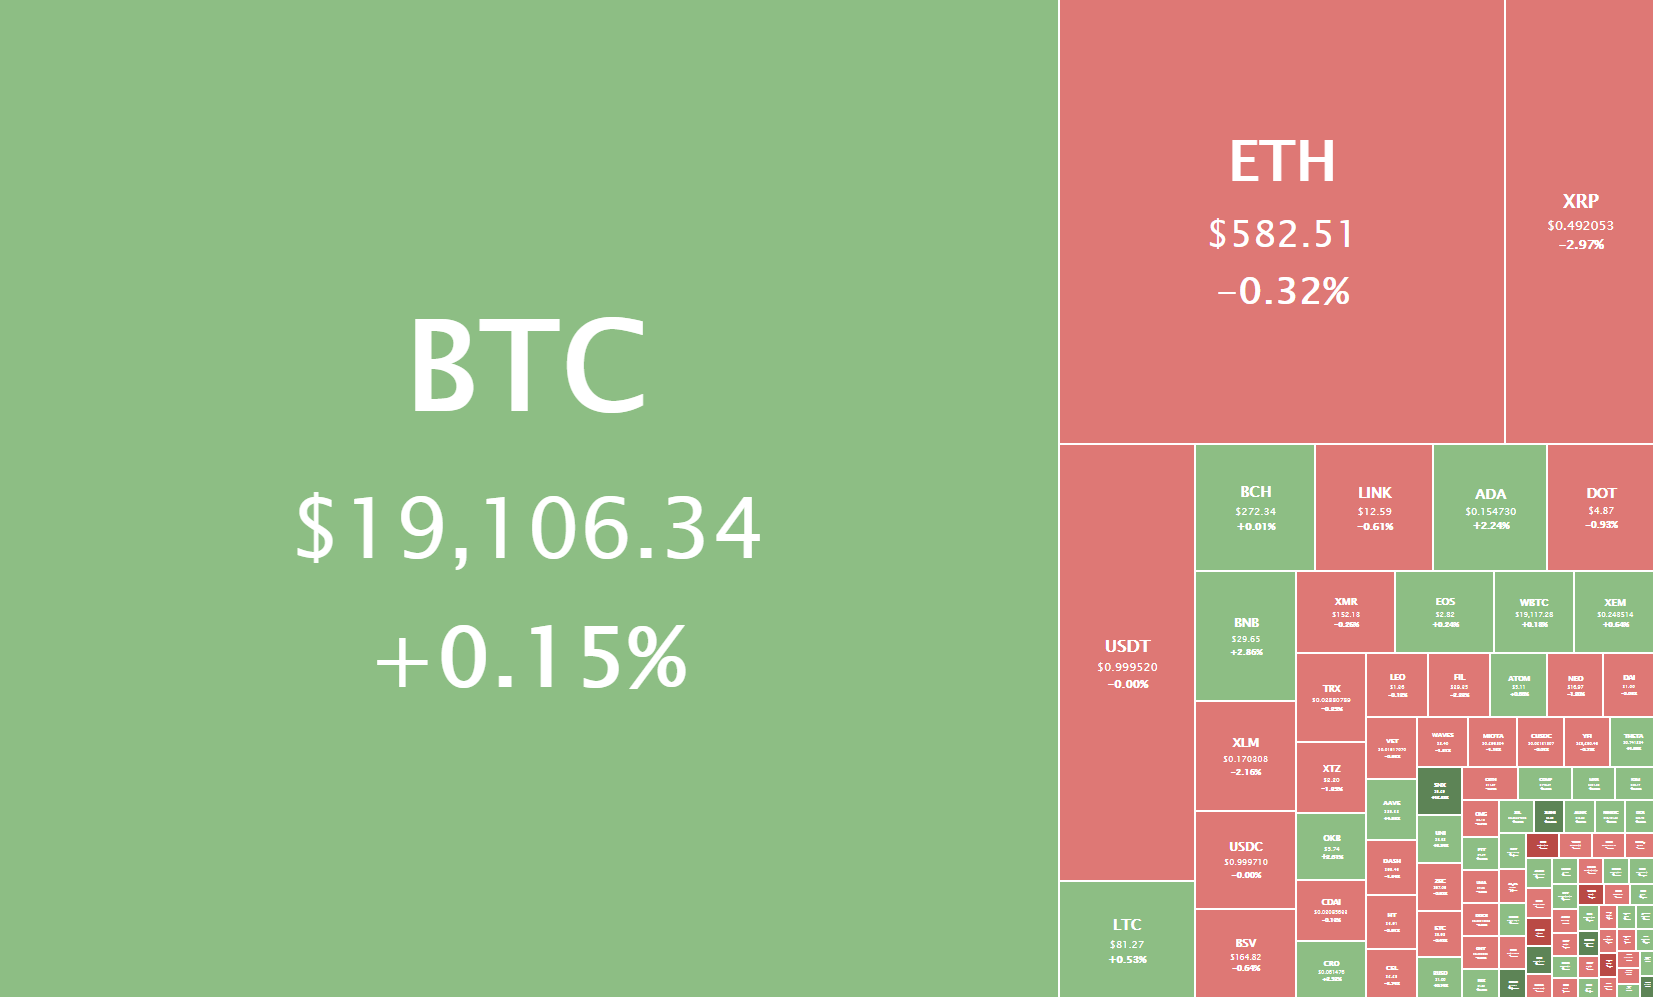
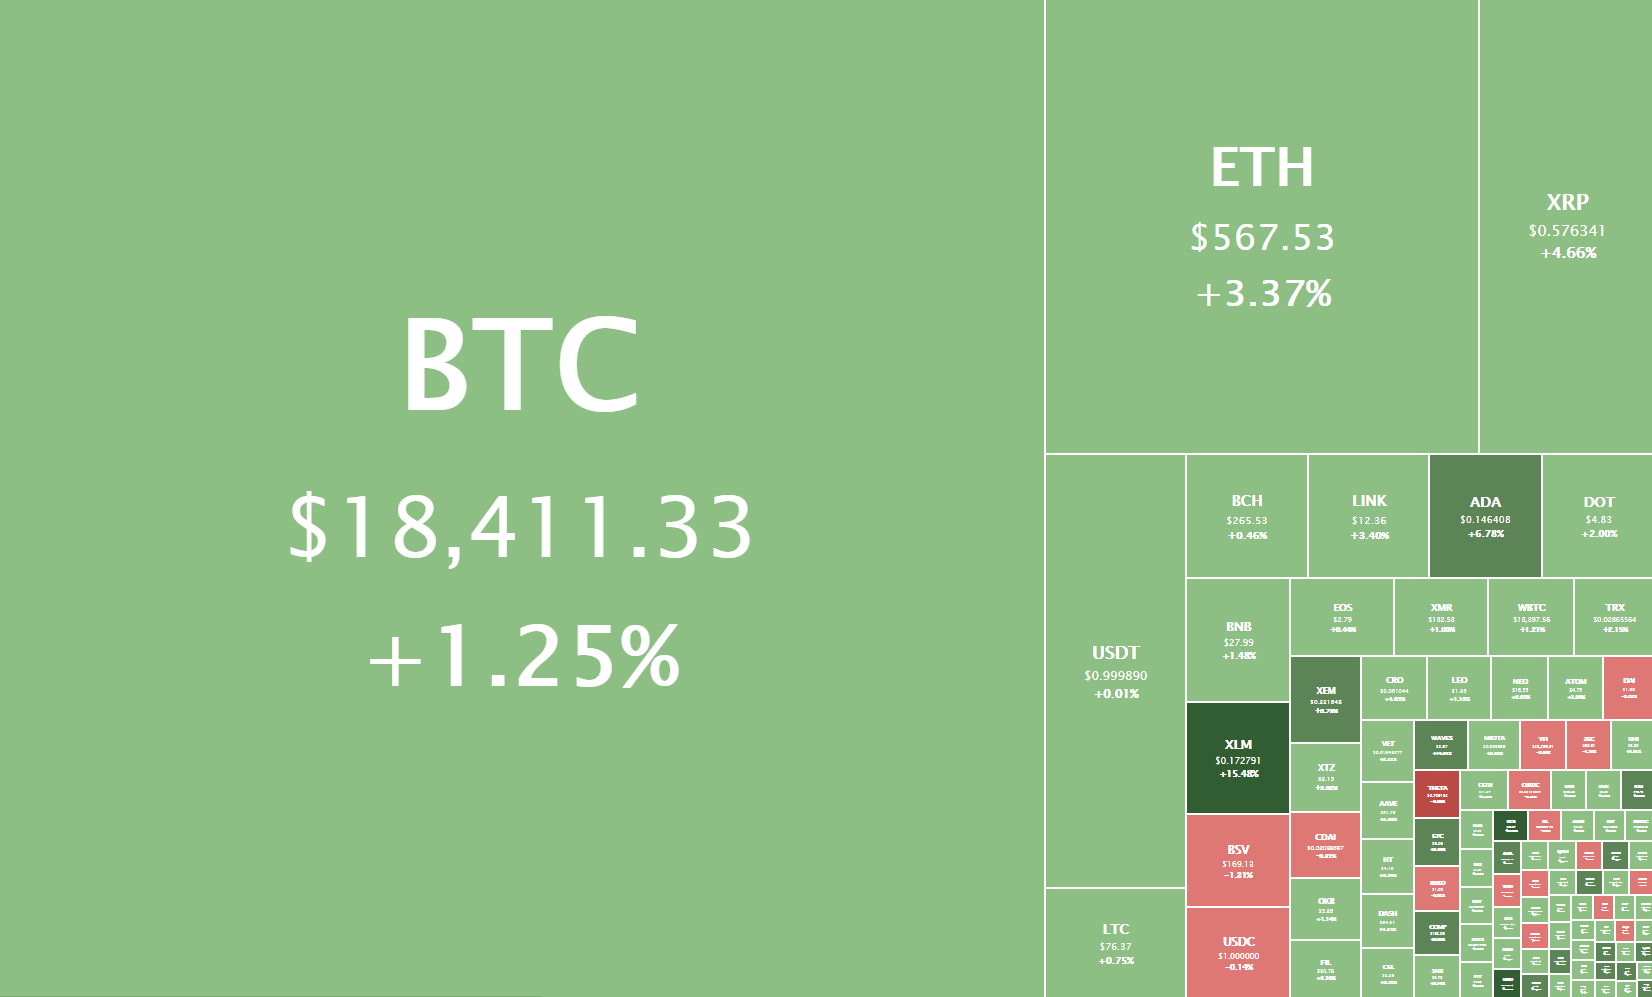
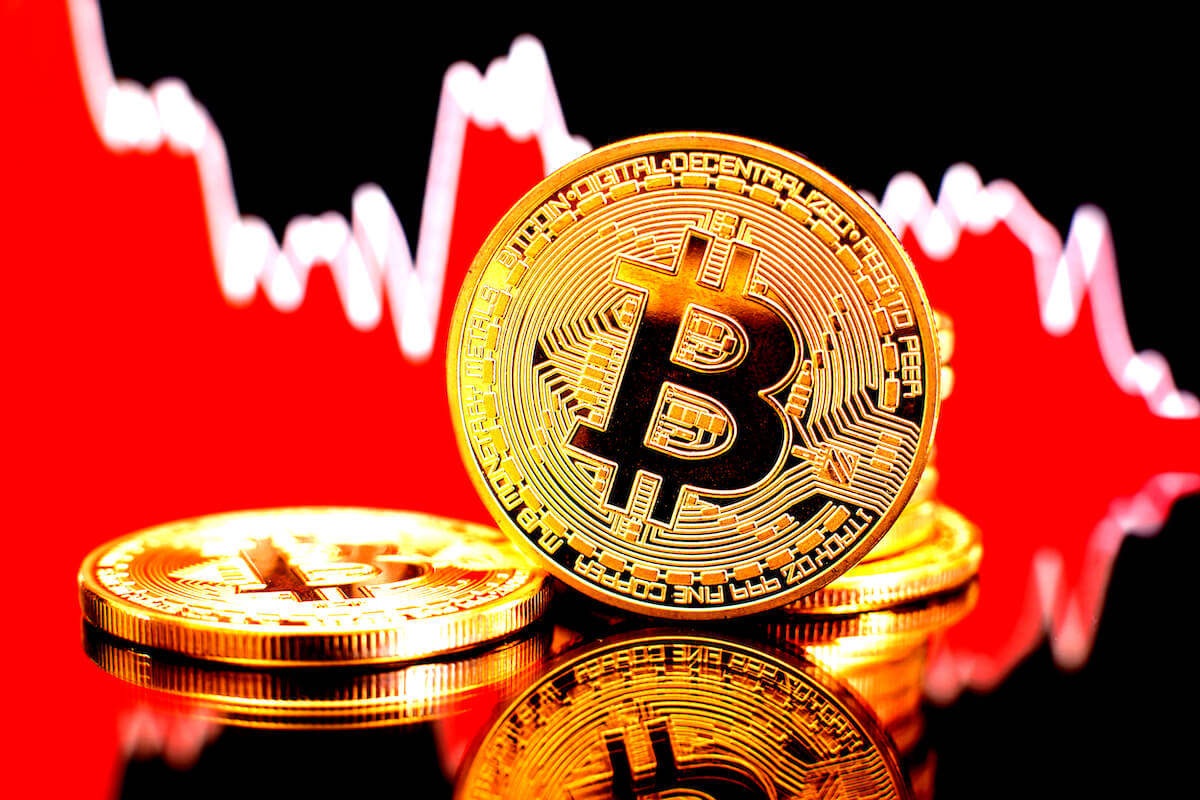
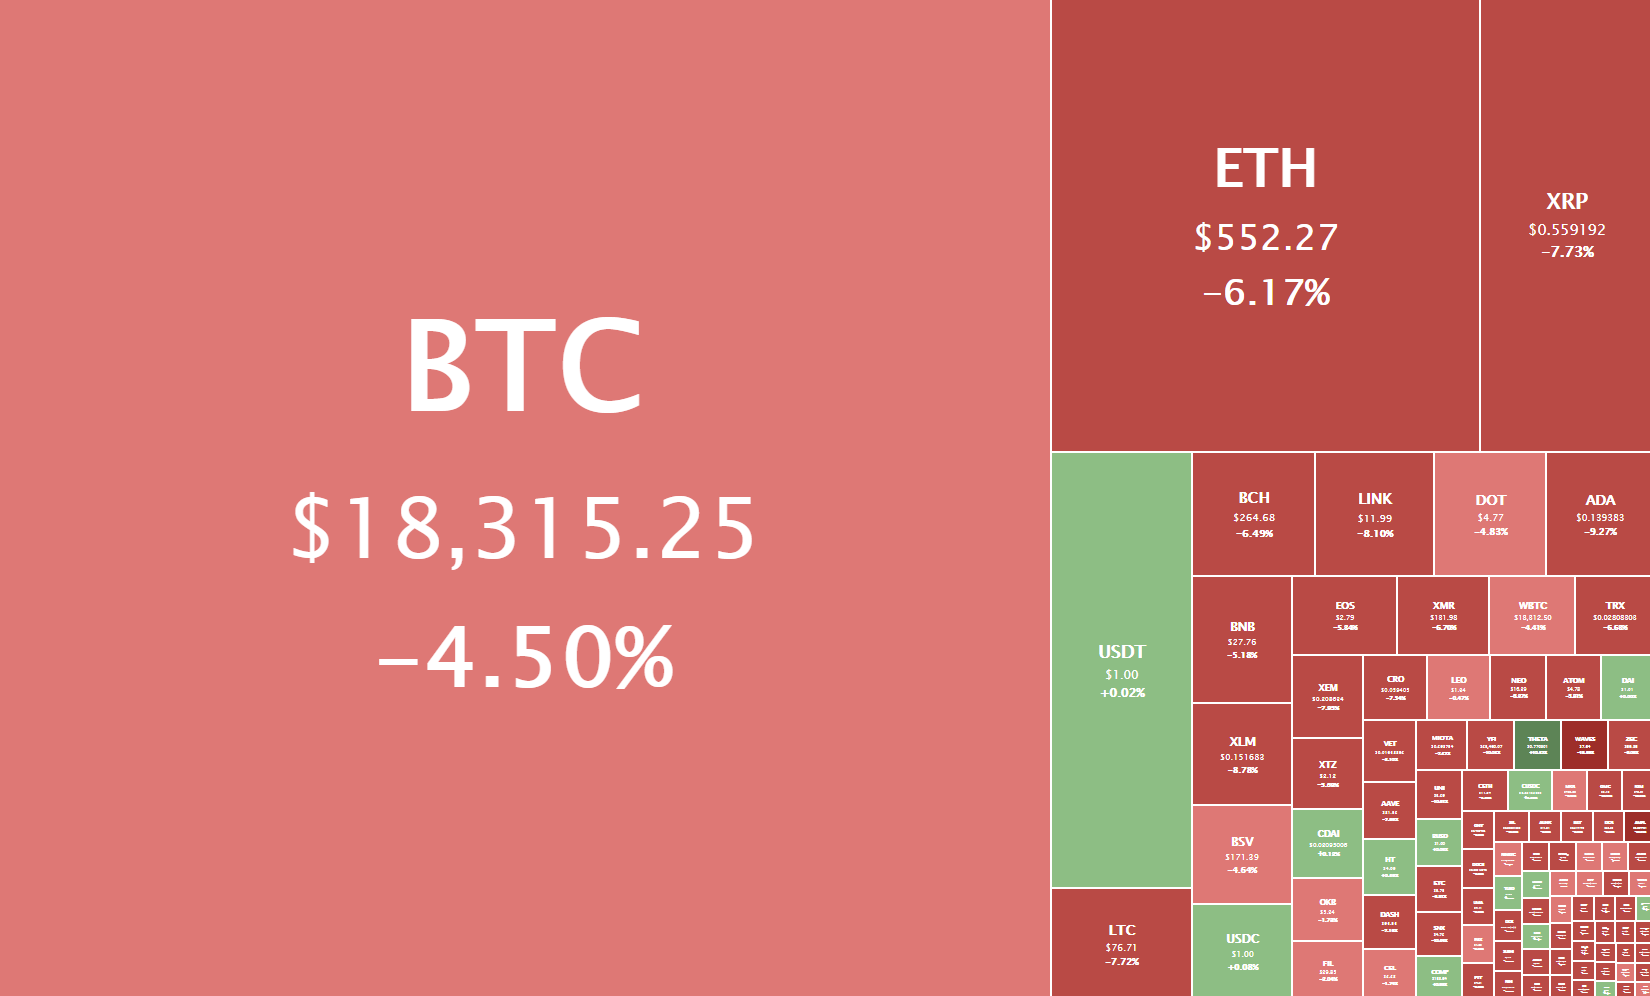
Bitcoin is an excellent example of cryptocurrency value fluctuations. In 2017, one coin was worth $5,950 in November, and the value skyrocketed to $19,700 just a month later. Bitcoins can fluctuate in over 10% of value daily.

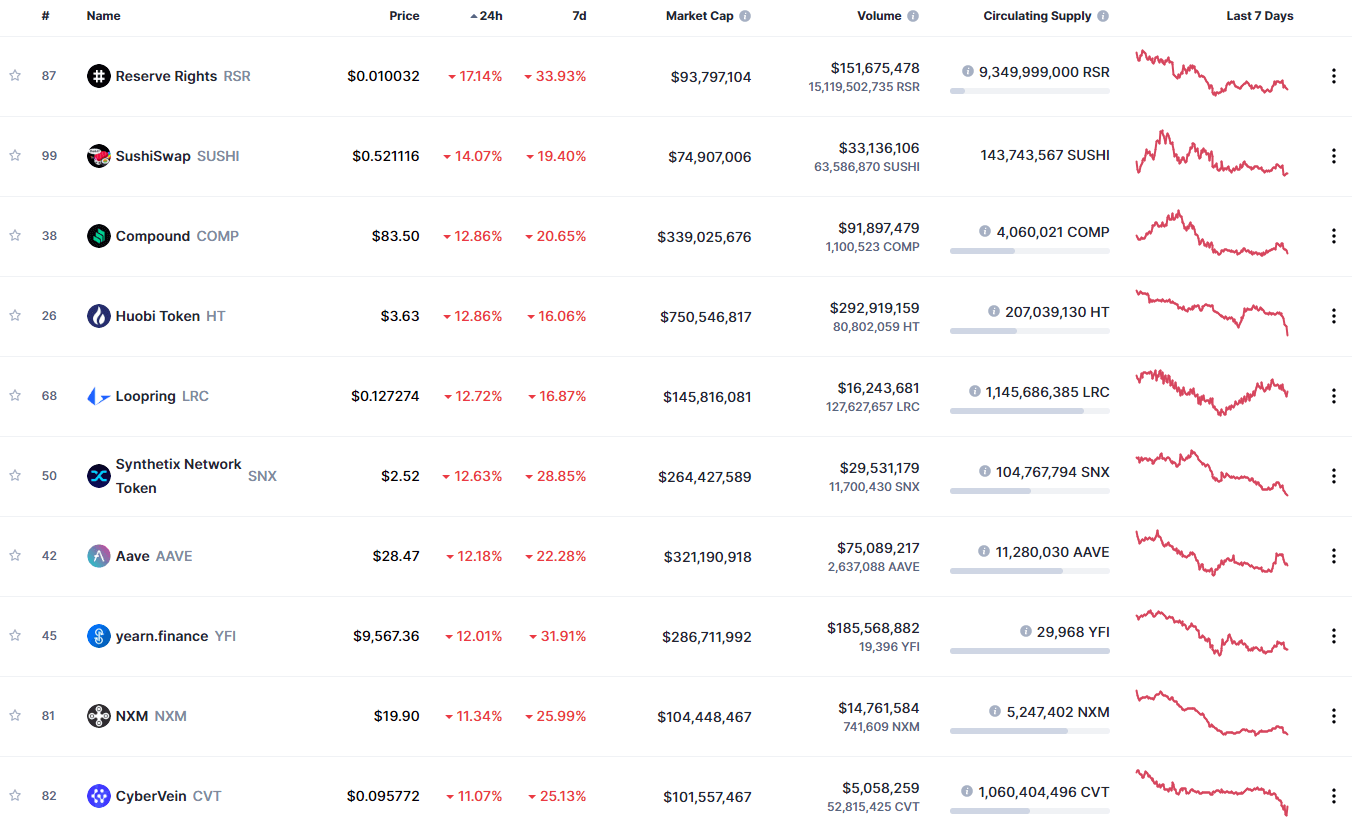
The volatility of traditional crypto assets made them more viable for speculative investment and less suitable for daily transactions. Who wants to buy a bike with bitcoins today, only for the same amount of bitcoins worth a truck tomorrow?

Stablecoins are better suited for daily transactions than traditional crypto assets purely because of reduced volatility. These hybrid crypto assets did well in 2020 after addressing value fluctuations because of their transactional convenience.

Advantages of Stablecoins over Traditional Cryptocurrencies

  • Stablecoins utilize liquidity pools, diminishing volatility, and offering predictable purchasing power.
  • These currencies offer exceptional convenience in remitting secure, fast, global payments. The payment protocols integrate seamlessly with blockchain networks.
  • Stablecoins offer redemption guarantees at face value. You can recover the exact amount of fiat money you spent acquiring individual stablecoins.

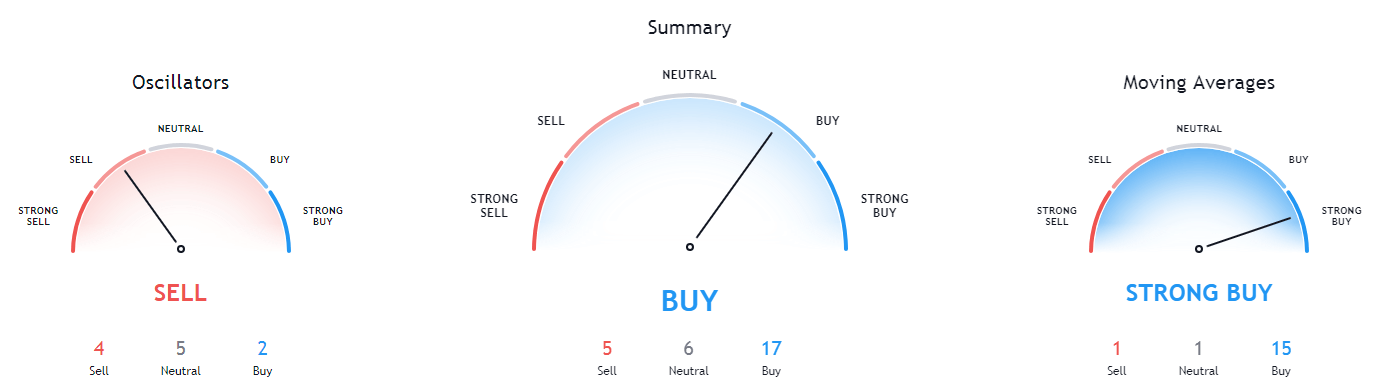
Why Was XRP Overtaking the Crypto Markets?

The creators of Ripple wanted to develop a payment protocol that:

  • Processes transactions fast
  • Offers a global reach
  • Levies negligible transaction fees
  • Is secure and irreversible

This protocol applies a digitally distributed ledger, and the network reconciles the ledger via independent validating servers. Since the network of randomized validators is vast, the Ripple protocol can validate numerous transactions in real-time.

You can receive payment notifications a few seconds after approving transactions.

Just a year after launching, Ripple’s payment protocol attracted banks, and the company has so far integrated the protocol with the networks of over 100 banks. The blockchain tech was impressive enough to get Ripple in MIT’s list of the smartest companies.

Ripple’s success was continually growing, and XRP became the most competitive currency after Bitcoin. It had amassed a market cap of $73 billion by the end of 2017.

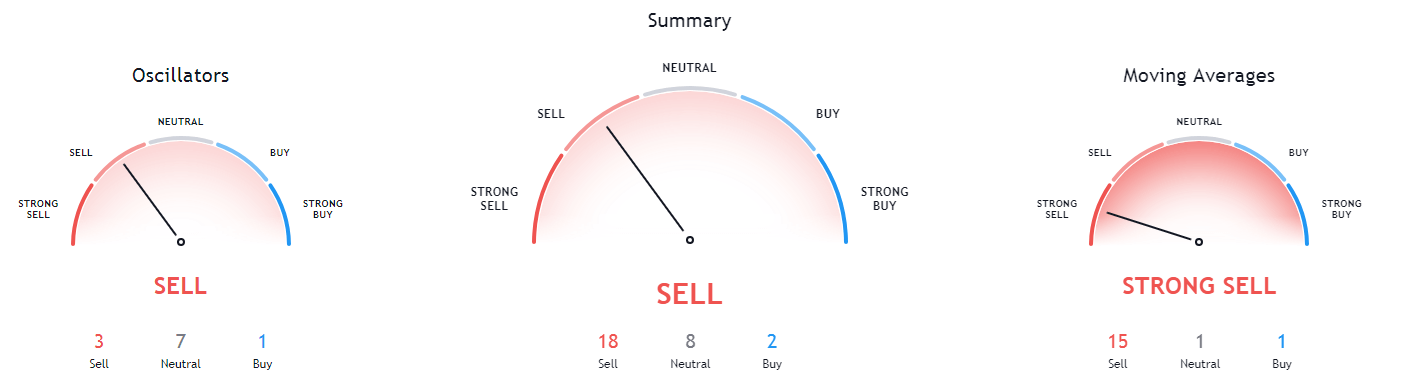
SEC’s All-Out War on Ripple and Other Traditional Cryptocurrency Firms

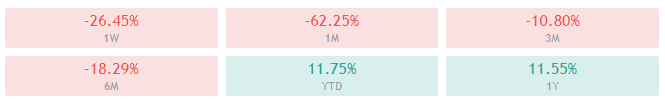
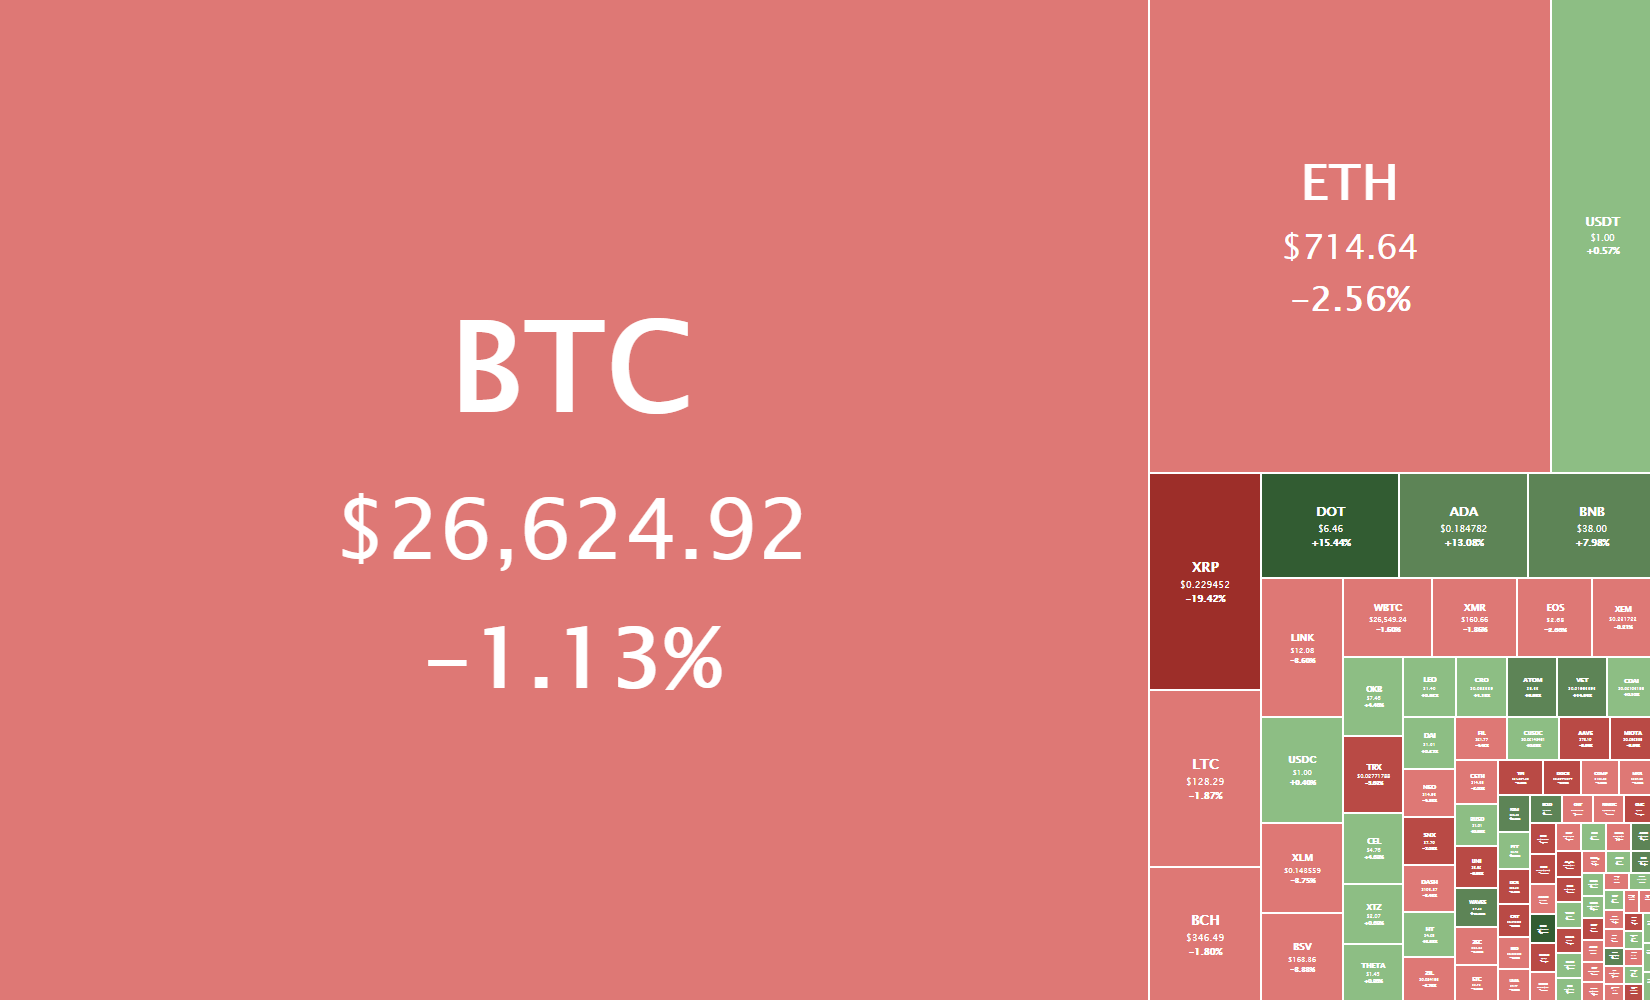
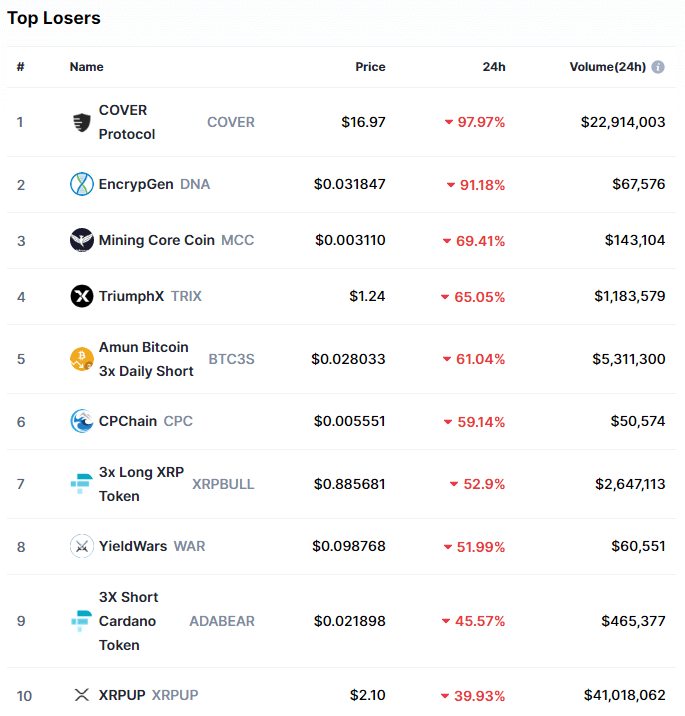
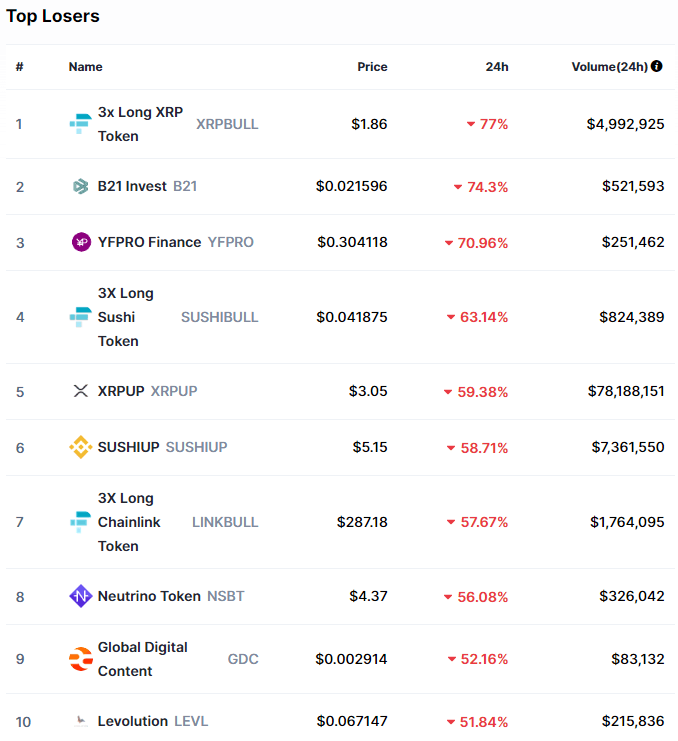
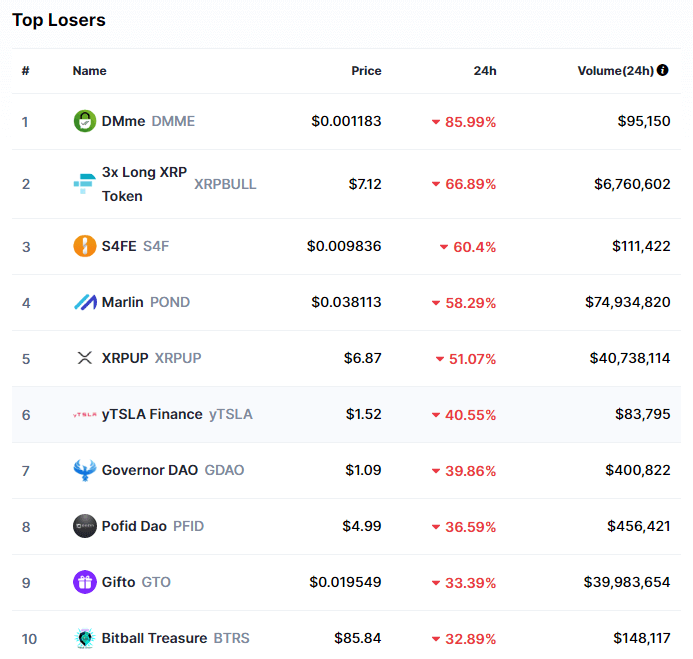
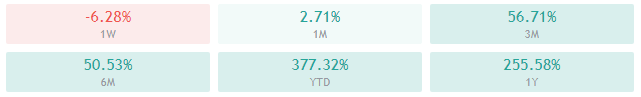
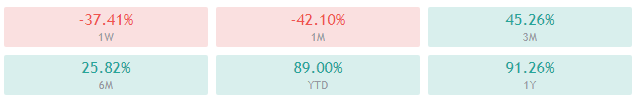
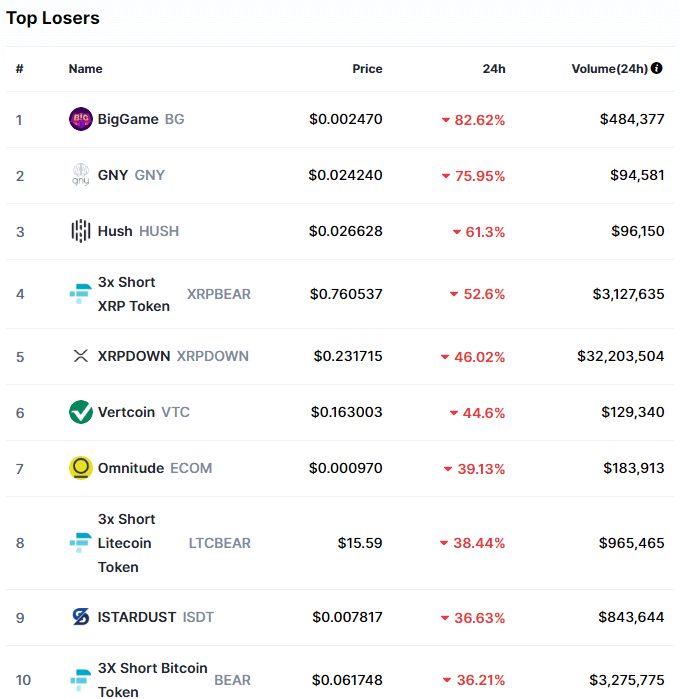
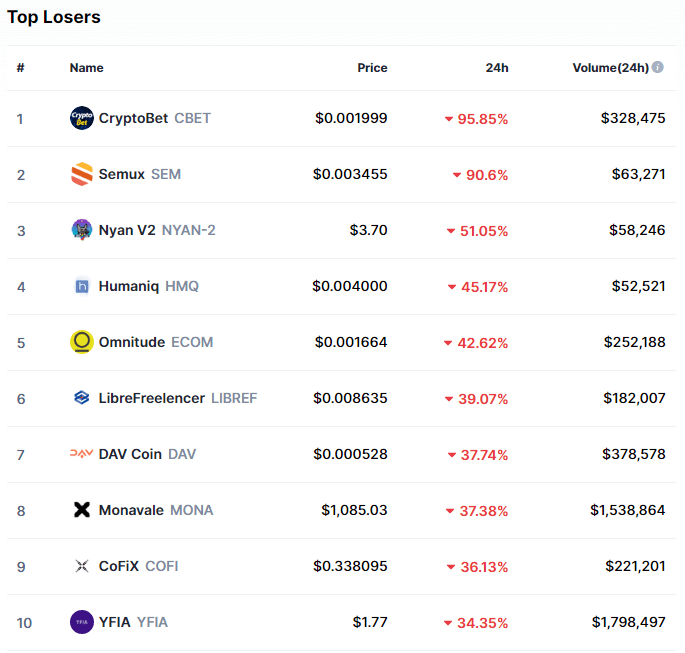
Coinbase announced it would suspend the trading of Ripple’s XRP, and other major blockchain exchanges followed suit. This was a significant development that caused XRP’s value to drop drastically.

Major cryptocurrency exchanges are dropping XRP because of the legal conflict Ripple has with the SEC. Most of the exchanges are trying to go public, and Ripple’s issues with the SEC could cause rising expenses for firms like Coinbase.

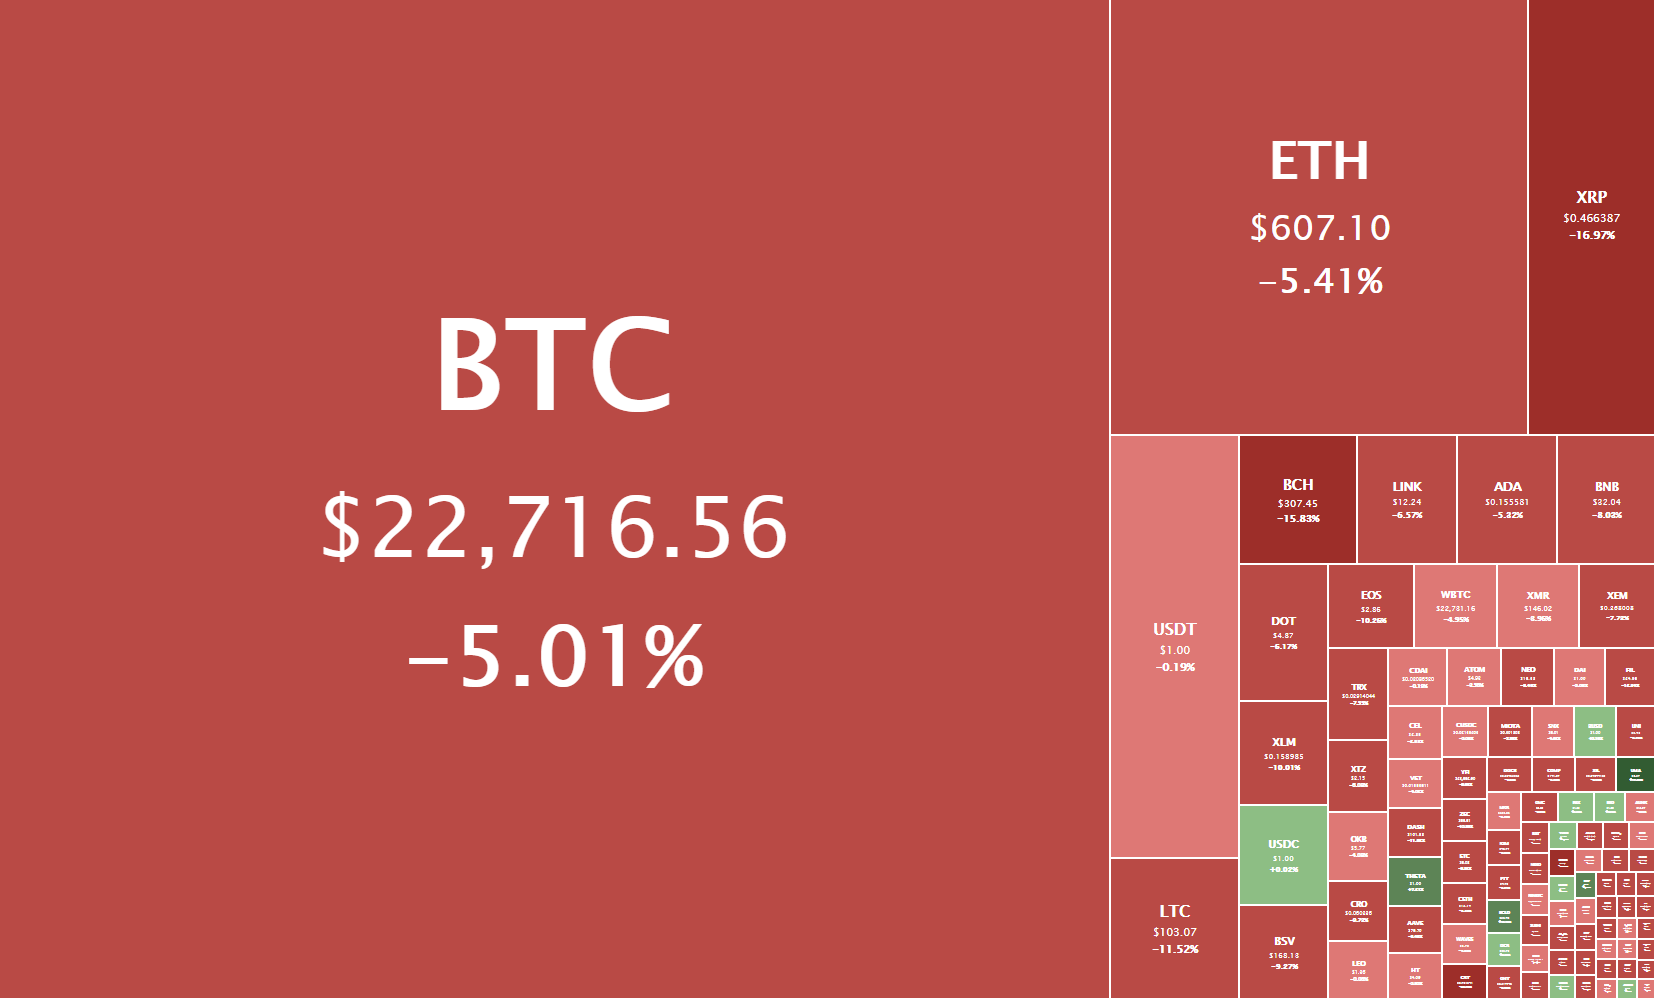
The SEC charged Ripple for offering securities for over seven years without due registration. This financial regulator categorized XRP as security. The lawsuit caused the price of XRP to fall by over 50%.

Ripple’s leadership is also facing charges for failing to disclose crucial information that XRP buyers needed to assess their risks. The current and former Ripple CEOs are accused of distributing XRPs for non-cash consideration without duly registering XRP as a security.

Ripple is determined to fight the lawsuit, and it does not consider the SEC to have any regulatory jurisdiction over XRP. According to the network’s leadership, XRP is a currency and not a security. Still, the SEC insists Ripple must comply with federal laws meant to protect investors and consumers.

Exchanges risk court charges and law enforcement raids if they continue trading XRPs without registering as securities exchanges. Since the registration process is costly and time-consuming, crypto-asset exchanges would instead let the Sec and Ripple Labs face off in court.

But Ripple Labs is not the only subject of the SEC’s all-out war on cryptocurrencies. This federal agency also fined EtherDelta $400,000 for operating unregistered securities exchanges. The circumstances would have been worse, and EtherDelta settled with the SEC to avoid harsh penalties.

Airfox and Paragon Coin were not so lucky; they were charged for selling digital tokens in ICOs. The Sec found grounds to penalize them for violating registration requirements for ICO securities.

Airfox had to return $15 million to investors and register its tokens as securities. Paragon Coin had to return $12 million to investors, register its tokens as securities, and report to the SEC periodically.

Parting Shot

Did you think the regulatory force would be so impactful? Do you remember how effectively legislative committees were in silencing Facebook’s Libra? The legal environment is hostile for non-compliant blockchains. 

Only Bitcoin seems resistant to government censorship, but it’s also the only one with an anonymous founding creator. We can’t say the same about Ripple’s XRP, and stablecoins will also be subject to government scrutiny. It’s only a matter of time.

However, blockchain technologies are secure, transparent, convenient, and cost-effective. Digital currencies offer irresistible benefits for users and investors. These fintech technologies will evolve to find legal compliance and global acceptance.

In the meanwhile, share your predictions on the reality of XRP’s quagmire in the comments section. Share this article with your friends who fancy cutting-edge technologies that make life easier.

Categories
Crypto Videos

MoneyGram Distances Itself from Ripple!


MoneyGram Distances Itself from Ripple


Global money transfer service MoneyGram has updated its stance on its relationship with Ripple by clarifying the nature of their collaboration. The changed stance came as a response to Ripple’s recent lawsuit by the US Securities and Exchange Commission.

MoneyGram issued a press statement on Dec 23, revealing that it has never utilized Ripple’s counterparty services, more specifically its On-Demand Liquidity (ODL) and RippleNet, for forex transactions. They stated: 

“As a reminder, MoneyGram doesn’t utilize the ODL platform or RippleNet for any form of direct transfers of consumer funds – digital or other. Furthermore, MoneyGram is not a party to the Securities and Exchange Commission action.”

The company also added: 

“We have continued to use other traditional trading counterparties even throughout the term of the agreement with Ripple, and isn’t dependent on the Ripple platform to accomplish any of its FX trading needs.”

Looking back in June 2019, MoneyGram and Ripple entered into a strategic partnership that planned to tackle MoneyGram’s cross-border payments. As part of this collaboration, Ripple was obliged to invest up to $50 million in exchange for the MoneyGram stock.

In February 2020, MoneyGram also revealed an additional $11.3 million investment from Ripple on top of the agreed $50 million. However, Ripple has now sold about $15 million of its stake in MoneyGram.

MoneyGram’s current statement of not being dependent on Ripple’s services corresponds to the narrative that previous events have set. Earlier in the year, the company debuted a real-time remittance service based on Visa rather than its blockchain partner.

Another Ripple partner Intermex also revealed back in March of this year that it wasn’t using the Ripple’s platform for remittance in its “core market.”

MoneyGram’s press release is just the latest in a series of actions taken by companies regarding either Ripple or XRP, with all of them backing out from the company due to the SEC lawsuit. On Dec 23, investment fund Bitwise Asset Management liquidated its position in XRP, while several cryptocurrency exchanges have also started to delist the XRP token. The fallout that came from the SEC lawsuit has also exerted strong negative pressure on the XRP price action, where the cryptocurrency dipped over 30% on Dec 23.

Categories
Crypto Market Analysis

Daily Crypto Review, Dec 31 – Bitcoin Hits a New All-Time High as it Pushes Past $29K

The cryptocurrency sector is stabilizing vastly in the green as Bitcoin pushed above $29,000, creating a new all-time high. Bitcoin is currently trading for $29,001, representing an increase of 4.40% compared to yesterday’s value. Meanwhile, Ethereum’s price has increased by 2.40% on the day, while XRP gained 6.74% of its value.

Daily Crypto Sector Heat Map

Yearn Finance Passive Income gained 759.27% in the past 24 hours, making it the most prominent daily crypto gainer by far. It is followed by DragonVein’s 268.8% and Gala’s 146.76% gain. On the other hand, BitBall lost 63.32%, making it the most prominent daily loser. It is followed by MITH Cash’s loss of 63.25% and Blue Whale Exchange’s loss of 53.96%.

Top 10 24-hour Performers (Click to enlarge)

Bottom 10 24-hour Performers (Click to enlarge)

Bitcoin’s market dominance has moved up half a percent since our last report, with its value currently being 70.6%. This value represents a 0.5% difference to the upside than the value it had when we last reported.

Daily Crypto Market Cap Chart

The cryptocurrency sector capitalization has increased since we last reported, with its current value being $762.78 billion. This represents a $25.47 billion increase when compared to our previous report.

_______________________________________________________________________

What happened in the past 24 hours?

_______________________________________________________________________

_______________________________________________________________________

Technical analysis

_______________________________________________________________________

Bitcoin

Bitcoin has continued its move up on slightly higher volume, breaking its $28,600 resistance level and entering unexplored territory. The push ended with bull exhaustion at the $29,300 mark, creating a new all-time high.

Bitcoin’s price has hit this level twice in a short span of time, creating a double top and propelling BTC slightly backward. Its price is currently trading below $29,000, in a range bound by $28,600 to the downside and $29,300 to the upside.

Even though a move towards $30,000 is quite possible, many analysts have pointed to enormous sell walls at and around this level, making it extremely hard to breakthrough.

 BTC/USD 1-hour chart

Bitcoin’s technicals are showing a strong tilt towards the buy-side. However, its oscillators are tilting towards bearishness due to the overextended move to the upside.

BTC/USD 1-day Technicals

Technical factors (4-hour Chart):

  • Price is above its 50-period EMA and at its 21-period EMA
  • Price is near its middle Bollinger band
  • RSI is neutral (56.57)
  • Volume is slightly above average

Key levels to the upside          Key levels to the downside

1: $28,600                                 1: $28,391

2: $29,000                                 2: $25,512

3: $30,000                                 3: $24,696

Ethereum

Ethereum has sparked by Bitcoin’s push up, tried to break its most immediate resistance level of $747. While the second-largest cryptocurrency by market cap did manage to push through and reach $759 at one point, the bulls were not able to hold this level, which triggered a pullback below $747.

Ethereum is currently trading right below $747, with the 50-hour and 21-period 4-hour moving averages providing it support.

Ethereum is most likely in for a short-term correction as its volume is descending quickly after a failed attempt to tackle the upside.

 ETH/USD 1-hour Chart

Ethereum’s technicals look very much like Bitcoin’s, with the overall tilt being towards the buy-side, with oscillators tilting towards bearishness.

ETH/USD 1-day Technicals

Technical Factors (4-hour Chart):

  • Price is above its 50-period and at its 21-period EMA
  • Price is near its middle Bollinger band
  • RSI is neutral (50.10)
  • Volume is descending from above-average levels

Key levels to the upside          Key levels to the downside

1: $747                                     1: $675

2: $800                                     2: $653

3: $900                                      3: $632

Ripple

XRP gained over 5% on the day due to Bitcoin’s upwards-facing move pulling the market as a whole up. When looking at it from a technical standpoint, XRP managed to win the fight for $0.214, which is certainly a positive thing.

However, more bad news came out to the public, with even more exchanges suspending trading for XRP. Even though many analysts say that XRP is not a security, the sheer pressure that the SEC lawsuit exerts on the project caused almost every exchange and fund to distance themselves from Ripple and XRP, causing its price to crash.

 XRP/USD 1-hour Chart

XRP’s technicals on all time-frames are tilted towards the sell-side, with only the daily overview being completely bearish.

XRP/USD 1-day Technicals

Technical factors (4-hour Chart):

  • Its price is currently at its 50-period EMA and below its 21-period EMA
  • Price is at its middle Bollinger band
  • RSI is in the oversold territory (50.22)
  • Volume is currently on below-average levels

Key levels to the upside          Key levels to the downside

1: $0.25                                    1: $0.214

2: $0.30                                     2: $0.14

3: $0.358


Categories
Crypto Market Analysis

Daily Crypto Review, Dec 30 – Bitcoin Creates a New All-Time High; XRP Recovers Slightly

The cryptocurrency sector is stabilizing after Bitcoin’s failed push towards the upside, which in fact created a new all-time high, but just for a moment. Bitcoin is currently trading for $27,848, representing an increase of 3.41% compared to yesterday’s value. Meanwhile, Ethereum’s price has decreased by 1.22% on the day, while XRP gained 5.71% of its value.

 Daily Crypto Sector Heat Map

EveryCoin gained 371.17% in the past 24 hours, making it the most prominent daily crypto gainer by far. It is followed by Wownero’s 223.09% and Gala’s 167.69% gain. On the other hand, PENTA lost 98.72%, making it the most prominent daily loser. It is followed by AS Roma Fan Token’s loss of 64.83% and Reef’s loss of 64.46%.

Top 10 24-hour Performers (Click to enlarge)

Bottom 10 24-hour Performers (Click to enlarge)

Bitcoin’s market dominance has moved up almost a whole percent since our last report, with its value currently being 70.1%. This value represents a 0.9% difference to the upside than the value it had when we last reported.

Daily Crypto Market Cap Chart

The cryptocurrency sector capitalization has increased since we last reported, with its current value being $737.31billion. This represents an $24.83 billion increase when compared to our previous report.

_______________________________________________________________________

What happened in the past 24 hours?

_______________________________________________________________________

_______________________________________________________________________


Technical analysis

_______________________________________________________________________


Bitcoin

Bitcoin has broken its slight descending consolidation phase by bouncing off of the $26,000 level and pushing towards its all-time high level. While the level got barely broken and Bitcoin set a new all-time high, the bulls were not able to push past the resistance zone with confidence due to the lack of volume and buying pressure.

As a consequence of this, Bitcoin dipped to $27,600 levels, where it is consolidating at the moment. Traders should pay attention to volume movements, as these are the best indication of whether the move will actually break a support/resistance level at the moment.

If Bitcoin fails to break the all-time high level in the short future, we can expect a retracement that could reach the $23,000 zone.


BTC/USD 1-hour chart

Bitcoin’s technicals on the 4-hour and weekly time-frames are completely bullish, while the daily and monthly ones still contain some form of neutrality or bearishness.

BTC/USD 1-day Technicals

Technical factors (4-hour Chart):

  • Price is above its 50-period EMA and at its 21-period EMA
  • Price is near its top Bollinger band
  • RSI is neutral (61.24)
  • Volume is slightly above average

Key levels to the upside          Key levels to the downside

1: $28,391                                 1: $25,512

2: $29,000                                 2: $24,696

3: $30,000                                  3: $24,315

Ethereum

Ethereum has spent the whole day trading right below its immediate resistance level of $747. The second-largest cryptocurrency by market cap tried to break above it twice, but failed both times. Ether is currently descending in price as a consequence of the failed bull attempts which created a double top.

Ethereum traders have to pay attention to Bitcoin’s movements, as its movement (either up or down) will most likely cause Ether’s next move.

ETH/USD 1-hour Chart

Ethereum’s technicals on every time-frame are tilted towards the bull-side. However, they all contain slight neutrality or bearishness alongside the overall tilt towards the buy-side.

ETH/USD 1-day Technicals

Technical Factors (4-hour Chart):

  • Price is above both its 50-period and its 21-period EMA
  • Price is near its middle Bollinger band
  • RSI is neutral (58.07)
  • Volume is trading on above-average levels

Key levels to the upside          Key levels to the downside

1: $747                                     1: $675

2: $800                                     2: $653

3: $900                                      3: $632

Ripple

XRP has spent the day trying to stabilize its price after days of constant price dips. The fourth-largest cryptocurrency by market cap bounced off of the $0.173 level, and propelled itself towards the next zone, sitting at $0.214.

XRP is currently fighting for the $0.214 level, and if no new news (positive or negative) pop out, its short-term price will most likely depend on whether it manages to stay above the $0.214 level or fall below it.

XRP/USD 1-hour Chart

XRP’s technicals on all time-frames are tilted towards the sell-side, with only the 4-hour and monthly overviews showing some form of neutrality.

XRP/USD 1-day Technicals

Technical factors (4-hour Chart):

  • Its price is currently far below both its 50-period EMA and its 21-period EMA
  • Price is between its bottom and middle Bollinger band
  • RSI is in the oversold territory (37.52)
  • Volume has spiked to above-average levels

Key levels to the upside          Key levels to the downside

1: $0.25                                    1: $0.214

2: $0.30                                     2: $0.14

3: $0.358


Categories
Crypto Market Analysis

Daily Crypto Review, Dec 29 – XRP Trading Suspended by Coinbase and OKEx, Causing a 22% Price Dip

The cryptocurrency sector had is currently in a consolidation phase as Bitcoin fell below $27,000. Bitcoin is currently trading for $26,624, representing a decrease of 1.13% compared to yesterday’s value. Meanwhile, Ethereum’s price has decreased by 2.56% on the day, while XRP had another major dip, losing 19.42% of its value.

 Daily Crypto Sector Heat Map

Ethereum Lightning gained 1097.36% in the past 24 hours, making it the most prominent daily crypto gainer by far. It is followed by N3RD Finance’s 94.18% and Matrix AI Network’s 86.08% gain. On the other hand, COVER Protocol lost 97.97%, making it the most prominent daily loser. It is followed by Encryptgen’s loss of 91.18% and Mining Core Coin’s loss of 69.41%.

Top 10 24-hour Performers (Click to enlarge)

Bottom 10 24-hour Performers (Click to enlarge)

Bitcoin’s market dominance has moved up slightly since our last report, with its value currently being 69.2%. This value represents a 0.1% difference to the upside than the value it had when we last reported.

Daily Crypto Market Cap Chart

The cryptocurrency sector capitalization has decreased slightly since we last reported, with its current value being $712.73 billion. This represents an $8.45 billion decrease when compared to our previous report.

_______________________________________________________________________

What happened in the past 24 hours?

_______________________________________________________________________

_______________________________________________________________________

Technical analysis

_______________________________________________________________________

Bitcoin

Ever since it hit the $28,391 all-time high, Bitcoin has been trading in a sideways manner. Its price is currently within a large channel, bound by $25,512 to the downside and the aforementioned all-time high to the upside.

The descending volume alongside sideways trading was never a long-term occurrence with Bitcoin, but rather good indicators of a new explosive move ahead.

Bitcoin traders should be mindful of any volume spikes when trading, and should look for smaller time-frame Fib retracements if they want to be more precise with setting their support and resistance levels.

BTC/USD 1-hour chart

Bitcoin’s technicals on both short-term and long-term time-frames are completely bullish and show close to no signs of neutrality or bearishness.

BTC/USD 1-day Technicals

Technical factors (4-hour Chart):
  • Price is above its 50-period EMA and at its 21-period EMA
  • Price is at its middle Bollinger band
  • RSI is neutral (55.72)
  • Volume is slightly above average, but descending
Key levels to the upside          Key levels to the downside

1: $28,391                                 1: $25,512

2: $29,000                                 2: $24,696

3: $30,000                                  3: $24,315

Ethereum

Ethereum’s move towards the upside ended at $747, prompting a pullback. However, while many analysts believed that Ether would not keep its price above $700, that’s exactly what happened.

Ethereum’s signature trading move has occurred once again, with that move being: pushing up, then pulling back, and breaking the 21-hour moving average to the downside, only to find support at the 50-hour moving average and push back up. Knowing how Ethereum moves alongside watching Bitcoin’s moves is one of the safest ways to trade cryptocurrencies at the moment, as the moves have pre-determined stop-losses and targets.


ETH/USD 1-hour Chart

Ethereum’s shorter time-frames are completely bullish and show no signs of neutrality or bearishness, while its longer-time frames have some neutrality present alongside the overall bullishness.

ETH/USD 1-day Technicals

Technical Factors (4-hour Chart):
  • Price is above both its 50-period and its 21-period EMA
  • Price is above its middle Bollinger band
  • RSI is neutral (59.39)
  • Volume is trading on above-average levels
Key levels to the upside          Key levels to the downside

1: $747                                     1: $675

2: $800                                     2: $653 

3: $900                                      3: $632

Ripple

XRP has experienced another extremely bad day, as its price dropped more than 22% on the day. The move came as a result of two major exchanges, OKEx and Coinbase, dropping support for XRP due to the pending lawsuit against its company, Ripple, as well as Ripple’s executives.

Trading XRP is extremely risky at the moment due to price fluctuations that are a result of news rather than technical formations.

XRP/USD 1-hour Chart

XRP’s technicals on all time-frames are tilted towards the sell-side, with all of them showing slight signs of neutrality.

XRP/USD 1-day Technicals

Technical factors (4-hour Chart):
  • Its price is currently far below both its 50-period EMA and its 21-period EMA
  • Price is at its bottom Bollinger band
  • RSI is in the oversold territory (28.88)
  • Volume has spiked to above-average levels
Key levels to the upside          Key levels to the downside

1: $0.25                                    1: $0.214

2: $0.30                                     2: $0.14

3: $0.358 

Categories
Crypto Market Analysis

Daily Crypto Review, Dec 28 – Ethereum Breaks $700; Bitcoin at $30k?

The cryptocurrency sector had an incredible weekend as Bitcoin skyrocketed towards $28,000. Bitcoin is currently trading for $27,031, representing a decrease of 2.91% compared to yesterday’s value, but a massive increase compared to its value on Friday. Meanwhile, Ethereum’s price has increased by 12.79% on the day, while XRP managed to lose 4.05%.

 Daily Crypto Sector Heat Map

EncrypGen gained 2787.56% in the past 24 hours, making it the most prominent daily crypto gainer by far. It is followed by Bankacoin’s 212.44% and Trabzonspor Fan Token’s 178.8% gain. On the other hand, CEZO lost 89.89%, making it the most prominent daily loser. It is followed by JD Coin’s loss of 64.79% and Triumph X’s loss of 57.74%.

Top 10 24-hour Performers (Click to enlarge)

Bottom 10 24-hour Performers (Click to enlarge)

Bitcoin’s market dominance has moved down slightly since our last report, with its value currently being 69.1%. This value represents a 0.25% difference to the downside than the value it had when we last reported.

Daily Crypto Market Cap Chart

The cryptocurrency sector capitalization has increased over $100 billion since we last reported, with its current value being $721.10 billion. This represents a $101.89 billion increase when compared to our previous report.

_______________________________________________________________________

What happened in the past 24 hours?

_______________________________________________________________________

_______________________________________________________________________

Technical analysis

_______________________________________________________________________

Bitcoin

Bitcoin did not sleep this weekend as it took its time to push towards new all-time highs. The best-known cryptocurrency pushed towards the upside, reaching as high as $28,391 at one point. It is now consolidating around the $27,000 level and preparing for the next move.

Our Fib extensions drawn on Friday worked exactly as expected, with Bitcoin respecting every single one of them. With all of them still being a valid choice, traders should either look for a bounce off the immediate support levels or increased volume followed by a sharp increase in price. Trading Bitcoin’s pullbacks is not exactly the best option at the moment.

BTC/USD 4-hour chart

While Bitcoin’s 4-hour and weekly technicals show a full tilt towards the buy-side, its daily and monthly technicals show some neutrality signs.

BTC/USD 1-day Technicals

Technical factors (4-hour Chart):
  • Price is above its 50-period EMA and slightly above its 21-period EMA
  • Price is slightly above its middle Bollinger band
  • RSI is neutral (62.10)
  • Volume is slightly above average
Key levels to the upside          Key levels to the downside

1: $28,391                                 1: $25,512

2: $29,000                                 2: $24,696

3: $30,000                                  3: $24,315

Ethereum

While Ethereum did manage to score some gains over the weekend, its upside got overshadowed by Bitcoin’s growth. However, the second-largest cryptocurrency by market cap has decided to make that up by suddenly pushing from $624 all the way up to $738. While the move seemingly ended here, it is not yet certain whether the price will break the level or go even higher, or start its consolidation at slightly lower levels.

Traders should utilize the volume indicator, order books, and well-established support/resistance levels to its fullest to catch these explosive trades while remaining safe.

ETH/USD 4-hour Chart

Ethereum’s shorter time-frames are completely bullish, while its longer-time frames show slight neutrality signs.

ETH/USD 1-day Technicals

Technical Factors (4-hour Chart):
  • Price is far above both its 50-period and its 21-period EMA
  • Price is at its top Bollinger band
  • RSI has stepped into the overbought territory (71.68)
  • Volume is trading on above-average levels
Key levels to the upside          Key levels to the downside

1: $738                                     1: $675

2: $800                                     2: $632 

3: $900                                      3: $600

Ripple

XRP has been trading on low volume and slowly descending after a brief rally to $0.385. The fourth-largest cryptocurrency keeps getting crushed by various companies dropping support or liquidating their XRP positions after Ripple and its executives got sued by the SEC.

XRP traders should (more than anything) pay attention to the news. However, there are many other cryptocurrencies with much safer and potentially more profitable trading setups at the moment.

XRP/USD 4-hour Chart

XRP’s technicals on all time-frames slightly tilted towards the sell-side, but they all show some signs of uncertainty.

XRP/USD 1-day Technicals

Technical factors (4-hour Chart):
  • Its price is currently far below its 50-period EMA and slightly below its 21-period EMA
  • Price slightly below its middle Bollinger band
  • RSI has left the oversold territory (37.46)
  • Volume is returning to average levels
Key levels to the upside          Key levels to the downside

1: $0.30                                    1: $0.25

2: $0.358                                   2: $0.214

3: $0.475 

Categories
Crypto Market Analysis

Daily Crypto Review, Dec 24 – XRP Downturn Pulls the Crypto Sector in the Red

The cryptocurrency sector reacted to XRP getting crushed by the market and ended up mostly in the red. Bitcoin is currently trading for $23,112, representing a decrease of 1.97% when compared to yesterday’s value. Meanwhile, Ethereum’s price has decreased by 6.27% on the day, while XRP managed to lose a whopping 30.85%.

 Daily Crypto Sector Heat Map

Folgory Coin gained 5571.49% in the past 24 hours, making it the most prominent daily crypto gainer by far. It is followed by MINDOL’s 1224.26% and DACC’s 1070.44% gain. On the other hand, 3x Long XRP Token lost 77.00%, making it the most prominent daily loser. It is followed by B21 Invest’s loss of 74.30% and YFPRO Finance’s loss of 70.96%.

Top 10 24-hour Performers (Click to enlarge)

Bottom 10 24-hour Performers (Click to enlarge)

Bitcoin’s market dominance has moved up over one percent since our last report, with its value currently being 69.3%. This value represents a 1.5% difference to the upside than the value it had when we last reported.

Daily Crypto Market Cap Chart

The cryptocurrency sector capitalization has decreased significantly since we last reported, with its current value being $619.31 billion. This represents a $22.90 billion decrease when compared to our previous report.

_______________________________________________________________________

What happened in the past 24 hours?

_______________________________________________________________________

_______________________________________________________________________

Technical analysis

_______________________________________________________________________

Bitcoin

Bitcoin was one of the few cryptocurrencies not affected by the major downturn of XRP after the SEC announced a lawsuit against Ripple and its executives. The largest cryptocurrency by market cap stayed within its wide range and continued trading sideways after bouncing back from the $24,000 level.

Traders currently have the option to catch a couple of safe trades within the trading range Bitcoin is in, or wait for it to spike in volume and break the range (either to the downside or upside).

BTC/USD 4-hour chart

While Bitcoin’s daily and weekly technicals are slightly tilted towards the bull side, its 4-hour and monthly technicals show some hints of neutrality alongside the bullishness.

BTC/USD 1-day Technicals

Technical factors (4-hour Chart):
  • Price is above its 50-period EMA and at its 21-period EMA
  • Price at its middle Bollinger band
  • RSI is neutral (53.57)
  • Volume is slightly above average
Key levels to the upside          Key levels to the downside

1: $24,315                                 1: $22,054

2: $24,700                                 2: $21,350

3: $25,511                                  3: $19,918

Ethereum

Unlike Bitcoin, Ethereum got affected by XRP’s downturn, which pulled it back over 5% on the day. The second-largest cryptocurrency fell below its $600 support level, and caused a quick panic-sell which brought its price as low as $550 (though just for a moment). Ether is now fighting to stay above the $581 level, which it will most likely succeed.

Many analysts are calling for a double bottom and are expecting an upswing from Ethereum. Traders should pay close attention to Ether’s volume and (possibly) order books.

ETH/USD 4-hour Chart

Ethereum’s weekly and monthly technicals are completely bullish, while its 4-hour and daily overview are mainly tilted towards the sell-side, but show some signs of uncertainty.

ETH/USD 1-day Technicals

Technical Factors (4-hour Chart):
  • Price is below both its 50-period and its 21-period EMA
  • Price is close to its bottom Bollinger band
  • RSI is neutral (37.44)
  • Volume is on slightly above-average levels
Key levels to the upside          Key levels to the downside

1: $600                                     1: $581

2: $632                                     2: $564 

3: $675                                      3: $545

Ripple

XRP got crushed as more bad news came. The fourth-largest cryptocurrency by market cap got dropped by various exchanges, as well as its positions fully liquidated by major funds such as Bitwise. Its price dipped over 65% in just 5 days. However, XRP seems to have found support in (first) the $0.214 and (later) $0.25 levels.

XRP will most likely try to either hold its price level or push slightly towards the upside. While its further downside potential is not very high (unless more bad news comes out), buying or longing XRP is extremely risky.

XRP/USD 4-hour Chart

XRP’s technicals on all time-frames are completely tilted towards the sell-side.

XRP/USD 1-day Technicals

Technical factors (4-hour Chart):
  • Its price is currently far below both its 50-period EMA and its 21-period EMA
  • Price slightly above its bottom Bollinger band
  • RSI is in the oversold territory (19.40)
  • Volume is on extremely high levels
Key levels to the upside          Key levels to the downside

1: $0.30                                    1: $0.25

2: $0.358                                   2: $0.214

3: $0.475 

Categories
Crypto Market Analysis

Daily Crypto Review, Dec 23 – Is This the End of XRP? SEC Officially Files Lawsuit Against Ripple and its Executives

The cryptocurrency sector was mostly neutral as Bitcoin gained even more market dominance. Bitcoin is currently trading for $23.498, representing an increase of 3.53% when compared to yesterday’s value. Meanwhile, Ethereum’s price has increased by 1.28% on the day, while XRP managed to lose a whopping 23.99%.

 Daily Crypto Sector Heat Map

SYNC Network gained 97.23% in the past 24 hours, making it the most prominent daily crypto gainer by far. It is followed by 3x Short XRP Token’s 84.56% and Basis Share’s 77.1% gain. On the other hand, DMme lost 85.99%, making it the most prominent daily loser. It is followed by 3x Long XRP Token’s loss of 66.89% and S4FE’s loss of 60.04%.

Top 10 24-hour Performers (Click to enlarge)

Bottom 10 24-hour Performers (Click to enlarge)

Bitcoin’s market dominance has moved up over one percent since our last report, with its value currently being 67.8%. This value represents a 1.2% difference to the downside than the value it had when we last reported.

Daily Crypto Market Cap Chart

The cryptocurrency sector capitalization has increased since we last reported, with its current value being $642.21 billion. This represents a $9.69 billion increase when compared to our previous report.

_______________________________________________________________________

What happened in the past 24 hours?

_______________________________________________________________________

_______________________________________________________________________

Technical analysis

_______________________________________________________________________

Bitcoin

Bitcoin continued trading within a decently large range, bound by $22,054 to the downside and $24,315 to the upside. The largest cryptocurrency by market cap managed to gain a couple of percent on its price today, as most of the market consolidated. Therefore, Bitcoin market dominance has risen once again, almost reaching 70%.

Bitcoin’s descending volume and sideways trading were always a sign of a new move in the making. However, as the current trading range is quite wide, the sharp move to either side might not be so imminent.

BTC/USD 4-hour chart

While Bitcoin’s daily and weekly technicals are tilted towards the bull side, its 4-hour and monthly overviews are slightly bullish, but show some hints of neutrality.

BTC/USD 1-day Technicals

Technical factors (4-hour Chart):
  • Price is above its 50-period EMA and slightly above its 21-period EMA
  • Price near its middle Bollinger band
  • RSI is neutral (56.31)
  • Volume is slightly above average
Key levels to the upside          Key levels to the downside

1: $24,315                                 1: $22,054

2: $24,700                                 2: $21,350

3: $25,511                                  3: $19,918

Ethereum

Ethereum has followed Bitcoin to the upside and gained just enough traction to attempt a $632 level break, but not enough to actually break it. This triggered a small correction, which brought it to the middle of the range, bound by $600-$602 to the downside and $632 to the upside.

Ethereum’s price movements are (in the past couple of days) either an exact copy of Bitcoin’s moves, or an exaggerated move in the same direction. Traders could possibly use this to trade Ether’s exaggerated moves by watching Bitcoin’s movement.

ETH/USD 4-hour Chart

Ethereum’s daily, weekly, and monthly technicals are completely bullish, while its 4-hour overview is tilted towards the sell-side.

ETH/USD 1-day Technicals

Technical Factors (4-hour Chart):
  • Price is slightly below both its 50-period and its 21-period EMA
  • Price is close to its middle Bollinger band
  • RSI is neutral (44.94)
  • Volume is on slightly above-average levels
Key levels to the upside          Key levels to the downside

1: $632                                     1: $600

2: $675                                     2: $581 

3: $738.5                                   3: $564

Ripple

XRP got crushed today on horrible news of SEC officially filing a lawsuit against its company Ripple as well as against its cofounders. While MoneyGram took a lenient position and didn’t want to make any negative comments, most crypto exchanges are planning on delisting XRP due to concerns regarding regulation.

While some may think that short-selling XRP is a good idea, watch out for slippage and insufficient demand.

XRP/USD 4-hour Chart

XRP’s short-term technicals show a heavy tilt towards the sell-side, while its long-term technicals (weekly and monthly) remain bullish.

XRP/USD 1-day Technicals

Technical factors (4-hour Chart):
  • Its price is currently far below both its 50-period EMA and its 21-period EMA
  • Price slightly below its bottom Bollinger band
  • RSI is in the oversold territory (18.53)
  • Volume is on extremely high levels
Key levels to the upside          Key levels to the downside

1: $0.40                                    1: $0.33

2: $0.475                                   2: $0.297

3: $0.481 

Categories
Crypto Market Analysis

Daily Crypto Review, Dec 22 – XRP Plummets on News of SEC Suing Ripple; Crypto Sector in the Red

The cryptocurrency sector bounced back from its recent highs as the news of a new COVID-19 strain came out. Bitcoin is currently trading for $22,716, representing a decrease of 5.01% when compared to yesterday’s value. Meanwhile, Ethereum’s price has decreased by 5.41% on the day, while XRP managed to lose a whopping 16.97%.

 Daily Crypto Sector Heat Map

P2P gained 185.24% in the past 24 hours, making it the most prominent daily crypto gainer by far. It is followed by DMme’s 123.95% and Actinium’s 96.18% gain. On the other hand, Wownero lost 54.05%, making it the most prominent daily loser. It is followed by Tap’s loss of 47.05% and Super Bitcoin’s loss of 46.31%.

Top 10 24-hour Performers (Click to enlarge)

Bottom 10 24-hour Performers (Click to enlarge)

Bitcoin’s market dominance has moved up over one percent since our last report, with its value currently being 66.6%. This value represents a 1.4% difference to the downside than the value it had when we last reported.

Daily Crypto Market Cap Chart

The cryptocurrency sector capitalization has decreased significantly since we last reported, with its current value being $632.90 billion. This represents a $36.72 billion decrease when compared to our previous report.

_______________________________________________________________________

What happened in the past 24 hours?

_______________________________________________________________________

_______________________________________________________________________

Technical analysis

_______________________________________________________________________

Bitcoin

Bitcoin experienced a 5% pullback after the news of a new strain of COVID-19 came out. Of course, Bitcoin was not the only one hit, as all traditional asset classes dipped in the past 24 hours as well. The downturn got stopped at the $22,054 level, and quickly sprung up to the current levels.

As mentioned in our previous daily crypto review, Bitcoin would experience an increase in volume as it exits consolidation below the recent highs, which happened today.

BTC/USD 4-hour chart

While Bitcoin’s daily technicals are tilted towards the bull side, its 4-hour overview is completely neutral. On the other hand, its weekly and monthly overviews are tilted towards the buy-side, but show hints of neutrality.

BTC/USD 1-day Technicals

Technical factors (4-hour Chart):
  • Price is above its 50-period EMA and below its 21-period EMA
  • Price between its bottom and middle Bollinger band
  • RSI is neutral (48.91)
  • Volume is slightly above average
Key levels to the upside          Key levels to the downside

1: $24,315                                 1: $22,054

2: $24,700                                 2: $21,350

3: $25,511                                  3: $19,918

Ethereum

Ethereum has followed Bitcoin to the downside, and lost just over 5% on the day. The second-largest cryptocurrency by market cap fell below the $632 level and attempted to break the $600-$602 support line. However, ETH bulls stopped the downturn, and the cryptocurrency is now consolidating right above this level.

Ethereum’s price movements are pretty tame so far, and traders should pay close attention to Bitcoin and its movement in the near future as Ether seems to follow it almost to the tee.

ETH/USD 4-hour Chart

Ethereum’s daily, weekly and monthly technicals show a strong bullish tilt, while its 4-hour overview is tilted towards the sell-side.

ETH/USD 1-day Technicals

Technical Factors (4-hour Chart):
  • Price is below both its 50-period and its 21-period EMA
  • Price is close to its bottom Bollinger band
  • RSI is heading towards being oversold (37.52)
  • Volume is on slightly above-average levels
Key levels to the upside          Key levels to the downside

1: $632                                     1: $600

2: $675                                     2: $581 

3: $738.5                                   3: $564

Ripple

XRP had a horrible 24 hour trading session as its price crashed on Ripple’s announcement that they will most likely get sued by the SEC. This news brought its price down almost 20%, with it currently trading right above the $0.457 level, which stopped XRP from going down further.

XRP traders should pay attention to further updates on the lawsuit news as well as to any volume increase the cryptocurrency experiences.

XRP/USD 4-hour Chart

XRP’s long-term technicals (weekly and monthly) show a slight tilt towards the buy-side, while its short-term technicals (4-hour and daily) are completely bearish.

XRP/USD 1-day Technicals

Technical factors (4-hour Chart):
  • Its price is currently far below both its 50-period EMA and its 21-period EMA
  • Price slightly below its bottom Bollinger band
  • RSI is in the oversold territory (25.83)
  • Volume has returned to average levels
Key levels to the upside          Key levels to the downside

1: $0.5                                      1: $0.475

2: $0.543                                   2: $457

3: $0.57                                    3: $45

Categories
Crypto Market Analysis

Daily Crypto Review, Dec 21 – Bitcoin Dangerously Close to Making a Sharp Move

The cryptocurrency sector is split between gainers and losers as Bitcoin consolidates right below its all-time high level. Bitcoin is currently trading for $23,825, representing an increase of 1.03% when compared to yesterday’s value. Meanwhile, Ethereum’s price has decreased by 1.42% on the day, while XRP managed to lose 3.20%.

 Daily Crypto Sector Heat Map

Axion gained 3402.38% in the past 24 hours, making it the most prominent daily crypto gainer by far. It is followed by MahaDAO’s 199.69% and Elxis’ 186.79% gain. On the other hand, Golden Ratio Per Liquidity lost 59.64%, making it the most prominent daily loser. It is followed by ALL BEST ICO’s loss of 50.84% and Quras’s loss of 49.42%.

Top 10 24-hour Performers (Click to enlarge)

Bottom 10 24-hour Performers (Click to enlarge)

Bitcoin’s market dominance has moved down almost half a percent since our last report, with its value currently being 65.1%. This value represents a 0.4% difference to the downside than the value it had when we last reported.

Daily Crypto Market Cap Chart

The cryptocurrency sector capitalization has increased since we last reported, with its current value being $669.26 billion. This represents an $18.25billion increase when compared to our previous report.

_______________________________________________________________________

What happened in the past 24 hours?

_______________________________________________________________________

_______________________________________________________________________

Technical analysis

_______________________________________________________________________

Bitcoin

Bitcoin has spent its weekend slowly rising towards the resistance level of its trading channel, which is bound by $22,055 to the downside and $24,315 to the upside. However, The two attempts to break the resistance level and enter the price discovery phase failed, leaving Bitcoin just below $24,315. With volume descending ever since Dec 17, we might expect this consolidation to end with a volume boom and a very sharp move.

While it is yet unknown whether this sharp move will be to the upside or downside, the increase in volume and a strong push towards one side will make it quite clear. Traders can use this momentum to catch a very safe trade.


BTC/USD 2-hour chart

While Bitcoin’s technicals are overall bullish, they either show signs of neutrality or even hints of bearishness. Its daily and monthly overviews have some indications of sellers being present, while its 4-hour and weekly overviews are bullish-neutral.

BTC/USD 1-day Technicals

Technical factors (4-hour Chart):
  • Price is far above both its 50-period and its 21-period EMA
  • Price slightly below its top Bollinger band
  • RSI is close to being overbought (65.90)
  • Volume is decreasing, and trading below the average level
Key levels to the upside          Key levels to the downside

1: $24,315                                 1: $22,054

2: $24,700                                 2: $21,350

3: $25,511                                  3: $19,918

Ethereum

Ethereum has, unlike Bitcoin, descended slowly within its trading range, which is bound by $675 to the upside and $632. The second-largest cryptocurrency by market cap had one strong push towards the downside, which brought its price all the way down to $620 on Dec 20. However, the bulls prevailed, and Ether is now trading above $632 safely.

Ethereum’s price movements seem pretty tame, meaning that its next move will be of larger magnitude. Traders should pay close attention to Bitcoin and its moves in the near future before trading any other cryptocurrency, including Ether.

ETH/USD 2-hour Chart

Ethereum’s technicals are very bullish on all time-frames, with only its weekly overview showing slight neutrality.

ETH/USD 1-day Technicals

Technical Factors (4-hour Chart):
  • Price is far above its 50-period and at its 21-period EMA
  • Price is slightly below its bottom Bollinger band
  • RSI is neutral (52.43)
  • Volume is on slightly above-average levels
Key levels to the upside          Key levels to the downside

1: $675                                     1: $632

2: $738.5                                  2: $600 

3: $817.5                                   3: $581

Ripple

With XRP’s strong push towards the upside ending on Dec 17, the fourth-largest cryptocurrency by market cap has entered another descending channel. The price was slowly dwindling down over the weekend, breaking the $0.57 support level, and then confirming its position below it. The price even went below the $0.543 support at one point, but quickly recovered.

XRP’s volume is currently almost non-existent, and traders should pay attention to any volume spikes if they intend on trading XRP.

XRP/USD 2-hour Chart

XRP’s technicals are quite mixed, but overall tilted slightly towards the buy-side. It’s 4-hour and daily overviews are bullish-neutral, while its weekly overview shows some hints of bearishness. Its monthly overview, however, is completely bullish.

XRP/USD 1-day Technicals

Technical factors (4-hour Chart):
  • Its price is currently between its 50-period EMA and its 21-period EMA
  • Price slightly above its bottom Bollinger band
  • RSI is neutral (48.77)
  • Volume has descended to average levels
Key levels to the upside          Key levels to the downside

1: $0.57                                    1: $0.543

2: $0.597                                   2: $0.5

3: $0.63                                    3: $0.475

Categories
Crypto Market Analysis

Daily Crypto Review, Dec 18 – Bitcoin at $23,000; Crypto Sector Preparing for the Next Move

The majority of the cryptocurrencies ended up in the green as the cryptocurrency sector tried to consolidate after Bitcoin’s price discovery in the all-time high territory. Bitcoin is currently trading for $22.912, representing an increase of 3.96% compared to yesterday’s value. Meanwhile, Ethereum’s price has increased by 0.16% on the day, while XRP managed to gain 3.79%.

 Daily Crypto Sector Heat Map

MobileGo gained 94.96% in the past 24 hours, making it the most prominent daily crypto gainer by far. It is followed by Puriever’s 85.99% and Tokes’ 85.09% gain. On the other hand, Basis Share lost 49.6%, making it the most prominent daily loser. It is followed by 3x Short Litecoin Token’s loss of 46.73% and Force For Fast’s loss of 42.92%.

Top 10 24-hour Performers (Click to enlarge)

Bottom 10 24-hour Performers (Click to enlarge)

Bitcoin’s market dominance has moved up half a percent since our last report, with its value currently being 65.5%. This value represents a 0.5% difference to the upside than the value it had when we last reported.

Daily Crypto Market Cap Chart

The cryptocurrency sector capitalization has increased since we last reported, with its current value being $651.01 billion. This represents a $17.07 billion increase when compared to our previous report.

_______________________________________________________________________

What happened in the past 24 hours?

_______________________________________________________________________

_______________________________________________________________________

Technical analysis

_______________________________________________________________________

Bitcoin

Bitcoin has stopped its price discovery phase as it bounced off the $24,000 level and began consolidating. The largest cryptocurrency by market cap is currently fighting for the $23,000 level, a minor pivot point within a larger range bound by $24,000 to the upside and $22,050 to the downside.

At the moment, the Fib extension sitting at $22,055 is the most likely strong support level, while Bitcoin’s upside is open to new highs if the cryptocurrency passes $24,000, $23,315, and $24,500.

BTC/USD 2-hour chart

Bitcoin’s 4-hour and weekly overview are fully bullish, while its daily and monthly time-frames show slight neutrality on top of the overall bullishness.

BTC/USD 1-day Technicals

Technical factors (4-hour Chart):
  • Price is far above both its 50-period and its 21-period EMA
  • Price slightly below its top Bollinger band
  • RSI is heavily overbought (80.71)
  • Volume is far higher than its average levels
Key levels to the upside          Key levels to the downside

1: $24,315                                 1: $22,054

2: $24,700                                 2: $21,350

3: $25,511                                  3: $19,918

Ethereum

Ethereum has, just like Bitcoin, hit a wall in its price ascension, triggering a pullback from the highs of $675. The second-largest cryptocurrency by market cap quickly fell to its immediate support level, which sits at $632. This level held up nicely, and Ethereum is now on a slow rise after confirming the support level.

An important thing to note is that Ethereum is very far from reaching its all-time high. It might be a good value investment simply because of its potential to increase its price faster than Bitcoin.

ETH/USD 2-hour Chart

Ethereum’s 4-hour and monthly overview are fully bullish, while its daily and weekly time-frames show slight neutrality on top of the overall bullishness.

ETH/USD 1-day Technicals

Technical Factors (4-hour Chart):
  • Price is far above both its 50-period and its 21-period EMAs
  • Price is between its middle and top Bollinger band
  • RSI has barely left the overbought territory (67.29)
  • Volume is much higher than its weekly average but is descending
Key levels to the upside          Key levels to the downside

1: $675                                     1: $632

2: $738.5                                  2: $600 

3: $817.5                                   3: $581

Ripple

XRP was the cryptocurrency that experienced the largest gains out of the three cryptocurrencies we cover daily. The fourth-largest cryptocurrency by market cap couldn’t break a high of $0.597 with conviction (though the price briefly went as high as $0.656), which triggered a correction to its $0.57 support level. After confirming this level as strong support, XRP continued its path towards the upside and slowly started increasing in price. It is currently contesting the $0.597 level once again.


XRP/USD 2-hour Chart

XRP’s 4-hour and monthly overview are fully bullish, while its daily and weekly time-frames show slight neutrality on top of the overall bullishness.

XRP/USD 1-day Technicals

Technical factors (4-hour Chart):
  • Its price is currently above both its 50-period EMA and its 21-period EMA
  • Price slightly below its top Bollinger band
  • RSI is nearing the overbought territory (63.71)
  • Volume is well above its average level, thought descending
Key levels to the upside          Key levels to the downside

1: $0.597                                    1: $0.57

2: $0.63                                    2: $0.543

3: $0.66                                     3: $0.5

Categories
Crypto Market Analysis

Daily Crypto Review, Dec 17 – BTC Reaches a New ATH at $22k; XRP Skyrockets as it Breaks its Descending Channel

The cryptocurrency sector experienced an overall major gain as Bitcoin reached its new all-time high. Bitcoin is currently trading for $22.095, representing an increase of 13.82% compared to yesterday’s value. Meanwhile, Ethereum’s price has increased by 9.69% on the day, while XRP managed to gain a whopping 23.35%.

 Daily Crypto Sector Heat Map

Puriever gained 238.59% in the past 24 hours, making it the most prominent daily crypto gainer by far. It is followed by Combine.finance’s 159.58% and Amun Bitcoin 3x Daily Shorts’ 146.94% gain. On the other hand, BigGame lost 82.62%, making it the most prominent daily loser. It is followed by GNY’s loss of 75,95% and Hush’s loss of 61.30%.

Top 10 24-hour Performers (Click to enlarge)

Bottom 10 24-hour Performers (Click to enlarge)

Bitcoin’s market dominance has moved up over a whole percent since our last report, with its value currently being 65%. This value represents a 1.1% difference to the upside than the value it had when we last reported.

Daily Crypto Market Cap Chart

The cryptocurrency sector capitalization has increased drastically since we last reported, with its current value being $634.94 billion. This represents a whopping $70.94 billion increase when compared to our previous report.

_______________________________________________________________________

What happened in the past 24 hours?

_______________________________________________________________________

_______________________________________________________________________

Technical analysis

_______________________________________________________________________

Bitcoin

Bitcoin has had quite an amazing day, as its price skyrocketed to new all-time highs. The largest cryptocurrency by market cap reached price discovery mode as its price topped at $22,400. While there are no set resistance levels at the moment, we can use Fib retracement extensions to determine where they could form.

At the moment, the Fib extensions sitting at $21,350 and $22,055 are the best contenders to act as support levels to Bitcoin’s eventual downturn.


BTC/USD 4-hour chart

Bitcoin’s daily and weekly overview are fully bullish, while its 4-hour and monthly time-frames show slight neutrality on top of the overall bullishness.

BTC/USD 1-day Technicals

Technical factors (4-hour Chart):
  • Price is far above both its 50-period and its 21-period EMA
  • Price slightly above its top Bollinger band
  • RSI is heavily overbought (86.76)
  • Volume is far higher than its average levels
Key levels to the upside          Key levels to the downside

1: $24,315                                 1: $22,054

2: $24,700                                 2: $21,350

3: $25,511                                  3: $19,918

Ethereum

Ethereum followed the extremely bullish sentiment caused by Bitcoin’s push, reaching a price of $625 before hitting a sell wall. The second-largest cryptocurrency by market cap has held these levels, and is currently consolidating above the $632 level.

An important thing to note is that, while Bitcoin has reached its ATH, Ethereum is very far from it. Ethereum might be a good value investment simply due to its potential to possibly reach towards higher levels on account of pushing towards its ATH.

ETH/USD 4-hour Chart

While Ethereum shows overall bullish sentiment on all time-frames, every time-frame except the monthly time-frame shows slight neutrality.

ETH/USD 1-day Technicals

Technical Factors (4-hour Chart):
  • Price is far above both its 50-period and its 21-period EMAs
  • Price is at its top Bollinger band
  • RSI is heavily overbought (78.20)
  • Volume is much higher than its weekly average
Key levels to the upside          Key levels to the downside

1: $675                                     1: $636.5

2: $738.5                                  2: $632 

3: $817.5                                   3: $600

Ripple

Unlike most days where XRP is having larger moves to the downside and smaller moves to the upside compared to BTC and ETH, the roles are reversed this time. The fourth-largest cryptocurrency by market cap has gained almost 25% on the day as its price bounced off of the lower line of the descending channel, and pushed towards the upside, reaching as high as $0.583 before starting its consolidation.

XRP is now trading within a range, bound by the $0.57 resistance and $0.543 support levels.


XRP/USD 4-hour Chart

XRP has changed its sentiment to overall bullishness, with its monthly time-frame showing full tilt towards the buy-side, and the rest of the time-frames showing some neutrality or hints of bearishness remaining.

XRP/USD 1-day Technicals

Technical factors (4-hour Chart):
  • Its price is currently above both its 50-period EMA and its 21-period EMA
  • Price slightly below its top Bollinger band
  • RSI is nearing the overbought territory (61.30)
  • Volume is well above its average level
Key levels to the upside          Key levels to the downside

1: $0.57                                     1: $0.543

2: $0.597                                    2: $0.5

3: $0.63                                     3: $0.475

Categories
Crypto Market Analysis

Daily Crypto Review, Dec 16 – XRP Getting Crushed; BTC and ETH Stuck within a Range

The cryptocurrency sector was mostly stable today as Bitcoin kept within its trading range. Bitcoin is currently trading for $19,393, representing an increase of 1.13% compared to yesterday’s value. Meanwhile, Ethereum’s price has increased by 0.10% on the day, while XRP managed to lose a whopping 8.56%.

 Daily Crypto Sector Heat Map

XcelToken Plus gained 263.82% in the past 24 hours, making it the most prominent daily crypto gainer by far. It is followed by Amun Bitcoin 3x Daily Long’s 161.53% and rbase.finance’s 129.84% gain. On the other hand, Maximine Coin lost 99.42%, making it the most prominent daily loser. It is followed by STEM CELL COIN’s loss of 97.69% and Patron’s loss of 89.45%.

Top 10 24-hour Performers (Click to enlarge)

Bottom 10 24-hour Performers (Click to enlarge)

Bitcoin’s market dominance has moved up since our last report, with its value currently being 63.9%. This value represents a 0.4% difference to the upside than the value it had when we last reported.

Daily Crypto Market Cap Chart

The cryptocurrency sector capitalization has decreased slightly since we last reported, with its current value being $564.0 billion. This represents a $4.20 billion decrease when compared to our previous report.

_______________________________________________________________________

What happened in the past 24 hours?

_______________________________________________________________________

_______________________________________________________________________

Technical analysis

_______________________________________________________________________

Bitcoin

Bitcoin has continued trading within a range between $19,100 and $19,570, possibly hitting a wall of profit-taking institutional traders. Despite the overall bullishness of the market, the largest cryptocurrency by market cap failed to break the $19,666 level or even reach it. This is because of the increasing number of BTC Whales (holders of 10,000 to 100,000 Bitcoin) leaving the market and taking profit as the price approaches the $20,000 mark.

The sheer amount of resistance hovering above $19,500 will make it quite hard for Bitcoin bulls to push towards the all-time highs. In case the aforementioned push doesn’t happen, we can expect a possible dip towards $18,000.

BTC/USD 4-hour chart

Bitcoin’s overview on all time-frames is bullish, with its weekly time-frame being the only one completely bullish. The rest of the time-frames are slightly tilted to the neutral side.

BTC/USD 1-day Technicals

Technical factors (4-hour Chart):
  • Price is above its 50-period and slightly above its 21-period EMA
  • Price is between its middle and top Bollinger band
  • RSI is neutral (60.06)
  • Volume is average
Key levels to the upside          Key levels to the downside

1: $19,100                                 1: $18,600

2: $19,666                                 2: $18,190

3: $20,000                                  3: $17,800

Ethereum

Ethereum has hit a sell wall as well, stopping its upward price movement just below $600 for the third time in 3 days. The second-largest cryptocurrency by market cap is stuck between $581 to the downside and $600 to the upside, which is a very narrow range for long-term trading.

Ethereum will most likely experience a sharp break out of the current range, creating a potential safe trade with set parameters.

ETH/USD 4-hour Chart

Ethereum’s overview on all time-frames is bullish, with its daily time-frame being the only one completely bullish. The rest of the time-frames are slightly tilted to the neutral side.

ETH/USD 1-day Technicals

Technical Factors (4-hour Chart):
  • Price is slightly above its 50-period and at its 21-period EMAs
  • Price is at its middle Bollinger band
  • RSI is neutral (54.03)
  • Volume is slightly below average when compared to the previous week
Key levels to the upside          Key levels to the downside

1: $600                                     1: $581

2: $632                                     2: $565 

3: $636.5                                   3: $545

Ripple

XRP has continued its downturn, this time breaking the crucial $0.475 level. Its price has steadily decreased ever since Dec 1, when it could not break $0.683. This steady descent has created a downtrend, which many analysts think is the death of XRP’s price.

However, there is still hope for XRP. Some analysts believe that this is the 4th of 5 waves in a pattern that XRP started creating on Aug 20 and that the next wave will start an uptrend that will propel its price above $1.

XRP/USD 4-hour Chart

XRP’s longer-term technicals are tilted towards the buy-side, while its short-term technicals are tilted towards the sell-side. While its 4-hour time-frame is completely bearish, its daily overview is slightly more neutral.

XRP/USD 1-day Technicals

Technical factors (4-hour Chart):
  • Its price is currently well below both its 50-period EMA and its 21-period EMA
  • Price is at its bottom Bollinger band
  • RSI is close to the oversold territory (31.25)
  • Volume is well below its average level
Key levels to the upside          Key levels to the downside

1: $0.5                                      1: $0.475

2: $0.543                                   2: $0.45

3: $0.57                                    3: $0.425

Categories
Crypto Market Analysis

Daily Crypto Review, Dec 15 – Bitcoin Whales Stopping the Push Towards $20k; XRP on the Downturn

The majority of the cryptocurrency sector ended up being in the slight green since we last reported, with Bitcoin trying to reach the all-time highs (though so-far unsuccessfully). Bitcoin is currently trading for $19,106, representing an increase of 0.15% compared to yesterday’s value. Meanwhile, Ethereum’s price has decreased by 0.32% on the day, while XRP managed to lose 2.97%.

 Daily Crypto Sector Heat Map

Mandi Token gained 175.35% in the past 24 hours, making it the most prominent daily crypto gainer by far. It is followed by yTSLA Finance’s 169.53% and DefHold’s 129.84% gain. On the other hand, DistX lost 98.32%, making it the most prominent daily loser. It is followed by AC Index’s loss of 94.05% and YXO’s loss of 43.16%.

Top 10 24-hour Performers (Click to enlarge)

Bottom 10 24-hour Performers (Click to enlarge)

Bitcoin’s market dominance has moved up very slightly since our last report, with its value currently being 63.5%. This value represents a 0.2% difference to the upside compared to the value it had when we last reported.

Daily Crypto Market Cap Chart

The cryptocurrency sector capitalization has increased since we last reported, with its current value being $569.80 billion. This represents a $9.01 billion increase when compared to our previous report.

_______________________________________________________________________

What happened in the past 24 hours?

_______________________________________________________________________

_______________________________________________________________________

Technical analysis

_______________________________________________________________________

Bitcoin

Bitcoin had quite an interesting day as it (at one point) tried to push towards the all-time highs, or at least towards its next resistance level (sitting at $19,666). However, the sheer resistance near the $20k level was immense, and the largest cryptocurrency by market cap dipped to its immediate support level ($19,100), which is where it’s at right now.

The data provided by various sources point to Bitcoin whales blocking the way towards and past $20k, despite all the bullish sentiment currently surrounding the cryptocurrency.


BTC/USD 4-hour chart

Bitcoin’s overview on all time-frames is fully bullish, with its monthly time-frame being slightly more tilted to the neutral side than the rest.

BTC/USD 1-day Technicals

Technical factors (4-hour Chart):
  • Price is above its 50-period and slightly above its 21-period EMA
  • Price is near its middle Bollinger band
  • RSI is neutral (55.33)
  • Volume is average when compared to the past week
Key levels to the upside          Key levels to the downside

1: $19,100                                 1: $18,600

2: $19,666                                 2: $18,190

3: $20,000                                  3: $17,800

Ethereum

Ethereum was in the same boat as Bitcoin for the past couple of days, with its price movement mirroring Bitcoin’s. Ether tried to move towards the $600 mark, but got stopped out just below it, triggering a pullback to its immediate support level ($581). However, its downside is well-guarded, both by the $581 support level and the 4-hour 21-period moving average.

Ethereum will most likely continue mirroring Bitcoin’s moves in the short future, meaning that traders should either focus on trading Bitcoin or pay close attention to its movements while trading Ether.

ETH/USD 4-hour Chart

Ethereum’s overview on all time-frames is fully bullish, with its weekly time-frame being slightly more tilted to the neutral side than the rest.

ETH/USD 1-day Technicals

Technical Factors (4-hour Chart):
  • Price is slightly above both its 50-period and 21-period EMAs
  • Price is near its middle Bollinger band
  • RSI is neutral (53.74)
  • Volume is slightly below average when compared to the previous week
Key levels to the upside          Key levels to the downside

1: $600                                     1: $581

2: $632                                     2: $565 

3: $636.5                                   3: $545

Ripple

XRP is one of the cryptocurrencies that rarely mirrors Bitcoin’s movements, and that was the case in the past 24 hours as well. However, the fact that its price doesn’t mirror the largest cryptocurrency was bad news lately. XRP’s price continued its slow descent, this time breaking the $0.5 mark to the downside. At one point, there was an attempt to regain this level, which got shut down pretty quickly.

While the overall crypto sector is surrounded by bullish sentiment, XRP is looking quite bearish in the short-term. Shorting the fourth-largest cryptocurrency by market cap can be a valid trading strategy, simply due to its consistency going down in recent days.

XRP/USD 4-hour Chart

XRP’s longer-term technicals are completely bullish, while its daily overview is slightly more tilted towards neutrality. Its 4-hour time-frame, however, is slightly tilted towards the sell-side.

XRP/USD 1-day Technicals

Technical factors (4-hour Chart):
  • Its price is currently below its 50-period EMA and slightly below its 21-period EMA
  • Price is between its middle and bottom Bollinger band
  • RSI is neutral (37.98)
  • Volume is well below its average level
Key levels to the upside          Key levels to the downside

1: $0.5                                      1: $0.475

2: $0.543                                   2: $0.45

3: $0.57                                    3: $0.425

Categories
Crypto Market Analysis

Daily Crypto Review, Dec 14 – BTC and ETH Consolidating After A Bull Rally; XRP Left in the Dust

The majority of the cryptocurrency sector ended up in the green as Bitcoin spent the weekend regaining the value it lost after failing to break its all-time high with confidence. Bitcoin is currently trading for $19,144, representing an increase of 1.69% compared to yesterday’s value. Meanwhile, Ethereum’s price has increased by 3.61% on the day, while XRP managed to gain 3.77%.

 Daily Crypto Sector Heat Map

BDCC Bitica COIN gained 229.29% in the past 24 hours, making it the most prominent daily crypto gainer by far. It is followed by Ethereum Lightning’s 223.18% and Nuggets’ 190.36% gain. On the other hand, rbase.finance lost 72.18%, making it the most prominent daily loser. It is followed by COIL’s loss of 48.85% and SBank’s loss of 40.65%.

Top 10 24-hour Performers (Click to enlarge)

Bottom 10 24-hour Performers (Click to enlarge)

Bitcoin’s market dominance has moved up half a percent since we last reported, with its value currently being 63.3%. This value represents a 0.5% difference to the upside compared to the value it had when we last reported.

Daily Crypto Market Cap Chart

The cryptocurrency sector capitalization has increased significantly over the weekend, with its current value being $560.79 billion. This represents a $31.22 billion increase when compared to our previous report.

_______________________________________________________________________

What happened in the past 24 hours?

_______________________________________________________________________

_______________________________________________________________________

Technical analysis

_______________________________________________________________________

Bitcoin

Bitcoin has been on fire this weekend, with its price skyrocketing from its recent lows. The uptrend that started on Dec 11 brought its price from $17,600 all the way up to $19,400 before starting to consolidate. The steep ascending trend it created was unsustainable in the long run, so Bitcoin left it and continued trading sideways just above $19,100. The largest cryptocurrency by market cap is currently fighting for this level, with the previous five 4-hour candles holding above the support.

BTC/USD 4-hour chart

Bitcoin’s daily and monthly technicals show slight signs of neutrality on top of its overall bullishness. On the other hand, its 4-hour and weekly technicals are completely bullish.

BTC/USD 1-day Technicals

Technical factors (4-hour Chart):
  • Price is above both its 50-period and 21-period EMAs
  • Price is between its middle and top Bollinger band
  • RSI is neutral (59.17)
  • Volume is slightly below the average level
Key levels to the upside          Key levels to the downside

1: $19,100                                 1: $18,600

2: $19,666                                 2: $18,190

3: $20,000                                  3: $17,800

Ethereum

Ethereum has followed Bitcoin’s footsteps and created its own ascending channel, in which it moved from Dec 11 until Dec 13. The second-largest cryptocurrency by market cap has left this channel and started its own consolidation phase right above the $581 support level.

Ethereum’s moves seem like a mirror to Bitcoin’s moves, with slightly more or less intensity. Traders should be extremely careful of sudden moves Bitcoin can make that could disrupt their Ethereum trades.

ETH/USD 4-hour Chart

Ethereum’s 4-hour, daily, and weekly technicals overall bullish but show signs of neutrality or even some bearish indicators. On the other hand, its monthly technicals are completely tilted towards the buy-side.

ETH/USD 1-day Technicals

Technical Factors (4-hour Chart):
  • Price is above both its 50-period and 21-period EMAs
  • Price is between its middle and top Bollinger band
  • RSI is starting to descend after being close to overbought (58.72)
  • Volume is average when compared to the previous week
Key levels to the upside          Key levels to the downside

1: $600                                     1: $581

2: $632                                     2: $565 

3: $636.5                                   3: $545

Ripple

XRP performed much worse than Bitcoin and Ethereum over the weekend, with its short-term outlook being quite bearish. The fourth-largest cryptocurrency by market cap ended up losing $13.11% of its value week-over-week, with its price currently sitting at the $0.5 level.

XRP is currently fighting to stay above the $0.5 level, with its past four 4-hour candles managing to do this. Traders may be able to catch a trade in either direction when XRP confirms its position above/below $0.5 on increased volume.

XRP/USD 4-hour Chart

XRP’s 4-hour and daily overviews are heavily tilted towards the sell-side but still show some neutral indicators. Its longer-term technicals, though, are completely bullish.

XRP/USD 1-day Technicals

Technical factors (4-hour Chart):
  • Its price is currently below both its 50-period EMA and its 21-period EMA
  • Price is between its middle and bottom Bollinger band
  • RSI is neutral (37.98)
  • Volume is slightly below the average level
Key levels to the upside          Key levels to the downside

1: $0.5435                                 1: $0.5

2: $0.57                                     2: $0.475

3: $0.6                                      3: $0.45

Categories
Crypto Market Analysis

Daily Crypto Review, Dec 11 – Bitcoin Fighting for $18,000; Crypto Market in the Red

The majority of the cryptocurrency sector has ended up being in the red as Bitcoin spent most of the day under the $18,000 level. Bitcoin is currently trading for $17,920, representing a decrease of 2.91% compared to our last report. Meanwhile, Ethereum’s price has decreased by 4.30% on the day, while XRP managed to lost 2.85%.

 Daily Crypto Sector Heat Map

Freedom Reserve gained 950.51% in the past 24 hours, making it the most prominent daily crypto gainer by far. It is followed by LBRY Credits’s 336.6% and Seigniorage Shares’ 117.99% gain. On the other hand, Basis Cash lost 87.95%, making it the most prominent daily loser. It is followed by xBTC’s loss of 55.09% and IterationSyndicate’s loss of 44.55%.

Top 10 24-hour Performers (Click to enlarge)

Bottom 10 24-hour Performers (Click to enlarge)

Bitcoin’s market dominance has moved up less than half a percent since we last reported, with its value currently being 62.8%. This value represents a 0.2% difference to the upside compared to the value it had when we last reported.

Daily Crypto Market Cap Chart

The cryptocurrency sector capitalization has decreased in the past 24 hours, with its current value being $528.97 46.31 billion. This represents a $17.34 billion decrease when compared to our previous report.

_______________________________________________________________________

What happened in the past 24 hours?

_______________________________________________________________________

_______________________________________________________________________

Technical analysis

_______________________________________________________________________

Bitcoin

Bitcoin has spent most of the day in a price descent after it failed to break the $18,600 mark. BTC bulls tried to pick the price back up but failed, which has caused another mini-dip, which brought the price as low as $17,721 on Bitstamp. The $17,780 level has proven itself as great support once again, and Bitcoin is now trading in a range between it and $18,190.

Due to the amount of support and resistance levels in a narrow price range Bitcoin currently has, a push towards either side could be a possible safe trade to catch.

BTC/USD 2-hour chart

Bitcoin’s short-term technicals are tilted towards the sell-side but show slight signs of neutrality. Its long-time technicals, however, are completely bullish.

BTC/USD 1-day Technicals

Technical factors (4-hour Chart):
  • Price is below both its 50-period and 21-period EMAs
  • Price is close to its bottom Bollinger band
  • RSI is dipping towards being oversold (36.77)
  • Volume is slightly above the average level
Key levels to the upside          Key levels to the downside

1: $18,190                                 1: $17,780

2: $18,600                                 2: $17,500

3: $18,790                                  3: $17,200

Ethereum

Ethereum has quickly stopped in its tracks towards $600 after hitting a brick wall at $581. The rebound pulled its price back below $565, as well as $545, which it is now fighting for. The fact that Ethereum is in a short-term bear run is confirmed by higher volume candles during price drops than during price spikes.

Our call from yesterday regarding Ethereum’s dip after dropping below $565 turned out as predicted. Traders should pay attention to Bitcoin’s movements and the ascending (red) trend line when trading Etheruem.

ETH/USD 2-hour Chart

Ethereum’s short-term technicals are tilted towards the sell-side but show slight neutral signs. However, its long-time technicals are bullish, with its weekly overview being slightly neutral than its monthly overview.

ETH/USD 1-day Technicals

Technical Factors (4-hour Chart):
  • Price is below both its 50-period and 21-period EMAs
  • Price is slightly above its bottom Bollinger band
  • RSI is dipping towards oversold territory (36.18)
  • Volume is slightly above the average level
Key levels to the upside          Key levels to the downside

1: $565                                     1: $545

2: $581                                      2: $525 

3: $600                                      3: $510

Ripple

XRP followed the rest of the crypto sector and made a price dip, which brought its price to the $0.543 level, which held up quite nicely. Its price is now recovering and consolidating between $0.543 and $0.57, with no signs of potential movement to either side.

XRP traders should pay attention to Bitcoin’s price movement, as most cryptocurrencies follow the general market direction it sets.

XRP/USD 2-hour Chart

XRP’s 4-hour and daily overviews show confusing signs, with some indicators being bullish and some bearish. Its long-term technicals are, however, completely bullish.

XRP/USD 1-day Technicals

Technical factors (4-hour Chart):
  • The price is currently below both its 50-period EMA and its 21-period EMA
  • Price is slightly below its middle Bollinger band
  • RSI is neutral (41.75)
  • Volume is slightly above the average level
Key levels to the upside          Key levels to the downside

1: $0.57                                   1: $0.5435

2: $0.6                                       2: $0.5

3: $0.63                                    3: $0.475

Categories
Crypto Market Analysis

Daily Crypto Review, Dec 10 – Bitcoin Bulls Back in the Game as Sector Recovers From The Dip

The cryptocurrency sector is mostly green as cryptocurrencies took the day to recover from the sudden drop that occurred on Dec 8. Bitcoin is currently trading for $18,411, representing an increase of 1.25% compared to our last report. Meanwhile, Ethereum’s price has increased by 3.37% on the day, while XRP managed to gain 4.66%.

 Daily Crypto Sector Heat Map

WinCash gained 207.65% in the past 24 hours, making it the most prominent daily crypto gainer by far. It is followed by Nyan V2’s 181.02% and Pamp Network’s 172.94% gain. On the other hand, DMme lost 68.63%, making it the most prominent daily loser. It is followed by ALL BEST ICO’s loss of 64.69% and Moonday Finance’s loss of 54.48%.

Top 10 24-hour Performers (Click to enlarge)

Bottom 10 24-hour Performers (Click to enlarge)

Bitcoin’s market dominance has moved to the downside just under half a percent since we last reported, with its value currently being 62.6%. This value represents a 0.4% difference to the downside compared to the value it had when we last reported.

Daily Crypto Market Cap Chart

The cryptocurrency sector capitalization has increased significantly in the past 24 hours, with its current value being $546.31 billion. This represents a $10.23 billion increase when compared to our previous report.

_______________________________________________________________________

What happened in the past 24 hours?

_______________________________________________________________________

_______________________________________________________________________

Technical analysis

_______________________________________________________________________

Bitcoin

Bitcoin has spent the day slowly moving up after a sharp price descent, which brought it to $18,000. After establishing itself above $18,190, Bitcoin even tried to push further up above $18,600 but failed almost instantly, making its price go back to previous levels.

We want to point out (once again) Micheal van de Poppe’s call of a large CME gap looming between $18,275 and $16,995.

Due to the amount of support/resistance levels Bitcoin currently has, any push towards either the upside or downside could be a possible safe trade in the same direction.

BTC/USD 2-hour chart

Bitcoin’s daily, weekly, and monthly technicals are completely tilted towards the buy-side and show no bearish signs. Its 4-hour overview, however, is completely bearish.

BTC/USD 1-day Technicals

Technical factors (4-hour Chart):
  • Price is below both its 50-period and 21-period EMAs
  • Price is between its middle and bottom Bollinger band
  • RSI is has recovered from being oversold (43.38)
  • Volume is slightly above average
Key levels to the upside          Key levels to the downside

1: $18,600                                 1: $18,190

2: $18,790                                 2: $17,780

3: $19,000                                  3: $17,200

Ethereum

Ethereum has not only recovered from its drop to $530, where it hit the ascending (red) trend line but pushed back towards $600. Even though the price is not yet ready to tackle this resistance level, it has made an attempt to break the $581 level but failed and returned to the $565 one.

Ethereum traders should pay attention to whether the cryptocurrency will end up above or below $565, which may be an indicator of its short-term movement. Traders should also pay attention to Bitcoin’s movement whenever taking a trade with Ethereum.

ETH/USD 2-hour Chart

Ethereum’s daily and monthly technicals are completely tilted towards the buy-side and show no signs of bearishness. However, its 4-hour overview is completely bearish, while its weekly overview is bullish but shows slight neutrality as well.

ETH/USD 1-day Technicals

Technical Factors (4-hour Chart):
  • Price is below both its 50-period and 21-period EMAs
  • Price is slightly below its middle Bollinger band
  • RSI has recovered from being in the oversold territory (42.83)
  • Volume is slightly above average
Key levels to the upside          Key levels to the downside

1: $565                                     1: $550

2: $581                                      2: $525 

3: $600                                      3: $510

Ripple

XRP made a sharp (to the upside) price recovery as well, with its price pushing past $0.5435, as well as its $0.57 resistance (now support) levels. The fourth-largest cryptocurrency by market cap even tried to break $0.6 but got shut down swiftly. Its price is now consolidating slightly above $0.57 and showing no signs of potential dips.

XRP traders (finally) have the option to trade this cryptocurrency after several days of close-to-no volatility. Keeping track of Bitcoin’s movements when trading XRP is a must, as any change in Bitcoin’s price could change the outlook of the market as a whole.

XRP/USD 2-hour Chart

XRP’s daily, weekly, as well as monthly technicals, are completely tilted towards the buy-side and show no signs of neutrality or bearishness. Its 4-hour overview, on the other hand, is bearish with slight signs of neutrality.

XRP/USD 1-day Technicals

Technical factors (4-hour Chart):
  • The price is currently slightly below both its 50-period EMA, as well as its 21-period EMA
  • Price is slightly below its middle Bollinger band
  • RSI is neutral and recovered from being oversold (47.26)
  • Volume is slightly above average
Key levels to the upside          Key levels to the downside

1: $0.57                                   1: $0.5435

2: $0.6                                       2: $0.5

3: $0.63                                    3: $0.475

Categories
Crypto Market Analysis

Daily Crypto Review, Dec 09 – Bitcoin Drops to $18,000; Crypto Market Tumbles

The cryptocurrency sector has dropped significantly as bears took over the market. Bitcoin is currently trading for $18,315, representing a decrease of 4.50% compared to our last report. Meanwhile, Ethereum’s price has decreased by 6.17% on the day, while XRP managed to lose 7.73%.

 Daily Crypto Sector Heat Map

ALL BEST ICO gained 19,990.71% in the past 24 hours, making it the most prominent daily crypto gainer by far. It is followed by COIL’s 151.88% and Amun Bitcoin 3x Daily Short’s 112.92% gain. On the other hand, Monavale lost 54.51%, making it the most prominent daily loser. It is followed by KIMCHI.finance’s loss of 52.82% and Iteration Syndicate’s loss of 51.70%.

Top 10 24-hour Performers (Click to enlarge)

Bottom 10 24-hour Performers (Click to enlarge)

Bitcoin’s market dominance has moved to the upside just under half a percent since we last reported, with its value currently being 63%. This value represents a difference of 0.4% to the upside when compared to yesterday’s value.

Daily Crypto Market Cap Chart

The crypto sector capitalization has decreased significantly in the past 24 hours, with its current value being $536.08 billion. This represents a $32.76 billion decrease when compared to our previous report.

_______________________________________________________________________

What happened in the past 24 hours?

_______________________________________________________________________

_______________________________________________________________________

Technical analysis

_______________________________________________________________________

Bitcoin

After spending the past couple of days in a very narrow range, Bitcoin has finally made a move as bears took over the market. The price went down rapidly and reached as low as $18,000 at one point, but then went slightly above this crucial level.

While Bitcoin is safe from breaking $18,000 to the downside at the moment, Micheal van de Poppe pointed out that a large CME gap is looming. The gap ranges from $18,275 to $16,995.

Lastly, the Hash Ribbons indicator has posted a buy signal, giving long-term investors the green light to invest in Bitcoin. This indicator has proven itself one of the best RoI indicators for Bitcoin when it comes to long-term investing.

BTC/USD 4-hour chart

Bitcoin’s long-term technicals (weekly and monthly) are completely tilted towards the buy-side, while its daily overview is still bullish but showing slight signs of neutrality. On the other hand, its 4-hour overview is completely bearish.

BTC/USD 1-day Technicals

Technical factors (4-hour Chart):
  • Price is currently below both its 50-period EMA and its 21-period EMA
  • Price is at its bottom Bollinger band
  • RSI is close to being oversold (31.73)
  • Volume is average
Key levels to the upside          Key levels to the downside

1: $18,600                                 1: $18,190

2: $18,790                                 2: $17,780

3: $19,000                                  3: $17,200

Ethereum

Ethereum wasn’t immune to the downturn either, with its price dropping from the sub-$600 levels all the way down to just above $550. Unlike Bitcoin, however, there are no CME gaps to worry about, and Ethereum seems quite stable above $550.

The only thing to worry about when anticipating Ether’s next price move is Bitcoin’s movement. At the moment, Bitcoin is dictating all consolidations, as well as large moves in either direction.

ETH/USD 4-hour Chart

Ethereum’s monthly overview shows a full tilt towards the buy-side, while its daily and weekly overviews still show some signs of neutrality. On the other hand, its 4-hour overview is bearish but shows slight signs of neutrality.

ETH/USD 1-day Technicals

Technical Factors (4-hour Chart):
  • The price is currently below both its 50-period EMA and its 21-period EMA
  • Price is at its bottom Bollinger band
  • RSI is in the oversold territory (28.61)
  • Volume is above average
Key levels to the upside          Key levels to the downside

1: $565                                     1: $550

2: $582                                     2: $525 

3: $600                                      3: $510

Ripple

The fourth-largest cryptocurrency by market cap moved to the downside as well, with its $0.545 support level holding up as the last-resort support. XRP is currently stable and trading between $0.545 to the downside and $0.571 to the upside, with its price, seemingly creating a double bottom (today and on Dec 5).

XRP traders might want to (still) refrain from trading XRP simply due to the disbalance of the risk and reward, as well as due to its low volatility.

XRP/USD 4-hour Chart

XRP’s longer weekly and monthly time-frames show complete bullishness, while its 4-hour overview is completely bearish. Its daily overview is still bullish but shows some signs of neutrality or even some bearishness.

XRP/USD 1-day Technicals

Technical factors (4-hour Chart):
  • The price is currently below both its 50-period EMA, as well as its 21-period EMA
  • Price is at its bottom Bollinger band
  • RSI is close to being oversold (34.36)
  • Volume is slightly above average
Key levels to the upside          Key levels to the downside

1: $0.571                                   1: $0.545

2: $0.6                                       2: $0.5

3: $0.63                                    3: $0.475

Categories
Crypto Market Analysis

Daily Crypto Review, Dec 08 – BTC, ETH and XRP Preparing for a Big Move; Crypto Sector in Consolidation Mode

The cryptocurrency sector has spent the past 24, mostly consolidating, as it failed to reach past its resistance levels on Monday. Bitcoin is currently trading for $19,180, representing a decrease of 0.65% compared to our last report. Meanwhile, Ethereum’s price has decreased by 1.14% on the day, while XRP managed to lose 1.65%.

 Daily Crypto Sector Heat Map

Prophet gained 358.97% in the past 24 hours, making it the most prominent daily crypto gainer. It is closely followed by Seigniorage Shares’ 344.54% and xBTC’s 340.23% gain. On the other hand, CryptoBet lost 95.85%, making it the most prominent daily loser. It is followed by Semux’s loss of 90.60% and Bitball Nyan v2’s loss of 51.05%.

Top 10 24-hour Performers (Click to enlarge)

Bottom 10 24-hour Performers (Click to enlarge)

Bitcoin’s market dominance has moved to the upside over half a percent since we last reported, with its value currently being 62.6%. This value represents a difference of 0.6% to the upside when compared to yesterday’s value.

Daily Crypto Market Cap Chart

The crypto sector capitalization has increased in the past 24 hours, with its current value being $568.82 51.68 billion. This represents a $17.24 billion increase when compared to our previous report.

_______________________________________________________________________

What happened in the past 24 hours?

_______________________________________________________________________

_______________________________________________________________________

Technical analysis

_______________________________________________________________________

Bitcoin

Bitcoin has continued with its slow movement as another low volatility day passed. The largest cryptocurrency by market cap oscillated between $18,905 and $19,431. The one time it dropped under the $19,000 mark, it found support in the 50-period moving average, which has proven to be a strong (both support and resistance) level.

Due to the low volatility, traders can’t really do much at the moment. However, they can prepare for the next move Bitcoin makes.

Lastly, the Hash Ribbons (one of the best accumulation indicators) indicator has posted a buy signal, giving long-term investors the green light.

BTC/USD 4-hour chart

Bitcoin’s technicals on both short and long time-frames are bullish, with its weekly time-frame showing full tilt to the buy-side and its 4-hour, daily, and monthly time-frames tilting more towards neutrality.

BTC/USD 1-day Technicals

Technical factors (4-hour Chart):
  • Price is slightly above its 50-period EMA while being at its 21-period EMA
  • Price is at its middle Bollinger band
  • RSI is neutral (51.61)
  • Volume is slightly below average
Key levels to the upside          Key levels to the downside

1: $19,500                                 1: $19,000

2: $19,666                                 2: $18,790

3: $20,000                                  3: $18,600

Ethereum

Ethereum has, just like Bitcoin, had quite a slow day, with its price moving slightly down. At the moment, the second-largest cryptocurrency by market cap doesn’t seem like it will tackle $600, as its volume is too low to pressure this major resistance level. However, if and when a bull run past $600 happens, traders will have a great opportunity to catch a safe trade with a stop-loss slightly below $600 and a possible target of $620 or $630.

ETH/USD 4-hour Chart

Ethereum’s monthly overview shows a full tilt towards the buy-side, while its daily and weekly overviews show some signs of neutrality. On the other hand, its 4-hour overview is completely bearish.

ETH/USD 1-day Technicals

Technical Factors (4-hour Chart):
  • The price is slightly above its 50-period EMA while being slightly below its 21-period EMA
  • Price is at its middle Bollinger band
  • RSI is neutral (48.32)
  • Volume is below average
Key levels to the upside          Key levels to the downside

1: $620                                     1: $600

2: $630                                     2: $530 

3: $735                                      3: $510

Ripple

The fourth-largest cryptocurrency by market cap has close to no volatility, as well as very low volume on most exchanges. With the price movement being non-existent, there is not much to say about the current XRP trading. However, whenever the trading range is getting this narrow, a breakout is on the horizon.

XRP has created a flag formation on the 1-day chart, signaling that an increase in volume could bring a breakout to the upside and a possible spike of up to 60%, which would take the coin’s price above $1,00.


XRP/USD 4-hour Chart

XRP’s longer time-frames (weekly and monthly) show complete bullishness, while its 4-hour and daily overviews show some signs of neutrality or even bearishness.

XRP/USD 1-day Technicals

Technical factors (4-hour Chart):
  • The price is at its 50-period EMA, as well as at its 21-period EMA
  • Price is at its middle Bollinger band
  • RSI is neutral (50.46)
  • Volume is well below average
Key levels to the upside          Key levels to the downside

1: $0.666                                   1: $0.6

2: $0.78                                     2: $0.596

3: $0.79                                   3: $0.535

Categories
Crypto Market Analysis

Daily Crypto Review, Dec 07 – ETHE and GBTC Grayscale Funds Reach All-Time High Average Daily Volumes in November

The cryptocurrency sector has spent the weekend recovering from the price descent on Dec 3 and 4. Bitcoin is currently trading for $19,288, representing an increase of 0.16% compared to our last report. Meanwhile, Ethereum’s price has decreased by 1.49% on the day, while XRP managed to lose 0.74%.

 Daily Crypto Sector Heat Map

Omnitude gained 241.76% in the past 24 hours, making it the most prominent daily crypto gainer. It is closely followed by KIMCHI.finance’s 185% and Badger DAO’s 123.92% gain. On the other hand, DAV Coin lost 71.6%, making it the most prominent daily loser. It is followed by Semux’s loss of 66.12% and Bitball Treasure’s loss of 65.05%.

Top 10 24-hour Performers (Click to enlarge)

Bottom 10 24-hour Performers (Click to enlarge)

Bitcoin’s market dominance has barely moved to the downside since we last reported, with its value currently being 62.1%. This value represents a difference of 0.3% to the downside when compared to Friday’s value.

Daily Crypto Market Cap Chart

The crypto sector capitalization has decreased over the weekend. Its current value is $551.68 billion, representing an $18.83 billion decrease when compared to our previous report.

_______________________________________________________________________

What happened in the past 24 hours?

_______________________________________________________________________

_______________________________________________________________________

Technical analysis

_______________________________________________________________________

Bitcoin

Bitcoin has spent the weekend trying to recover from the downturn it had on Dec 3 and 4. The largest cryptocurrency by market cap has formed a triangle formation that is respected throughout the weekend and then broke it to the upside. While the move was short-lived, the overall short-term bullishness has increased.

Some traders see a bull flag instead of the triangle formation, which makes the possibly future even more bullish. Posting any short trades would most likely be more risky than profitable at the moment.

It is also important to note that the Has Ribbons (one of the best accumulation indicators) indicator has posted a buy signal.

BTC/USD 4-hour chart

Bitcoin’s technicals on all time-frames are bullish, with 4-hour and weekly time-frames showing full tilt to the buy-side and daily and monthly time-frames tilting more towards neutrality.

BTC/USD 1-day Technicals

Technical factors (4-hour Chart):
  • Price is above its 50-period EMA and slightly above its 21-period EMA
  • Price is slightly above its middle Bollinger band
  • RSI is neutral (54.36)
  • Volume is below average
Key levels to the upside          Key levels to the downside

1: $19,500                                 1: $19,000

2: $19,666                                 2: $18,790

3: $20,000                                 3: $18,500

Ethereum

Ethereum has spent the weekend slowly pushing towards the upside, reaching just under $600 and bouncing off the resistance level. Its current failure to break $600 is not a big red flag, as Ethereum’s large moves are (lately) mostly caused by Bitcoin’s movement.

Ethereum traders have a great opportunity to catch a safe trade if ETH/USD breaks $600. A stop-loss slightly below $600 and a possible target of $620 or $630 would make quite a viable trade.

ETH/USD 4-hour Chart

Ethereum’s 4-hour, weekly, and monthly overviews show a full tilt towards the buy-side, while its daily overview shows some signs of neutrality.

ETH/USD 1-day Technicals

Technical Factors (4-hour Chart):
  • The price is slightly above its 50-period and at its 21-period EMA
  • Price is at its middle Bollinger band
  • RSI is neutral (50.51)
  • Volume is slightly below average
Key levels to the upside          Key levels to the downside

1: $620                                     1: $600

2: $630                                     2: $510 

3: $735                                      3: $500

Ripple

The fourth-largest cryptocurrency by market cap experienced slightly more volatility over the weekend than during the previous week, with its price hovering between $0.542 and $0.626. The $0.6 level is currently holding quite well as a support line, and XRP shows no signs of dropping below it unless some external factor surfaces.

Trading XRP is, even with the slight increase in volatility, a near-impossible feat at the moment. Trading other (more volatile) cryptocurrencies could be a much better option.

XRP/USD 4-hour Chart

XRP’s 4-hour, weekly, and monthly overviews show complete bullishness, while its daily overview shows some signs of neutrality.

XRP/USD 1-day Technicals

Technical factors (4-hour Chart):
  • The price is at both its 50-period EMA and its 21-period EMA
  • Price is at its middle Bollinger band
  • RSI is neutral (53.49)
  • Volume is slightly below average
Key levels to the upside          Key levels to the downside

1: $0.666                                   1: $0.6

2: $0.78                                     2: $0.596

3: $0.79                                   3: $0.535

Categories
Crypto Videos

Goodbye XRP! What Happens if XRP Gets Deemed a Security?


What Happens if XRP Gets Deemed a Security?

Ripple CEO Brad Garlinghouse believes that his company can and will still thrive under a hypothetical scenario where its cryptocurrency XRP is declared a security by the United States lawmakers. 

Appearing on episode 439 of the Anthony Pompliano’s Pomp Podcast, Garlinghouse spoke about the implications of XRP being declared a security by the US Securities and Exchange Commission. He said such a position is possible but that it would run contrary to the view that prevails among G20 markets.

While stating that “it’s very hard to look at XRP and say that it is a security,” Garlinghouse said:


“If XRP were deemed a security in the United States… you know, we have other G20 markets that have a completely different view. I’m not aware of any market in the world that thinks that XRP is a security.” Garlinghouse added that “over 90% of RippleNet customers are actually out of the United States,” suggesting that a possible unfavorable securities designation wouldn’t exactly hinder the company’s underlying business, but only its short-term popularity. If XRP were to be declared security in the US, investors would need to complete a broker-dealer registration with the US SEC.

XRP’s regulatory status has been a subject of intense scrutiny for a very long time now, with veteran futures and forex trader Peter Brandt being the latest of many public figures in line to declare it a security.

On the other hand, Congressman Tom Emmer, a Republican from the state of Minnesota, argued in August that XRP should not be deemed a security.

Ripple has been the subject of a major class-action lawsuit from disgruntled investors claiming that XRP is a security. This lawsuit alleges false advertising as well as unfair competition charges against Ripple. An amended filing from March 2020 claimed that Garlinghouse was shopping XRP to prospective investors while liquidating his holdings at the same time.

XRP is back in the limelight at the end of November as the market pushed its price above a multi-year high. The rally was a subject of heavy profit-taking, falling more than 28%.

Categories
Crypto Market Analysis

Daily Crypto Review, Dec 4 – Bitcoin Above $19,000; Ether Fighting for $600

The cryptocurrency sector has spent the day trying to regain its recent highs, with Ethereum breaking $600 and Bitcoin breaking $19,000. Bitcoin is currently trading for $19,314, representing an increase of 1.14% compared to our last report. Meanwhile, Ethereum’s price has increased by 2.15% on the day, while XRP managed to lose 0.52%.

 Daily Crypto Sector Heat Map

The past 24 hours have passed without any major winners or losers in the top100 cryptos. Ren gained 5.23% in the past 24 hours, making it the most prominent daily gainer in the top100. It is closely followed by Band Protocol’s 4.44% and VeChain’s 4.08% gain. On the other hand, Decentraland lost 4.98%, making it the most prominent daily loser. It is followed by Uniswap’s loss of 4.79% and Kyber Network’s loss of 4.49%.

Top 10 24-hour Performers (Click to enlarge)

Bottom 10 24-hour Performers (Click to enlarge)

Bitcoin’s market dominance has barely changed since we last reported, with its value currently being 62.4%. This value represents a difference of 0.1% to the upside when compared to yesterday’s value.

Daily Crypto Market Cap Chart

The crypto sector capitalization has decreased just slightly in the past 24 hours. Its current value is $570.51 billion, representing a $0.54 billion decrease compared to our previous report.

_______________________________________________________________________

What happened in the past 24 hours?

_______________________________________________________________________

_______________________________________________________________________

Technical analysis

_______________________________________________________________________

Bitcoin

Bitcoin has spent the day trying to break its immediate resistance (which is sitting at $19,490). However, all attempts throughout the day have been unsuccessful, which prompted Bitcoin to pull back slightly. However, the largest cryptocurrency by market cap has established its presence above $19,000 with confidence once again.

Bitcoin is quite unpredictable at the moment, making safe trades hard to find. Traders should pay attention to BTC volume and enter trades with a high profit/loss ratio to quickly mitigate the risk of things turning from good to bad.

BTC/USD 1-hour chart

Bitcoin’s technicals on all time-frames are bullish, but they all show some signs of neutrality (or even bearishness) alongside the overall bullishness.

BTC/USD 1-day Technicals

Technical factors (4-hour Chart):
  • Price is currently above its 50-period EMA and slightly above its 21-period EMA
  • Price is at its middle Bollinger band
  • RSI is neutral (56.72)
  • Volume is average
Key levels to the upside          Key levels to the downside

1: $19,500                                 1: $19,000

2: $19,666                                 2: $18,790

3: $20,000                                 3: $18,500

Ethereum

Ethereum has spent the day following Bitcoin’s movement, with its price first pushing towards the upside and then pulling back as it was unable to break a certain level (in this case, $620. On the other hand, the second-largest cryptocurrency by market cap has seemingly established its presence above $600, though not with nearly as much conviction as Bitcoin did.

If Ethereum traders followed our advice from yesterday’s analysis, they would have made quite a good profit by longing Ether after it broke $600, with a stop-loss set slightly below this level. While trading Ethereum is still quite possible, the current high correlation with Bitcoin’s movement makes Bitcoin a (possibly) better option to trade, simply due to fewer variables a trader would have to consider.

ETH/USD 1-hour Chart

Ethereum’s daily and monthly overviews are completely bullish, while its 4-hour and weekly time-frames show some form of neutrality next to the overall bullishness.

ETH/USD 1-day Technicals

Technical Factors (4-hour Chart):
  • The price is currently above its 50-period and slightly above its 21-period EMA
  • Price is at its middle Bollinger band
  • RSI is neutral (57.22)
  • Volume is average
Key levels to the upside          Key levels to the downside

1: $620                                     1: $600

2: $630                                     2: $510 

3: $735                                      3: $500

Ripple

The fourth-largest cryptocurrency by market cap has had another extremely slow day, with its price barely fluctuating at all. The low volume and low volatility are continuing throughout the week, with XRP just barely moving to the downside as a response to the minor pullback caused by Bitcoin’s movement.

Trading XRP is a near-impossible feat at the moment, as the cryptocurrency currently shows no volatility and (therefore) no trade opportunities.

XRP/USD 2-hour Chart

XRP’s daily and monthly overviews are completely bullish, while its weekly time-frames show bullish sentiment with a hint of neutrality. Its 4-hour overview, however, is completely bearish.

XRP/USD 1-day Technicals

Technical factors (4-hour Chart):
  • The price is (at the moment of writing) slightly above its 50-period EMA and slightly below its 21-period EMA
  • Price is slightly below its middle Bollinger band
  • RSI is neutral (48.53)
  • Volume is slightly below average
Key levels to the upside          Key levels to the downside

1: $0.666                                   1: $0.6

2: $0.78                                     2: $0.596

3: $0.79                                   3: $0.535

Categories
Crypto Market Analysis

Daily Crypto Review, Dec 3 – PayPal and BlackRock Heads Extremely Bullish on Bitcoin; Crypto Sector Consolidating

The cryptocurrency sector has spent the day stabilizing after a sudden drop. Bitcoin is currently trading for $18,997, representing an increase of 0.48% compared to our last report. Meanwhile, Ethereum’s price decreased 0.64% on the day, while XRP managed to lost 0.01%.

 Daily Crypto Sector Heat Map

Decred gained 39.22% in the past 24 hours, making it the most prominent daily gainer in the top100. It is closely followed by Elrond’s 30.56% and Curve DAO Token’s 10.36% gain. On the other hand, Nexo lost 5.60%, making it the most prominent daily loser. It is followed by Status’s loss of 2.72% and Augur’s loss of 1.66%.

Top 10 24-hour Performers (Click to enlarge)

Bottom 10 24-hour Performers (Click to enlarge)

Bitcoin’s market dominance hasn’t changed since we last reported, with its value currently staying at 62.3%. This value represents a 0% difference when compared to yesterday’s value.

Daily Crypto Market Cap Chart

The crypto sector capitalization has increased significantly in the past 24 hours. Its current value is $571.05 billion, representing a $10.27 billion increase compared to our previous report.

_______________________________________________________________________

What happened in the past 24 hours?

_______________________________________________________________________

_______________________________________________________________________

Technical analysis

_______________________________________________________________________

Bitcoin

Bitcoin has spent the day recovering from yesterday’s pullback and trying to regain $19,000. However, this level has proven to be a solid resistance zone, and it is unsure whether Bitcoin will manage to push over it. On the other hand, the overall sentiment around the largest cryptocurrency by market cap is incredibly bullish, mostly due to the massive investments coming from the institutional side.

Bitcoin is very volatile and unpredictable at the moment, making the trades quite hard to pull off. Traders should pay attention to volume and watch smaller time-frames and enter trades with a high profit/loss ratio to mitigate the risk when things go bad.

BTC/USD 4-hour chart

Bitcoin’s short-term technicals are completely bullish, while its weekly and monthly technicals show some signs of neutrality alongside the overall bullishness.

BTC/USD 1-day Technicals

Technical factors (4-hour Chart):
  • Price is above its 50-period EMA and slightly above its 21-period EMA
  • Price is at its middle Bollinger band
  • RSI is neutral (54.55)
  • Volume is average
Key levels to the upside          Key levels to the downside

1: $19,000                                 1: $18,790

2: $19,500                                 2: $18,500

3: $19,666                                  3: $18,240

Ethereum

Ethereum has spent the day mostly flat and hovering right under the $600 mark. The second-largest cryptocurrency by market cap has continuously failed to break the immediate resistance level but did not back down from it.

Ethereum traders have a good chance of catching a safe trade with a stop-loss slightly below $600 if Ether pushes above $600 (either because of its own price movement or as a response to Bitcoin breaking $19,000 with conviction).

ETH/USD 4-hour Chart

Ethereum’s daily and monthly technicals are completely bullish, while its 4-hour and weekly time-frames show some neutrality next to the overall bullishness.

ETH/USD 1-day Technicals

Technical Factors (4-hour Chart):
  • The price is above its 50-period and at its 21-period EMA
  • Price is at its middle Bollinger band
  • RSI is neutral (54.35)
  • Volume is average
Key levels to the upside          Key levels to the downside

1: $600                                     1: $510

2: $630                                     2: $500 

3: $735                                      3: $490

Ripple

The fourth-largest cryptocurrency by market cap has had another slow day, with its price fluctuating between $0.6 and $0.64. The $0.6 support level seems to be holding quite well, while the $0.625 level got ignored several times, which made us remove it from the key levels section.

Trading XRP is almost impossible as the cryptocurrency currently has no volatility and (therefore) no trade opportunities.

XRP/USD 4-hour Chart

XRP’s daily and monthly technicals are completely bullish, while its 4-hour and weekly time-frames’ show bullish sentiment with a hint of neutrality.

XRP/USD 1-day Technicals

Technical factors (4-hour Chart):
  • The price is slightly above its 50-period EMA and at its 21-period EMA
  • Price is at its middle Bollinger band
  • RSI is neutral (51.08)
  • Volume is slightly below average
Key levels to the upside          Key levels to the downside

1: $0.666                                   1: $0.6

2: $0.78                                     2: $0.596

3: $0.79                                   3: $0.535


Categories
Crypto Market Analysis

Daily Crypto Review, Dec 2 – Traders Sell the News on ETH 2.0 Phase 0 Launch; Crypto Market in the Red

The cryptocurrency sector has dipped as the market entered a “selloff” mode the moment Ethereum’s 2.0 Phase 0 launched. The largest cryptocurrency by market cap is currently trading for $18,843, representing a decrease of 3.83% on the day. Meanwhile, Ethereum lost 2.83% on the day, while XRP managed to lost 6.17%.

 Daily Crypto Sector Heat Map

SushiSwap gained 34.83% in the past 24 hours, making it the most prominent daily gainer in the top100. It is closely followed by Kusama’s gain of 10.74% and Ampleforth’s 9.05% gain. On the other hand, HedgeTrade lost 10.21%, making it the most prominent daily loser. It is followed by Horizen’s loss of 9.44% and Ethereum Classic’s loss of 8.77%.

Top 10 24-hour Performers (Click to enlarge)

Bottom 10 24-hour Performers (Click to enlarge)

Bitcoin’s market dominance has decreased slightly since we last reported, with its value currently staying at 62.3%. This value represents a 0.1% difference to the downside when compared to yesterday’s value.

Daily Crypto Market Cap Chart

The crypto sector capitalization has decreased significantly in the past 24 hours. Its current value is $560.78 billion, representing a $17.09 billion increase compared to our previous report.

_______________________________________________________________________

What happened in the past 24 hours?

_______________________________________________________________________

_______________________________________________________________________

Technical analysis

_______________________________________________________________________

Bitcoin

Bitcoin has spent the day pulling back from its all-time highs and towards the $18,500 level. Its price formed a triangle formation on the 30-minute time-frame right after the price dump (which happened at the exact moment ETH 2.0 Phase 0 launched, as people were selling the news) and then broke it to the downside. Its price is now fighting for the $18,790 level (78.6% Fib retracement).

Bitcoin is quite volatile and unpredictable at the moment, but short trades in either direction could be viable. Traders should pay attention to volume and watch smaller time-frames and catch formations to trade off of them.

BTC/USD 30-minute chart

Bitcoin’s technicals on all time-frames are slightly tilted towards the buy-side. However, they show slight neutrality signs, except for the monthly overview, which is completely bullish.

BTC/USD 1-day Technicals

Technical factors (4-hour Chart):
  • Price is far above its 50-period EMA and at its 21-period EMA
  • Price is at its middle Bollinger band
  • RSI is near the overbought territory (52.95)
  • Volume is average
Key levels to the upside          Key levels to the downside

1: $19,000                                 1: $18,790

2: $19,500                                 2: $18,500

3: $19,666                                  3: $18,240

Ethereum

Ethereum has, just like Bitcoin, pulled back as traders sold the news of ETH 2.0 Phase 0 launching. While its move wasn’t as pronounced, the second-largest cryptocurrency by market cap did lose quite a bit of value, as well as most likely confirmed its position below $600. The double top formation was confirmed, which added to the decisiveness of the drop.

Ethereum traders should pay close attention to Bitcoin’s movement, as it currently dictates the market direction regardless of what news moves the market (news on Bitcoin or any other altcoin).

ETH/USD 4-hour Chart

Ethereum’s daily and monthly technicals are completely bullish and show no signs of neutrality. However, its 4-hour and weekly time-frames’ sentiment is bullish but shows some neutrality.

ETH/USD 1-day Technicals

Technical Factors (4-hour Chart):
  • The price is far above its 50-period and at its 21-period EMA
  • Price is at its middle Bollinger band
  • RSI is near being overbought (55.86)
  • Volume is average
Key levels to the upside          Key levels to the downside

1: $600                                     1: $510

2: $630                                     2: $500 

3: $735                                      3: $490

Ripple

The fourth-largest cryptocurrency by market cap had a pretty slow day, with its price hovering slightly above the $0.6 mark. Its price did feel the push towards the downside that the whole crypto sector experienced, but to a much lesser extent. XRP has found support at its 4-hour 50-period moving average, above which it is currently trading.

Trading XRP is almost certainly an inferior option to trading Bitcoin and Ethereum at the moment, as both the volume and volatility are low.

XRP/USD 4-hour Chart

XRP’s daily and monthly technicals are completely bullish and show no signs of neutrality. However, its 4-hour and weekly time-frames’ sentiment is bullish but shows some neutrality.

XRP/USD 1-day Technicals

Technical factors (4-hour Chart):
  • The price is slightly above its 50-period EMA and slightly below its 21-period EMA
  • Price is slightly below its middle Bollinger band
  • RSI is neutral (49.86)
  • Volume is below average
Key levels to the upside          Key levels to the downside

1: $0.666                                   1: $0.625

2: $0.78                                     2: $0.596

3: $0.79                                   3: $0.535


Categories
Crypto Market Analysis

Daily Crypto Review, Dec 1 – Bitcoin’s New Monthly All-Time High; Ethereum 2.0 Phase 0 Launches Today

The cryptocurrency sector has pushed further up as Bitcoin made a new all-time high for a moment. The largest cryptocurrency by market cap is currently trading for $19,443, representing an increase of 5.03% on the day. Meanwhile, Ethereum gained 3.45% on the day, while XRP managed to gain 3.78%.

 Daily Crypto Sector Heat Map

BitTorrent gained 18.25% in the past 24 hours, making it the most prominent daily gainer in the top100. It is closely followed by Litecoin’s gain of 11.22% and Decentraland’s 7.69% gain. On the other hand, Numeraire lost 4.81%, making it the most prominent daily loser. It is followed by Waves’ loss of 5.78 and Zilliqa’s loss of 3.36%.

Top 10 24-hour Performers (Click to enlarge)

Bottom 10 24-hour Performers (Click to enlarge)

Bitcoin’s market dominance has increased slightly since we last reported, with its value currently staying at 62.4%. This value represents a 0.7% difference to the upside compared to the value it had yesterday.

Daily Crypto Market Cap Chart

The crypto sector capitalization has increased significantly in the past 24 hours. Its current value is $577.86 billion, representing a $24.86billion increase compared to our previous report.

_______________________________________________________________________

What happened in the past 24 hours?

_______________________________________________________________________

_______________________________________________________________________

Technical analysis

_______________________________________________________________________

Bitcoin

Bitcoin has spent the day continuing its push towards the upside, even posting a new all-time high (on most exchanges) for a moment as it reached $19,864 on Bitstamp. However, the 20,000 mark and BitMEX’s $20,093 remain untouched. With the buys on exchanges and derivatives markets and institutional investments, a strong all-time high might be posted extremely soon.

Bitcoin trading is quite hard at the moment simply due to how the cryptocurrency moves. Still, traders can squeeze a profit if they trade along with the main trend and long Bitcoin when the volume increases.

BTC/USD 4-hour Chart

Bitcoin’s technicals on all time-frames are tilted towards the buy-side but show slight neutrality signs, or even slight signs of bearishness.

BTC/USD 1-day Technicals

Technical factors (4-hour Chart):
  • Price is far above both its 50-period EMA and its 21-period EMA
  • Price is near its top Bollinger band
  • RSI is near the overbought territory (69.43)
  • Volume is average
Key levels to the upside          Key levels to the downside

1: $19,500                                 1: $19,000

2: $19,666                                 2: $18,790

3: $20,000                                  3: $18,500

Ethereum

Ethereum has, just like Bitcoin, continued its climb up. However, the move has stopped slightly below its most recent highs, topping at $617.87. The second-largest cryptocurrency by market cap now has two scenarios to play out:

  1. It can create a double top and start moving back towards the supporting levels;
  2. It can continue moving up on fundamentals and break the recent high and the recent trading patterns it created.

Ethereum’s current fundamental outlook is extremely bullish due to its Phase 0 of Ethereum 2.0 launching. This, along with Bitcoin moving towards the upside, has made trading any potential pullbacks quite impossible due to the amount of potential risk such trade would carry.

ETH/USD 4-hour Chart

Ethereum’s 4-hour, daily, and monthly technicals are extremely bullish and show no signs of neutrality. On the other hand, its weekly time-frame’s sentiment is bullish but shows some neutrality.

ETH/USD 1-day Technicals

Technical Factors (4-hour Chart):
  • The price is far above both its 50-period and its 21-period EMA
  • Price is near its top Bollinger band
  • RSI is near being overbought (68.63)
  • Volume is average
Key levels to the upside          Key levels to the downside

1: $600                                     1: $510

2: $630                                     2: $500 

3: $735                                      3: $490

Ripple

The fourth-largest cryptocurrency by market cap has tried moving up, as well, but in a much tamer manner. XRP has established its presence above $0.625 and pushed towards $0.666, which stopped the move. XRP will most likely continue trading in a range-bound by $0.666 to the upside and either $0.625 or $0.596 to the downside

Trading XRP is quite difficult at the moment, and trading Bitcoin or Ethereum is potentially more profitable and slightly more straightforward.

XRP/USD 4-hour Chart

XRP’s technicals on the 4-hour and weekly time-frames are bullish but show some signs of neutrality. On the other hand, its daily and monthly overviews are completely bullish.

XRP/USD 1-day Technicals

Technical factors (4-hour Chart):
  • The price is above its 50-period EMA and slightly above its 21-period EMA
  • Price is between its middle and top Bollinger band
  • RSI is neutral (60.95)
  • Volume is average
Key levels to the upside          Key levels to the downside

1: $0.666                                   1: $0.625

2: $0.78                                     2: $0.596

3: $0.79                                   3: $0.535


Categories
Crypto Market Analysis

Daily Crypto Review, Nov 30 – Ethereum Soars on Great Fundamentals; Bitcoin Bulls Back in the Game

The cryptocurrency sector has spent the weekend regaining what was lost during the crash on Nov 25. Almost every single cryptocurrency in the top100 ended up being in the green. The largest cryptocurrency by market cap is currently trading for $18,369, representing an increase of 4.43% on the day. Meanwhile, Ethereum gained 9.79% on the day, while XRP managed to gain 6.67%.

 Daily Crypto Sector Heat Map

Kusama gained 19.14% in the past 24 hours, making it the most prominent daily gainer in the top100. It is closely followed by Ampleforth’s gain of 16.24% and Zilliqa’s 13.48% gain. On the other hand, Numeraire Coin lost 5.56%, making it the most prominent daily loser. There were no other cryptocurrencies in the top100 that lost over 1% of its value.

Top 10 24-hour Performers (Click to enlarge)

Bottom 10 24-hour Performers (Click to enlarge)

Bitcoin’s market dominance has decreased slightly since we last reported, with its value currently staying at 61.7%. This value represents a 0.5% difference to the downside compared to the value it had on Friday.

Daily Crypto Market Cap Chart

The crypto sector capitalization has increased significantly over the weekend. Its current value is $553.00 billion, representing a $38.14 billion increase compared to our previous report.

_______________________________________________________________________

What happened in the past 24 hours?

_______________________________________________________________________

_______________________________________________________________________

Technical analysis

_______________________________________________________________________

Bitcoin

Bitcoin has spent the weekend recovering from the Nov 25 crash. The price was slowly going up over the weekend, creeping up to and past $18,000 once again. The largest cryptocurrency by market cap is currently between its 61.8% and 78.6% Fib retracement levels, and a break to either side of this range may determine its short-term fate.

Bitcoin’s short-term future will greatly depend on if it breaks its immediate support or resistance level. In both cases, a strong rally towards that side may form, so traders should be prepared to “catch” the trade quickly.

BTC/USD 1-hour Chart

Bitcoin’s daily, weekly, and monthly technicals are tilted towards the buy-side but show slight neutrality signs. On the other hand, its 4-hour technicals are completely bullish.

BTC/USD 1-day Technicals

Technical factors (4-hour Chart):
  • Price is above both its 50-period EMA and its 21-period EMA
  • Price is near its top Bollinger band
  • RSI is neutral (62.26)
  • Volume is average
Key levels to the upside          Key levels to the downside

1: $18,500                                 1: $17,850

2: $18,790                                 2: $17,450

3: $19,000                                  3: $17,000

Ethereum

Ethereum has, just like Bitcoin, been climbing back and trying to reach its recent highs. The second-largest cryptocurrency by market cap is currently fighting to pass the 78.6% Fib retracement level, sitting at $592.5. If this level gets conquered with conviction, we may expect another run past $600.

Ethereum’s current fundamental outlook is very bullish due to its Phase 0 of Ethereum 2.0 launching. This, combined with Bitcoin moving towards the upside, has made trading any potential pullbacks impossible due to how risky it would be.

ETH/USD 4-hour Chart

Ethereum’s 4-hour, daily, and monthly technicals are completely bullish and show no signs of neutrality. On the other hand, its sentiment seen in the weekly time-frame’s is bullish but shows some neutrality.

ETH/USD 1-day Technicals

Technical Factors (4-hour Chart):
  • The price is far above both its 50-period and its 21-period EMA
  • Price is at its top Bollinger band
  • RSI is near being overbought(68.26)
  • Volume is average
Key levels to the upside          Key levels to the downside

1: $600                                     1: $510

2: $630                                     2: $500 

3: $735                                      3: $490

Ripple

The fourth-largest cryptocurrency by market cap has spent the weekend trying to maintain its level after a small rally that took its price from $0.55 to $0.65. XRP seems to be trading in a range, bound by the 38.2% Fib retracement ($0.582) and 61.8% Fib retracement ($0.657).

Trading XRP may not be optimal as trading Bitcoin, or Ethereum is potentially more profitable and slightly more straightforward.

XRP/USD 2-hour Chart

XRP’s technicals on shorter time-frames (4-hour and daily) are extremely bullish, while its weekly and monthly overviews show some signs of neutrality and bearishness (though they are still bullish).

XRP/USD 1-day Technicals

Technical factors (4-hour Chart):
  • The price is above its 50-period EMA and slightly above its 21-period EMA
  • Price is between its middle and top Bollinger band
  • RSI is neutral (58.86)
  • Volume is average
Key levels to the upside          Key levels to the downside

1: $0.657                                   1: $0.625

2: $0.711                                     2: $0.582

3: $0.79                                  3: $0.535


Categories
Crypto Market Analysis

Daily Crypto Review, Nov 27 – Satoshi Nakamoto Emails Discovered; Crypto Market Consolidating

The cryptocurrency sector has started its consolidation period after a bloodbath it experienced yesterday. The largest cryptocurrency by market cap is currently trading for $17,164, representing a decrease of 3.07 % on the day. Meanwhile, Ethereum is gaining 0.01% on the day, while XRP managed to gain 2.47%.

 Daily Crypto Sector Heat Map

SushiSwap gained 31.44% in the past 24 hours, making it the most prominent daily gainer in the top100. It is closely followed by Aave’s gain of 15.05% and Nano’s 14.68% gain. On the other hand, Crypto.com Coin lost 10.20%, making it the most prominent daily loser. NEM lost 9.92% while OMG Network lost 9.43%, making them the 2nd and 3rd most prominent daily losers.

Top 10 24-hour Performers (Click to enlarge)

Bottom 10 24-hour Performers (Click to enlarge)

Bitcoin’s market dominance has stayed at the same place as yesterday, with its value currently staying at 62.2%. This value represents a 0% difference when compared to the value it had yesterday.

Daily Crypto Market Cap Chart

The crypto sector capitalization has decreased significantly over the course of the day. Its current value is $511.86 billion, representing a $48.67 billion decrease compared to our previous report.

_______________________________________________________________________

What happened in the past 24 hours?

_______________________________________________________________________

_______________________________________________________________________

Technical analysis

_______________________________________________________________________

Bitcoin

The largest cryptocurrency by market cap has triggered a rally towards the downside after creating a double top, which brought its price as low as $16,215. While some analysts say that the downturn is not over yet, Bitcoin has recovered slightly and is now consolidating just above the $17,000 mark.

While shorting Bitcoin could be a good profit-making opportunity if the downtrend continues, trading against the long-term trend is very risky. However, thinking about hedging against any downturns should be considered.

BTC/USD 1-hour Chart

Bitcoin’s daily and weekly technicals are tilted towards the buy-side and show no signs of neutrality. On the other hand, its monthly technicals show some signs of neutrality, while its 4-hour technicals are completely bearish.

BTC/USD 1-day Technicals

Technical factors (1-hour Chart):
  • Price is far below its 50-period EMA and at its 21-period EMA
  • Price is at its middle Bollinger band
  • RSI is neutral (44.33)
  • Volume is average
Key levels to the upside          Key levels to the downside

1: $17,450                                 1: $17,000

2: $17,850                                 2: $16,800

3: $18500                                   3: $16,350

Ethereum

Ethereum has experienced the same chain of events Bitcoin did in the past day or so. The downtrend ended up bringing Ethereum’s price back to as low as $480 before recovering. However, Ethereum’s ascending channel (yellow dotted) top line has stayed strong and triggered a mini-rally, which then brought the price above the red ascending line as well. Ethereum is now consolidating at around $515.

Ethereum’s current fundamental outlook is very bullish, but (as we said in our previous articles) any sharp move to the downside triggered by Bitcoin will affect Ethereum in a major way as well. This makes trading up hard, as one needs to constantly check Bitcoin’s price as well.

ETH/USD 1-hour Chart

Ethereum’s daily, weekly, and monthly technicals are completely bullish and show no or just slight neutrality signs. On the other hand, its sentiment seen in the 4-hour time-frame’s is completely bearish.

ETH/USD 1-day Technicals

Technical Factors (4-hour Chart):
  • The price is far below its 50-period and at its 21-period EMA
  • Price is at its middle Bollinger band
  • RSI is neutral (44.53)
  • Volume is average
Key levels to the upside          Key levels to the downside

1: $600                                     1: $510

2: $630                                     2: $500 

3: $735                                      3: $490

Ripple

The fourth-largest cryptocurrency by market cap has posted lower highs three times in a row, with its lows testing the $0.625 support level each time the price went down. However, the third time XRP went towards this level, Bitcoin’s push towards the downside triggered XRP bears, which took over the market. The downturn ended at the $0.475 level, which held up quite nicely. XRP is now trading in the middle of a range, bound by $0.475 to the downside and $0.625 to the upside.

Trading XRP may not be optimal at the moment as trading Bitcoin is both potentially more profitable and a bit more straightforward.

XRP/USD 1-hour Chart

XRP’s technicals on all time-frames are bullish, with its daily time-frame being the only one not showing any signs of neutrality. The other time-frames show either slight neutrality or even slight bearishness.

XRP/USD 1-day Technicals

Technical factors (4-hour Chart):
  • The price is slightly below its 50-period EMA and at its 21-period EMA
  • Price is slightly above its middle Bollinger band
  • RSI is neutral (48.78)
  • Volume is slightly above average
Key levels to the upside          Key levels to the downside

1: $0.625                                   1: $0.475

2: $0.79                                     2: $0.443

3: $0.963                                  3: $0.4


Categories
Crypto Market Analysis

Daily Crypto Review, Nov 26 – Bitcoin’s “Flash Crash” Pulls Price Below $18,000; Blood on the Crypto Streets

The cryptocurrency sector has ended the day in the red as Bitcoin failed to stay above $19,000 and even falling below $18,000 as bears took control of the market. The largest cryptocurrency by market cap is currently trading for $17,000, representing a decrease of 10.67%% on the day. Meanwhile, Ethereum is losing 15.34% on the day, while XRP lost 16.88%.

 Daily Crypto Sector Heat Map

Zilliqa 23.75% in the past 24 hours, making it the most prominent daily gainer in the top100. It is closely followed by Horizen’s gain of 18.71% and Elrond’s 11.54% gain. On the other hand, Verge lost 24.86%, making it the most prominent daily loser. Kusama lost 15.78% while Reserve Rights lost 13.81%, making them the 2nd and 3rd most prominent daily losers.


Top 10 24-hour Performers (Click to enlarge)

Bottom 10 24-hour Performers (Click to enlarge)

Bitcoin’s market dominance has increased over the day, with its value currently staying at 62.2%. This value represents a 0.6% difference to the upside compared to the value it had yesterday.

Daily Crypto Market Cap Chart

The crypto sector capitalization has decreased over the course of the day. Its current value is $560.17 billion, representing an $11.36 billion decrease compared to our previous report.

_______________________________________________________________________

What happened in the past 24 hours?

_______________________________________________________________________

_______________________________________________________________________

Technical analysis

_______________________________________________________________________

Bitcoin

The largest cryptocurrency by market cap has created a double top, which triggered a pullback from the recent highs. Not only has the price retraced to the sub-$19,000 level, but it has also broken the $18,500 support level. The price will most likely end up below the $17,850 level, as the market is calling for a pullback for quite some time. However, if the market recovers, we can expect the price to end up between $17,850 and $18,500.

While shorting Bitcoin might be a good profit-making opportunity at the moment, trading against the long-term trend is extremely risky. However, thinking about hedging versus any downturns might be a good option at the moment.

BTC/USD 1-hour Chart

Bitcoin’s 4-hour, daily, and weekly technicals are heavily tilted towards the buy-side and show no signs of neutrality or bearishness. On the other hand, its monthly technicals are showing some signs of neutrality.

BTC/USD 1-day Technicals

Technical factors (1-hour Chart):
  • Price is far below its 50-period EMA and its 21-period EMA
  • Price slightly below its lower Bollinger band
  • RSI is extremely oversold (23.98)
  • Volume is average (one candle spike)
Key levels to the upside          Key levels to the downside

1: $18500                                  1: $17,850

2: $19000                                  2: $17,450

3: $19500                                   3: $17,000

Ethereum

While Ethereum did follow Bitcoin to the downside, both in price direction and severity of the move, the situation doesn’t look that bad. The second-largest cryptocurrency by market cap has started its pullback after failing to stay above $600, culminating in a full-blown dump from $570 to $505. However, the ascending (red) line held up, and ETH reclaimed previous levels and is currently consolidating around $530.

Ethereum’s current outlook is very bullish, but any sharp move to the downside coming from Bitcoin will affect it in a major way. Traders should pay close attention to Bitcoin’s moves if they want to trade Ether.

ETH/USD 1-hour Chart

Ethereum’s technicals are a bit confusing, as its daily and monthly overviews are completely bullish, while its weekly overview shows slight signs of neutrality. Its 4-hour technicals, however, are pointing towards the sell-side.

ETH/USD 1-day Technicals

Technical Factors (4-hour Chart):
  • The price is below both its 50-period and its 21-period EMA
  • Price is below its bottom Bollinger band
  • RSI is extremely oversold (19.47)
  • Volume is above average
Key levels to the upside          Key levels to the downside

1: $600                                     1: $510

2: $630                                     2: $500 

3: $735                                      3: $490

Ripple

The fourth-largest cryptocurrency by market cap has performed similarly to the aforementioned two cryptocurrencies. XRP has posted lower highs three times in a row while testing the $0.625 support level each time. However, the last time XRP went towards this level, bears took over and pushed the price further down. XRP bears have seemingly reached exhaustion, and the cryptocurrency is now consolidating around the $0.575 level.

Trading XRP is not advised as trading Bitcoin is (at the moment) both potentially more profitable and more straightforward.

XRP/USD 1-hour Chart

XRP’s technicals on all time-frames are tilted towards the buy-side, with its daily overview being the most bullish time-frame. Its other time-frames show signs of neutrality or even slight bearishness.

XRP/USD 1-day Technicals

Technical factors (4-hour Chart):
  • The price is far below both its 50-period EMA and its 21-period EMA
  • Price is slightly below its bottom Bollinger band
  • RSI is close to being oversold (31.85)
  • Volume is above average
Key levels to the upside          Key levels to the downside

1: $0.625                                   1: $0.475

2: $0.79                                     2: $0.443

3: $0.963                                  3: $0.4


Categories
Crypto Market Analysis

Daily Crypto Review, Nov 25 – Bitcoin Above $19,000: What’s Next?

The cryptocurrency sector has spent the day pushing towards the upside as Bitcoin rallied and reached past $19,000. The largest cryptocurrency by market cap is currently trading for $19,093, representing an increase of 4.37% on the day. Meanwhile, Ethereum lost 0.55% on the day, while XRP gained 14.94%.

 Daily Crypto Sector Heat Map

Verge 63.06% in the past 24 hours, making it the most prominent daily gainer in the top100. It is closely followed by Stellar’s gain of 59.30% and Status’s 31.14% gain. On the other hand, Bitcoin Gold lost 16.21%, making it the most prominent daily loser. SushiSwap lost 12.05% while Balancer lost 7.89%, making them the 2nd and 3rd most prominent daily losers.

Top 10 24-hour Performers (Click to enlarge)

Bottom 10 24-hour Performers (Click to enlarge)

Bitcoin’s market dominance has increased over the course of the day, with its value is currently staying at 61.06%. This value represents a 1% difference to the upside compared to the value it had yesterday.

Daily Crypto Market Cap Chart

The crypto sector capitalization has increased slightly over the course of the day. Its current value is $571.53 billion, representing an $8.86 billion increase compared to our previous report.

_______________________________________________________________________

What happened in the past 24 hours?

_______________________________________________________________________

_______________________________________________________________________

Technical analysis

_______________________________________________________________________

Bitcoin

The largest cryptocurrency by market cap has had an exciting day as its price reached past the $18,500 mark and pushed towards its all-time highs. Bitcoin managed to get to $19,450 before the momentum started dying off. It is currently consolidating just at the $19,000 mark, fighting to stay above it. This move was enabled by a booming altcoin situation, which led to a money pour-over into Bitcoin.

Any trading to the downside is completely irresponsible now due to how Bitcoin is moving. On the other hand, its movement towards the upside is very hectic, and traders should pay attention to when they enter and exit trades. If Bitcoin establishes its presence above the $19,000 mark with confidence, another push that might break the $20,000 all-time high level is entirely possible.

BTC/USD 2-hour Chart

Bitcoin’s technicals are tilted to the bull-side slightly, with only the weekly time-frame being completely bullish. In contrast, its other time-frames contain a hint of neutrality or even bearishness.

BTC/USD 1-day Technicals

Technical factors (4-hour Chart):
  • Price is above its 50-period EMA and at its 21-period EMA
  • Price slightly above its middle Bollinger band
  • RSI is neutral (55.57)
  • Volume is average
Key levels to the upside          Key levels to the downside

1: $19000                                  1: $18500

2: $19500                                  2: $17,850

3: $19,666                                  3: $17,450

Ethereum

Ethereum’s parabolic move, which brought its price from $480 to $625, has seemingly ended, and Ethereum has entered a consolidation/retracement phase. While it was uncertain whether the second-largest cryptocurrency by market cap will stay above $600, the fight for the level has ended, and ETH moved back below it.

Ethereum has a very strong zone of resistance above $600 and all the way up to $632. On the other hand, it has a decently strong support zone at $575-$580. We can expect Ethereum to move in that range in the short-term unless a new breakout occurs.


ETH/USD 2-hour Chart

Ethereum’s technicals are tilted to the bull-side slightly, with only the monthly time-frame being completely bullish. In contrast, its other time-frames contain slight neutrality or even bearishness.

ETH/USD 1-day Technicals

Technical Factors (4-hour Chart):
  • The price is above its 50-period and slightly below its 21-period EMA
  • Price is near its bottom Bollinger band
  • RSI is neutral (50.82)
  • Volume is above average
Key levels to the upside          Key levels to the downside

1: $600                                     1: $510

2: $630                                     2: $500 

3: $735                                      3: $490

Ripple

The fourth-largest cryptocurrency by market cap’s controversial parabolic rise has died down and actually kept most of its gains. XRP has moved back from its recent highs of $0.78 (and even $0.9 on some exchanges) to a steadier $0.68, which is its current price. We can also see that XRP made a double top at the $0.735 mark, as well as a double bottom at the $0.625 support level.

Trading XRP is more manageable now as the volatility has died down, and the zones of support/resistance have been established. However, trading crypto overall is extremely risky at the moment, and only moves to the upside (and possibly sideways movement) should be traded.

XRP/USD 2-hour Chart

XRP’s 4-hour and daily overviews are completely bullish and show no signs of neutrality whatsoever, while its weekly and monthly overviews show slight neutrality or even a hint of bearishness.

XRP/USD 1-day Technicals

Technical factors (4-hour Chart):
  • The price is far above its 50-period EMA and slightly above its 21-period EMA
  • Price is slightly above its middle Bollinger band
  • RSI is neutral (59.98)
  • Volume is above average
Key levels to the upside          Key levels to the downside

1: $0.79                                     1: $0.625 

2: $0.963                                   2: $0.475

3: $1.01                                    3: $0.443


Categories
Crypto Market Analysis

Daily Crypto Review, Nov 24 – XRP’s Push to $0.9 Manipulated? Ether Breaks $600 on Amazing News

The cryptocurrency sector has spent been in the green overall, with Bitcoin consolidating and altcoins booming. The largest cryptocurrency by market cap is currently trading for $18,364, representing a decrease of 0.36% on the day. Meanwhile, Ethereum gained 4.23% on the day, while XRP gained a whopping 54.14%.

 Daily Crypto Sector Heat Map

Stellar 61.98% in the past 24 hours, making it the most prominent daily gainer in the top100. It is closely followed by XRP’s gain of 52.19% and Verge’s 37.77% gain. On the other hand, SushiSwap lost 11.14%, making it the most prominent daily loser. Quant lost 9.44% while Nexo lost 8.27%, making them the 2nd and 3rd most prominent daily losers.

Top 10 24-hour Performers (Click to enlarge)

Bottom 10 24-hour Performers (Click to enlarge)

Bitcoin’s market dominance has reduced drastically over the course of the day, with its value is currently staying at 60.06%. This value represents a 2.6% difference to the downside compared to the value it had yesterday.

Daily Crypto Market Cap Chart

The crypto sector capitalization has increased significantly over the course of the day. Its current value is $562.75 billion, representing a $21.04billion increase compared to our previous report.

_______________________________________________________________________

What happened in the past 24 hours?

_______________________________________________________________________

_______________________________________________________________________

Technical analysis

_______________________________________________________________________

Bitcoin

The largest cryptocurrency by market cap has stayed pretty stable today as it couldn’t break the $18,500 mark. The price has been hovering right under the level for the whole day, and even made a couple of attempts to break it but to no avail. On the other hand, this small zone of resistance and support wasn’t broken to the downside either, as a break below $18,270 could spell a retracement.

This is a prime example of uncertainty due to Bitcoin’s current level (some are taking profits while some are investing). However, trading pullbacks in a bull trend is extremely risky and should be avoided.

BTC/USD 4-hour Chart

Bitcoin’s technicals are divided, with its daily and monthly overviews showing a slight hint of bearishness alongside the bullishness that overwhelms it. In contrast, the 4-hour and weekly overviews are completely bullish.

BTC/USD 1-day Technicals

Technical factors (4-hour Chart):
  • Price is above its 50-period EMA and at its 21-period EMA
  • Price is at its middle Bollinger band
  • RSI is neutral (53.88)
  • Volume is average
Key levels to the upside          Key levels to the downside

1: $18500                                  1: $17,850

2: $19000                                  2: $17,450

3: $19500                                   3: $17,130

Ethereum

With Ethereum’s 2.0 version 0 launch approaching, Ethereum has continued to increase in price. Today’s move was a continuation of the uptrend that started on Nov 0, additionally fueled by the announcement that the deposits required for Ethereum’s 2.0 version 0 to launch have passed the threshold. This news is a big sigh of relief for the ETH devs, as they were wondering if the protocol will reach its goal on time for the Dec 1 launch. This extremely bullish news has pushed Ethereum past $600, which it is now testing.

If Ethereum manages to successfully stay above $600, it will have very little resistance to the upside and basically trade only versus profit-taking sellers.

ETH/USD 1-hour Chart

Ethereum’s 4-hour and monthly time-frames are completely bullish, while its daily and weekly time-frames are slightly more tilted towards the neutral position.

ETH/USD 1-day Technicals

Technical Factors (4-hour Chart):
  • The price is far above its 50-period and slightly above its 21-period EMA
  • Price is between its middle and top Bollinger band
  • RSI is coming out of the overbought territory (59.88)
  • Volume is above average
Key levels to the upside          Key levels to the downside

1: $600                                     1: $510

2: $630                                     2: $500 

3: $735                                      3: $490

Ripple

The fourth-largest cryptocurrency by market cap has exploded to the upside and reached over $0.90 on the US cryptocurrency exchange Coinbase only to crash back down by roughly 30% in mere seconds. This was its highest price since May 2018. The rally was apparently driven by the Coinbase users as XRP did not see the same heights on any other exchange. Bitstamp and Binance saw a high of only $0.79.

Analysts believe that this rally is a culmination of an uptrend triggered in late Oct when an anonymous whale sent an astonishing $50 million worth of XRP at the time to Bitstamp. Ever since then, XRP/USD has been seeing a strong uptrend, up by 128.63% in the past week.

Trading XRP is simply impossible at the moment due to the amount of risk associated with this type of volatility.

XRP/USD 1-hour Chart

XRP’s 4-hour and weekly overviews are completely bullish and show no signs of neutrality, while its daily and monthly overviews show slight neutrality or even slight bearishness.

XRP/USD 1-day Technicals

Technical factors (4-hour Chart):
  • The price is above its 50-period EMA and at its 21-period EMA
  • Price is slightly above its middle Bollinger band
  • RSI is neutral (53.65)
  • Volume is above average
Key levels to the upside          Key levels to the downside

1: $0.79                                     1: $0.625 

2: $0.963                                   2: $0.475

3: $1.01                                    3: $0.443


Categories
Crypto Market Analysis

Daily Crypto Review, Nov 23 – Ethereum Exploding as its 2.0 Update Launch Approaches; Crypto Market in the Green

The cryptocurrency sector has spent the weekend being quite volatile as Bitcoin had a flash crash, which brought its price below $18,000, followed by a rally that brought it back above it. The largest cryptocurrency by market cap is currently trading for $18,461, representing an increase of 0.61% on the day. Meanwhile, Ethereum skyrocketed by gaining 8.13% on the day, while XRP gained 0.09%.

 Daily Crypto Sector Heat Map

Waves 38.43% in the past 24 hours, making it the most prominent daily gainer in the top100. It is closely followed by Horizen’s gain of 31.65% and Numeraire’s 21.56% gain. On the other hand, Terra lost 5.45%, making it the most prominent daily loser. HedgeTrade lost 3.22% while Crypto.com Coin lost 1.65%, making them the 2nd and 3rd most prominent daily losers.

Top 10 24-hour Performers (Click to enlarge)

Bottom 10 24-hour Performers (Click to enlarge)

Bitcoin’s market dominance has reduced drastically over the course of the weekend, with its value is currently staying at 63.2%. This value represents a 2.9% difference to the downside compared to the value it had on Friday.

Daily Crypto Market Cap Chart

The crypto sector capitalization has increased significantly over the course of the weekend. Its current value is $541.71 billion, representing a $34.48 billion increase compared to our previous report.

_______________________________________________________________________

What happened in the past 24 hours?

_______________________________________________________________________

_______________________________________________________________________

Technical analysis

_______________________________________________________________________

Bitcoin

The largest cryptocurrency by market cap has spent the weekend with decently high volatility as its price managed to go from above $18,500 to $17,600 and then back above $18,500 in just one day. While this “flash crash” is behind Bitcoin, the bulls seem to be more and more wary of the new highs, and a retracement before another push towards the upside is quite possible.

Due to many people taking profits and shorting Bitcoin to hedge their portfolios, the largest currency has a hard time going up. However, trading pullbacks in a bull trend is equally as risky. Bitcoin traders would have the most chance of succeeding if they traded only long positions.

BTC/USD 2-hour Chart

Bitcoin’s technicals are semi-divided, with its daily and monthly overviews showing a slight bullish tilt with signs of bears still present. In contrast, the 4-hour and weekly overviews show no signs of bearish presence and are completely bullish.

BTC/USD 1-day Technicals

Technical factors (4-hour Chart):
  • Price is above its 50-period EMA and at its 21-period EMA
  • Price is at its middle Bollinger band
  • RSI is neutral (51.42)
  • Volume is average
Key levels to the upside          Key levels to the downside

1: $18500                                  1: $17,850

2: $19000                                  2: $17,450

3: $19500                                   3: $17,130

Ethereum

Ethereum’s 2.0 version 0 launch is approaching, and Ethereum bulls seem to be back in the game. The second-largest cryptocurrency by market cap broke out of the ascending (red) line and pushed towards the upside, eyeing the $600 resistance level. While the rally was strong, Ethereum bulls started showing exhaustion at $580. With that being said, the move is still not considered over, and there is more opportunity to the upside.

We mentioned on Friday that Ethereum’s downside is quite defined, but that its upside isn’t. With ETH entering territory that was explored only a couple of times, the opportunity for volatility (but also slippage) is increasing.

ETH/USD 4-hour Chart

Ethereum’s 4-hour and daily time-frames are completely bullish, while its longer time-frames (weekly and monthly) are slightly more tilted towards the neutral position.

ETH/USD 1-day Technicals

Technical Factors (4-hour Chart):
  • The price is far above both its 50-period and its 21-period EMA
  • Price is at its top Bollinger band
  • RSI is extremely overbought (72.01)
  • Volume is above average
Key levels to the upside          Key levels to the downside

1: $600                                     1: $510

2: $630                                     2: $500 

3: $735                                      3: $490

Ripple

The fourth-largest cryptocurrency by market cap has, just like Ethereum, had quite an amazing weekend. XRP continued its rally to the upside that began on Nov 20 and reached as high as $0.49 before starting to consolidate. While consolidating, it has seemingly created a triangle formation that should keep its price at bay before ~80% of the formation is done.

While it is quite unknown how XRP will act right now, all chances are that it will stay within the triangle formation’s bounds for some time, at least.

XRP/USD 1-hour Chart

XRP’s daily and weekly overviews are completely bullish and show no signs of neutrality, while its 4-hour and monthly overviews show slight neutrality.

XRP/USD 1-day Technicals

Technical factors (4-hour Chart):
  • The price is above its 50-period EMA and at its 21-period EMA
  • Price is slightly above its middle Bollinger band
  • RSI is neutral (53.65)
  • Volume is above average
Key levels to the upside          Key levels to the downside

1: $0.476                                   1: $0.3328 

2: $0.509                                   2: $0.3244

3: $0.792                                  3: $0.31


Categories
Crypto Market Analysis

Daily Crypto Review, Nov 20 – Bitcoin Conquering $18,000: What’s Next in Store?

The cryptocurrency sector has ended up with the majority of cryptos in the green as Bitcoin continued its rally past $18,000. The largest cryptocurrency by market cap is currently trading for $18,095, representing an increase of 1.31% on the day. Meanwhile, Ethereum gained 1.59% on the day, while XRP gained 2.42%.

 Daily Crypto Sector Heat Map

SushiSwap 31.66% in the past 24 hours, making it the most prominent daily gainer out of the top100 cryptos ranked by market capitalization yet again today. It is closely followed by Waves’ gain of 21.42% and CyberVein’s 17.06% gain. On the other hand, Blockstack lost 8.00%, making it the most prominent daily loser. NEM lost 7.73% while ABBC Coin lost 6.77%, making them the 2nd and 3rd most prominent daily losers.

Top 10 24-hour Performers (Click to enlarge)

Bottom 10 24-hour Performers (Click to enlarge)

Bitcoin’s market dominance has reduced slightly over the course of the day, with its value is currently staying at 66.1%. This value represents a 0.2% difference to the downside when compared to the value it had yesterday.

Daily Crypto Market Cap Chart

The crypto sector capitalization has increased over the course of the day. Its current value is $507.23 billion, representing a $12.16 billion increase compared to our previous report.

_______________________________________________________________________

What happened in the past 24 hours?

_______________________________________________________________________

_______________________________________________________________________

Technical analysis

_______________________________________________________________________

Bitcoin

The largest cryptocurrency by market cap has spent the past 24 hours pushing towards and past the $18,000 level after it has won the fight for $17,850. While the move was quite sudden at one point, it was actually not accompanied by a great increase in volume. This has ultimately caused BTC to end its move slightly above $18,200 and start its consolidation phase.

Due to many people taking profits and shorting to hedge their portfolios, Bitcoin has a hard time going up. However, trading pullbacks is equally as risky. Bitcoin traders would have the most chance of success if they traded only pushes to the upside, accompanied by a decent volume increase.

BTC/USD 1-hour Chart

Bitcoin’s technicals on the 4-hour, daily, and monthly time-frame are all bullish but show some signs of neutral presence. On the other hand, its weekly overview is tilted towards the buy-side and doesn’t show any bearishness.

BTC/USD 1-day Technicals

Technical factors (4-hour Chart):
  • Price is above both its 50-period EMA and its 21-period EMA
  • Price is near its top Bollinger band
  • RSI is neutral (57)
  • Volume is slightly below average
Key levels to the upside          Key levels to the downside

1: $18500                                  1: $17,850

2: $19000                                  2: $17,450

3: $19500                                   3: $17,130

Ethereum

Our yesterday’s call for Ethereum traders was that they should wait for the cryptocurrency to confirm its support level or fall under it, and then trade “with the wave.” Ethereum confirmed its position above the yellow dotted line (top line of the ascending channel) and pushed up instantly. The move brought Ether from $470 all the way to $488 before slowing down and starting to consolidate.

While Ethereum’s downside is quite defined, its upside isn’t. Traders should be wary of Ether’s future pushes to the upside, while they should trade any pullback from the retest of the yellow line.

ETH/USD 1-hour Chart

Ethereum’s 4-hour, daily and monthly time-frames are extremely bullish and show no signs of neutrality or bearishness. On the other hand, its weekly overview is still titled to the bull side but does show significant neutrality.

ETH/USD 1-day Technicals

Technical Factors (4-hour Chart):
  • The price is above both its 50-period and its 21-period EMA
  • Price is near its top Bollinger band
  • RSI is neutral after bouncing from almost being overbought(59.32)
  • Volume is average
Key levels to the upside          Key levels to the downside

1: $490                                     1: $470

2: $500                                     2: $451 

3: $510                                      3: $445

Ripple

The fourth-largest cryptocurrency by market cap has spent the day breaking out of its slow price descent and pushing towards the upside. XRP first changed its price direction at $0.284 and quickly pushed towards the upside, reaching as high as $0.306. However, that price did not hold up, and XRP started trading sideways around the $0.3 mark.

XRP traders should still be safe to trade within the range bound by $0.2855 and $0.31. However, since the range is quite large, traders would be even better if they could spot additional small buy/sell walls in the order books before blindly trading.

XRP/USD 1-hour Chart

XRP’s daily and weekly overviews are completely bullish and show no signs of neutrality, while its 4-hour and monthly overviews show slight neutrality.

XRP/USD 1-day Technicals

Technical factors (4-hour Chart):
  • The price is above its 50-period EMA and at its 21-period EMA
  • Price is near its middle Bollinger band
  • RSI is neutral (53.74)
  • Volume is average
Key levels to the upside          Key levels to the downside

1: $0.31                                     1: $0.28 

2: $0.3244                                 2: $0.27

3: $0.3328                                3: $0.266


Categories
Cryptocurrencies

Is This a Good Time to Invest in Ripple?

When selecting a good crypto investment (actually any investment), even seasoned investors can never be too sure. Ripple is one of the several offerings investors can choose from, and no doubt, it has its fair share of both risks and prospects, just like all other crypto investments. 

Ripple’s (XRP) 2020 performance has shown fluctuations similar to Bitcoin and Ethereum. While part of this performance trend may be attributed to Bitcoin’s overall influence on the crypto market, there are XRP-specific forces attributed to the trend. As an investor, it is worth looking at these forces and XRP’s overall outlook to establish whether this is a good time to buy Ripple. 

This article will look at how XRP has been performing over the last 12 months and the factors that might shape its outcomes in the next several months. 

A Brief Background on Ripple

Ripple was introduced in 2012 as a real-time gross settlement (RTGS) solution. It enables financial institutions to send money instantly in a secure manner across the globe and at cheaper rates than previously possible. Besides the payment infrastructure, Ripple has the XRP currency, which can be used for trading and investment. 

2020’s Performance

XRP started the year at $0.92, and within two months, it had gone to a low of $0.34. In the next month of March, the currency fell to its lowest, exchanging at $0.14. During this period, both Bitcoin and Ethereum were also struggling to fetch competitive rates against the dollar. As such, it is safe to assume that XRP’s performance up to this point was largely a reflection of the economic outlook of the cryptocurrency economy.

From mid-March, XRP grew slightly and seemed to avoid fluctuations until August, when it shot up to $0.31. Again, this spike closely resembles trends observed on Bitcoin and Ethereum, where the two showed some of the highest figures in 2020. From August onwards, XRP has maintained an average of $0.25. 

From XRP’s 2020 financial performance, we can conclude that external forces heavily influence the currency’s outlook in the cryptocurrency economy. Nonetheless, there are unique aspects that either make XRP a good choice for investment or make it a matter that should be put on the shelf in the meantime.

Partnerships and Approvals

Besides the fair financial performance, Ripple has had a lot else going on – 2020 is the year RippleNet made numerous partnerships with banks and other financial institutions. The aim was to help these organizations achieve cheaper, faster, and more secure money transfers worldwide. Notable industry players such as Bank of America, HSBC, and Western Union have tested the solution giving it their vote of confidence. 

Ripple is also increasingly being loved by regulators. The UK Financial Conduct Authority acknowledges XRP as a utility token – a privilege only previously granted to Bitcoin and Ethereum. In the US, Ripple is in good standing with the Securities and Exchange Commission. The currency is also available on all major exchanges, which further strengthens its brand. Positive news about Ripple has also contributed to an increase in the crypto’s appeal among the investor community. 

2021 Outlook

2020 has been quite eventful for Ripple. 2021 might see an increase in activity considering that many of the partnerships the company announced will be maturing in 2021. When these partnerships finally take shape, we’re likely to see FOMO buying due to increased positive news about the currency. In such a case, prices will certainly surge, and predictions of XRP/US exchanges at $1 are not far-fetched.

We have also seen how Ripple’s performance follows Bitcoin’s trend. At the moment, Bitcoin is on the upward projectile, and this growth is likely to continue for several months. There have been substantial fluctuations between resistance and support, but each cycle since July sets a new high. Based on this history, it might take some time before Bitcoin reaches its ultimate resistance and prices start to crash. Since XRP trails Bitcoin’s performance, its investors might have even more time to decide if they need to jump out. 

Advantages of Buying Ripple

#1: It Solves Real-World Problems – Financial institutions have long struggled with transferring money fast and cheaply across the world. Currently, most cross-border money transfers are powered by SWIFT. But this messaging technology is slow and expensive. Ripple’s alternative solves these two age-old problems and thus, makes for a good competitor. The best way to create value, they say, is by solving people’s problems. As Ripple continues to address these challenges, we can only expect its value to grow. 

#2: It Is Currently Affordable – Well, it’s not really affordable considering that it is not a commodity. However, the idea that you can get several hundred XPRs for just $100 is refreshing. As an investor, high volumes are usually satisfying. While XRP currently seems affordable, this might not be the case in the next year or so. Based on the analysis in this article, XRP prices are likely to shoot next year. Come 2022, and your $100 might only afford you 100 XRP.

#3: It’s Got a Huge Market Capitalization – So what does it matter? Market cap is a good indicator of the stability of a company. It does not guarantee anything, but a huge market cap suggests that the market is conservative. This is a good thing for investors with a low-risk appetite because they fancy markets that seem stable, albeit this comes with the promise to oneself that they will not expect anything more than modest returns. Ripple has the third-largest market cap (after Bitcoin and Ethereum). 

#4: Ripple Has Professional Support – While hardcore crypto-enthusiasts think this is undesirable interference, it actually has many benefits. For instance, Ripple’s engineers always ensure the platform is stable. But perhaps, the greatest benefit of this “interference” is that Ripple Labs Inc. can promote the product to financial organizations. These marketing efforts will certainly promote the adoption of Ripple among financial organizations. The result will be a steady growth of the platform, including the XRP currency.

Ripple’s Challenges

There are many sweet things we can say about Ripple. On the flip side, Ripple has some challenges that are worth highlighting. 

  • No new XRPs are being mined, and nearly half of the existing ones are in the hands of, well, the wallets of the company’s directors. If they decide to dump their share, XRP might be badly devalued. This is just a hypothetical situation, and willing investors must assume the company has a future such that the directors will see no need to dump their coins. 
  • Financial institutions are conservative. This means that, despite the promotion efforts the company is making, it may take a long time for the platform to be fully adopted. 

Final Thoughts

Ripple has had a fairly impressive outlook so far. It has shown slow but steady growth in 2020. Although its price remains low compared to previous performance, there are all indications that the currency will become stronger in the coming year. There are several projects in the pipeline, as well as promote efforts to boost the platform’s adoption. It might take long before these results are realized. But all factors considered, there is good reason to believe that this is a good time to invest in Ripple.

Categories
Crypto Market Analysis

Daily Crypto Review, Nov 19 – Ethereum 2.0 Most Likely Not Launching on Time; Crypto Sector Consolidating

The cryptocurrency sector has spent the day trying to consolidate after Bitcoin finished its rally. However, while most cryptocurrencies moved less than 1%, almost every one of them ended up in the red. The largest cryptocurrency by market cap is currently trading for $17,708, representing a decrease of 0.73% on the day. Meanwhile, Ethereum lost 0.49% on the day, while XRP lost 1.53%.

 Daily Crypto Sector Heat Map

OKB gained 17.77% in the past 24 hours, making it the most prominent daily gainer out of the top100 cryptos ranked by market capitalization yet again today. It is closely followed by yearn.finance’s gain of 12.48% and SushiSwap’s 11.73% gain. On the other hand, Band Protocol lost 10.00%, making it the most prominent daily loser. Ampleforth lost 9.81% while Aragon lost 7.26%, making them the 2nd and 3rd most prominent daily losers.

Top 10 24-hour Performers (Click to enlarge)

Bottom 10 24-hour Performers (Click to enlarge)

Bitcoin’s market dominance has stayed at exactly the same place over the course of the day, with its value is currently staying at 66.3%. This value represents no difference when compared to the value it had yesterday.

Daily Crypto Market Cap Chart

The crypto sector capitalization has stayed at the same place over the course of the day. Its current value is $495.07 billion, representing a $3.01 billion decrease compared to our previous report.

_______________________________________________________________________

What happened in the past 24 hours?

_______________________________________________________________________

_______________________________________________________________________

Technical analysis

_______________________________________________________________________

Bitcoin

While it may seem that Bitcoin has had a pretty slow and uneventful day, that is certainly not the case. The largest cryptocurrency by market cap has spent the past 24 hours fighting for the $17,850 level and constantly going over and under it. However, the battle is finished, and BTC remains below $17,850 for the time being.

Many traders and analysts are warning BTC traders of a potential triangle formation forming. They also advise traders to refrain from trading until BTC chooses a clear direction.

BTC/USD 1-hour Chart

Bitcoin’s technicals on the daily, weekly, and monthly time-frame are all bullish but show signs of neutral presence. On the other hand, its 4-hour overview is tilted towards the buy-side and doesn’t show any bearishness.

BTC/USD 1-day Technicals

Technical factors (4-hour Chart):
  • Price is slightly above its 50-period EMA and below its 21-period EMA
  • Price is slightly below its middle Bollinger band
  • RSI is neutral (44.71)
  • Volume is slightly below average
Key levels to the upside          Key levels to the downside

1: $18500                                  1: $17,850

2: $19000                                  2: $17,450

3: $19500                                   3: $17,130

Ethereum

Ethereum has established itself above the top line of the ascending channel (yellow dotted line) and is now trading within a new range, bound by the yellow line as support and a new ascending trend line as resistance. Ethereum’s price seems to be in a correction phase at the moment, so we can expect a retest of the yellow line as well as a possible sharp move afterward.

Ethereum traders should wait for the cryptocurrency to confirm its support level or fall under it, and then trade “with the wave.”

ETH/USD 1-hour Chart

Ethereum’s time-frames are slightly tilted towards the buy-side, with its daily overview showing slight bear presence, while its 4-hour and weekly overviews are showing slight neutrality. On the other hand, its monthly overview is completely bullish.

ETH/USD 1-day Technicals

Technical Factors (4-hour Chart):
  • The price is below both its 50-period and its 21-period EMA
  • Price is between its middle and bottom Bollinger band
  • RSI is neutral (41.77)
  • Volume is slightly below average
Key levels to the upside          Key levels to the downside

1: $490                                     1: $470

2: $500                                     2: $451 

3: $510                                      3: $445

Ripple

The fourth-largest cryptocurrency by market cap had another day of slowly marching towards the downside. However, the extremely low volume may be suggesting that the current price movement is a “calm before the storm,” and that a new big move is coming. Analysts are calling for another push towards the upside. Still, a move down is just as likely with the current state of the sector (the crypto sector is currently in a consolidation/correction phase).

XRP/USD 1-hour Chart

XRP’s daily and weekly overviews are completely bullish and show no signs of neutrality or bearishness. On the other hand, its 4-hour and monthly overviews show slight neutrality.

XRP/USD 1-day Technicals

Technical factors (4-hour Chart):
  • The price is below both its 50-period EMA and its 21-period EMA
  • Price is slightly below its middle Bollinger band
  • RSI is pushing towards being oversold (39.45)
  • Volume is below average
Key levels to the upside          Key levels to the downside

1: $0.31                                     1: $0.28 

2: $0.3244                                 2: $0.27

3: $0.3328                                3: $0.266


Categories
Crypto Market Analysis

Daily Crypto Review, Nov 18 – Bitcoin Encounters Heavy Resistance at $18,500: What Happens Next?

The cryptocurrency sector has spent the day mostly stable and looking at Bitcoin as it kept pushing towards highs unseen after the bull run of late 2017. The largest cryptocurrency by market cap is currently trading for $17.829, representing an increase of 6.64% on the day. Meanwhile, Ethereum gained 2.00% on the day, while XRP lost 1.90%.

 Daily Crypto Sector Heat Map

Nexo gained 14.37% in the past 24 hours, making it the most prominent daily gainer out of the top100 cryptos ranked by market capitalization yet again today. It is closely followed by Bitcoin Gold’s gain of 10.84% and DigiByte’s 9.52% gain. On the other hand, SushiSwap lost 12.92%, making it the most prominent daily loser. Curve DAO Token lost 10.74% while HedgeTrade lost 10.07%, making them the 2nd and 3rd most prominent daily losers.

Top 10 24-hour Performers (Click to enlarge)

Bottom 10 24-hour Performers (Click to enlarge)

Bitcoin’s market dominance has skyrocketed over the course of the day, with its value is currently staying at 66.3%. This value represents a 1.4% difference to the upside compared to the value it had yesterday.

Daily Crypto Market Cap Chart

The crypto sector capitalization has gone up quite a bit over the course of the day. Its current value is $498.06 billion, representing a $20.84 billion increase compared to our previous report.

_______________________________________________________________________

What happened in the past 24 hours?

_______________________________________________________________________

_______________________________________________________________________

Technical analysis

_______________________________________________________________________

Bitcoin

Bitcoin has had a parabolic run to the upside, reaching as high as $18,500 before dropping down. While the price gain was gradual at first, Bitcoin’s final push from $17,600 to $18,500 and then back to nearly $17,000 happened in just a couple of hours. This volatility came to be because BTC encountered heavy resistance at the now-confirmed $18,500 resistance level. Many traders call this move just a temporary pullback before a new high, while a minority is calling a short-term top.

Trading Bitcoin on a bull trend such as this one should only happen in one direction, and that is WITH the trend. Shorting Bitcoin and attempting to catch pullbacks will be far less lucrative due to the size of the move, as well as much riskier.

BTC/USD 1-hour Chart

Bitcoin’s technicals on the 4-hour, daily, and weekly time-frame are all completely bullish and show no signs of bear or neutral presence. On the other hand, its monthly overview is tilted towards the buy-side just slightly and does show some bearishness.

BTC/USD 1-day Technicals

Technical factors (4-hour Chart):
  • Price is far above its 50-period EMA and above its 21-period EMA
  • Price is between its middle and top Bollinger band
  • RSI is stabilizing after leaving the overbought territory (61.38)
  • Volume is descending
Key levels to the upside          Key levels to the downside

1: $18500                                  1: $17,850

2: $19000                                  2: $17,450

3: $19500                                   3: $17,130

Ethereum

Ethereum had had a turbulent 24 hour period, as its price went from fighting for and hovering over the top line of the ascending channel all the way to $495 and then back to $455 before it stabilized at around $475. This move has clearly shown the market another ascending line (red) formed on the ETH/USD chart, which has been tested a couple of times already. This line is Ethereum’s final resistance towards $500.

Ethereum should, as most cryptos at the moment, be traded only to the upside, as trading its pullbacks during a bull market is simply not worth it.

ETH/USD 2-hour Chart

Ethereum’s weekly time-frame shows some neutrality alongside its overall bullish stance, while the other time-frames show complete bullishness.

ETH/USD 1-day Technicals

Technical Factors (4-hour Chart):
  • The price is above both its 50-period and its 21-period EMA
  • Price is slightly above its middle Bollinger band
  • RSI is neutral (55.77)
  • Volume is above average
Key levels to the upside          Key levels to the downside

1: $490                                     1: $470

2: $500                                     2: $451 

3: $510                                      3: $445

Ripple

The fourth-largest cryptocurrency by market cap started off the day by pushing towards the upside and almost reaching its $0.31 resistance level. However, the bears have stepped in and brought XRP’s price down to $0.28 before consolidating in the middle of the range between the two aforementioned levels.

If Bitcoin doesn’t make another sharp move in the short-term, XRP is (yet again) sideways-action crypto. However, if BTC moves, it’s safest to watch Bitcoin and trade along with the bullish moves while discarding the bearish entries.

XRP/USD 4-hour Chart

XRP’s 4-hour, daily, and weekly technicals are tilted towards the buy-side, and while they aren’t showing signs of neutrality, the bullish sentiment isn’t as strong either. The monthly overview does, on the other hand, show clear signs of neutrality.

XRP/USD 1-day Technicals

Technical factors (4-hour Chart):
  • The price is above its 50-period EMA and at its 21-period EMA
  • Price is at its middle Bollinger band
  • RSI is neutral (54.33)
  • Volume is above average
Key levels to the upside          Key levels to the downside

1: $0.31                                     1: $0.28 

2: $0.3244                                 2: $0.27

3: $0.3328                                3: $0.266


Categories
Crypto Market Analysis

Daily Crypto Review, Nov 17 – Bitcoin Crushes $16,500; XRP Explodes to the Upside

The cryptocurrency sector has spent the day trying to reach past its recent highs as Bitcoin pushed past $16,500. The largest cryptocurrency by market cap is currently trading for $16,718, representing an increase of 2.97% on the day. Meanwhile, Ethereum gained 2.34% on the day, while XRP gained an astonishing 10.46%.

 Daily Crypto Sector Heat Map

Curve DAO Token gained 14.27% in the past 24 hours, making it the most prominent daily gainer out of the top100 cryptos ranked by market capitalization yet again today. It is closely followed by yearn.finance’s gain of 12.92% and Litecoin’s 10.99% gain. On the other hand, THORChain lost 7.28%, making it the most prominent daily loser. The Midas Touch Gold lost 6.16% while Uniswap lost 4.22%, making them the 2nd and 3rd most prominent daily losers.

Top 10 24-hour Performers (Click to enlarge)

Bottom 10 24-hour Performers (Click to enlarge)

Bitcoin’s market dominance has decreased slightly over the course of the day, with its value is currently staying at 64.9%. This value represents a 0.1% difference to the downside compared to the value it had yesterday.

Daily Crypto Market Cap Chart

The crypto sector capitalization has gone up very slightly over the course of the day. Its current value is $477.28 billion, representing a $13.89 billion increase compared to our previous report.

_______________________________________________________________________

What happened in the past 24 hours?

_______________________________________________________________________

_______________________________________________________________________

Technical analysis

_______________________________________________________________________

Bitcoin

After confirming its stance above $16,000 after fighting for it over the weekend, the largest cryptocurrency by market capitalization pushed towards $16,500 and attempted to reach new highs. The push was strong as there was no real sell pressure, so Bitcoin reached past $16,500 (and eventually past $16,700) without any real increase in volume. While the $16,500 position has been successfully tested once, the $16,700 level is still not completely won.

Trading Bitcoin on a bull trend such as this one should only happen in one direction: WITH the trend. Shorting Bitcoin and trying to catch pullbacks will be less lucrative due to the size of the move, as well as riskier due to the market sentiment.

BTC/USD 4-hour Chart

Bitcoin’s technicals are tilted towards the buy-side on all four time-frames (4-hour, daily, weekly, and monthly). However, all of them have some form of neutrality, implying that the bullish sentiment is not absolute.

BTC/USD 1-day Technicals

Technical factors (4-hour Chart):
  • Price is far above its 50-period EMA and its 21-period EMA
  • Price is near its top Bollinger band
  • RSI is approaching the overbought territory (65.02)
  • Volume is average
Key levels to the upside          Key levels to the downside

1: $17,000                                 1: $16,700

2: $18000                                  2: $16,500

3: $18500                                   3: $16,000

Ethereum

Ethereum has spent the past two days slowly moving towards the top line of the ascending channel after pulling back to $440. The move was gradual but saw some resistance when it reached the top line. However, Ethereum bulls endured and ultimately broke the level but got instantly stuck at the $470 resistance, which is another wall they have to jump over to remain above this channel.

If Ethereum’s struggles to break the $470 level continue, we may expect a pullback of some sort. With that being said, due to the overall sentiment towards Ethereum (and its 2.0 implementation) as well as the state of the crypto sector, shorting Ethereum should not be a proper trading strategy, even if ETH does pull back.

ETH/USD 4-hour Chart

Ethereum’s 1-day technicals are slightly bullish but are showing signs of neutrality. On the other hand, its 4-hour, weekly, and monthly overviews are completely tilted towards the buy-side.

ETH/USD 1-day Technicals

Technical Factors (4-hour Chart):
  • The price is above both its 50-period and its 21-period EMA
  • Price is slightly above its middle Bollinger band
  • RSI is neutral (57.54)
  • Volume is average
Key levels to the upside          Key levels to the downside

1: $470                                     1: $451

2: $490                                     2: $445 

3: $500                                      3: $420

Ripple

The fourth-largest cryptocurrency by market cap had yet another incredible day, with its price pushing past the $0.27 and even $0.2855 resistance levels. An incredible bull wave brought XRP’s price to $0.3 before it started to pull back slightly. This move has pushed XRP further up towards being the best-performing asset over a 1-week period compared to BTC and ETH, with gains of 18% this week, compared to BTC’s gains of 2.95 and ETH’s gains of 0.76.

Traders can finally look at XRP as a cryptocurrency that isn’t just used for sideways trading, and look for opportunities near new highs.

XRP/USD 4-hour Chart

XRP’s 4-hour, daily, and monthly technicals are slightly tilted towards the buy-side, and all of them are showing more or less signs of neutrality. The weekly overview is, on the other hand, completely bullish.

XRP/USD 1-day Technicals

Technical factors (4-hour Chart):
  • The price is above its 50-period EMA and its 21-period EMA
  • Price is at its top Bollinger band
  • RSI is heavily overbought (76.99)
  • Volume is above average
Key levels to the upside          Key levels to the downside

1: $0.31                                     1: $0.2855 

2: $0.3244                                 2: $0.27

3: $0.3328                                3: $0.266


Categories
Crypto Market Analysis

Daily Crypto Review, Nov 16 – Bitcoin to be Censored? Blockseer Mining Pool Enters the Game

The cryptocurrency sector has spent the weekend pretty flat as Bitcoin was experiencing a period of low volatility. The largest cryptocurrency by market cap is currently trading for $16,272, representing an increase of 1.37% on the day. Meanwhile, Ethereum lost 1.19% on the day, while XRP lost 0.69%.

 Daily Crypto Sector Heat Map

SushiSwap gained 13.81% in the past 24 hours, making it the most prominent daily gainer out of the top100 cryptos ranked by market capitalization yet again today. It is closely followed by THORChain’s gain of 9.54% and Curve DAO Token’s 4.80% gain. On the other hand, ABBC Coin lost 45.16%, making it the most prominent daily loser. The Midas Touch Gold lost 8.96% while Ampleforth lost 8.88%, making them the 2nd and 3rd most prominent daily losers.

Top 10 24-hour Performers (Click to enlarge)

Bottom 10 24-hour Performers (Click to enlarge)

Bitcoin’s market dominance has decreased slightly over the weekend, with its value is currently staying at 65%. This value represents a 0.3% difference to the downside compared to the value it had on Friday.

Daily Crypto Market Cap Chart

The crypto sector capitalization has gone up very slightly over the course of the weekend. Its current value is $463.37 billion, representing an $0.51 billion increase compared to our previous report.

_______________________________________________________________________

What happened in the past 24 hours?

_______________________________________________________________________

Blockseer, a US-based DMG Blockchain Solutions’ subsidiary, has recently announced a private beta version of a brand new Bitcoin mining pool. This particular mining pool is, however, quite unique and different. The Blockseer Mining Pool will, unlike any other mining pool, censor transactions from wallets that are blacklisted. They also plan on mandating the miners to undergo KYC procedure, according to marketing materials.

Any new blocks generated by the Blockseer pool will include only filtered transactions, and the filters will be based on the Walletscore’s data.

While some agree that this way of transacting might be the future, the vast majority of public figures say that this is pure censorship and that it goes against the basic principles of Bitcoin as a free cryptocurrency, where a transaction is a transaction, no matter where it comes from.

_______________________________________________________________________

Technical analysis

_______________________________________________________________________

Bitcoin

The largest cryptocurrency by market capitalization has spent the weekend experiencing very low volatility while fighting an incredibly important battle. Bitcoin was fighting to stay above the $16,000 mark after the move to the upside has died down at $16,500 on Nov 13, thus triggering a pullback.

An interesting outlook on Bitcoin is that the now won fight for $16,000 has created a higher low, and Bitcoin might push even higher in the following days. Traders should pay attention to volume increases around the $16,400-$16,500 mark.

BTC/USD 4-hour Chart

Bitcoin’s technicals are tilted slightly to the buy-side on the 4-hour, daily and weekly time-frames. However, all of these time-frames show signs of neutrality. On the other hand, its monthly overview is completely bullish.

BTC/USD 1-day Technicals

Technical factors (4-hour Chart):
  • Price is above its 50-period EMA and at its 21-period EMA
  • Price is near its middle Bollinger band
  • RSI is neutral (58.99)
  • Volume is slightly above average
Key levels to the upside          Key levels to the downside

1: $16,500                                 1: $16,000

2: $16,700                                 2: $15,480

3: $17,000                                  3: $14,640

Ethereum

Ethereum has, just like Bitcoin, spent the weekend fighting to stay above its support level. The second-largest cryptocurrency by market cap, however, did not manage to win its fight. Ether has triggered a pullback after bouncing from the $478 level, which caused its price to first hover around the yellow top ascending channel line until it finally broke it to the downside. The move was stopped at $440, and Ethereum has since recovered and is currently trading just below the yellow line.

Our call on Friday for Ethereum dropping below the line was correct, as ETH did exactly as expected. However, the combination of factors at the moment make Ethereum a not-so-good trade, and traders should perhaps look at other options before choosing to trade it.

ETH/USD 4-hour Chart

Ethereum’s technicals are extremely bullish on its weekly and monthly time-frames and very bullish (but not as much as the aforementioned time-frames) on its daily overview. Its 4-hour overview, however, is tilted heavily towards the sell-side.

ETH/USD 1-day Technicals

Technical Factors (4-hour Chart):
  • The price is slightly above its 50-period and slightly below its 21-period EMA
  • Price is slightly below its middle Bollinger band
  • RSI is neutral (47.32)
  • Volume is average
Key levels to the upside          Key levels to the downside

1: $470                                     1: $451

2: $490                                     2: $445 

3: $500                                      3: $420

Ripple

The fourth-largest cryptocurrency by market cap had an incredible day on Friday, as its price pushed above 2 of its major resistance levels. XRP has managed to, in a span of around 12 hours, push past the $0.26 and $0.266 levels and took the weekend to consolidate above them and create a strong foundation. The $0.266 level was tested as support twice already, successfully both times.

Traders can finally look at XRP as a crypto that moves somewhere else than sideways, and look for opportunities in places other than the range between $0.2454 and $0.26.

XRP/USD 4-hour Chart

XRP’s technicals are slightly tilted towards the buy-side on all time-frames, with more or less neutrality signs. The important change from the last report (and many reports before) is XRP’s monthly overview, which has finally turned bullish.

XRP/USD 1-day Technicals

Technical factors (4-hour Chart):
  • The price is above its 50-period EMA and slightly above at its 21-period EMA
  • Price is between its middle and top Bollinger band
  • RSI is neutral (59.63)
  • Volume is average
Key levels to the upside          Key levels to the downside

1: $0.27                                     1: $0.266

2: $0.2855                                 2: $0.26

3: $0.31                                    3: $0.2454


Categories
Crypto Market Analysis

Daily Crypto Review, Nov 13 – Bitcoin Above $16,000: What’s Next?

The cryptocurrency sector has spent the day equally divided between cryptos that ended up in the red and the green. The largest cryptocurrency by market cap pushed past its $16,000 mark and is currently trading for $16,291, representing an increase of 3.26% on the day. Meanwhile, Ethereum lost 0.15% on the day, while XRP gained 0.45%.

 Daily Crypto Sector Heat Map

Blockstack gained 33.78% in the past 24 hours, making it the most prominent daily gainer out of the top100 cryptos ranked by market capitalization yet again today. It is closely followed by Dash’s gain of 13.33% and Decred’s 8.98% gain. On the other hand, ABBC Coin lost 12.08%, making it the most prominent daily loser. Ampleforth lost 11.75% while Aragon lost 10.85%, making them the 2nd and 3rd most prominent daily losers.

Top 10 24-hour Performers (Click to enlarge)

Bottom 10 24-hour Performers (Click to enlarge)

Bitcoin’s market dominance has increased since we last reported, with its value is currently staying at 65.3%. This value represents a 0.8% difference to the upside compared to the value it had yesterday.

Daily Crypto Market Cap Chart

The crypto sector capitalization has gone up over the course of the day. Its current value is $462.86 billion, representing an $8.70 billion increase compared to our previous report.

_______________________________________________________________________

What happened in the past 24 hours?

_______________________________________________________________________

_______________________________________________________________________

Technical analysis

_______________________________________________________________________

Bitcoin

The largest cryptocurrency by market capitalization has tested the $16,000 mark for a long time, failing a couple of times as profit-taking chipped away too much bull power. However, BTC has officially broken the $16,000 resistance today, turning it into support. The move that pushed it past this mark has ended right at the $16,500 resistance, which held up quite well. Many say the reason for the move past $16,000 is that banks and firms are moving their funds into BTC due to uncertainties in the traditional markets (major indexes traded slightly in the red yesterday). An engulfing candle that followed the last green candle of the move, as well as RSI bouncing off of the overbought area, show that a correction is the most likely option at the moment.

Slow and steady increases in volume accompanied each of Bitcoin’s moves. Traders can use this info to enter and exit trades safely.

BTC/USD 4-hour Chart

Bitcoin’s technicals are bullish overall but are split between the 4-hour and weekly time-frames, which are more tilted towards the neutral position, and daily and monthly time-frames, which are completely bullish.

BTC/USD 1-day Technicals

Technical factors (4-hour Chart):
  • Price is well above its 50-period EMA and its 21-period EMA
  • Price is near its top Bollinger band
  • RSI is near the overbought territory (64.03)
  • Volume is slightly above average
Key levels to the upside          Key levels to the downside

1: $16,500                                 1: $16,000

2: $16,700                                 2: $15,480

3: $17,000                                  3: $14,640

Ethereum

Ethereum has continued its upward path, supported by its ascending channel top line. The second-largest cryptocurrency by market cap managed to hold itself above this level, effectively slowly increasing in price due to the slope of the support line. However, it is yet to be seen if ETH can stay above this level for long, and a potential drop below the line is quite possible.

Ethereum traders should look for ETH dropping below the top line of the ascending channel and trade off of that.

ETH/USD 4-hour Chart

Ethereum’s technicals are bullish on all time-frames, with its 4-hour time-frame being more tilted towards the neutral position and longer time-frames being completely bullish.

ETH/USD 1-day Technicals

Technical Factors (4-hour Chart):
  • The price is above its 50-period and slightly above its 21-period EMA
  • Price is slightly above its middle Bollinger band
  • RSI is neutral (53.64)
  • Volume is average
Key levels to the upside          Key levels to the downside

1: $470                                     1: $451

2: $490                                     2: $445 

3: $500                                      3: $420

Ripple

The fourth-largest cryptocurrency by market cap has had a slow day of sideways action within the range it is in for almost a week. XRP has moved slightly towards the middle of the range after it failed to break the $0.26 resistance level, entering a period of low volatility.

Traders shouldn’t really be interested in XRP at the moment due to its low volatility. However, those that want to trade XRP can enter trades with targets and stop-losses that correspond to the current support/resistance levels.

XRP/USD 4-hour Chart

XRP’s technicals on the 4-hour and daily time-frame have changed its stance from bullish/neutral to straight bullish, while its weekly time-frame is still almost completely neutral. Its monthly overview shows strong bearish sentiment.

XRP/USD 1-day Technicals

Technical factors (4-hour Chart):
  • The price is above its 50-period EMA and at its 21-period EMA
  • Price is at its middle Bollinger band
  • RSI is neutral (50.34)
  • Volume is slightly below average
Key levels to the upside          Key levels to the downside

1: $0.26                                     1: $0.2454

2: $0.266                                   2: $0.235

3: $0.27                                    3: $0.227


Categories
Crypto Market Analysis

Daily Crypto Review, Nov 12 – Bitcoin Formed a Triple Top? Ethereum Accidentally Hard Forks

The cryptocurrency sector has spent the day mostly consolidating, with roughly the same amount of cryptocurrencies ending the day in the green and the red. The largest cryptocurrency by market cap is currently trading for $15,802, representing an increase of 2.68% on the day. Meanwhile, Ethereum gained 0.24% on the day, while XRP gained 0.60%.

 Daily Crypto Sector Heat Map

Blockstack gained 17.15% in the past 24 hours, making it the most prominent daily gainer out of the top100 cryptos ranked by market capitalization. It is closely followed by OMG Network’s gain of 12.03% and ICON’s 11.46% gain. On the other hand, yearn.finance lost 10.37%, making it the most prominent daily loser. Loopring lost 9.34% while Synthetix lost 8.90%, making them the 2nd and 3rd most prominent daily losers.

Top 10 24-hour Performers (Click to enlarge)

Bottom 10 24-hour Performers (Click to enlarge)

Bitcoin’s market dominance has increased slightly since we last reported, with its value is currently staying at 64.5%. This value represents a 0.6% difference to the upside compared to the value it had yesterday.

Daily Crypto Market Cap Chart

The crypto sector capitalization has gone up over the course of the day. Its current value is $454.16 billion, representing an $8.04 billion increase compared to our previous report.

_______________________________________________________________________

What happened in the past 24 hours?

_______________________________________________________________________

Ethereum had quite a bad day, as its consensus reached an unexpected hard fork. This issue is considered the one holding the most weight ever since the DAO debacle from 4 years ago. The developers are still looking into the issue, and things will be fully understood at a later date.

Ethereum essentially hard forked right when its developers introduced a new update to the chain, and those who haven’t upgraded yet (including Blockchair, Infura, and other miners) got stuck in a minority chain for around 30 blocks (2 hours).

_______________________________________________________________________

Technical analysis

_______________________________________________________________________

Bitcoin

The largest cryptocurrency by market capitalization has pushed towards the upside, reaching as far as $15,990 but not being able to break the $16,000 mark. This failure to break its immediate resistance level has caused another (third) top to form, marking a possible short-term trend reversal as a possibility if Bitcoin doesn’t move up quickly.

Traders should trade carefully around this level and be prepared to trade the pullback or the spike. While these “, ride the trend” trades are hard to predict in terms of when they start, they are easy to trade once the entry happens.

BTC/USD 4-hour Chart

Bitcoin’s technicals are bullish on all time-frames. However, its 4-hour and monthly time-frames are completely bullish, while its daily and weekly overviews are showing signs of neutrality or even slight bear presence.

BTC/USD 1-day Technicals

Technical factors (4-hour Chart):
  • Price is above its 50-period EMA and slightly above its 21-period EMA
  • Price is slightly above its middle Bollinger band
  • RSI is near the overbought territory (64.15)
  • Volume is slightly above average
Key levels to the upside          Key levels to the downside

1: $16,000                                 1: $15,480

2: $16,400                                 2: $14,640

3: $16,700                                  3: $14,100

Ethereum

Ethereum has stayed above the top line of its ascending channel but could not break the resistance zone above $470. However, its price didn’t react negatively to the news of the algorithm failure and an unplanned mini hard fork, which is quite a bullish outcome of events.

Ethereum traders should watch out for how the second-largest cryptocurrency by market cap navigates the range between the top line of the ascending channel and its $470 resistance level.

ETH/USD 4-hour Chart

Ethereum’s technicals are bullish on all time-frames, with its 4-hour and monthly time-frames being completely bullish and its daily and weekly overviews showing signs of neutrality or even slight bear presence.

ETH/USD 1-day Technicals

Technical Factors (4-hour Chart):
  • The price is above its 50-period and slightly above its 21-period EMA
  • Price is above its middle Bollinger band
  • RSI is neutral (60.34)
  • Volume is average
Key levels to the upside          Key levels to the downside

1: $470                                     1: $451

2: $490                                     2: $445 

3: $500                                      3: $420

Ripple

The fourth-largest cryptocurrency by market cap has suffered a minor pullback after failing to break its immediate resistance level ($0.26). XRP is still trading within a range bound by $0.2454 to the downside and $0.26 to the upside, while its range is even more narrow lately, as its price is hovering only the top portion of the range.

Traders still have the opportunity to trade XRP’s sideways action without much risk. On the other hand, if the volume does increase drastically, a move towards the upside is much more likely, unless Bitcoin’s potential move down brings every other crypto down with it.

XRP/USD 4-hour Chart

XRP’s technicals on the 4-hour, daily, and weekly time-frame are bullish with slight hints of neutrality. On the other hand, its monthly overview is heavily tilted towards the sell-side.

XRP/USD 1-day Technicals

Technical factors (4-hour Chart):
  • The price above its 50-period EMA and slightly above its 21-period EMA
  • Price is slightly above its middle Bollinger band
  • RSI is neutral (55.12)
  • Volume is average
Key levels to the upside          Key levels to the downside

1: $0.26                                     1: $0.2454

2: $0.266                                   2: $0.235

3: $0.27                                    3: $0.227


Categories
Crypto Market Analysis

Daily Crypto Review, Nov 11 – Mempool Cleared! Bitcoin Fees Plummet

The cryptocurrency sector has spent the day consolidating and preparing for the next move and setting up valid technical formations. The largest cryptocurrency by market cap is currently trading for $15,377, representing an increase of 0.01% on the day. Meanwhile, Ethereum gained 2.08% on the day, while XRP gained 1.14%.

 Daily Crypto Sector Heat Map

Loopring gained 30.64% in the past 24 hours, making it the most prominent daily gainer out of the top100 cryptos ranked by market capitalization. It is closely followed by UMA’s gain of 24.45% and yearn.finance’s 17.59% gain. On the other hand, Decentraland lost 13.96%, making it the most prominent daily loser. Decred lost 9.94% while HedgeTrade lost 8.76%, making them the 2nd and 3rd most prominent daily losers.

Top 10 24-hour Performers (Click to enlarge)

Bottom 10 24-hour Performers (Click to enlarge)

Bitcoin’s market dominance has decreased slightly since we last reported, with its value is currently staying at 63.9%. This value represents a 0.3% difference to the downside compared to the value it had yesterday.

Daily Crypto Market Cap Chart

The crypto sector capitalization has gone up slightly over the course of the day. Its current value is $446.12 billion, representing a $4.38 billion increase compared to our previous report.

_______________________________________________________________________

What happened in the past 24 hours?

_______________________________________________________________________

Bitcoin’s transaction fees have plummeted as its mempool got cleared, reaching its smallest size since the middle of Oct. This means that hundreds, if not thousands of unconfirmed transactions, got included in the recent blocks, leaving the blockchain clear and unclogged. The mempool clearing has been attributed to a 42% increase in hash rate, which happened just a couple of days ago as Chinese miners completed their migration from the Sechuan region.

At the moment, the median transaction fee is 3 sat/byte, or roughly $0.11.

_______________________________________________________________________

Technical analysis

_______________________________________________________________________

Bitcoin

The largest cryptocurrency by market capitalization has spent the day trading in a narrow range between $15,100 and $15,500, trying to pass the $15,480 level with confidence. However, as this did not happen, we are seeing a possible lower high forming. The flat RSI and volume dropping signal a “calm before the storm,” which means that traders should prepare for a sharp move soon.

Traders should wait for Bitcoin to choose its short-term direction and trade only if Bitcoin confidently goes above $15,480 or below $15,420 with significant volume.

BTC/USD 4-hour Chart

Bitcoin’s technicals are bullish on all time-frames. However, its shorter time-frames are showing signs of neutrality, or even slight bearish presence, while its monthly overview is completely bullish.

BTC/USD 1-day Technicals

Technical factors (4-hour Chart):
  • Price is above its 50-period EMA and right at its 21-period EMA
  • Price is at its middle Bollinger band
  • RSI is neutral (54.44)
  • Volume is average
Key levels to the upside          Key levels to the downside

1: $15,480                                 1: $15,420

2: $16,400                                 2: $14,640

3: $16,700                                  3: $14,100

Ethereum

Ethereum has, unlike Bitcoin, had a great day as its price propelled past the top line of the ascended channel. The price increase is mainly attributed to great news regarding its 2.0 update adoption, as its deposit contracts top 22.5 million only one week after launch.

However, while the price increase is certainly a great thing, Ethereum is currently entering a strong resistance zone (above $460), which may cause problems for the ETH bulls.

Traders should pay close attention to how (and if) Ethereum pulls back or continues upwards. If Bitcoin doesn’t make any moves, it’s safe to assume that Ethereum will pullback in the short future.

ETH/USD 4-hour Chart

Ethereum’s technicals show “extreme buy” daily, weekly, and monthly time-frames, while its 4-hour overview is slightly more neutral.

ETH/USD 1-day Technicals

Technical Factors (4-hour Chart):
  • The price is above both its 50-period and its 21-period EMA
  • Price is at its top Bollinger band
  • RSI is neutral (60.73)
  • Volume is average
Key levels to the upside          Key levels to the downside

1: $470                                     1: $451

2: $490                                     2: $445 

3: $500                                      3: $420

Ripple

The fourth-largest cryptocurrency by market cap has continued trading within a range, bound by $0.2454 to the downside and $0.26 to the upside. XRP has spent the day slowly increasing its price, but the one attempt it had of pushing past $0.26 got shut down quickly.

Traders are safe to assume that XRP will trade within the same range and that they can trade the sideways action. On the other hand, if the volume increases drastically, a move towards the upside is much more likely than one towards the downside (unless fueled by Bitcoin’s move).

XRP/USD 4-hour Chart

XRP’s technicals on the 4-hour and weekly time-frame are slightly bullish with slight hints of neutrality, while its daily overview is bullish. On the other hand, its monthly overview is tilted towards the sell-side.

XRP/USD 1-day Technicals

Technical factors (4-hour Chart):
  • The price above its 50-period EMA and slightly above its 21-period EMA
  • Price is slightly above its middle Bollinger band
  • RSI is neutral (52.36)
  • Volume is average
Key levels to the upside          Key levels to the downside

1: $0.26                                     1: $0.2454

2: $0.266                                   2: $0.235

3: $0.27                                    3: $0.227


Categories
Crypto Market Analysis

Daily Crypto Review, Nov 10 – Bitcoin Miners Migrated: BTC Hash Rate Up 42%

The cryptocurrency sector has spent the day mostly consolidating and preparing for the next move and setting up technical formations. The largest cryptocurrency by market cap is currently trading for $15,288, representing a decrease of 1.14% on the day. Meanwhile, Ethereum lost 1.70% on the day, while XRP lost 0.8%.

 Daily Crypto Sector Heat Map

Civic gained an astonishing 101.35% in the past 24 hours, making it the most prominent daily gainer out of the top100 cryptos ranked by market capitalization. It is closely followed by Golem’s gain of 29.25% and Decentraland’s 22.26% gain. On the other hand, Loopring lost 9.76%, making it the most prominent daily loser. Synthetix lost 7.39% while Energy Web Token lost 7.35%, making them the 2nd and 3rd most prominent daily losers.

Top 10 24-hour Performers (Click to enlarge)

Bottom 10 24-hour Performers (Click to enlarge)

Bitcoin’s market dominance has decreased slightly since we last reported, with its value is currently staying at 64.2%. This value represents a 0.1% difference to the downside compared to the value it had yesterday.

Daily Crypto Market Cap Chart

The crypto sector capitalization has gone down slightly over the course of the day. Its current value is $441.50 billion, representing a $4.29 billion decrease compared to our previous report.

_______________________________________________________________________

What happened in the past 24 hours?

_______________________________________________________________________

The past 24 hours were characterized by a slow price movement of the crypto sector. However, a lot of important news reached the public’s eye. Bitcoin Miners finished up on Sichuan’s migration, triggering a hash rate spike of 42% in the past 2 days. Ethereum has been performing great, and news of its 2.0 version is all over the place, with the most recent one being that the number of addresses surpassing 32 ETH (the amount required to be a validator) is at an all-time high. On the other hand, Bitcoin SV brought bad news to the sector, as its multi-sig feature got compromised, causing enormous losses for its users.

_______________________________________________________________________

Technical analysis

_______________________________________________________________________

Bitcoin

The largest cryptocurrency by market capitalization is trading in a very uncertain zone at the moment. Its price has most likely created a double top formation, indicating a possible pullback in the short-term. This prediction is even more convincing as we can see that Bitcoin can’t get past the $15,480 resistance after trying for over 12 hours. However, the overall sentiment around the cryptocurrency is extremely bullish, and its downside is protected by the ascending (yellow) line.

With that being said, traders should wait for Bitcoin to choose its direction and trade only if Bitcoin spikes above $15,480 or below $15,420 with significant volume.

BTC/USD 4-hour Chart

Bitcoin’s technicals are bullish on all time-frames. The only difference compared to yesterday was that every single time-frame is completely bullish and with almost no neutrality present (as opposed to yesterday, when neutral sentiment could be seen on some overviews).

BTC/USD 1-day Technicals

Technical factors (4-hour Chart):
  • Price is above its 50-period EMA and right at its 21-period EMA
  • Price is at its middle Bollinger band
  • RSI is neutral (53.60)
  • Volume is average
Key levels to the upside          Key levels to the downside

1: $16,400                                 1: $15,480

2: $16,665                                 2: $14,640

3: $17,260                                  3: $14,100

Ethereum

Ethereum has been playing around the upper line of the ascending channel (yellow dotted line) and constantly going above and under it. At the moment, its price is under the line, and any attempts of getting past it have been extinguished quickly. This most likely means that Ethereum failed to establish itself above the $451 level, which could trigger a correction towards the 50-period moving average, and ultimately the bottom channel line.

Traders should pay close attention to volume, as they will not have a lot of time to join in on the trade towards the downside. Placing a stop-loss right above the ascending channel top line should be a “safe bet.”

ETH/USD 4-hour Chart

Ethereum’s technicals are tilted heavily towards the buy-side on its 4-hour and monthly overview, while the neutral sentiment is heavily present on its daily and weekly charts.

ETH/USD 1-day Technicals

Technical Factors (4-hour Chart):
  • The price is above its 50-period and slightly above its 21-period EMA
  • Price is at its middle Bollinger band
  • RSI is neutral (55.58)
  • Volume is slightly elevated
Key levels to the upside          Key levels to the downside

1: $451                                     1: $445

2: $470                                     2: $420 

3: $490                                      3: $415

Ripple

The fourth-largest cryptocurrency by market cap continued its consolidation phase right above the $0.2454 level, which is considered a major pivot point in XRP’s trading in the recent past. XRP created a double bottom at this level, possibly indicating a push towards the $0.26 in the short term.

Traders should still be safe to assume that XRP will trade within the range and that they can trade the sideways action. However, if the volume increases drastically, a move towards the upside is much more likely (if not fueled by Bitcoin’s move).

XRP/USD 4-hour Chart

XRP’s technicals on the 4-hour, daily, and weekly time-frame are all tilted towards the buy-side. However, neutral sentiment can be seen in all of them. On the other hand, its monthly overview also has the same neutrality amount but is tilted towards the sell-side.

XRP/USD 1-day Technicals

Technical factors (4-hour Chart):
  • The price slightly above its 50-period EMA and at its 21-period EMA
  • Price is slightly below its middle Bollinger band
  • RSI is neutral (49.69)
  • Volume is average
Key levels to the upside          Key levels to the downside

1: $0.26                                     1: $0.2454

2: $0.266                                   2: $0.235

3: $0.27                                    3: $0.227


Categories
Crypto Market Analysis

Daily Crypto Review, Nov 9 – Bitcoin at $15,500; What Will Biden’s Win Bring to the Crypto Sector?

The cryptocurrency sector has spent the weekend trying to recover and regain previous highs after most cryptocurrencies briefly dropped in price due to the election uncertainty. The most recent spike was triggered by the end of the US presidential elections, which caused mass uncertainty in the markets, as well as by now-President Biden hiring pro-crypto Gary Gensler as a member of his team. The largest cryptocurrency by market cap is currently trading for $15,433, representing an increase of 2.73% on the day. Meanwhile, Ethereum gained 2.94% on the day, while XRP gained 0.34%.

 Daily Crypto Sector Heat Map

Aave gained 20.05% in the past 24 hours, making it the most prominent daily gainer out of the top100 cryptos ranked by market capitalization. It is closely followed by THORChain’s gain of 17.75% and NEAR Protocol’s 17.57% gain. On the other hand, Celo lost 7.03%, making it the most prominent daily loser. The rest of the cryptocurrencies barely suffered any losses in the past 24 hours.

Top 10 24-hour Performers (Click to enlarge)

Bottom 10 24-hour Performers (Click to enlarge)

Bitcoin’s market dominance has decreased slightly since we last reported, with its value is currently staying at 64.3%. This value represents a 1% difference to the downside compared to the value it had on Friday.

Daily Crypto Market Cap Chart

The crypto sector capitalization has gone up slightly over the weekend. Its current value is $446.21 billion, representing a $4.85 billion increase compared to our previous report.

_______________________________________________________________________

What happened in the past 24 hours?

_______________________________________________________________________

_______________________________________________________________________

Technical analysis

_______________________________________________________________________

Bitcoin

The largest cryptocurrency by market capitalization has entered a state of uncertainty due to how close the US presidential election process was, and even had a brief drop due to less crypto-friendly Joe Biden winning. However, a new announcement regarding Biden hiring crypto-friendly advisors, as well as general stabilization of the political sphere, has triggered a spike in both stocks and Bitcoin.

Bitcoin has, after a brief drop below the yellow ascending line, come back above it, but only slightly as the move to the upside was stopped by the $15,420-$15,480 level.

Traders should wait for Bitcoin to “decide” whether it will go above $15,480 or below $15,420 and trade off of that.

BTC/USD 4-hour Chart

Bitcoin’s technicals are bullish on all time-frames, with smaller time-frames showing a bit of neutrality and longer time-frames being completely bullish.

BTC/USD 1-day Technicals

Technical factors (4-hour Chart):
  • Price is above both its 50-period EMA and its 21-period EMA
  • Price is at its middle Bollinger band
  • RSI is neutral (60.66)
  • Volume is slightly elevated
Key levels to the upside          Key levels to the downside

1: $15,480                                 1: $14,640

2: $16,665                                 2: $14,100

3: $17,260                                  3: $13,900

Ethereum

Ethereum has had an amazing weekend, with its price skyrocketing past the top line of the ascending channel. While most analysts thought that the second-largest cryptocurrency by market cap couldn’t get back above this line after the Nov 7 drop, Ethereum has proven them wrong and went above $450.

However, the immediate area above $450 is a zone of strong resistance, and Ethereum traders have to watch out how they enter trades here. The safest pick when it comes to trading Ethereum right now would be “riding the wave” towards the upside when ETH decides to spike.


ETH/USD 4-hour Chart

Ethereum’s technicals are almost completely neutral on the 4-hour and daily time-frames, while its longer time-frames are heavily tilted towards the buy-side.

ETH/USD 1-day Technicals

Technical Factors (4-hour Chart):
  • The price is above both its 50-period and its 21-period EMA
  • Price slightly above its middle Bollinger band
  • RSI is neutral (62.07)
  • Volume is elevated
Key levels to the upside          Key levels to the downside

1: $451                                     1: $445

2: $470                                     2: $420 

3: $490                                      3: $415

Ripple

The fourth-largest cryptocurrency by market cap had ended its ascension on Nov 7, when most cryptocurrencies dropped heavily in price. However, while most cryptos managed to get back near its previous highs, XRP failed to do so. It is currently trading in a wide range between $0.2454 and $0.26, after stopping its upward move at the ~$0.256 level.

Traders can consider trading XRP’s sideways movement as the volume is now reduced, and the possibility of a strong move is low. However, if such a move does happen, it could be easily predicted due to XRP’s current position.

XRP/USD 4-hour Chart

XRP’s technicals on the 4-hour, daily, and weekly slightly bullish, with some hints of neutrality. Its monthly overview, however, is still tilted towards the sell-side.

XRP/USD 1-day Technicals

Technical factors (4-hour Chart):
  • The price slightly above its 50-period EMA and at its 21-period EMA
  • Price is slightly below its middle Bollinger band
  • RSI is neutral (53.59)
  • Volume is average
Key levels to the upside          Key levels to the downside

1: $0.26                                     1: $0.2454

2: $0.266                                   2: $0.235

3: $0.27                                    3: $0.227


Categories
Crypto Market Analysis

Daily Crypto Review, Nov 6 – Bitcoin Zooming Past $15,000: How Far Can it Go Before Pulling Back?

The cryptocurrency sector has exploded to the upside as Bitcoin keeps paving the path towards highs only seen during the bull run of 2017/2018. The largest cryptocurrency by market cap is currently trading for $15.632, representing an increase of 10.1% on the day. Meanwhile, Ethereum gained 7.74% on the day, while XRP gained 4.5%.

 Daily Crypto Sector Heat Map

Uniswap gained 28.39% in the past 24 hours, making it the most prominent daily gainer out of the top100 cryptos ranked by market capitalization. It is closely followed by Aave’s gain of 25.21% and NEAR Protocol’s 23.87% gain. On the other hand, The Midas Touch Gold lost 6.16%, making it the most prominent daily loser. It is followed by Numeraire’s loss of 5.03% and Celo’s loss of 3.94%.

Top 10 24-hour Performers (Click to enlarge)

Bottom 10 24-hour Performers (Click to enlarge)

Bitcoin’s market dominance level has increased slightly since we last reported, with its value is currently staying at 65.3%. This value represents a 0.4% difference to the upside when compared to the value it had yesterday.

Daily Crypto Market Cap Chart

The crypto sector capitalization has skyrocketed in the past 24 hours. Its current value is $440.94 billion, representing a $28.77 billion increase compared to our previous report.

_______________________________________________________________________

What happened in the past 24 hours?

_______________________________________________________________________

_______________________________________________________________________

Technical analysis

_______________________________________________________________________

Bitcoin

The largest cryptocurrency by market capitalization has surged past the $15,000 psychological resistance and entered the zone last seen in Jan 2018, right before the BTC crash. Bitcoin scored double-digit gains on the day and destroyed the $14,640 resistance on the way, turning it into support. While it is currently slowing down as it is approaching $16,000, many analysts call for $17,000 before a pullback.

Traders should wait for Bitcoin to start pulling back if they want a safer trade, or they can ride the wave whenever Bitcoin’s price spikes if they are quick on their feet to enter and leave the trade.

BTC/USD 4-hour Chart

Bitcoin’s technicals are extremely bullish on all time-frames, and no time-frame is showing any signs of bearishness or neutrality.

BTC/USD 1-day Technicals

Technical factors (4-hour Chart):
  • Price is well above both its 50-period EMA and its 21-period EMA
  • Price is at its top Bollinger band
  • RSI is heavily in the overbought zone (79.75)
  • Volume is elevated
Key levels to the upside          Key levels to the downside

1: $15,420                                 1: $14,640

2: $16,665                                 2: $14,100

3: $17,260                                  3: $13,900

Ethereum

Ethereum has, due to Bitcoin pulling it up as well as due to the hype created around its 2.0 version coming out, surged and almost scored a double-digit gain on the day. The second-largest cryptocurrency by market cap has established itself back in the ascending channel after briefly dropping out of it. However, that wasn’t enough for the Ethereum bulls as they tried to push its price above the channel completely.

As the upper channel line held amazingly and stopped Ethereum’s rise, we can conclude that (unless Bitcoin doesn’t have any extreme surges), Ethereum traders can safely trade within a range bound by the ascending channel.


ETH/USD 4-hour Chart

Ethereum’s technicals are somewhat neutral on the 4-hour and daily time-frames, while its longer time-frames show a heavy tilt towards the buy-side.

ETH/USD 1-day Technicals

Technical Factors (4-hour Chart):
  • The price is well above both its 50-period and its 21-period EMA
  • Price is at its top Bollinger band
  • RSI is extremely overbought (78.03)
  • Volume is elevated
Key levels to the upside          Key levels to the downside

1: $445                                     1: $420

2: $451                                     2: $415 

3: $490                                      3: $400

Ripple

As we predicted in our previous article, the fourth-largest cryptocurrency by market cap has broken the triangle formation that was forming from Nov 3. The price has sparked up by Bitcoin’s push towards the upside, moved to the upside as well, reaching past the $0.2454 resistance level and up towards $0.25.

One thing to note is that, while XRP has managed to break $0.2454, it needs to confirm its position above it in order to be safe in the short-term.

XRP/USD 4-hour Chart

XRP’s technicals on the 4-hour, daily, and weekly chart are slightly tilted towards the buy-side but are not completely bullish. Its monthly overview, however, is tilted towards the sell-side.

XRP/USD 1-day Technicals

Technical factors (4-hour Chart):
  • The price is well above its 50-period EMA and its 21-period EMA
  • Price at its top Bollinger band
  • RSI is on the verge of being overbought (68.49)
  • Volume is elevated
Key levels to the upside          Key levels to the downside

1: $0.26                                 1: $0.2454

2: $0.266                                     2: $0.235

3: $0.27                                  3: $0.227


Categories
Crypto Market Analysis

Daily Crypto Review, Nov 5 – Bitcoin Finally Above $14,000 as the Bull Run Continues; Ethereum 2.0 Contract Release Live

The cryptocurrency sector has explosively pushed towards the upside as Bitcoin broke the $14,316 and entered the territory explored only during the 2017/2018 bull run and last seen in July 2018. The largest cryptocurrency by market cap is currently trading for $14,316, representing an increase of 5.54% on the day. Meanwhile, Ethereum gained 4.78% on the day, while XRP gained 0.67%.

 Daily Crypto Sector Heat Map

HedgeTrade gained 38.24% in the past 24 hours, making it the most prominent daily gainer out of the top100 cryptos ranked by market capitalization. It is closely followed by Celsius’ gain of 9.37% and CyberVain’s 7.78% gain. On the other hand, Uniswap lost 16.95%, making it the most prominent daily loser. It is followed by yearn.finance’s loss of 16.73% and ABBC Coin’s loss of 9.35%.

Top 10 24-hour Performers (Click to enlarge)

Bottom 10 24-hour Performers (Click to enlarge)

Bitcoin’s market dominance level has increased slightly since we last reported, with its value is currently staying at 64.9%. This value represents a 0.6% difference to the upside when compared to the value it had yesterday.

Daily Crypto Market Cap Chart

The crypto sector capitalization has increased over the course of the day. Its current value is $412.17 billion, representing a $7.35 billion increase when compared to our previous report.

_______________________________________________________________________

What happened in the past 24 hours?

_______________________________________________________________________

_______________________________________________________________________

Technical analysis

_______________________________________________________________________

Bitcoin

The largest cryptocurrency by market capitalization had finally broken the $13,900 resistance with confidence and confirmed its position above it. Not only that, but it has entered the price level last seen in July 2018. This means that there will be a lot of uncertainty and unset support and resistance levels, and also a lot of random volatility due to various entities taking profit and new investors FOMOing in.

However, a couple of potential resistance levels have formed, one of them being at $14,640. Traders should pay close attention to this level as well as use Fib retracements to create possible targets when trading.

BTC/USD 1-hour Chart

Bitcoin’s technicals on showing a strong buy at all time-frames. No neutrality is being shown as Bitcoin is currently in an extremely favorable place price-wise.

BTC/USD 1-day Technicals

Technical factors (4-hour Chart):
  • Price is above both its 50-period EMA and its 21-period EMA
  • Price is slightly below its top Bollinger band
  • RSI is coming out of the overbought zone (69.10)
  • Volume is average
Key levels to the upside          Key levels to the downside

1: $14,640                                 1: $14,100

2: $16,665                                 2: $13,900

3: $17,260                                  3: $13,570

Ethereum

Bitcoin’s push towards the upside has fueled Ethereum, and the hype surrounding its version 2.0 launch, managed to surge above the ascending channel bottom line and re-enter the channel once again. The second-largest cryptocurrency by market cap reached as high as $409 before pulling back. It is now consolidating at slightly below $400.

If we don’t see any explosive moves from BTC and ETH in the short term, we can expect Ethereum to pull back slightly more and test the ascending channel’s bottom line as support. Traders can wait for the results of the “test” and trade off of that.

ETH/USD 4-hour Chart

Ethereum’s technicals on all time-frames are tilted towards the buy-side. However, its shorter time-frames (4-hour and daily) are showing hints of neutrality, while its longer time-frames are completely bullish.

ETH/USD 1-day Technicals

Technical Factors (4-hour Chart):
  • The price is above both its 50-period and its 21-period EMA
  • Price is between its middle and top Bollinger band
  • RSI is neutral (57.63)
  • Volume is average
Key levels to the upside          Key levels to the downside

1: $400                                     1: $378

2: $415                                     2: $371

3: $420                                      3: $361

Ripple

The fourth-largest cryptocurrency by market cap hardly even moved in the past 24 hours despite the rest of the crypto market booming. As we mentioned in our previous article, if Bitcoin’s next explosive move doesn’t fuel XRP, it will move within a range bound by $0.235 and $0.2454, exactly what happened.

XRP seems to be creating a triangle formation on its 4-hour chart. If that is the case, it is bound to move above or below it extremely soon. However, the move will most likely be stopped at its immediate support or resistance level.

XRP/USD 4-hour Chart

XRP’s technicals have improved slightly, as they were extremely bearish the last time we reported. While its daily overview is still heavily tilted towards the sell-side, its weekly and monthly overviews are almost neutral (though still slightly tilted towards the bear side), and its 4-hour time-frame is even showing some bullishness.

XRP/USD 1-day Technicals

Technical factors (4-hour Chart):
  • The price is below its 50-period EMA and at its 21-period EMA
  • Price at its middle Bollinger band
  • RSI is neutral (48.73)
  • Volume is average
Key levels to the upside          Key levels to the downside

1: $0.2454                                 1: $0.235

2: $0.26                                     2: $0.227

3: $0.266                                  3: $0.221


Categories
Crypto Market Analysis

Daily Crypto Review, Nov 4 – Bitcoin Contesting $14,000; Crypto Sector in the Green

The cryptocurrency sector has explosively pushed towards the upside as Bitcoin is contesting the $14,000 level yet again. The largest cryptocurrency by market cap is currently trading for $13,863, representing an increase of 3.81% on the day. Meanwhile, Ethereum gained 2.93% on the day, while XRP gained 3.67%.

 Daily Crypto Sector Heat Map

The Midas Touch Gold gained 13.90% in the past 24 hours, making it the most prominent daily gainer out of the top100 cryptos ranked by market capitalization. It is closely followed by ABBC Coin’s gain of 11.68% and Ampleforth’s 9.31% gain. On the other hand, CyberVain lost 9.64%, making it the most prominent daily loser. It is followed by NEAR Protocol’s loss of 9.57% and VeChain’s loss of 8.87%.

Top 10 24-hour Performers (Click to enlarge)

Bottom 10 24-hour Performers (Click to enlarge)

Bitcoin’s market dominance level has increased slightly since we last reported, with its value is currently staying at 64.3%. This value represents a 0.3% difference to the upside when compared to the value it had yesterday.

Daily Crypto Market Cap Chart

The crypto sector capitalization has increased over the course of the day. Its current value is $399.05 404.52 billion, representing a $10.79million increase when compared to our previous report.

_______________________________________________________________________

What happened in the past 24 hours?

_______________________________________________________________________

_______________________________________________________________________

Technical analysis

_______________________________________________________________________

Bitcoin

The largest cryptocurrency by market capitalization had a great day as its price moved above the $13,900 mark. While the move got stopped out near $14,000, its price is still above the level it just passed.

Due to no strong pullbacks happening at the moment and Bitcoin staying within a very narrow range ($13,000-$14,100), we can expect a strong move to either side very soon. Traders should pay attention to any attempt to break its support/resistance levels Bitcoin makes.

BTC/USD 4-hour Chart

Bitcoin’s technicals on all time-frames are bullish, with the weekly overview being the only one with a considerable amount of neutrality.

BTC/USD 1-day Technicals

Technical factors (4-hour Chart):
  • Price is above both its 50-period EMA and its 21-period EMA
  • Price above its middle Bollinger band
  • RSI is neutral (58.89)
  • Volume is average
Key levels to the upside          Key levels to the downside

1: $13,900                                 1: $13,570

2: $14,000                                 2: $13,180

3: $14,100                                  3: $13,000

Ethereum

Ethereum has bounced off of its $371 support level and started moving back towards its ascending channel. However, the channel bottom line was too strong to pass, and Ethereum ended up consolidating slightly below it. As time passes, the possibility of Ethereum breaking the level will be diminished due to the constant increase in the line’s price position.

Ethereum is now trading in a range between $378 and the ascending channel bottom line, which can be taken advantage of. However, Bitcoin is preparing a move, and Ethereum will most likely respond to it by following its direction and intensity, which can be used by the traders.

ETH/USD 4-hour Chart

Ethereum’s short-term technicals are unclear (4-hour overview being slightly bearish while daily overview is slightly bullish), while its longer-term technicals are heavily tilted towards the buy-side.

ETH/USD 1-day Technicals

Technical Factors (4-hour Chart):
  • The price is below its 50-period and at its 21-period EMA
  • Price is at its middle Bollinger band
  • RSI is neutral (49.02)
  • Volume is average
Key levels to the upside          Key levels to the downside

1: $400                                     1: $378

2: $415                                     2: $371

3: $420                                      3: $361

Ripple

The fourth-largest cryptocurrency by market cap took the day to push back above $0.235 and consolidate above it. This returned XRP back within a range bound by $0.235 to the downside and $0.2454 to the upside.

As we mentioned in our previous articles, if the next Bitcoin’s explosive move does not fuel XRP, traders can comfortably trade sideways action within this range. If, however, Bitcoin’s price moves to either side and XRP follows the direction, traders can use this event to trade alongside the direction XRP is moving in.

XRP/USD 4-hour Chart

XRP’s technicals on all time-frames are heavily tilted towards the sell-side. However, the longer the time-frame, the more neutral the technicals are, with the monthly indicator being very close to being completely neutral.

XRP/USD 1-day Technicals

Technical factors (4-hour Chart):
  • The price below its 50-period EMA and above its 21-period EMA
  • Price is slightly above its middle Bollinger band
  • RSI is close to the oversold territory (50.52)
  • Volume is slightly above average
Key levels to the upside          Key levels to the downside

1: $0.2454                                 1: $0.235

2: $0.26                                     2: $0.227

3: $0.266                                  3: $0.221


Categories
Crypto Market Analysis

Daily Crypto Review, Nov 3 – Crypto Sector in the Red; Altcoins Plummeting

The cryptocurrency sector experienced an overall price drop as Bitcoin pushed down towards sub-$13,500 levels. Most cryptocurrencies ended in the red as they lost quite a bit more than Bitcoin itself. The largest cryptocurrency by market cap is currently trading for $13,411, representing a decrease of 1.88% on the day. Meanwhile, Ethereum lost 5.68% on the day, while XRP lost 3.96%.

 Daily Crypto Sector Heat Map

The Midas Touch Gold gained 8.44% in the past 24 hours, making it the cryptocurrency to gain the most in a day (out of the top100 cryptos by market capitalization). The rest of the cryptocurrencies experienced close to no gains. On the other hand, Reserve Rights lost 17.14%, making it the most prominent daily loser. It is followed by SushiSwap’s loss of 14.07% and Compound’s loss of 12.86%.

Top 10 24-hour Performers (Click to enlarge)

Bottom 10 24-hour Performers (Click to enlarge)

Bitcoin’s market dominance level has increased since we last reported, with its value is currently staying at 64%. This value represents a 0.9% difference to the upside when compared to the value it had yesterday.

Daily Crypto Market Cap Chart

The crypto sector capitalization has decreased over the course of the day. Its current value is $388.84 404.52 billion, representing a $5.32 million decrease when compared to our previous report.

_______________________________________________________________________

What happened in the past 24 hours?

_______________________________________________________________________

_______________________________________________________________________

Technical analysis

_______________________________________________________________________

Bitcoin

The largest cryptocurrency by market cap has (as said in our previous article) moved away from the sideways trading as it could not stand trading in such a narrow range. Bitcoin pulled back below $13,570 and even went as low as ~13,200 before bouncing back to ~$13,400 (where it is currently consolidating).

The recent days have brought us a lot of support/resistance hopping, which is what we may expect in the near future as well. Traders should focus on capitalizing on these movements as they almost always overextend. The trades can be made both while Bitcoin is creating overextension (riskier but a bigger profit potential) or during the pullback (safer but less profit potential).

BTC/USD 4-hour Chart

Bitcoin’s 4-hour technicals are showing a bear tilt, while its longer time-frames are tilted towards the buy-side (longer time-frames have less neutrality and more of a buy-tilt than the shorter ones).

BTC/USD 1-day Technicals

Technical factors (4-hour Chart):
  • Price is far at its 50-period EMA and below its 21-period EMA
  • Price below its middle Bollinger band
  • RSI is neutral (43.90)
  • Volume is average
Key levels to the upside          Key levels to the downside

1: $13,570                                 1: $13,180

2: $13,900                                 2: $13,000

3: $14,000                                  3: $12,870

Ethereum

Ethereum has plummeted after failing to break the $400 mark, and losing all the most recent gains in the process. The second-largest cryptocurrency by market cap has left the ascending channel since the end of September. Its price drop was stopped at the $371 resistance level, which has held up quite well.

Ethereum is now trading in a narrow range bound by $371 to the downside and $378 to the upside. Traders should look for any breakouts to enter trades, while the ones that want to trade the sideways action should wait and see if Ethereum is likely to stay within this range.

ETH/USD 4-hour Chart

Ethereum’s 4-hour and daily technicals are tilted towards the sell-side, while its weekly and monthly overviews remain bullish.

ETH/USD 1-day Technicals

Technical Factors (4-hour Chart):
  • The price is far below both its 50-period and its 21-period EMA
  • Price is at its bottom Bollinger band
  • RSI is close to being overbought (35.83)
  • Volume is slightly above average
Key levels to the upside          Key levels to the downside

1: $378                                     1: $371

2: $400                                     2: $361

3: $415                                      3: $358

Ripple

The fourth-largest cryptocurrency by market cap has had a red day as well, with its price falling through major support levels. A failed attempt to break the $0.2454 level has triggered a pullback, which pushed XRP’s price below $0.235 and even attempted to break $0.227. However, this support level held up, and XRP is now trading slightly above it.

If not fueled by Bitcoin’s explosive move towards either side, XRP will most likely trade sideways between $0.227 and $0.235. While traders could trade the sideways action without much problem, the lack of intra-range volatility is low, which brings the profit potential way down.

XRP/USD 4-hour Chart

XRP’s daily, weekly, and monthly technicals are all showing a strong tilt towards the sell-side, while its 4-hour overview is slightly bullish with hints of neutrality.

XRP/USD 1-day Technicals

Technical factors (4-hour Chart):
  • The price far below both its 50-period EMA and its 21-period EMA
  • Price is at its bottom Bollinger band
  • RSI is close to the oversold territory (31.89)
  • Volume is slightly above average
Key levels to the upside          Key levels to the downside

1: $0.235                                   1: $0.227

2: $0.2454                                 2: $0.221

3: $0.26                                    3: $0.217


Categories
Crypto Daily Topic

What is Ripple, and Should You Buy It?

Introduced in 2012, Ripple aimed to facilitate seamless, fast, and cheap global money transfers. It is different from other cryptocurrencies in the way it works and what it aims to achieve. Bitcoin came as a digital currency and Ethereum as a smart contracts platform. But Ripple entered the scene as a payments infrastructure. Today, its digital currency is among the most popular – only surpassed by Bitcoin and Ethereum in market capitalization.

In this article, we take a deep dive into this fascinating cryptocurrency network. We will look at how Ripple works, its pros and cons, compare it with Bitcoin, and even look at how you can use it. Read on to find out more about Ripple.

Understanding Ripple

We’ve just said that Ripple is different because it is a payment infrastructure. But what exactly is a payments infrastructure? In the interest of simplicity, let’s say it is any platform that facilitates the transfer of funds between individuals. For Ripple, this transfer happens in real-time and on an individual order basis. In other words, this network is a real-time gross settlement (RTGS) system. 

The Ripple platform consists of the XCurrent messaging technology and the XRP currency. SWIFT is currently the most popular inter-bank funds transfer system. However, the recent adoption of the XCurrent messaging technology by some leading global banks has created uncertainty over SWIFT’s future. 

Ripple was created by Ripple Labs Inc. Unlike another crypto, which is usually generated through mining, Ripple Labs created the entire 100 billion XRP that circulates within the network. The company, strangely, holds 55 billion of these. 

While Ripple runs on open-source software, the network is not really decentralized – which the executives of Ripple Labs’ vehemently refute. The CTO is quoted saying that the XRP ledger existed even before Ripple Labs was founded, and that XRP will continue to circulate even if the company collapses. Cryptocurrencies are loved because they are decentralized. For Ripple, the company’s involvement in developing the network complicates the matter. Nevertheless, it remains the third most popular crypto going by total value of coins in circulation. 

Current Applications

Ripple’s utility extends beyond sending crypto from one person to another – the company’s recent partnership with Banco Santander demonstrated its potential in facilitating RTGS in mainstream banking. According to the Financial Times, this partnership allows the bank’s customers to send money across the globe in different currencies. That said, Ripple is mainly used for currency exchange and remittances. 

While the banking industry may be shy in adopting XRP because it’s volatile – like all other cryptos, it is likely to embrace Ripple’s payment infrastructure. Should that happen, Ripple will enable banks to make instant transfers and in different currencies while avoiding the high costs associated with SWIFT.

Ripple Versus Bitcoin

Ripple and Bitcoin are both blockchain-based technologies. This similarity should not make you think that Ripple is simply another cryptocurrency, just like Bitcoin. These two fundamentally differ in the following ways:

  • Mining: Bitcoin miners get rewarded with new coins. Ripple is not mined as all the coins were created when the network was built.
  • Underlying technology: Bitcoin transactions are verified using the proof-of-work concept (mining), while Ripple uses an iterative consensus.
  • Speed: Bitcoin takes an average of 10 minutes to commit transactions, while Ripple needs only 5 seconds. Ripple’s fast speed is what makes it suitable for RTGS.
  • Transaction cost: Bitcoin charges upwards of $2 per transaction, while Ripple costs about $0.004. The low transaction fees give Ripple an edge over SWIFT for remittances.
  • Supported currencies: The Bitcoin network supports only once currency while Ripple was built to support any currency.
  • Ownership: Bitcoin is decentralized, while Ripple is controlled by Ripple Labs Inc.

How to Use Ripple

Ripple can be used by both individuals and financial institutions. For individuals, it works like other cryptocurrencies – you can invest in it or use it to make payments. For banks, Ripple’s usefulness lies in its payment infrastructure technology. Let’s take a closer look at how the platform plays out in these two scenarios. 

For Individuals

As mentioned above, you can invest in Ripple (XRP) or use it for payments – just as you would with any other crypto. For this, you will need a digital wallet that supports XRP. There is a good review of XRP wallets on this page. Secondly, you need to identify a reliable exchange from where you can buy XRP; Bitstamp, Kraken, and GateHub are good options. Most of the exchanges offer XRP/USD, XRP/EUR, and XRP/BTC exchange pairs. Also, most of them will deposit the purchased XRP on your account on that website. Always ensure you move the funds to your private wallet soonest possible. 

For Banks/ Financial Institutions 

Ripple was developed with banks and other financial institutions in mind. The aim was to make cross-border fund transfers fast, cheap, and transparent, which banks have been unable to achieve for decades. 

Ever since, banks have been using SWIFT, an interbank telecommunication system, to send money across borders. SWIFT is expensive. Also, its transfers take about 1-4 business days to reflect. People seeking to make cross-border remittances have had to endure this reality for the last four decades. However, things are changing. Several major banks have seen the light and are now using Ripple’s messaging system to achieve the same function as SWIFT, but faster, more cheaply, and transparently. 

Just like SWIFT, Ripple’s payment infrastructure does not hold any funds – it is simply a messaging system. This means that banks do not have to overhaul the entire remittance process when adopting Ripple, and thus, the switch to Ripple should be swift (no pun intended).

Having cheap, instantaneous cross-border transfers is everyone’s wish, but until all banks adopt Ripple’s platform, such transfers will have to stay on the wishlist. 

Ripple’s Pros 

  • Fast transactions – Transactions on Ripple are among the fastest among cryptocurrency networks. Within 3-5 seconds, the transfer of funds from person A to person B can be complete.
  • Supported by a reliable technical team – Ripple is supported by a team of world-class engineers because the company can afford them.
  • Reliability – The platform has been tested by some of the world’s largest banks, meaning it is a reliable solution.
  • Low cost – Transaction fees on Ripple are very competitive.

Ripple’s Cons

  • Centralized – Ripple Labs owns 55% of the total coins in the network, which makes it too powerful. Decentralized governance is one of the characteristics that have made cryptocurrencies attractive. 
  • Focus on banks/ financial institutions – Ripple was largely designed to benefit banks and financial institutions. Individuals might be unable to leverage the platform’s full range of capabilities. 

Closing Remarks

Ripple is an original, fresh, and unique solution to the age-old problem of cross-border money transfers and, as a digital currency, an alternative to Bitcoin. We have seen that the crypto network is primarily focused on financial institutions. However, you can still use XRP to make payments or invest in it. So, if you are a crypto enthusiast, XRP is a good alternative to other altcoins. 

For financial institutions, Ripple introduces speed, low-costs, and transparency in international money transfers. Many of the world’s largest banks have already tested its payment infrastructure – giving it the seal of approval that other financial institutions can rely on. Ripple promises faster and cheaper money transfers. However, we might have to wait for long as banks consider its adoption. Until then, we will have to endure the slow and costly SWIFT transfers.

Categories
Crypto Market Analysis

Daily Crypto Review, Nov 2 – Ethereum’s Price Explodes; Bitcoin’s Whitepaper Celebrates its 12th Birthday

The cryptocurrency sector was full of volatility over the weekend as Bitcoin tried to break the $14,000 mark. Bitcoin is currently trading for $13,735, representing a decrease of 0.13% on the day. Meanwhile, Ethereum gained 3.12% on the day, while XRP gained 1.31%.

 Daily Crypto Sector Heat Map

Taking a look at the top 100 cryptocurrencies, Ocean Protocol gained 20.20% in the past 24 hours, making it the crypto to gain the most in a day. Aave (10.97%) and Ox (8.84%) also did great. On the other hand, ABBC Coin lost 10.72%, making it the most prominent daily loser. It is followed by CyberVain’s loss of 7.62% and Ren’s loss of 3.92%.

Top 10 24-hour Performers (Click to enlarge)

Bottom 10 24-hour Performers (Click to enlarge)

Bitcoin’s market dominance level had stayed at the same place since we last reported, with its value is currently 63.1%. This value represents a 0% difference when compared to the value it had on Friday.

Daily Crypto Market Cap Chart

The crypto sector capitalization has increased slightly over the weekend. Its current value is $404.52 billion, representing a $4.91 million increase compared to our previous report.

_______________________________________________________________________

What happened in the past 24 hours?

_______________________________________________________________________

_______________________________________________________________________

Technical analysis

_______________________________________________________________________

Bitcoin

The largest cryptocurrency by market cap had quite a volatile weekend, with its price breaking the $13,900 mark at one point and even reaching as high as $14,100. However, this price didn’t hold up, and Bitcoin fell back below $13,900, where it is consolidating at the moment. Bitcoin is now trading within a tight range, bound by $13,570 to the downside and $13,900 to the upside. History has shown us that BTC doesn’t stay range-bound for long; thus, we may expect a large move soon.

Traders should look for a trade when Bitcoin breaks one of its immediate resistances.

BTC/USD 4-hour Chart

Bitcoin’s overview on all time-frames is slightly bullish, with hints of neutrality. The neutrality is more present on the shorter time-frames as opposed to less neutrality on longer time-frames.

BTC/USD 1-day Technicals

Technical factors (4-hour Chart):
  • Price is far above its 50-period EMA and above its 21-period EMA
  • Price slightly above its middle Bollinger band
  • RSI is neutral (53.43)
  • Volume is slightly above average
Key levels to the upside          Key levels to the downside

1: $13,900                                 1: $13,570

2: $14,000                                 2: $13,180

3: $14,660                                  3: $12,870

Ethereum

Ethereum had spent the weekend slowly following the ascending channel bottom line until Sunday when its price bounced off and pushed past $400. The second-largest cryptocurrency by market cap managed to reach as high as $405 before pulling back and consolidating. The fight for $400 will continue, and it will decide if Ethereum will push towards $415 and $420 in the near future or not.

Traders should look for Ethereum’s break (or the failure to break) the $400 level and trade off of that.

ETH/USD 4-hour Chart

Ethereum’s 4-hour technicals have changed to a strong buy after Ether’s price spike, while its daily, weekly, and monthly time-frames are all slightly bullish with hints of neutrality.

ETH/USD 1-day Technicals

Technical Factors (4-hour Chart):
  • The price is far above both its 50-period and its 21-period EMA
  • Price is at its top Bollinger band
  • RSI is close to being overbought (64.51)
  • Volume is slightly above average
Key levels to the upside          Key levels to the downside

1: $400                                     1: $378

2: $415                                     2: $371

3: $420                                      3: $361

Ripple

The fourth-largest cryptocurrency by market cap spent the weekend consolidating below the $0.2454 level, which it has dropped below just before the weekend started. XRP tested both the $0.235 downside and $0.2454 upside, and both have proven to be strong support/resistance levels, which has left XRP range-bound.

XRP will take a lot of buying power to break above $0.2454 again, which means that the traders should consider trading sideways inside the range XRP is currently in.

XRP/USD 4-hour Chart

XRP’s daily, weekly, and monthly technicals are all showing a strong tilt towards the sell-side, while its 4-hour overview is slightly bullish with hints of neutrality.

XRP/USD 1-day Technicals

Technical factors (4-hour Chart):
  • The price below its 50-period EMA and above its 21-period EMA
  • Price is slightly above its middle Bollinger band
  • RSI is neutral (50.10)
  • Volume is average
Key levels to the upside          Key levels to the downside

1: $0.26                                     1: $0.2454

2: $0.266                                   2: $0.235

3: $0.27                                    3: $0.227


Categories
Crypto Market Analysis

Daily Crypto Review, Oct 30 – Bitcoin Bounces Back Above $13,500; XRP Breaks Crucial Support Level

The cryptocurrency sector was full of volatility today but ended the day with close to no gains. Bitcoin is currently trading for $13,561, representing an increase of 2.50% on the day. Meanwhile, Ethereum gained 0.01% on the day, while XRP lost 1.12%.

 Daily Crypto Sector Heat Map

None of the top100 cryptocurrencies gained much over the course of the day. NEM gained 3.57% in the past 24 hours, making it the crypto to gain the most in a day. Celsius (2.68%) and FTX Token (2.63%) also did great. On the other hand, yearn.finance lost 16.68%, making it the most prominent daily loser. It is followed by Ocean Protocol’s loss of 16.06% and Reserve Rights’ loss of 15.74%.

Top 10 24-hour Performers (Click to enlarge)

Bottom 10 24-hour Performers (Click to enlarge)

Bitcoin’s market dominance level had increased since we last reported, with its value is currently 63.1%. This value represents a 0.8% difference to the upside when compared to when we last reported.

Daily Crypto Market Cap Chart

The crypto sector capitalization has increased slightly in the past 24 hours. Its current value is $399.63 billion, representing a $6.58billion increase compared to our previous report.

_______________________________________________________________________

What happened in the past 24 hours?

_______________________________________________________________________

_______________________________________________________________________

Technical analysis

_______________________________________________________________________

Bitcoin

The largest cryptocurrency by market capitalization had quite a volatile day, with its price bouncing back from the $13,180 resistance and pushing up. While the price has reached ~$13,700 level, it has pulled back since, currently contesting the $13,570 resistance.

Traders should look at Bitcoin contesting the $13,570 level and trade in whichever direction the price confirms its move in.

BTC/USD 4-hour Chart

Bitcoin’s 4-hour and weekly overviews are neutral bullish, while its daily and monthly overviews are tilted towards the buy-side with close to no neutrality.

BTC/USD 1-day Technicals

Technical factors (4-hour Chart):
  • Price is far above its 50-period EMA and above its 21-period EMA
  • Price slightly above its middle Bollinger band
  • RSI is ascending towards overbought (59.94)
  • Volume is slightly above average
Key levels to the upside          Key levels to the downside

1: $13,570                                 1: $13,180

2: $13,900                                 2: $12,870

3: $14,000                                  3: $12,500

Ethereum

Ethereum had, just like Bitcoin, quite a volatile day today. Its price first bounced off of the ascending channel bottom line, which prompted a push towards $395 before falling yet again. As things stand now, the leg down is still not over yet, and Ethereum is yet to decide whether it will change its course towards the upside or break the channel down.

Traders should look for Ethereum’s response to the bottom channel line and trade in continuation to where it chooses to go.

ETH/USD 4-hour Chart

Ethereum’s technicals on all time-frames except for the 4-hour one are tilted towards the buy-side, with hints of neutrality. On the other hand, its 4-hour time-frame is tilted towards the sell-side with slight hints of neutrality.

ETH/USD 1-day Technicals

Technical Factors (4-hour Chart):
  • The price is below its 50-period and its 21-period EMA
  • Price is between its middle and bottom Bollinger band
  • RSI is neutral (40.64)
  • Volume is slightly above average
Key levels to the upside          Key levels to the downside

1: $400                                     1: $378

2: $415                                     2: $371

3: $420                                      3: $361

Ripple

The fourth-largest cryptocurrency by market cap had a bad day, as its price dropped below the crucial $0.2454 support level. XRP tried to recover and went above it at one point but failed to keep the price above the level, therefore triggering another push towards $0.24, where it is currently consolidating.

It is hard to say how traders should look at XRP, though the outlook is certainly bearish. Any push towards the upside will almost certainly result from Bitcoin making a large move towards the upside.

XRP/USD 4-hour Chart

XRP’s technicals are uniformed in its bearishness, with the 1-day and monthly overviews showing a bit more neutrality than the others.

XRP/USD 1-day Technicals

Technical factors (4-hour Chart):
  • The price well below both its 50-period EMA and its 21-period EMA
  • Price is slightly above its bottom Bollinger band
  • RSI is near oversold (35.97)
  • Volume is average
Key levels to the upside          Key levels to the downside

1: $0.2454                                 1: $0.235

2: $0.26                                     2: $0.227

3: $0.266                                  3: $0.221


Categories
Crypto Market Analysis

Daily Crypto Review, Oct 29 – Bitcoin Back At $13,000: What’s Next? Trading Ideas and Market Overview

The cryptocurrency sector quite a bad day, as Bitcoin led the rest of the sector down by dropping from $13,900 all the way to below $13,000. Bitcoin is currently trading for $13,240, representing a decrease of 3.70% on the day. Meanwhile, Ethereum lost 3.60% on the day, while XRP lost 2.93%.

 Daily Crypto Sector Heat Map

If we check out the top 100 cryptocurrencies, Ocean Protocol gained 11.69% in the past 24 hours, making it the crypto to gain the most in a day. Nexo (7.86%) and DigiByte (4.49%) also did great. On the other hand, ABBC Coin lost 12.3%, making it the most prominent daily loser. It is followed by Band Protocol’s loss of 11.46% and Quant’s loss of 11.36%.

Top 10 24-hour Performers (Click to enlarge)

Bottom 10 24-hour Performers (Click to enlarge)

Bitcoin’s market dominance level had decreased slightly since we last reported, with its value is currently 62.3%. This value represents a 0.1% difference to the downside when compared to when we last reported.

Daily Crypto Market Cap Chart

The crypto sector capitalization has decreased significantly in the past 24 hours. Its current value is $393.05 billion, representing a $15.07 billion decrease compared to our previous report.

_______________________________________________________________________

What happened in the past 24 hours?

_______________________________________________________________________

_______________________________________________________________________

Technical analysis

_______________________________________________________________________

Bitcoin

The largest cryptocurrency by market capitalization pulled back as its price couldn’t pass the crucial resistance of $13,900. The move was strong and lasted three candles (around 12 hours), over which Bitcoin fell as low as $12,895, where it bounced off of its 50-period moving average. Bitcoin is now consolidating above the $13,180 level.

Traders should look at how Bitcoin trades within the range bound by $13,180 and $13,570 and trade off of that.

BTC/USD 4-hour Chart

Bitcoin’s 4-hour, daily, and monthly technicals are looking almost identical, with all of them being tilted towards the buy-side, with a bit of neutrality sprinkled in. On the other hand, its weekly overview is a bit more bearish, with oscillators leaning towards the sell-side.

BTC/USD 1-day Technicals

Technical factors (4-hour Chart):
  • Price is above its 50-period EMA and at its 21-period EMA
  • Price is at its middle Bollinger band
  • RSI is neutral (52.27)
  • Volume is descending
Key levels to the upside          Key levels to the downside

1: $13,570                                 1: $13,180

2: $13,900                                 2: $12,870

3: $14,000                                  3: $12,500

Ethereum

Ethereum has followed Bitcoin to the downside, ultimately following its own predicted path within an ascending channel and reaching the bottom of $380 (as predicted in our previous articles) before bouncing back. It is currently trading slightly below $400, with a good chance of retesting this level once again.

Traders should watch for how Ethereum looks to retest the $400 resistance level and trade the pullback or the spike after that.

ETH/USD 4-hour Chart

Ethereum’s daily and monthly technicals are tilted towards the buy-side (with slight neutrality next to them). However, its shorter time-frame (the 4-hour overview) looks completely bearishness, while its weekly overview is completely neutral.

ETH/USD 1-day Technicals

Technical Factors (4-hour Chart):
  • The price is below its 50-period and its 21-period EMA
  • Price is slightly below its middle Bollinger band
  • RSI is neutral (42.03)
  • Volume is slightly above average
Key levels to the upside          Key levels to the downside

1: $400                                     1: $378

2: $415                                     2: $371

3: $420                                      3: $361

Ripple

The fourth-largest cryptocurrency by market cap managed to push above the ascending dotted yellow line (as predicted in our previous articles) but quickly failed as Bitcoin was dragging the market down. XRP followed and fell to its $0.2454 support level, which is holding for now. However, XRP is still quite close to the support level, which might break at any moment.

Traders should look for an entry if XRP breaks $0.2454 to the downside. When looking at trades to the upside, traders can look at Bitcoin’s upside pushes and trade off of that.

XRP/USD 4-hour Chart

XRP’s technicals are almost uniformed in how bearish they are, with its 4-hour, daily, and monthly overviews showing a slight tilt towards the sell-side. Its weekly overview, however, is completely neutral.

XRP/USD 1-day Technicals

Technical factors (4-hour Chart):
  • The price far below both its 50-period EMA and its 21-period EMA
  • Price is slightly above its bottom Bollinger band
  • RSI is neutral (38.72)
  • Volume is average
Key levels to the upside          Key levels to the downside

1: $0.26                                     1: $0.2454

2: $0.266                                   2: $0.235

3: $0.2855                                3: $0.227