
The cryptocurrency sector has spent been in the green overall, with Bitcoin consolidating and altcoins booming. The largest cryptocurrency by market cap is currently trading for $18,364, representing a decrease of 0.36% on the day. Meanwhile, Ethereum gained 4.23% on the day, while XRP gained a whopping 54.14%.
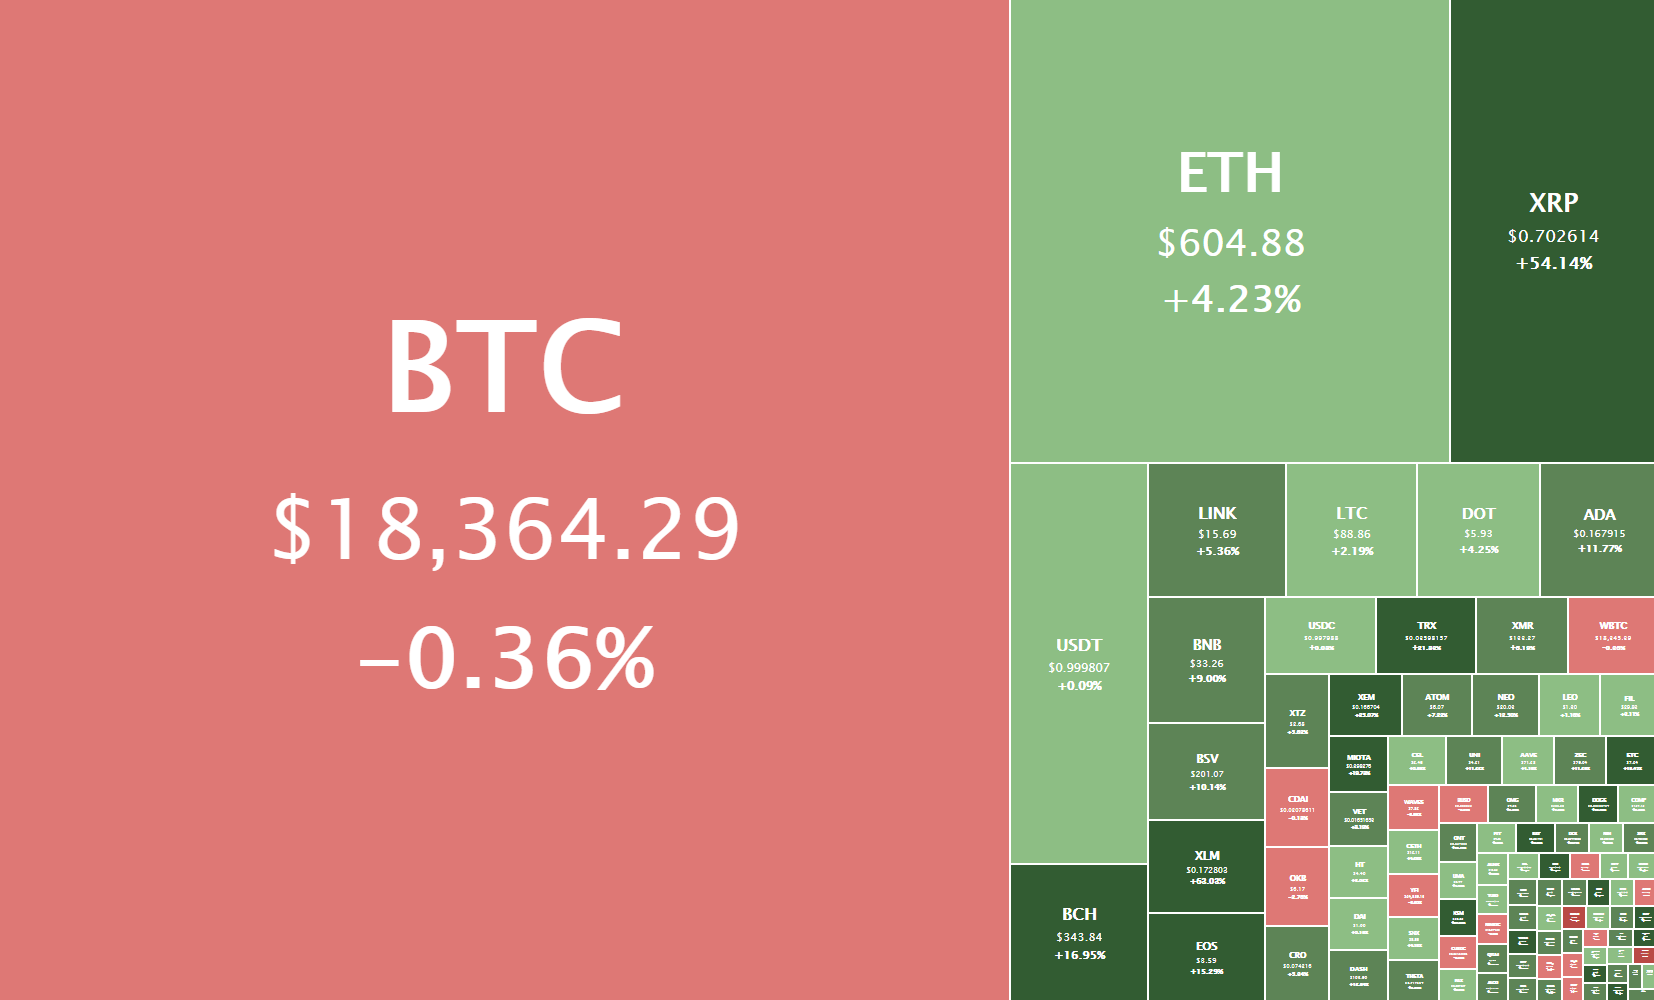
Daily Crypto Sector Heat Map
Stellar 61.98% in the past 24 hours, making it the most prominent daily gainer in the top100. It is closely followed by XRP’s gain of 52.19% and Verge’s 37.77% gain. On the other hand, SushiSwap lost 11.14%, making it the most prominent daily loser. Quant lost 9.44% while Nexo lost 8.27%, making them the 2nd and 3rd most prominent daily losers.
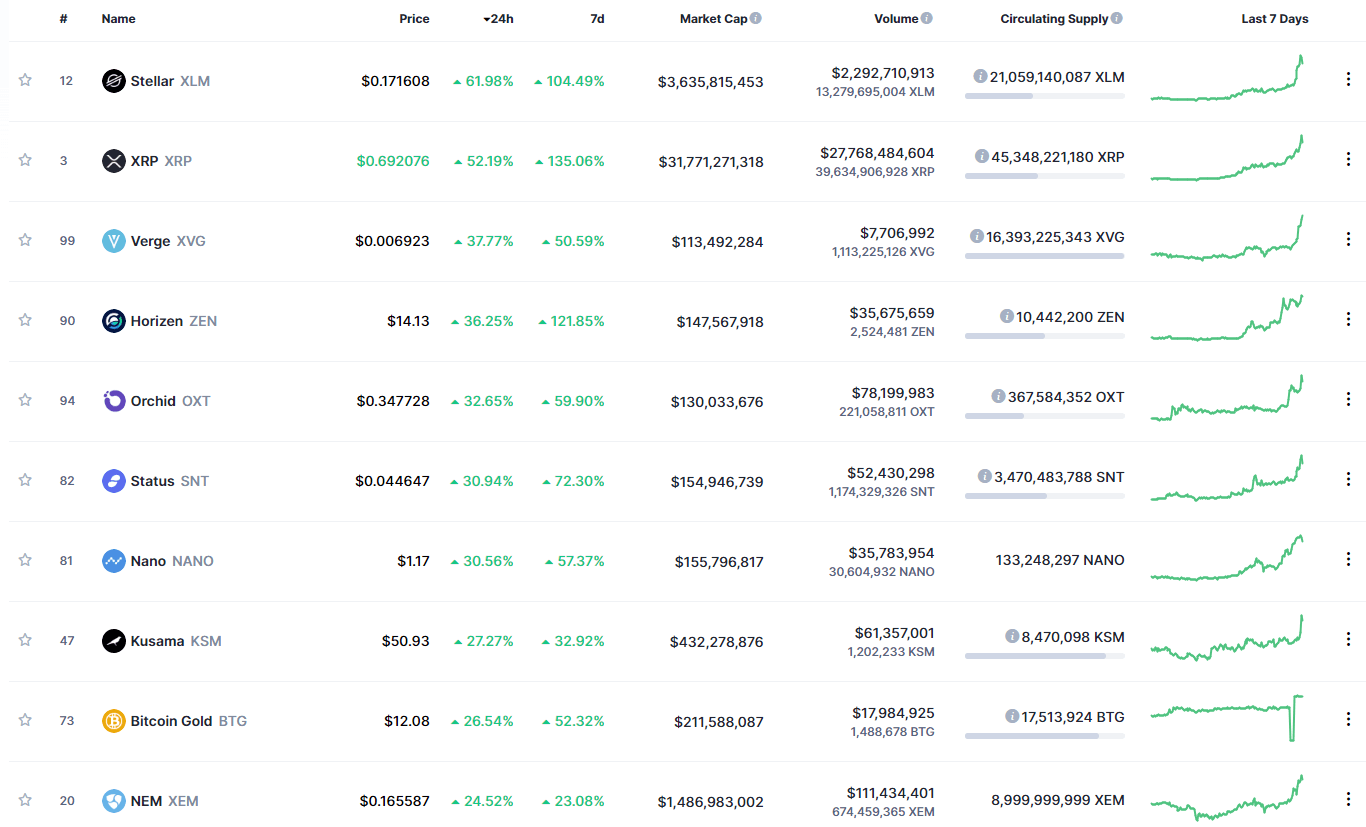
Top 10 24-hour Performers (Click to enlarge)

Bottom 10 24-hour Performers (Click to enlarge)
Bitcoin’s market dominance has reduced drastically over the course of the day, with its value is currently staying at 60.06%. This value represents a 2.6% difference to the downside compared to the value it had yesterday.
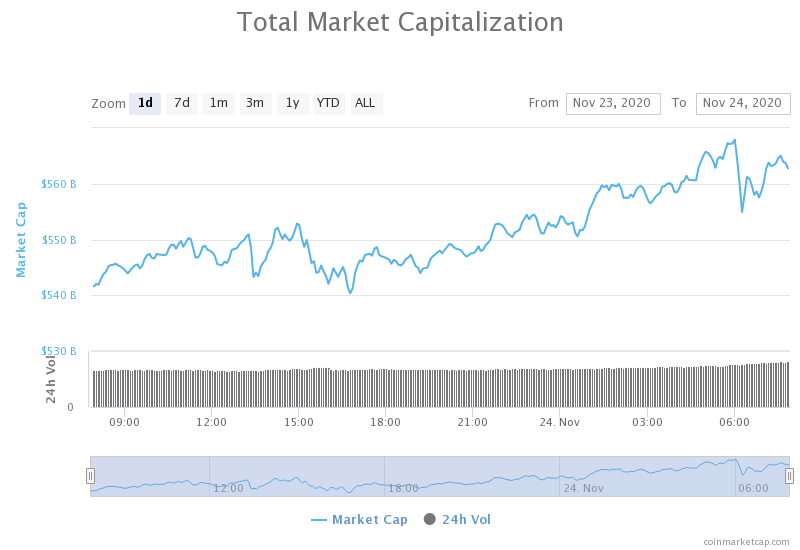
Daily Crypto Market Cap Chart
The crypto sector capitalization has increased significantly over the course of the day. Its current value is $562.75 billion, representing a $21.04billion increase compared to our previous report.
_______________________________________________________________________
What happened in the past 24 hours?
_______________________________________________________________________
- Eth2 deposit contract passes threshold needed for Phase 0 to launch on December 1 (The Block)
- The IRS is mistakenly sending warning notices to Coinbase users (The Block)
- Aggregated open interest on Bitcoin, Ethereum options hit all-time highs this weekend (The Block)
- JPMorgan reports ‘modest outflows’ for gold funds as more than $1 billion poured into Grayscale in Q3 (The Block)
- Cardano Makes New Yearly Highs While Technicals Warn of Potential Correction (Cryptobriefing)
- PayPal Follows Bitcoin Startups, Laying Foundation for Crypto Payments (Cryptobriefing)
- Aquaculture Firm Completes Australia’s First IPO Raise Using Cryptocurrency (Coindesk)
- PayPal CEO Schulman Say He’s Bullish on Bitcoin as a Currency (Coindesk)
- XRP price rallies 91% in a month due to 3 fundamental factors (Cointelegraph)
- Crypto users speak out on proposed change to FinCEN Travel Rule (Cointelegraph)
_______________________________________________________________________
Technical analysis
_______________________________________________________________________
Bitcoin

The largest cryptocurrency by market cap has stayed pretty stable today as it couldn’t break the $18,500 mark. The price has been hovering right under the level for the whole day, and even made a couple of attempts to break it but to no avail. On the other hand, this small zone of resistance and support wasn’t broken to the downside either, as a break below $18,270 could spell a retracement.
This is a prime example of uncertainty due to Bitcoin’s current level (some are taking profits while some are investing). However, trading pullbacks in a bull trend is extremely risky and should be avoided.
BTC/USD 4-hour Chart
Bitcoin’s technicals are divided, with its daily and monthly overviews showing a slight hint of bearishness alongside the bullishness that overwhelms it. In contrast, the 4-hour and weekly overviews are completely bullish.
BTC/USD 1-day Technicals
Technical factors (4-hour Chart):
- Price is above its 50-period EMA and at its 21-period EMA
- Price is at its middle Bollinger band
- RSI is neutral (53.88)
- Volume is average
Key levels to the upside Key levels to the downside
1: $18500 1: $17,850
2: $19000 2: $17,450
3: $19500 3: $17,130
Ethereum
With Ethereum’s 2.0 version 0 launch approaching, Ethereum has continued to increase in price. Today’s move was a continuation of the uptrend that started on Nov 0, additionally fueled by the announcement that the deposits required for Ethereum’s 2.0 version 0 to launch have passed the threshold. This news is a big sigh of relief for the ETH devs, as they were wondering if the protocol will reach its goal on time for the Dec 1 launch. This extremely bullish news has pushed Ethereum past $600, which it is now testing.
If Ethereum manages to successfully stay above $600, it will have very little resistance to the upside and basically trade only versus profit-taking sellers.
ETH/USD 1-hour Chart
Ethereum’s 4-hour and monthly time-frames are completely bullish, while its daily and weekly time-frames are slightly more tilted towards the neutral position.
ETH/USD 1-day Technicals
Technical Factors (4-hour Chart):
- The price is far above its 50-period and slightly above its 21-period EMA
- Price is between its middle and top Bollinger band
- RSI is coming out of the overbought territory (59.88)
- Volume is above average
Key levels to the upside Key levels to the downside
1: $600 1: $510
2: $630 2: $500
3: $735 3: $490
Ripple
The fourth-largest cryptocurrency by market cap has exploded to the upside and reached over $0.90 on the US cryptocurrency exchange Coinbase only to crash back down by roughly 30% in mere seconds. This was its highest price since May 2018. The rally was apparently driven by the Coinbase users as XRP did not see the same heights on any other exchange. Bitstamp and Binance saw a high of only $0.79.
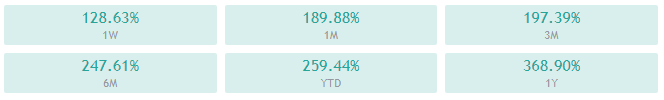
Analysts believe that this rally is a culmination of an uptrend triggered in late Oct when an anonymous whale sent an astonishing $50 million worth of XRP at the time to Bitstamp. Ever since then, XRP/USD has been seeing a strong uptrend, up by 128.63% in the past week.
Trading XRP is simply impossible at the moment due to the amount of risk associated with this type of volatility.
XRP/USD 1-hour Chart
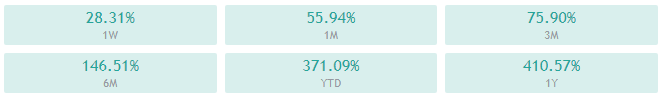
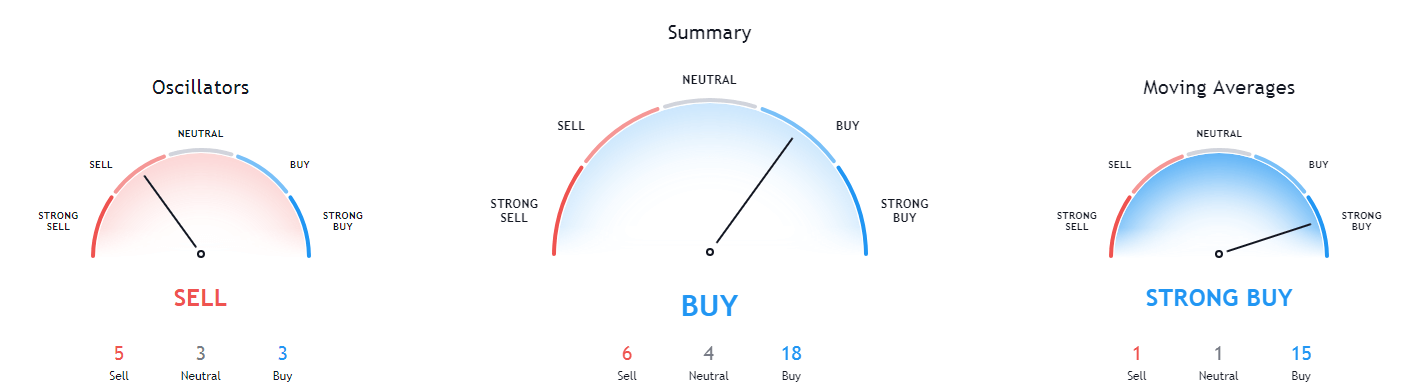
XRP’s 4-hour and weekly overviews are completely bullish and show no signs of neutrality, while its daily and monthly overviews show slight neutrality or even slight bearishness.

XRP/USD 1-day Technicals
Technical factors (4-hour Chart):
- The price is above its 50-period EMA and at its 21-period EMA
- Price is slightly above its middle Bollinger band
- RSI is neutral (53.65)
- Volume is above average
Key levels to the upside Key levels to the downside
1: $0.79 1: $0.625
2: $0.963 2: $0.475
3: $1.01 3: $0.443
Related posts
 Daily Crypto Review, August 20 – ETH Plummets Due To Skyrocketing Transaction Fees; $12,000 Level Too Strong For Bitcoin
 Daily Crypto Review, August 24 – YFI The Youngest DeFi Billionaire; IOTA Going Bankrupt
 Daily Crypto Review, Sept 16 – Ethereum Facing a 35% Drop; Bitcoin Remains Bullish
 Daily Crypto Review, Sept 17 – Bitcoin Above $11,000; XRP Skyrocketing