This section holds our Forex Educational library: Our trading library consists of a collection of the most excellent educational articles written by our top market experts. It is primarily focused on those subscribers who aim at initiating or consolidating a professional trading career; that is, for people who take trading seriously. It is our mission to continually enrich our library over time, as well to cover all sorts of useful topics, from foundational to the most advanced ones. We have separate sections for Advanced Forex Education, beginners Forex Education, A daily Forex Topic and a Complete Forex Course.
In the CADPLN currency pair, CAD is the major currency Canada and PLN is the currency of Poland. In this exotic currency pair, CAD is the base currency, and PLN is the quote currency.
Understanding CADPLN
This pair’s price determines the value of PLN, which is equivalent to one CAD. We can quote it as 1 CAD per X numbers of PLN. For example, if the CADPLN pair’s value is at 2.7983; therefore, we need almost 2.7983 PLN to buy one CAD.
CADPLN Specification
Spread
Spread is a trading cost, which is simply the difference between the Bid price and the Ask price. The broker controls the value of Spread; therefore, traders don’t have to do anything with this. This value depends on the execution model used for the trade.
Spread on ECN: 13 pips
Spread on STP: 18 pips
Fees
The trading fees that forex brokers take are similar to the stock market. It is automatically deducted from traders’ account. Note that, the fees has no impact on STP account.
Slippage
In the case of high volatility, it creates a difference between the execution level and the price open level, which is known as Spread. The main reason to occur slippage is the market volatility and the broker’s execution speed.
Trading Range in CADPLN
The trading range is the representation of the minimum, average, and the maximum volatility of this pair on the 1H, 4H, 1D, 1W, and 1M timeframe. Using these values, we can assess our profit/loss margin of trade. Hence, this proves to be a helpful risk management tool for all types of traders.
Shrink the chart so you can assess a large time period
Select your desired timeframe
Measure the floor level and set this value as the min
Measure the level of the 200-period SMA and set this as the average
Measure the peak levels and set this as Max.
CADPLN Cost as a Percent of the Trading Range
As per the volatility values of the above mentioned table, we can see that the cost changes with the change in volatility of the market. Later on, we have got the ratio between total cost and the volatility and converted into percentages.
ECN Model Account
Spread = 13 | Slippage = 5 | Trading fee = 8
Total cost = Spread + Slippage + Trading Fee
= 13 + 5 + 8
Total cost = 26
STP Model Account
Spread = 13 | Slippage = 5 | Trading fee = 0
Total cost = Spread + Slippage + Trading Fee
= 13 + 5 + 0
Total cost = 18
The Ideal way to trade the CADPLN
The CADPLN is an exotic currency pair that has enough liquidity and volatility in the price. As a result, a trader may find it easier to trade this currency pair.
Wee can see that the percentage values did not move above 288%. It is an indication that the cost of trading in the lower timeframe is higher, and in a higher timeframe, it is lower.
Moreover, with the increase of trading cost, volatility is another risk that a trader may face.
Therefore, the best time to trade in this pair is when the volatility remains at the average value. If the volatility decreases, trading will be ineffective. On the other hand, if the volatility increases, there is a possibility of an unwanted stop loss hit. Therefore, sticking to the average value is suitable for this pair.
Furthermore, another way to reduce the cost is to place a pending order as ‘limit’ and ‘stop’ instead of ‘market.’ In that case, there will be no slippage in the calculation of the total costs. Therefore, the total cost will be reduced by five pips.
CAD/JMD is an exotic currency pair. CAD is the Canadian Dollar, and JMD is the Jamaican Dollar. The CAD is the base currency in this pair while the JMD is the quote currency
CAD/JMD is an exotic currency pair. CAD is the Canadian Dollar, and JMD is the Jamaican Dollar. The CAD is the base currency in this pair while the JMD is the quote currency
Introduction
CAD/JMD is an exotic currency pair. CAD is the Canadian Dollar, and JMD is the Jamaican Dollar. The CAD is the base currency in this pair while the JMD is the quote currency; meaning that the exchange rate of the CAD/JMD pair is the quantity of JMD that can be bought by 1 CAD. If the exchange rate for the pair is 105.68, it means that 1 CAD buys 105.68 JMD.
CAD/JMD Specification
Spread
In forex trading, the spread represents the difference in the value at which you can buy a currency pair and that at which you can sell. The spread varies with different currency pairs.
The spread for the CAD/JMD pair is:
ECN: 2.4 pips | STP: 7.4 pips
Fees
When trading forex with an ECN account, the broker charges a commission for every trade. With STP accounts, no fees are charged on trades.
Slippage
In times of market volatility or if the execution of trade is not instant, there will be a discrepancy between the price at which you initiate a trade and the price it executed. This discrepancy is called slippage.
Trading Range in the CAD/JMD Pair
Since the price of a currency pair constantly changes, knowing by how much the price changes across different timeframes can help forex traders better understand volatility. This knowledge is vital, especially when estimating potential loses or gains. If, for example, the CAD/JMD pair has a volatility of 20 pips during the 4-hour timeframe, it means that trading the pair has a potential profit or loss of $189.2
Below is a table showing the trading range for the CAD/JMD pair.
Shrink the chart so you can determine a larger period
Select your desired timeframe
Measure the floor level and set this value as the min
Measure the level of the 200-period SMA and set this as the average
Measure the peak levels and set this as Max.
CAD/JMD Cost as a Percentage of the Trading Range
Trading any currency pair comes at a cost. These costs vary across different timeframes and volatility. Expressing them as a percentage of the trading range will help to inform the trading decision for the pair.
Below are analyses of the trading costs for the CAD/JMD pair across different timeframes.
ECN Model Account
Spread = 2.4 | Slippage = 2 | Trading fee = 1
Total cost = 5.4
STP Model Account
Spread = 7.4 | Slippage = 2 | Trading fee = 0
Total cost = 9.4
The Ideal Timeframe to Trade CAD/JMD
From the above cost analyses, we observe that lower timeframes and low volatility correspond to higher trading costs with the CAD/JMD pair. For both the ECN and the STP accounts, the highest costs are when volatility is the lowest at 3.4 pips. The lowest cost is when volatility is the highest at 899.9 pips.
The long-term trader enjoys lower trading costs that intraday traders. However, across all timeframes, trading when volatility is average lowers the cost and the risks associated with high volatility. Furthermore, traders can lower their costs by employing the use of forex limit orders as opposed to market orders. Limit orders eliminate the cost of slippage. Here are the trading costs when limit orders are used.
ECN Account Using Limit Model Account
Total cost = Slippage + Spread + Trading fee
= 0 + 2.4 + 1 = 3.4
We can notice a significant reduction in the trading costs of the CAD/JMD pair. The highest cost has reduced from 91.53% to 57.63% of the trading range.
The CAD/BBD is an exotic currency cross. CAD is the Canadian Dollar, and the BBD is the Barbadian Dollar – the official currency of Barbados. Here, the CAD is the base currency, and the BBD is the quote currency. Thus, the exchange rate of the CAD/BBD pair is the amount of BBD that can be bought using 1 CAD. For example, if the exchange rate for the pair is 1.4961, it means that 1 CAD buys 1.4961 BBD.
CAD/BBD Specification
Spread
One of the costs of trading forex is the spread. It is deducted by the forex broker and is calculated as the difference between the ‘bid’ and ‘ask’ price. The spread varies depending on the type of trade executed. Here are the spread charges for ECN and STP brokers for CAD/BBD pair.
In forex, slippage occurs when a trader opens a trade, but that trade is executed at a higher price. The slippage is influenced by market volatility and the speed at which the forex broker executes your trade.
Trading Range in the CAD/BBD Pair
In forex, the trading range shows how a given currency pair fluctuates over time. It shows the minimum, average, and the maximum volatility of pair across different timeframes. The analysis of the trading range can help us the profitability of trade over different timeframes.
The trading range for the CAD/BBD pair is shown below.
Shrink the chart so you can determine a larger period
Select your desired timeframe
Measure the floor level and set this value as the min
Measure the level of the 200-period SMA and set this as the average
Measure the peak levels and set this as Max.
CAD/BBD Cost as a Percentage of the Trading Range
Here, we will take the total costs in both the ECN and STP accounts as a ratio of the above volatility and express it as a percentage. This analysis will help us understand the trading costs associated with the CAD/BBD pair across different timeframes; which can be useful to determine which risk management technique is optimal.
ECN Model Account
Spread = 12 | Slippage = 2 | Trading fee = 1
Total cost = 15
STP Model Account
Spread = 17 | Slippage = 2 | Trading fee = 0
Total cost = 19
The Ideal Timeframe to Trade CAD/BBD
From the above analyses, we can see that the trading cost for the CAD/BBD pair is highest at the 1-hour timeframe. The highest trading cost for both the ECN and the STP accounts coincide with a period of lowest volatility of just 0.04 pips. The shorter timeframes have relatively higher trading costs that the longer timeframes. Therefore, longer-term traders tend to enjoy lesser costs.
We can also notice that the overall trading costs reduce as the volatility of the CAD/BBD pair increases from minimum to maximum. Therefore, opening trades when the volatility is above the average can help shorter-term traders reduce their trading costs. More so, intraday traders also significantly lower these costs by adopting the use of forex limit orders over the market orders. The limit order types remove the costs associated with slippage. Below is a demonstration with the ECN account.
ECN Account Using Limit Model Account
Total cost = Slippage + Spread + Trading fee
= 0 + 12 + 1 = 13
Removing the slippage costs reduces the trading costs significantly for the CAD/BBD pair. For example, the highest trading cost has reduced from 322.03% to 220.34% of the trading range.
JPYINR is a currency pair where JPY is the currency of Japan. On the other hand, the Indian Rupee (INR) is the currency of India. It is an exotic currency pair where the JPY is the first currency, and the INR is the second currency
Understanding JPYINR
In this currency pair, we can determine the value of INR, which is equivalent to one JPY. It is quoted as 1 JPY per X INR. For example, if the value of JPYINR is at 2.4458, then about 2.4 INR is required to purchase one JPY.
JPYINR Specification
Spread
The subtraction of Bid price and the Ask price is the spread. It is a charge that the broker takes from a trader when they open a trade. Therefore, the spread is controlled by the broker. This value changes with the execution model used for executing the trades.
Fees is the charge that broker takes from traders. Fees in the currency market works almost the same of other financial market. Note that, STP accounts does not have any fee, but a few pips is applicable on ECN accounts.
Slippage
Slippage is the difference between the execution price and the entry market price. Slippage occurs due to the market volatility and the broker’s execution.
Trading Range in JPYINR
The trading range is the representation of the minimum, average, and the maximum volatility of this pair on the 1H, 4H, 1D, 1W, and 1M timeframe. Using these values, we can assess our profit/loss margin of trade. Hence, this proves to be a helpful risk management tool for all types of traders.
Shrink the chart so you can assess a large time period
Select your desired timeframe
Measure the floor level and set this value as the min
Measure the level of the 200-period SMA and set this as the average
Measure the peak levels and set this as Max.
JPYINR Cost as a Percent of the Trading Range
With the volatility values from the above table, we can determine the chance of cost with the change of volatility. We have got the ratio between the total cost and the volatility values and converted into percentages.
ECN Model Account
Spread = 12 | Slippage = 5 | Trading fee = 8
Total cost = Spread + Slippage + Trading Fee
= 12 + 5 + 8
Total cost = 25
STP Model Account
Spread = 12 | Slippage = 5 | Trading fee = 0
Total cost = Spread + Slippage + Trading Fee
= 12 + 5 + 0
Total cost = 17
The Ideal way to trade the JPYINR
As per the above data, we can say that the JPYINR is very liquid and volatile currency pair. Hence, it is very easy to trade in this exotic-cross currency.
If we look at the timeframe, we can see that the volatility in the lower timeframe is higher compared to the higher timeframe. However, in the higher timeframe it is often hard for traders to trade as it requires a lot of trading equity. Based on the structure, we can say that it is better to follow the average cost of this currency pair
Another way to reduce the cost is to place orders as ‘limit’ and ‘stop’ instead of ‘market.’ In that case, there will be no cost for slippage on the total cost calculation. Therfore, the total cost will reduce by three pips.
Previously, we discussed a strategy that was based on a single candlestick pattern that uses the concept of ‘rejection’ in the market. However, the pattern may not provide a great amount of success as does not take into consideration the various factors of the market such as trend, momentum, volume etc. In today’s article, we try to formulate a strategy that addresses some of the issues and increase the probability of success. To increase the probability of successful trades, we combine two candlestick patterns and a technical indicator to find trades.
The first candlestick pattern we will watch for is the ‘Rising Wedge Pattern’ that occurs in an uptrend. The same pattern, when observed in a downtrend, is called a ‘Falling Wedge Pattern.’ The second candlestick pattern that is of importance to us is the ‘Descending Triangle’ pattern which essentially confirms the commencement of a new trend in the market. Let us look into the specifications of the strategy.
Time Frame
The strategy is specially designed for trading on very short-term price charts such as the 5 minutes or 1 minute. That means this is a hardcore intraday trading strategy.
Indicators
We make use of just one technical indicator in the strategy, and that is the 20-period Exponential Moving Average (EMA).
Currency Pairs
As we are trading extremely on small time-frames, the strategy can be traded on major currency pairs only. Few preferred ones are EUR/USD, GBP/USD, USD/CAD, GBP/JPY, EUR/CAD, EUR/JPY, NZD/USD, and EUR/GBP.
Strategy Concept
The ‘Dual Candlestick Pattern’ strategy is a simple yet powerful strategy that can be used very often in the market. The strategy revolved around the concept of ‘momentum’, which is extremely crucial in the market. When we gauge the momentum of the market, we get an understanding of the shift in market sentiment. Nothing can be as superior as this when it comes to analysing the market sentiment. The first candlestick pattern gives us an indication that the market is losing the momentum of its current trend and that it could reverse any moment. The price action suggests that the market is unable to move higher, and the price is getting more and more expensive for buyers to take the market higher. Once this becomes evident after a reversal, the second candlestick pattern confirms that the reversal is ‘real’ and there could be further ‘legs’ in the trend.
Since we are waiting for many events to occur in the market, we will end up entering late, i.e. when the majority of the move has happened. Due to this, the risk-to-reward of trades executed using this strategy will not exceed more than 1:1. Even though the probability of occurrences of trades is less, they have a greater degree of accuracy.
Trade Setup
In order to execute the strategy, we have considered the 1-minute chart of CAD/JPY where we will be illustrating a ‘short’ trade. Here are the steps to execute the strategy.
Step 1: Firstly, we spot the ‘rising wedge’ pattern in the market where the pattern must be formed above the exponential moving average. What this indicates is that the market has moved into an intermediary uptrend but might be weakening due to the loss in momentum. Our job is to take a trade in the direction of the reversal. Similarly, when a ‘falling wedge’ pattern is formed in the market, it indicates that the sellers are losing momentum and buyers will take over the market. This pattern has to form below the EMA for an upward reversal.
Step 2: Next, we wait for the market to turn on the other side and reverse in direction. After the reversal takes place, the price should form a ‘descending triangle’ pattern below the EMA. The ‘descending triangle’ pattern confirms two things. First, the market has put a ‘lower high’ and ‘lower low’ which are the essentials of a trend and second, the buyers are not strong enough to take the price higher. In a downtrend, the market should form an ‘ascending triangle’ pattern above the EMA that would confirm the reversal. Here the pattern signifies that the market has put a ‘higher high’ and ‘higher low’ along with the inability of the sellers to take the price lower.
Now, let us see the rules for ‘entering’ a trade.
Step 3: In a ‘short’ trade setup, we enter the market when price breaks the ‘support’ line that was created by the ‘descending triangle’ pattern. In simple words, we ‘short’ the currency pair right when the price starts moving below the previous ‘low’ and creates a situation of breakdown. This type of ‘entry’ is shown in below image where we enter right at the break of the ‘support.’ In a ‘long’ trade setup, things are reversed. This means we enter the market when price breaks above the resistance of ‘ascending triangle’ pattern and starts moving higher than the previous ‘high.’
Step 4: Once entered, it is important to determine the stop-loss and take-profit levels for the trade. In a ‘long’ trade, stop-Loss will be set above the first ‘lower high’ that was laid in by the market after reversal. Whereas, in a ‘short’ trade, the stop-loss will be placed below the first ‘higher low’ that was laid in by the market after reversal. Depending on the number of pips of the stop-loss, take-profit will be set by an equal number of pips. This is done to ensure that the risk-to-reward of the trade is at least 1:1. But since we are trading against the trend, we will move our stop-loss to breakeven as soon price moves 80% of the take-profit
Strategy Roundup
The two patterns needed for the strategy might appear several times in the market but are observed separately. It is difficult to spot both the patterns together, which reduces the frequency of trades. One way to increase the frequency of trades is by watching for these patterns during the market opening, as volatility is high. But the focus here should be on taking successful and high probability trades.
One of the primary indicators of a country’s GDP is how the economy is performing presently. The current economic conditions are the best indicators of business and economic cycles in the economy. They can tell us whether the economy is going through expansions or contractions. Thus, the current economic conditions are the best indicators for establishing recessions or recoveries, and can also be used to forewarn about potential overheating of the economy.
Understanding Current Economic Conditions
The current state of the economy is a culmination of several macroeconomic and microeconomic factors. Previous economic trends, government and central banks’ policies influence the current economic conditions. Therefore, the current economic conditions can be said to be a gauge of the effectiveness of previous fiscal and monetary policies.
In the US, for example, the Federal Reserve published the current economic conditions in The Beige Book. The Beige Book published the current economic conditions of the 12 Federal Reserve Districts. Below are the components used to determine the current economic conditions.
Employment and wages: The current economic conditions assess the overall levels of employment and changes in wages. Here, the changes are assessed based on industry. It covers the number of people who were laid off, new hires and job vacancies.
Prices: The prices of goods and services produced within the economy are monitored for inflation. The levels of inflation can be used to assess the living standards and the changes in the cost of doing business.
Manufacturing: The changes in the levels of manufacturing shows the growth of the output and potential changes in employment levels.
Consumer spending: This shows the changes in the welfare of households. Consumer spending correlates to living conditions and could be used as an indicator of future economic expansion or contraction due to changes in aggregate demand.
Banking and financial services: This section shows the changes in the issuing of new loans and the rate of defaults. The changes in the number of loans issued correspond to the changes in economic activities. The changes in commercial and industrial loans indicate whether businesses are investing and expanding. The repayment schedules indicate the financial health of businesses. Credit standards, delinquency rates and deposits are also included in this category.
Real estate and construction: This category shows the changes in the construction of new residential and commercial buildings. It further shows the sale of new houses. The occupancy levels and the changes in rental rates are also included here.
Services: This section reports the changes in the demand for professional services such as the demand for payroll services, accountancy and deal advisory services. It also shows the changes in the activities in the services sector as a whole.
Agriculture, energy and natural resources: this section reports the changes in the agricultural conditions. It shows the changes in crop production, the market prices for the harvest, cost of farm inputs, storage costs, and any subsidies received in the agricultural sector. This section also shows the changes in the mining sector.
How can current economic conditions be used for analysis?
By businesses: The current economic conditions show the trends in demand. Businesses can use the data contained in this report to either scale up their production to match rising demand or lower production in case of shrinking demand. Furthermore, producers get to see the regions where their products are performing well and where the sale is dismal. This data can help them make informed decisions for targeted advertising to improve sales or to exit a particular market segment if the costs outweigh potential profits.
By governments and central banks: The data on the employment situation, consumer spending, inflation and agriculture are useful for the government and central banks to make informed policy decisions. The current economic situation effectively shows if the economy is contracting, stagnating, expanding or overheating. Therefore, this data is crucial in informing the type of policy that will be implemented by the central banks and the government. The policies can be expansionary, contractionary or stay the course, accordingly. Furthermore, the current economic conditions can be used as a scorecard to assess whether previous fiscal and monetary policies brought about the intended changes within the economy. If not, then the government and central banks will know how to tweak the policies to achieve the desired results in the economy.
Impact on Currency
When it comes to fundamental economic indicators, forex traders pay the most attention to how the data will affect future monetary policies by central banks.
If the current economic conditions data indicate that the economy is in a recession, forex traders can then anticipate lower GDP levels, and adopt a bearish stance on the currency. Furthermore, they can also anticipate that expansionary monetary policies will be put in place to spur economic growth. Lowering the interest rates as an expansionary policy is negative for a country’s currency. Although the cost of money will be cheaper, investments will also have lower returns relative to other countries. As a result, the currency depreciates.
Conversely, if the current economic data indicates that the economy is expanding, reaching peak levels, forex traders can anticipate higher levels of GDP; thus, adopting a bullish stance on the currency. For the authorities, monitoring the current economic conditions helps determine if the economic expansion is too rapid, resulting in overheating. To prevent the overheating, central banks and governments will implement contractionary monetary and fiscal policies. These policies are meant to ensure sustainable growth in the economy by making the cost of borrowing higher to discourage excessive borrowing. However, the rate of return on investments and government bonds increases. This increase leads to increased demand for investments in the country and consequently, the appreciation of the currency.
Sources of data
In the US, The Beige Book is published by the US Federal Reserve Board. This report is released eight times a year, two weeks before each Federal Open Market Committee meeting since it is used to guide their decision of short-term interest rates.
In the Euro Area, the current economic conditions are published by the Economic Research Institute ZEW.
Inflation is one of the most tracked economic indicators by policymakers, economists, consumers, businesses and analysts. The effects of inflation are felt throughout the economy – no exceptions. Inflation expectations can help every player in the economy better to prepare themselves in anticipation of future inflation levels. Therefore, we must understand the how the anticipation of the inflation rate impacts the economy.
Understanding Inflation Expectations
Inflation is the increase in the general prices of goods and services that are produced within an economy, over a specific period. This increase in the prices of goods and services tends to erode the purchasing power of a currency. Therefore, assuming there is no increase in wages, consumers can only be able to purchase a lesser quantity of goods and services. There are several causes of inflation, but the primary cause occurs when more money is supplied in the economy relative to the wealth.
Inflation rate: is the percentage increase in the prices for a basket of goods and services over a specific period. It is used to compare inflation over different periods.
Inflation expectation is the opinion about the future rate of inflation. This opinion is derived from different players in different sectors of the economy to guarantee the validity and ensure it the data is comprehensively representative. These players include investors, central bankers, and consumers. Their inflation expectation is based on a variety of economic activities they intend to undertake.
How to Calculate Inflation Expectations
These are the two main methods of calculating inflation expectations.
Market Survey
The central banks conduct surveys to determine inflation expectations. Households, businesses and economic experts are polled to ascertain if their welfare has improved and what they anticipate. The questioned asked mostly includes household finances, inflation, investment activities, changes in the ease of doing business and inflation. The polled panel is nationally representative
Market-based Method
In this method, the expected inflation can be determined by the understanding of the price differential between government bonds and the Treasury Inflated Protected Securities (TIPS). The Treasury Inflated Protected Securities tends to increase the amount of the bonds in tandem with inflation.
In this case, the pricing difference = yield of a government bond – Yield of the TIPS
Let’s look at an example;
Suppose the yield of a 10-year bond is 5%, and the yield of a 10-year TIPS is 3%, the market pricing is 5% – 3% = 2%
The 2% can be said to be average annual expected inflation over the next ten years.
How can inflation Expectations be used for analysis?
The data on inflation expectations can be used by a variety of players in the economy. The inflation expectations data is the primary leading indicator of the rate of inflation in an economy.
Here are some of the ways different market participants can use the inflation expectations data.
Investment decision making: Businesses use the expected inflation data to make business decisions about future productions. They can choose to make changes on their product quality or quantity depending on the inflation outlook.
With expected inflations data, businesses can also make adjustments regarding factors of production. If the higher inflation rate is expected, businesses could opt into paying upfront for production inputs of their businesses. This upfront payment enables them to hedge against a future increase in the cost of businesses, thus protecting their bottom line. Furthermore, businesses can use this data during negotiating for employee contracts and wages.
Household decision making: Inflation expectations plays a vital role in households’ budgeting process. The data enables them to make rational decisions regarding expenditure, savings and investments. If they anticipate higher inflation, households can decide to put more funds into the purchase of essential products and cut back on savings and investments, since higher inflation erodes the value of money.
With lower inflation expectations, households might elect to increase their savings and investment activities since the potential increase in purchasing power will leave them with more disposable income.
Central banks and governments: One of the core mandates of the central banks is to ensure that the rate of inflations is kept below the targeted rate. Using the inflation expectations data, the central banks and governments can make informed policy decisions. These decisions are whether to implement expansionary or contractionary policies.
When the rate of inflation is expected to drop and result in deflation, central banks and the government will adopt expansionary monetary and fiscal policies. These policies include lowering interest rates to pump more money into the economy. Dramatically falling in the rates of inflation can be bad for the economy, as the reduced prices encourage complacency in the economy and could result in stagnation.
Conversely, expectations of higher rates of inflation will compel central banks and governments to adopt contractionary monetary and fiscal policies to avoid an overheating economy. Such policies will include increasing interest rates to make the cost of money more expensive and encourage investments and savings.
Impact on Currency
Since inflation expectations inform the decision of the central banks, it plays a vital role in the forex market.
When inflation expectations hint to lower rates of inflation, the outlook is negative for a country’s currency. The expansionary policies that ensue results in depreciation of the currency since the rate of return of investments will be less lucrative. The low-interest rates also make foreign bonds and treasury bills more attractive compared to local bonds; which results in a net outflow of investments.
Conversely, expectations of higher rates of inflation are positive for a country’s currency. The central banks will adopt contractionary policies like raising the interest rates, which makes an investment into the country more lucrative; increasing the demand for local currency hence appreciation.
Sources of Data
In the US, the inflation expectations data are released monthly on the last Friday of the month. The University of Michigan collates the data.
A comprehensive and historical breakdown of the US inflation expectations data can be accessed at St. Louis FRED here and here.
In the JPYKES currency pair, JPY is considered as the currency of Japan. On the other hand, KES is the currency of Kenya. It is an exotic currency pair where the JPY is the first currency, and the KES is the second currency.
Understanding JPYKES
The JPYKES represents how much KES is required to have one JPY. It is quoted as 1 JPY per X KES. For example, if the value of this currency pair is at 1.0286, then about 1.0286 KES is required to purchase one JPY.
JPYKES Specification
Spread
Spread comes from the difference between the Ask price and the Bid price that a broker takes as a charge. The brokers control this value; therefore, traders don’t have to do anything with this. This value depends in the execution model used for executing the trades.
Spread on ECN: 19 pips
Spread on STP: 24 pips
Fees
Every broker takes fees from trading in any currency pair, which is similar to the stock market. However, there is no fee on STP accounts, but a few pips on ECN accounts.
Slippage
Slippage is the difference between the open price of the trade and the actual execution level. The main reason for slippage is the market volatility and the broker’s execution speed.
Trading Range in JPYKES
The trading range is the representation of the minimum, average, and the maximum volatility of this pair on the 1H, 4H, 1D, 1W, and 1M timeframe. Using these values, we can assess our profit/loss margin of trade. Hence, this proves to be a helpful risk management tool for all types of traders.
Shrink the chart so you can assess a large time period
Select your desired timeframe
Measure the floor level and set this value as the min
Measure the level of the 200-period SMA and set this as the average
Measure the peak levels and set this as Max.
JPYKES Cost as a Percent of the Trading Range
With the volatility values from the above table, we can determine the chance of cost with the change of volatility. All got the ratio between total cost and volatility values and converted into percentages.
ECN Model Account
Spread = 19 | Slippage = 5 | Trading fee = 8
Total cost = Spread + Slippage + Trading Fee
= 19 + 5 + 8
Total cost = 32
STP Model Account
Spread = 19 | Slippage = 5 | Trading fee = 0
Total cost = Spread + Slippage + Trading Fee
= 19 + 5 + 0
Total cost = 24
The Ideal way to trade the JPYKES
The JPYKES is a currency pair that has sufficient volatility and liquidity. Therefore, it is simpler to trade this currency pair.
The percentage values are above 500% in a lower timeframe. This means that the costs are low regardless of the timeframe and volatility you trade.
Digging it a little deeper, the cost increases when the volatility decreases, and the cost decrease when the volatility increases. In a lower timeframe, this pair is very volatile at above 600%; therefore, traders should be cautious to trade it.
However, the best time to trade in this pair is when the volatility remains at the average value. In that case, this pair can provide a decent profit with balanced volatility and cost.
Furthermore, traders can quickly minimize their costs by using orders as ‘limit’ and ‘stop’ instead of ‘market.’ By using these orders, the slippage will not be considered in the calculation of total costs. Therefore, the total cost will reduce by five pips.
CAD/BRL is an exotic currency pair. CAD is the Canadian Dollar, and the BRL is Brazilian Real– the official currency of Brazil. For this pair, the CAD is the base currency and BRL the quote currency. Therefore, the exchange rate for the CAD/BRL pair represents the amount of BRL that can be bought by 1 CAD. Let’s say the exchange rate for the pair is 4.1564; this means that 1 CAD buys 4.1564 BRL.
CAD/BRL Specification
Spread
When trading a currency pair, the spread is the difference in the price at which you can buy the pair and that which you can sell. Forex brokers earn their revenues using spread from traders.
The spread for the CAD/BRL pair is:
ECN: 31 pips | STP: 36 pips
Fees
Another way for forex brokers to earn revenues is by charging a commission for every trade made. The fee charged depends on the broker. STP accounts usually do not have a trading fee charged.
Slippage
When initiating a trade, you instruct your broker to execute the trade at a particular price. Slippage in forex is the difference between the price you instruct the broker and the price the broker executes your trade. The primary causes of slippage are prevailing volatility and your broker’s efficiency.
Trading Range in the CAD/BRL Pair
In forex, the price of currency constantly fluctuates across different timeframes. Trading range in forex helps to analyze the market volatility for a currency pair across different timeframes. The volatility for a currency pair can help a trader estimate the amount of profit or loss that is to be expected when trading in different timeframes.
Let’s say, for example, that for the 4-hour timeframe, the volatility of CAD/BRL pair is 10 pips. A trader can expect to either gain or lose $24 by trading a standard lot of the CAD/BRL pair.
The table below shows the trading range for CAD/BRL.
Shrink the chart so you can determine a larger period
Select your desired timeframe
Measure the floor level and set this value as the min
Measure the level of the 200-period SMA and set this as the average
Measure the peak levels and set this as Max.
CAD/BRL Cost as a percentage of the Trading Range
Expressing trading costs as a percentage of the trading range can help traders determine the difference in the trading costs across various timeframes. It is worth noting that these costs are calculated as Percentage of pips in the different timeframes.
Total cost = Slippage + Spread + Trading Fee
The tables below show the percentage costs to be expected when trading the CAD/BRL pair.
ECN Model Account
Spread = 31 | Slippage = 2 | Trading fee = 1
Total cost = 34
STP Model Account
Spread = 36 | Slippage = 2 | Trading fee = 0
Total cost = 38
The Ideal Timeframe to Trade CAD/BRL
From the above cost analysis, we can observe that shorter timeframes when volatility is lower, have higher trading costs. The highest trading costs for both the ECN and the STP accounts are during the 1-hour timeframe, which coincides with the least volatility of 0.4 pips. The least trading costs for either account is at the 1-month timeframe coinciding with the highest volatility of 42.3 pips.
You can also notice that the trading costs reduce as the volatility increases across timeframes. For shorter-term traders, opening CAD/BRL trades when volatility is above average can help reduce trading costs.
Another method which forex traders can implement to reduce trading costs is by using limit orders instead of forex market orders. Forex limit orders eliminate the costs associated with slippage. Here’s how it works.
In the past few articles, we have discussed a lot of things related to trading breakouts and fakeout. The purpose of this article is to summarize the fundamentals of these concepts and understand what we have discussed until now.
Breakout trading is one of the most popular and straightforward approach to trade the market. Most of the technical indicators lagged in the market, but the breakout trading is a way to finish this lag between the entry and the trading signal. By trading the breakout, the goal of the trader is to enter the market right when the breakout happened and holds the trade for the brand new higher high or lower low.
Volatility plays a significant role in the breakout trading to ride the longer moves, in the stock market you can use the volume indicator to find out the market volatility, but in forex trading, there is no way to see the volume visually. To overcome this issue, there are various indicators in the market used by the traders to gauge the market volatility of any underlying asset. Using these below indicators, you can measure the volatility.
Bollinger Bands.
Moving Average.
Average True Range {ATR}.
There are usually two types of breakouts which are very popular among traders.
Continuation.
Reversal.
Continuation – Continuation is a type of pattern trading where the traders look for a trending market. When the price action pulls back enough and break the most recent higher high in an uptrend, it means the breakout happens, and any long trade will be highly appreciated.
Reversals – Reversal trading is also an effective way to trade the top and bottom of the market. In reversal trading, traders often look for the most recent higher low to break in an uptrend to take the selling trade. Conversely, the break of the most recent lower high is a signal to go long in an underlying asset. Breakout is the only way to catch the top and bottom in the market.
Fakeouts
A fakeout is a term used in a technical analysis which used to refer to a situation where the trader enters into a trade, but the signal never developed and the market immediately reverse against the trader. These are the most frustrating situations for the traders to deal with. Every newbie to the professionals face these kinds of situations in their trading, and it can cause a considerable amount of losses to the trader.
Most of the traders often wonder why these things happened with them. The primary causes behind these problems are the traders sometimes didn’t scan the market very well, or they didn’t focus on all the market variables. For example, sometimes news did this kind of unnecessary movements, so before entering in the trade always check is there any news coming up in the upcoming hours, if yes then ignore the trade and look for another opportunity.
Another thing does not add many indicators to your price chart, this thing will confuse you, and you will end up entering a trade way earlier. Make your charts clean and straightforward, and always use only one type of strategy to trade the market. The best way to avoid fakeouts is to fade the breakout. Fading the breakout means to wait for the price action to hold above or below the significant level then only activate the trade, do not make the mistake of entering in a trade when the price action breaks the major level, always wait for the confirmation first to avoid the unnecessary losses.
In this analysis, we will look into endogenous economic factors that influence Australia and Switzerland’s growth. We will analyze factors that affect the fluctuation of the exchange rate of the AUD/CHF forex pair. Ranking Scale Both the endogenous and exogenous factors are ranked on a sliding scale from -10 to +10. The ranking depends on […]
In this analysis, we will look into endogenous economic factors that influence Australia and Switzerland’s growth. We will analyze factors that affect the fluctuation of the exchange rate of the AUD/CHF forex pair. Ranking Scale Both the endogenous and exogenous factors are ranked on a sliding scale from -10 to +10. The ranking depends on […]
In this analysis, we will look into endogenous economic factors that influence Australia and Switzerland’s growth. We will analyze factors that affect the fluctuation of the exchange rate of the AUD/CHF forex pair.
Ranking Scale
Both the endogenous and exogenous factors are ranked on a sliding scale from -10 to +10. The ranking depends on correlation analysis of the endogenous factors with domestic GDP growth, and exogenous factors with the AUD/CHF exchange rate.
Domestic currency increases in value when the endogenous factor has a positive score and depreciates if it is negative. Similarly, the AUD/CHF exchange rate rises if the exogenous score is positive and drops if negative.
Summary – CHF Endogenous Analysis
Indicator
Score
Total
State
Comment
Switzerland Unemployed Persons
-6
10
153,270 in November 2020
2020 mean is 142,100 above the historic average of 59,003
Switzerland Producer Prices Change
-3
10
Decreased by 2.7% in November 2020
Represents the 23rd consecutive month of a price decrease
Switzerland Capacity Utilisation
-6
10
78.11% in Q4 2020
Q4 is the lowest recorded in 2020. It’s also lower than the historical average of 80.03%
Switzerland Household Saving Ratio
-5
10
Expected to reach 15.4% in 2020
This would be the highest level in Switzerland’s history
Switzerland House Price Index
1
10
172.82 points in Q3 2020
Throughout 2020, the Swiss Residential House Price Index has remained above the historic average of 106.48 points
Switzerland Fiscal Expenditure
3
10
Projected to hit 235 billion CHF in 2020
This would be the highest level in Switzerland’s history. It’s a direct result of the unprecedented expansionary fiscal policy
Switzerland Bankruptcies
1
10
14,800 companies in 2020
Precipitated by the adverse operating and economic conditions due to the coronavirus pandemic
TOTAL SCORE
-15
Switzerland Unemployed Persons
In Switzerland, the labour market is made up of Swiss citizens aged 16 to 65 years. The number of unemployed persons includes those who are available for work but could not get employed during the survey period. Note that the number of unemployed persons does not cover those working temporarily and must include those who have made efforts to seek gainful employment within four weeks. This number shows the prevailing economic situation in Switzerland since employment levels correspond to economic growth.
In November 2020, unemployed persons in Switzerland rose to 153,270 from 149,118 in October. In 2020, the mean of the unemployed persons in Switzerland is around 142,100 above the historic average of 59003. It has a score of -6
Switzerland Producer and Import Prices
The Swiss PPI measures the change in the price of goods produced within the country and sold to wholesalers. It also includes the price changes of goods that are imported for resale in Switzerland. The PPI is a leading indicator of inflation in Switzerland since the change in the producer prices is passed to the final consumers of the products.
In November 2020, the YoY Swiss PPI dropped by 2.7% compared to a 2.9% drop recorded in October. This is the 23rd consecutive drop in the PPI. However, it was the slowest drop since March indicating that domestic demand is picking up. It has a score of -3.
Switzerland Capacity Utilisation
This tracks the percentage change in the ratio of actual industrial production in Switzerland and the maximum potential output. This ratio shows the rate at which the Swiss industries utilise the available resources. Typically, when the capacity utilisation rate increases, the output in the Swiss industrial sector also increases. This corresponds to economic expansion and improved living standards.
In Q4 2020, the Swiss capacity utilisation rose to 78.11% compared to 76.67% in Q3. However, the Q4 ratio is lower than the 81.34% in Q1, 80.03% in Q3, and the historical average of 83.45%. Consequently, it has a score of -6.
Switzerland Household Saving Rate
This is the ratio between the amount that Swiss households save to their disposable income. In an economy, when the savings rate is high, domestic consumption takes a hit. Since a higher household savings rate corresponds to a drop in domestic demand, it leads to a decrease in GDP growth, and vice versa.
In 2020, Switzerland household saving rate is projected to hit 15.4%, which would mark the highest level in Switzerland’s history. It has a score of -5.
Switzerland Residential House Price Index
This index tracks the change in the quarterly change of the price of single-family homes. Price change in the real estate sector is a leading indicator of overall economic growth. Residential property increases in price due to rising demand, which means there is access to affordable financing or increased disposable income.
In Q3 of 2020, Swiss housing price index increased to 172.82 points from 169.22 points in Q2. Throughout 2020, the Swiss HPI has remained above the historic average of 106.48 points. This shows that domestic residential property did not take a hit as a result of the coronavirus pandemic. It has a score of 1.
Switzerland Fiscal Expenditure
This measures the totality of expenses by the Swiss government. They include expenditure on goods and services, public investment, and transfer payments. Note that fiscal expenditure is a primary method for the government to influence the economic growth rate.
In 2019, the Swiss government’s fiscal expenditure increased to 224.309 billion CHF from 221.715 billion CHF. It is projected to hit an all-time high of 235 billion CHF in 2020 due to unprecedented fiscal expansionary measures to combat the pandemic. It has a score of 3.
Switzerland Bankruptcies
This measures the number of companies operating in Switzerland that are forced to close down due to the inability to service their debt obligations. Typically, the number of bankruptcies increases when the economy is performing poorly.
In 2020, the number of Swiss bankruptcies is projected to reach historic highs of about 14,800. It has a score of 1.
AUD/CHF Exogenous Analysis
Australia and Switzerland Terms of Trade Differential
A country’s terms of trade are derived from dividing the value of its exports with its imports. Thus, a country with a surplus net current account balance has terms of trade above 100%. Conversely, when its balance of payments has a deficit, the terms of trade will be below 100%.
In international trade, the domestic currency appreciates when a country has favourable terms of trade, and depreciate when unfavourable. Thus, when the differential of the terms of trade between Australia and Switzerland is negative, the AUD/CHF pair is expected to be on a downtrend. If the differential is positive, we can expect an uptrend for the AUD/CHF pair.
From January to October 2020, Australia’s average TOT was 97.9% while Switzerland had 121.15%. The differential is -23.25% and has a score of -4.
Annual GDP Growth Rate Differential between Australia and Switzerland
The differential in the annual GDP growth rate is the difference between Australia’s and Swiss annualised GDP growth rate. Naturally, a country with a higher GDP growth rate tends to have a stronger currency than those with a slower GDP growth rate.
When this differential is positive, Australia has a higher annualised GDP rate than Switzerland. Since the AUD will subsequently appreciate more than the CHF, we can expect a bullish trend for the AUD/CHF pair. Conversely, if the Swiss economy has a higher annual GDP growth rate, then the differential will be negative. Consequently, the AUD/CHF pair has a bearish trend.
Australia had an annual GDP growth rate of -8.8% during the first three quarters of 2020, while the Swiss economy has an annual growth rate of -10%. The differential is 1.2%, and it has a score of 2.
In the forex market, the interest rate differential determines the flow of capital between two currencies. For the AUD/CHF pair, the interest rate differential determines if traders and investors will go long or short the pair.
A positive interest rate differential means that Australia has higher interest rates than Switzerland; hence a bullish AUD/CHF pair. Negative differential means Switzerland has a higher interest rate than Australia; hence a bearish AUD/CHF.
In 2020, the Reserve Bank of Australia cut interest rates from 0.75% to 0.1% while the Swiss National Bank maintained interest rate at -0.75%. Therefore, the interest rate differential for the AUD/CHF pair is 0.85%, and it has a score of 5.
Conclusion
Indicator
Score
Total
State
Comment
Australia and Switzerland Terms of Trade Differential
-4
10
A differential of -23.25%
Switzerland has a current account surplus hence better terms of trade than Australia
Annual GDP Growth Rate Differential between Australia and Switzerland
2
10
1.20%
Australian economy marginally contracted at a slower pace than the Swiss economy
The AUD/CHF interest rate differential
5
10
0.85%
The SNB has maintained interest rate at -0.75% and has no short-term prospects of changing the policy. A policy change from the RBA might trigger any changes in the differential
TOTAL SCORE
3
The cumulative exogenous score for the AUD/CHF pair is 3, which implies that we can expect the pair to continue trading on a bullish trend. The pair’s weekly chart’s technical analysis shows it is attempting to break through the upper Bollinger band. Furthermore, it has formed a series of bullish ‘hammer’ candles meaning that sellers have failed to drive down the exchange rate.
NZD/AED is a currency pair where NZD is the currency of New Zealand. On the other hand, the AED is the currency of the United Arab Emirates (UAE). It is an exotic currency pair where the NZD is the first currency, and the AED is the second currency. Understanding NZD/AED The price of NZDAED represents […]
NZD/AED is a currency pair where NZD is the currency of New Zealand. On the other hand, the AED is the currency of the United Arab Emirates (UAE). It is an exotic currency pair where the NZD is the first currency, and the AED is the second currency. Understanding NZD/AED The price of NZDAED represents […]
NZD/AED is a currency pair where NZD is the currency of New Zealand. On the other hand, the AED is the currency of the United Arab Emirates (UAE). It is an exotic currency pair where the NZD is the first currency, and the AED is the second currency.
Understanding NZD/AED
The price of NZDAED represents the value of AED, which is equivalent to one NZD. It is quoted as 1 NZD per X AED. For example, this pair is at 2.4458, then about 2.4458 AED is required to purchase one NZD.
NZD/AED Specification
Spread
If we subtract the Bid price and the Ask price, we will find the spread. The spread is usually a charge that the broker takes from a trader when they open a trade. Therefore, the spread is controlled by the broker. This value depends on the execution model used for executing trades.
Spread on ECN: 9 pips | Spread on STP: 14 pips
Fees
The fees in the currency pair trading are almost similar to the other financial market. Note that, STP accounts do not take charges, but a few pips are charged on ECN accounts.
Slippage
Slippage is the difference between the instant execution price and the open market price. The market volatility and the broker’s execution speed are the reasons for slippage to occur.
Trading Range in NZD/AED
The trading range is the representation of the minimum, average, and the maximum volatility of this pair on the 1H, 4H, 1D, 1W, and 1M timeframe. Using these values, we can assess our profit/loss margin of trade. Hence, this proves to be a helpful risk management tool for all types of traders.
Shrink the chart so you can assess a large time period
Select your desired timeframe
Measure the floor level and set this value as the min
Measure the level of the 200-period SMA and set this as the average
Measure the peak levels and set this as Max.
NZD/AED Cost as a Percent of the Trading Range
With the volatility values from the above table, we can see how the cost changes with the change in volatility of the market. We have got the ratio between the total cost and the volatility values; therefore, converted these into percentages.
ECN Model Account
Spread = 9 | Slippage = 5 | Trading fee = 8
Total cost = Spread + Slippage + Trading Fee
= 9 + 5 + 8 = 22
STP Model Account
Spread = 14 | Slippage = 5 | Trading fee = 0
Total cost = Spread + Slippage + Trading Fee
= 14 + 5 + 0 = 19
The Ideal Way to Trade the NZD/AED
The exotic NZDAED pair is a liquid and volatile currency pair. Therefore, it is very easy to trade this exotic-cross currency pair. From the above table, we can see that the percentage values are 200% in the ECN model and within 128% in the STP model. It means the cost is comparatively low, and if we trade in the STP model, the cost will be further low.
In the lower timeframe, the volatility is comparatively higher, but the Percentage of volatility is not much higher to indicate that it is not tradeable. However, in a higher timeframe, the volatility is lower, but it is often hard for traders to trade in a higher timeframe as it requires a lot of patience and balance.
Furthermore, another way to reduce the cost is to place orders as ‘limit’ and ‘stop’ instead of ‘market.’ In that case, the slippage will not be considered in the calculation of the total costs. So, in our example, the total cost will reduce by three pips.
The global macro analysis of the AUD/JPY pair focuses on endogenous factors that impact GDP growth in Australia and Japan. We’ll also analyze exogenous factors that determine the exchange rate fluctuation of the AUD/JPY pair. Ranking Scale We will rank these factors on a scale from -10 to +10 depending on the severity of their […]
The global macro analysis of the AUD/JPY pair focuses on endogenous factors that impact GDP growth in Australia and Japan. We’ll also analyze exogenous factors that determine the exchange rate fluctuation of the AUD/JPY pair. Ranking Scale We will rank these factors on a scale from -10 to +10 depending on the severity of their […]
The global macro analysis of the AUD/JPY pair focuses on endogenous factors that impact GDP growth in Australia and Japan. We’ll also analyze exogenous factors that determine the exchange rate fluctuation of the AUD/JPY pair.
Ranking Scale
We will rank these factors on a scale from -10 to +10 depending on the severity of their impact.
To determine the rank for endogenous factors, we will conduct a correlation analysis with the GDP growth rate. If the ranking is positive, the endogenous factors have led to an increase in either the AUD or JPY. If the ranking is negative, they have resulted in domestic currencies shedding some of their value.
For exogenous factors, ranking is derived from correlation analysis with the exchange rate of AUD/JPY. If the ranking is negative, the exogenous factor has resulted in a bearish trend for the pair. Conversely, a positive ranking implies the factor resulted in a bullish trend.
AUD Endogenous Analysis
Australia Unemployed Persons
As an economic indicator, unemployed persons show the number of the working-age population actively looking for employment. This number is used to show the health of the labor market. It also estimates how well the economy is performing; an expanding economy creates more job opportunities, hence decreasing the number of unemployed persons. Conversely, a deteriorating economy results in job losses, increasing the number of unemployed persons.
In November 2020, the number of unemployed persons in Australia dropped to 942,100 from 959,400 in October. This number is still higher than the historic average of 639,530 and higher than 722,060 recorded in January. It has a score of -6.
Australia Producer Prices Change
This indicator measures the changes in the price of goods that manufacturers sell directly to wholesalers over a particular period. It is a leading indicator of overall inflation since the prices of goods and services from the manufacturers will be passed to the final consumer. Typically, an increase in demand in the market leads to higher prices while a drop in aggregate demand results in lower prices. Thus, changes in producer prices correspond to changes in GDP.
In the third quarter of 2020, the YoY Australia producer price changes dropped by 0.4% same as Q2. In Q1, the index was higher by 1.3%. Thus, we assign a score of -4.
Australia Capacity Utilisation
Capacity utilization measures the degree to which a country’s manufacturing and production capabilities are being put to use. It shows the total output being produced vs the maximum potential output produced using the same resources. In Australia, capacity utilization includes companies operating in the industrial sector; which include manufacturing, mining, and utility firms. It is a leading indicator of overall economic growth.
In November 2020, Australian capacity utilization rose to 79.32% from 77.93% in October. This shows that the industrial sector is expanding from the lows of the pandemic. However, the current utilization is still below 81.34% recorded in January. It has a score of -5.
Australia Household Saving Ratio
This represents the portion of the disposable income that households do not use to purchase goods and services and transfer payments. Typically, what is not consumed is considered savings. Therefore, when the household saving ratio increases, Australian households are spending less on domestic consumption. Since GDP heavily relies on domestic expenditure, an increase in household savings ratio is a leading indicator of economic contraction.
In the third quarter of 2020, Australia’s household saving ratio dropped to 18.9% from historic highs of 22.1% in Q2. Q3 reading is the fourth-highest since 1960. It has a score of -7.
Australia House Price Index
In Australia, the HPI measures the quarterly change in the price of residential property in eight cities. Canberra, Sydney, Brisbane, Hobart, Melbourne, Perth, Adelaide, and Darwin. When the HPI increases, it shows that demand in the real estate market is growing, which corresponds to economic expansion.
In the third quarter of 2020, HPI in Australia increased by 0.8% from a drop of 1.8% in Q2. The Q3 increase is attributed to the easing of COVID-19 restrictions that stifled the economy in Q2. It has a score of 2.
Australia Fiscal Expenditure
This includes the totality of government expenditure on the purchase of goods and services, transfer payments in social security, and investments. It is used in the computation of the total government budget value. Fiscal policy is used to stimulate economic growth. Usually, in times of economic crises, the government increases its fiscal expenditure – mostly on transfer payments. This is meant to cushion households from adverse economic conditions. More so, it increases domestic demand which spurs economic growth.
In November 2020, Australia’s fiscal expenditure dropped to 49.504 billion AUD from 50.801 billion AUD in October. In May, Australia’s fiscal expenditure hit historic highs of 79.545 billion AUD. It has a score of 5.
Australia Bankruptcies
This shows the number of companies operating in Australia unable to continue with their operations due to the inability to repay their debts. It corresponds to changes in economic conditions and demand for goods and services by households.
In October 2020, the number of companies that declared bankruptcy in Australia dropped to 279 from 298 in September. There has been a steady decline in Australian bankruptcies since March when it reached yearly highs of 683. It has a score of 3.
Conclusion
Indicator
Score
Total
State
Comment
Australia Unemployed Persons
-6
10
942100 in November 2020
Above the historic average of 696530. The increase in unemployed persons in 2020 is attributed to economic shocks of COVID-19
Australia Producer Prices Change
-4
10
Dropped by 0.4% in Q3 2020
The PPI has dropped in 2020 primarily because of the depressed domestic demand
Australia Capacity Utilisation
-5
10
79.32% in November 2020
The industrial sector in Australia is resuming full operations from the pandemic lockdown. The capacity utilisation is still below pre-pandemic levels
Australia Household Saving Ratio
-7
10
18.9% in Q3 2020
Q2 reading was the highest in Australian history. Q3 ratio is the fourth highest. This shows that domestic demand was depressed in 2020
Australia House Price Index
2
10
Increased by 0.8% in Q3 2020
An improvement from a drop of 1.8% in Q2. Demand in real estate is picking up after easing of COVID-19 restrictions
Australia Fiscal Expenditure
5
10
49.504 billion AUD in November 2020
2020 was characterised by the unprecedented increase in fiscal expenditure as the government attempted to avert an irreversible recession
Australia Bankruptcies
3
10
279 companies in October 2020
A steady decline in the number of bankruptcy filings since May
TOTAL SCORE
-12
JPY Endogenous Analysis
Japan Unemployed Persons
This indicator shows the Japanese labour market’s state by analysing the changes in the number of people who are actively seeking employment. It shows the rate at which the domestic economy is creating and shedding jobs. When the number of unemployed increases, it means that the economy is losing more jobs than creating, showing that the economy is contracting; and vice versa.
In November 2020, the number of unemployed persons in Japan dropped to 1.98 million from 2.14 million in October. Since January, it has increased by 340,000 is higher than the historic average of 1.67 million. It has a score of -7.
Japan Producer Prices Change
The producer price change measures the YoY change in the prices of goods and services sold to the wholesalers directly from the producers. The index covers all sectors in the Japanese economy. Hence it is a leading indicator of the overall inflation in the economy.
In November 2020, the YoY Japan producer price change dropped by 2.2% down from the 2.1% drop recorded in October. The November drop is attributed to petroleum & coal products. The historic average for the japan producer price change is 1.36%. It has a score of -3.
Japan Capacity Utilization
Japan’s economy is heavily dependent on industrial activity. Capacity utilisation shows the percentage of actual output from the industrial sector compared to the maximum capacity. Note that this indicator only measures the relative capacity utilisation based on a benchmark year. When it increases, the industrial sector is expanding with the available resources being put to the most use possible.
In October 2020, Japan industrial capacity utilisation increased to 95.4% from 90% in September. This is the highest recorded since March. Throughout the year, the capacity utilisation in Japan has been below the historic average of 110.32 points. It has a score of -2.
Japan Workers’ Households Ratio of Net Savings and Insurance
This measures the amount of income that households in Japan save in relation to their total disposable income. When the ratio increases, Japanese households are postponing consumption. This is interpreted as expectations that future economic conditions might worsen; hence, households save for a rainy day. In such a case, domestic demand for goods and services is depressed, which means that the GDP drops. Conversely, when the savings ratio decreases, expenditure increases; hence, rise in the GDP.
In October 2020, household saving rate in Japan rose to 29.7% from 19% in September. Due to the economic uncertainties of COVID-19, June 2020 recorded the highest ever personal saving ratio in Japan of 62.1% it has a score of -5.
Japan Residential Property Price Index
This tracks the price changes in the Japanese real estate market for residential property, including condominium, land, and detached houses. Note that price in real estate corresponds to changes in the demand. Thus, when demand is high, the residential property index increases, and drops when demand is low.
In August 2020, the Housing Index in Japan was 113.86 points up from 111.9 points in July. The August index is higher than the historic average of 104.99 points but lower than January’s 114.66 points. It has a score of -1.
Japan Government Spending
Japan government spending shows the amount of money that the Japanese government uses to purchase national goods and services, repayment of government debt, and transfer payments. Whenever the government intends on influencing economic growth, it adjusts the government spending as part of its fiscal policy measure. This involves adjusting budgetary targets, levels of taxes, and expenditure plans. During the coronavirus pandemic, for example, the government increased its national spending, especially in transfer payments. That was meant to shield households from the economic shocks and to stimulate economic growth.
In the third quarter of 2020, Japan government spending rose to 114.509 trillion JPY from 114.404 trillion JPY in Q2. This is the highest government spending in the history of Japan. It has a score of 4.
Japan Bankruptcies
Bankruptcies show the monthly change in the number of Japanese businesses unable to service their debt obligations and thus forced to cease operations. As an indicator of the domestic economy, bankruptcies show how well the economy supports businesses in terms of creating and shedding jobs. Naturally, when bankruptcies increase, it correlates with increases in job losses and contraction of the economy.
In November 2020, the number of bankruptcies in Japan was 569 down from 624 in October. It has a score of 1.
Conclusion
Indicator
Score
Total
State
Comment
Japan Unemployed Persons
-7
10
1.98 million in November 2020
Above the historic average of 1.68 million. The Japanese labour market has lost about 340,000 jobs since January
Japan Producer Prices Change
-3
10
Down by 2.2% in November 2020
The decrease in PPI mainly attributed to a drop in the price of petroleum and coal products
Japan Capacity Utilisation
-2
10
95.4% in October
The highest recorded since March. The economy is gradually returning to full operations
Japan Household Saving Ratio
-5
10
29.7% in October 2020
The ratio is dropping from historic highs of 62.1% in June. Shows domestic demand is picking up
Japan House Price Index
-1
10
113.86 points in August 2020
The HPI is higher than the historic average of 104.99 points; but lower than pre-pandemic levels
Japan Fiscal Expenditure
4
10
114.509 billion JPY in Q3 2020
The highest in Japan’s history
Japan Bankruptcies
1
10
569 companies in November 2020
Bankruptcy filings drop as COVID-19 restrictions ease
TOTAL SCORE
-13
AUD/JPY Exogenous Analysis
Australia and Japan Terms of Trade Differential
A country’s TOT shows the ratio between the value of exports and the value of its imports. It represents the units of exports that can purchase a unit of imports. Therefore, when a country has a current account deficit, its terms of trade is less than 100%. If it has a current account surplus, its TOT is more than 100%.
In this case, the differential between Australia and Japan’s terms of trade is the difference between Australia’s terms of trade and Japan’s. When this differential is positive, it means that Australia has a higher current account balance than Japan. Consequently, implying that the AUD is in higher demand in the international market than the JPY, hence a bullish AUD/JPY. Conversely, the differential is negative when Japan has higher TOT than Australia, resulting in a bearish AUD/JPY.
Between January and October 2020, Australia TOT averaged at 97.9% while that of Japan at 106.43%. The terms of trade differential between Australia and Japan is -8.53%. It has a score of -3.
Annual GDP Growth Rate Differential between Australia and Japan
Annual GDP growth rate measures if a country’s economy is expanding, contracting, or stagnating. It tracks the change in GDP growth at a particular period over the preceding year. By measuring the annual GDP growth rate differential, we can effectively compare economic growth in Australia and Japan since both economies have different compositions, making absolute comparison ineffective. The differential is positive when the Australian economy is expanding faster or contracting slower than the Japanese economy. In this case, the AUD/JPY pair will be bullish, and vice versa.
In the first three quarters of 2020, Australia’s annual GDP growth rate was -8.8%, and that in Japan is -17.8%. The differential is 9%, and thus, has a score of 6.
The AUD/JPY pair’s interest rate differential shows whether the pair is bound to be bullish or bearish in the long term. If positive, then Australia has a higher interest rate than Japan which means that traders and investors would earn higher returns by selling the JPY and buying the AUD’ hence, a bullish AUD/JPY. When Japan has a higher interest rate, traders will earn higher returns by selling AUD and buying JPY; hence, a bearish AUD/JPY.
In 2020, the RBA cut interest rates from 0.75% to 0.1% while the BOJ maintained interest rate at -0.1%. Thus, the AUD/JPY interest rate differential is 0.2% and has a score of 3.
Conclusion
Indicator
Score
Total
State
Comment
Australia and Japan Terms of Trade Differential
-3
10
A differential of -8.53%
Japan has better terms of trade than Australia
Annual GDP Growth Rate Differential between Australia and Japan
6
10
9.00%
Japanese economy contracted faster than that of Australia. This might change as economies open up
The AUD/JPY interest rate differential
3
10
0.20%
The BOJ has no prospects pf changing the -0.1% interest rate. The differential is expected to change with changes in RBA’s interest rate policies
TOTAL SCORE
6
The exogenous factors have a score of 6 which means the AUD/JPY pair can be expected to continue trading in a bullish trend. Technical analysis of the pair’s weekly price chart shows it is attempting to breach the upper Bollinger band. More so, the pair has formed ‘hammer’ candlesticks showing that bears have failed to push the price lower.
“How long does it take to learn how to trade on Forex?”… There are many different variables to answer this question, which really boils down to the circumstances of each individual. But, there are different ways of understanding the subject that can help you pass the learning curve much faster. Unfortunately, some people never really […]
“How long does it take to learn how to trade on Forex?”… There are many different variables to answer this question, which really boils down to the circumstances of each individual. But, there are different ways of understanding the subject that can help you pass the learning curve much faster. Unfortunately, some people never really […]
“How long does it take to learn how to trade on Forex?”… There are many different variables to answer this question, which really boils down to the circumstances of each individual. But, there are different ways of understanding the subject that can help you pass the learning curve much faster. Unfortunately, some people never really learn to trade, but others do it very well and more when you understand that you never stop learning. What we want is that you can learn to trade Forex as quickly as possible but with minimal mistakes.
The importance of mentality…
Every day there are hundreds of traders entering and leaving the markets. Without a doubt, one of the advantages for successful traders has been their mindset. Unfortunately, they often take us to the market with the misunderstanding that it is easy to make a profit. We are also told that getting rich is not only easy but is to be expected. Actually, that’s not the real reality for the people involved. Usually, when traders look for quick and easy money, they end up ruining their accounts.
Most new traders find it disturbing if they “only win” a couple of percentages over the course of the month. Most traders see it as insignificant. However, professional traders are perfectly satisfied with that because they have much more information and strategy as well as tools at their disposal.
Trading is something that requires an extreme amount of patience, strategy, and of course education. You have to understand what you’re getting into. You’re negotiating against professionals who have studied for years and have many more tools than you. However, there are some benefits of being a retail trader as you are able to get in and out of a position pretty quickly. Fortunately, the retail trader doesn’t have those problems as someone who is trying to move US$20 million.
If your mentality is to know that you have a lot of work to do, but you can also get great rewards, it will serve you well in the future. Also, you have to understand that you must “love trading”. Perseverance is much easier for those who are doing something they really love. If you don’t really love trading, it will be very difficult to deal with the ups and downs of a trading career.
One of the best things about Forex trading is that you have a lot of free information on the Internet. You have the facility to search and find an immense amount of information and you may have the possibility to try several systems. Additionally, you also have the possibility to open a demo account, which means you don’t have to lose money in the process. These are the main advantages of trading on Forex, well above any other asset.
Most experienced traders will say that the best trading systems and methodologies are relatively simple. What we need to be clear about is that the simpler the methodology or the system, the more likely you are that it can be executed when the time comes. After all, the biggest problem that many traders have to overcome at first is “analysis paralysis,” which means they have too many things or indicators that come to them simultaneously to make a decent trading decision. Simplification is very often the way to make money in the long run because it clears up many things in the way of confusion.
Let’s not kid ourselves, success takes time…
Unfortunately, many retail traders will try to force time, and therefore lack of patience will almost certainly lead to very bad results. After all, there are many psychological obstacles when it comes to trading on Forex or any other kind of assets. Markets will move unpredictably, the most important thing is not how well your trading is planned. That is why re-testing a system in understanding its merits and weaknesses will become one of its greatest works.
To test a system, you’ll need to place theoretical trades in market conditions that simulate the returns you can expect. You can do this through various platforms and the like, or you can just look at a historical action chart and simulate what your operations would have been over several months, if not years. By testing the system, you will understand what the expected returns might be in the future. However, most people don’t make their way through this.
If you don’t have faith in your system, this is where you’re going to look for the next best thing. This is a cycle in which many new traders will fall, which means they may have come across a system that works in the long run, but they just haven’t given it a fair chance. This is where psychological means and knowledge of your system come into play. Everything will run through a demo account in the first place because it is too expensive to risk the trading capital in a real account for a hunch or some new methodology that you are dabbling in.
How to accelerate the learning curve…
Twitter is full of experienced traders who can offer an insight into how markets move. Certainly, we should not have excuses not to learn the necessary about the markets, because the amount of information that is freely available out there is really staggering.
Also, although most people want to hurry up and start earning money, there are no real shortcuts to learn from those who have already been there. That’s the strange thing about currency traders: they expect to be able to enter markets and clean up immediately. This is like hoping to be a great doctor by just showing up at the hospital. It takes some training and experience to become a profitable and successful trader.
Going where people have already succeeded, that’s the advice that anyone who succeeds will tell you, and Forex trading will be no different. Although there are no shortcuts, taking a mentor or learning from a professional can help you avoid some of the easily avoidable problems that exist. You can learn many disciplines such as trading systems, fundamental analysis, money management, risk indices to reward, things like Sharpe indices to measure a system, and so on. In short, someone who “has already been there” can help you avoid many of the most common mistakes.
Final thoughts…
There are no two traders who will work the same way, and it is important to understand that those who work harder will get better results. But, one thing that helped me a lot when I started out was checking the charts every night. After all, if you’re learning to operate with technical analysis, the graph and time don’t really matter. If you look at the graphics and notice a flag to bullish, it shouldn’t matter what market you’re trading in. This is where finding a graphics package or a website that gives you many opportunities to read the graphics over the weekend will speed up your progress. Think like this: if an average trader looks at 10 charts each day, you should look at a minimum of 30 charts. This will make you gain experience 3 times faster.
Another thing to think about is that some traders have a much more analytical mind than others. Those who understand the statistics of their trading system will understand that over time they will make money. They will not be shaken by the series of losses that will almost certainly come sooner or later. That being so, they understand that if they just stand firm, they will ultimately make a profit. Also, don’t get bogged down in the idea of jumping from one system to another, which is a long-term losing attitude.
In this article, I will try to expound on “Limiting Beliefs”: what they are, why they appear, and how they affect us in Trading.
In this article, I will try to expound on “Limiting Beliefs”: what they are, why they appear, and how they affect us in Trading.
In this article, I will try to expound on “Limiting Beliefs”: what they are, why they appear, and how they affect us in Trading.
What are limiting beliefs?
Limiting beliefs are norms that we absorb in our childhood, for example through the education of our parents, the media, school, etc. We simply believe what we are told and our subconscious assumes it as something real, And even more so, those beliefs are deep inside of us that we don’t even question. These beliefs are to blame for our failure to achieve our goals and live our values.
For example, some typical limiting beliefs:
I have to work hard to make money
The safest thing is to be a civil servant
Success takes time
It costs a lot to make money
It is better to buy flat than to rent
If someone offers me something sure that they want to cheat me
And if you focus on trading, a lot of those limiting beliefs come to mind:
Only 5% of investors are successful
It takes a lot of capital to make money
It is not possible to live off the markets
Strong hands control the markets
I have to ruin myself several times before being profitable
I’m sure you know a lot more.
Everyone’s beliefs form their own reality, and until you disassociate yourself from your limiting beliefs associated with trading, you can never succeed in trading.
A clear example of the negative power of these beliefs is found in athletics. In 1954, athlete Roger Bannister ran the mile below four minutes. Until then, it was assumed that it was physically impossible to do so. The breaking of that record, and of that limiting belief, made a year later 37 runners fall out of the four minutes, and two years later more than 300 runners got it.
When I read in blogs or forums, I notice that there is a very negative feeling regarding the Market. I do not stop reading post always asking the same or even reaffirming negatively the impossibility of being profitable:
Can you beat the market?
Who really wins in the markets?
How to invest and not die trying
Unconsciously, many people are taking these beliefs that they read as reality, they are creating their own limiting beliefs. Unfortunately, there are few comments positively reinforcing this issue, and if someone appears saying that it is profitable, usually instead of learning from it what is done is to criticize it (very common in the Spanish-speaking world).
But how do we eliminate those beliefs?
There is a work process called PCM, which are the initials of:
Possibility: achieving any goal is possible
Capacity: we are able to achieve this goal
Merit: we deserve to achieve that goal
Therefore, let’s assume that our goal is to achieve 50% profitability every year (some right now will be saying: only!! if I already win 100%; and others will be thinking: that’s impossible. well, guess who has the limiting problem).
The next step is to take a walk through the three pillars (Possibility, Ability, and Merit) and ask questions, so we have to find the limiting beliefs that prevent us from developing that goal. For example, one may think that it is not possible, or that it does not deserve it, but why? Perhaps because he believes he does not have the necessary resources (capital, training) or does not have the necessary skills, or because speculating is frowned upon by his family, etc. We have to ask ourselves until we find the root of the problem and discover what are the beliefs that limit us to continue growing.
And the next step is to change those beliefs. We have to turn them around and put them in our subconscious until they are part of us and our reality. This process of change may be more or less long depending on the person, their faith, but it is key to establishing new beliefs that will help us achieve our goals. To really see it first we have to think about it and believe it.
There’s a saying from Henry Ford that says, “Whether you think you can, or you think you can’t, you’re right.” So it’s up to you.
All traders at the end of the year always take stock of their own trading activity. There still exists an element that is never taken into account and therefore we tend to forget… How much value do we give to our time? Although it seems obvious, time cannot be “preserved”. It just passes. It is […]
All traders at the end of the year always take stock of their own trading activity. There still exists an element that is never taken into account and therefore we tend to forget… How much value do we give to our time? Although it seems obvious, time cannot be “preserved”. It just passes. It is […]
All traders at the end of the year always take stock of their own trading activity. There still exists an element that is never taken into account and therefore we tend to forget… How much value do we give to our time? Although it seems obvious, time cannot be “preserved”. It just passes. It is said that when we are born we are full of time, because we have a life ahead of us, but no one can quantify this wealth and no one can know how long a person’s life will last.
Even so, this wealth is a certainty, since time can be devoted to all things that free will allows. Bearing in mind that our choices will show us the way because at each decision we take new paths and leave others. This leads to a consequence: we spend more time on what motivates us the most. This motivation can be effective, economic, labor, sense of duty, etc. It is very interesting to know that on many occasions we use time as a currency of exchange.
Traders Exchange Time Continuously
This concept applies particularly well to a trader. He exchanges part of his time to have more availability of it, later. What does that mean? Invest money in the financial markets to get more of it and so have more time to live your life according to your desires and goals. Let me explain in detail what this phrase means.
Time and money are surely the two most important resources we have available to invest and make a profit. However, it is money that is really valued as an investment because it allows us, as a system of payment, exchange, and reference, to receive something in return.
Otherwise, when we invest our time, it is not so easy to quantify the return we will get, only in some cases will it give us a profit in the form of money. For example, in the event that we exchange our time with work to be rewarded with a salary. In others, the exchange is not tangible, for example, when we want to increase our knowledge through study.
Paradoxically, these resources have great similarities: both can be managed, lost, wasted, saved, they are not infinite, but the substantial difference is that only money can be earned. If money is lost, it can be recovered over time, but if time is lost, it can never be recovered, even by buying it.
Unconsciously, money is valued more than time, except by increasing age: older people value time more because they realize their lack. Time is available at no cost and is available at will. Moreover, it is the most equitable resource that exists: a priori, we all have it. The problem is your administration.
Different Uses of Time and Money
The same amount of money and time in the hands of different people will not match their uses, even if the source from which they come is the same. If it is easy to answer that time is the main resource we must fight for, we must be aware that money is decisive for our future. Buying new experiences or particular desires requires a significant monetary expense and an investment of time to enjoy them.
The needs of life and the time in which we live mark the future of events:
well-spent money costs little, while well-spent time is scarce and unwittingly spent
It is a good dilemma.
Time measurement precedes the creation of money and is often related to productivity. Benjamin Franklin said that “time is money” and explained that the time spent working to earn money was time well spent; otherwise, if time has been spent on other matters, the money has been lost. This reflection is correct only in its own context, outside it makes no sense because well-spent time not only generates money but also generates many benefits that go beyond money.
Both time and money are consumed even if nothing is done with them. If time passes, it is spent. If we do nothing with the money, like leaving it in a non-productive place, then inflation, over time, will despise its initial value. And this is one of the main theories of finance: while the price of money remains constant, its value fluctuates over time.
Time Must Be Devoted to Investment
In the world of investment, the results are obtained after having devoted much of our time to them. The paradox that to make money I have to invest my time and that if I have money I will have more control over my time, does not go beyond the fact that the reward of both is not proportional. Having a lot of money is not synonymous with having a lot of time.
Time is indifferent to the amount of money. Those who have obtained a significant amount of money have invested a lot of time in it and will also need a lot of time to manage it.
It is clear that everyone is happy in their own way, but those who have less money and more time to devote to themselves and their families may be happier. A study by the journal Social Psychological and Personality Science reveals that 64% of respondents prefer to have money for free time, even if the results changed when asked about happiness. In fact, it has been concluded that the amount of money accumulated is not proportional to happiness.
When a certain money limit is reached, by earning more, that additional amount is not proportional to the increase in happiness. In this sense, it is said, and rightly so, that the rich do not enjoy the same happiness as money. According to experts, this limit is at 60,000 euros per year. 60,000 euros a year? Someone will think: and how to reach them? But here an important reflection must enter.
Investing Time to Buy Time
The trader invests his time because more money improves the ability to use his time. Very true, but how do you use this time invested for this purpose? The trader must be really good at managing the time he dedicates to this profession. If the study of trading requires much of our time and dedication, it is also true that we should not launch it in a 10-hour session that brings nothing good.
Some will say it depends on how much you earn. That’s true, but only in part. If I have to destroy my psycho-physical balance to make money, there’s no point in working like this. Trading is said to be freedom, but this statement is the subtle line between good and evil.
If for the freedom we intend to spend money on totally useless luxury items or sit in front of the computer for many hours to end up repenting and burning our human contact with the outside world, happiness will never be there and this is clear to all. If instead, we refer to the possibility of having quality time, for example, staying with our loved ones or having experiences that enrich us as human beings, then everything changes.
Trading As a Process of Growth
Trading can be seen as a grand ladder: a path where we grow step by step first as people and then as operators. A continuous exchange of time and money that must have a higher quality of time available, but above all awareness of ourselves and how we want to live our lives.
Life… we know well that it is unique and we will never know the exact moment when we will leave. We must therefore be very responsible to ourselves throughout this journey. Negative emotions, the lack of objectives, and the inability to react in the difficult moments of this work must be prohibited.
Time is the most precious thing we have. Unfortunately, we rarely evaluate it consciously: it continues to diminish, inevitably tending to run towards a zero balance. Only in the future will we lose the past and this can never be recovered. Therefore, it is necessary to manage time: if you want to achieve something, the first thing is to realize it. It would be sad and illogical not to do so, it would be an act of self-denial.
With this publication, we will look at an incredible method of market analysis based on the volume Volume Spread Analysis (VSA), developed by the famous American financial analyst Tom Williams and published in the book «Master the Markets». This is an unusual view that deals with how market makers manipulate crowd behavior.
With this publication, we will look at an incredible method of market analysis based on the volume Volume Spread Analysis (VSA), developed by the famous American financial analyst Tom Williams and published in the book «Master the Markets». This is an unusual view that deals with how market makers manipulate crowd behavior.
With this publication, we will look at an incredible method of market analysis based on the volume Volume Spread Analysis (VSA), developed by the famous American financial analyst Tom Williams and published in the book «Master the Markets». This is an unusual view that deals with how market makers manipulate crowd behavior.
Not to recount the book, so in this series of articles, we will focus on the practical side of the method with a traditional reference to cryptocurrency trading. You can apply this method to any financial instrument, my examples will be in the BTCUSD pair.
Now, let’s discuss the theoretical principles of price formation in the market and how large capital traders influence the market. I will define the main concepts that I will use throughout the course. Therefore, you should study this article if you are interested in VSA and want to better understand the actions of large traders.
What are Trading Volumes?
Even if you’re just starting your trading career, you’ve probably found the following phrase: “The market goes up when demand prevails oversupply. And, on the contrary, the market will suffer a decline at the moment when supply is surpassing demand”. We need to study the principles suggested by this phrase in order to better understand what the volume of trade means.
For those who could not find a similar term, I must explain that, in trading, is the number of lots traded on the market within a specific period. Firstly, it should be understood that the volume taken in isolation does not provide much information. But, if what we do is compare the current volume with the previous day’s volume, or a week earlier…, you will see clearly the changes in business activity.
To better understand market processes, let us compare a change in volume with the price differential. This will show the feeling of the great players: bullies or bassists. Remember, the spread is the difference between high and low prices during a particular period.
In practice, price movements do not always correspond to current market activity. There are often cases where, after a small increase in volume, the price increases sharply, confusing many traders. But if you have already studied the concept of inertia, then you will have everything clearer. Then, in this situation, the market can be compared to a car in which driving at high speed will go uphill for a while, even if the driver has taken his foot off the accelerator.
What is Volume Spread Analysis?
The VSA method provides a complex approach to market analysis, which defines the relationships between asset price, spread, and volume. The last indicator shows the activity in the market. While the spread speaks of the amplitude of the price movement.
In establishing the relationships between these two characteristics, we strive to identify the imbalance between demand and supply. For the most part, it is a consequence of transactions opened by large operators, and in the trading environment, it is considered one of the most significant reasons for the market to move in one direction or another. In turn, knowing the imbalance and the true causes of its occurrence, we can easily predict the direction of future price movement.
Principles for the Movement of Assets
Volumes, like stock market trends, are also divided into bullish and bearish. The bullish volume increases the volume in the upward movements and decreases the volume in the downward movements. Consequently, the bearish volume increases the volume in downward movements and decreases the volume in upward movements.
Now let us examine the concepts of accumulation and distribution…
Cumulation means buying as many shares as possible, without significantly increasing the price compared to your own purchase, until there are few or no shares available at the price level you have been buying. This purchase usually occurs after a bearish move in the stock market and there are the best prices to buy.
Once most shares have been removed from the hands of other traders (ordinary natural persons), there won’t be much action left to sell at an additional price. In other words, resistance to the bullish movement has been neutralized. Then, in this situation, we can expect a steady increase in prices until syndicated traders perceive prices too high to sell those assets that just bought.
Distribution is the sale of assets, which should ideally be achieved without lowering the price against the sale of the market maker. This operation is done to take advantage of the profits of selling at the conditional peak of a bullish market. At the same time, most of these great players place large orders not even at a fixed cost, but at a range of prices.
If the total volume of transactions is so large that prices are forced to fall, the sale is suspended. Traders have another opportunity to sell securities profitably in the next wave upwards. Once professionals have sold most of their holdings, a bearish market begins because markets tend to fall without professional support.
Now, you understand that big forks see both sides of the market at the same time, which gives them a big advantage over common traders. To better understand the market, study the concepts of strong and weak holders.
Strong forks are professionals who have convenient positions and are able to easily read the market. Despite their ability, they can open more unprofitable operations than profitable ones, but close them quickly, considering losses as inevitable trading costs.
Weak holders are often new market amateurs, tied to their capital and therefore make emotional decisions, which are often at odds with common sense. They are often subjected to market pressure when prices turn against them, which is why they suffer heavy losses.
If we combine these concepts with those described above, we can summarize that: a bullish market is like this when a significant transfer of shares from weak holders to strong holders, usually with a loss for weak holders. A bearish market occurs when there has been a substantial transfer of shares from strong holders to weak holders, usually with a gain for strong holders.
When the market moves from one major trend state to another, an event called a buying or selling climax will occur. As a definition, it is an imbalance of demand and supply that causes a bullish market to become a bearish market or vice versa.
The climax of the purchase arises at a time of high demand for the asset and the active dumping of securities by the big players, which makes continuous growth impossible. In addition, in the bullish bar, the volume looks exceptionally high, accompanied by a new maximum and a widespread. At the end of the purchase climax, the market will close in the middle or high of the candle.
The selling climax, as seen in the name, is the exact opposite of a buying climax and usually occurs at the time of high sales. It presents an extremely high volume in downward movements, accompanied by wide spreads, with the price entering the local minimum. In the last phase of the sale climax, the price will close in the middle or under the candle.
Causes of Price Reversal
There are only two main reasons why there is a reversal of long-term trends in the market:
Most traders panic after observing substantial drops in a market (often from bad news) and usually follow their instinct to sell. Professional traders, in turn, think differently, asking a question: “Are big market players prepared to buy mass stock at these price levels?” If this is fulfilled, this will be a sign that indicates the strength of the market.
After substantial increases, usually for good news, most will get angry by missing the upward movement and will rush to buy. At this point, their professional colleagues are only interested in the willingness of big players to sell enough securities at the current price to meet demand. As you’ve already guessed, mass sales are a sign of market weakness.
Fundamentals of Market Reading
First, it is necessary to understand that markets move in so-called phases. Looking at the changes in volumes and price spreads, we can see that the market builds a cause for the next phase. The duration of the phases may vary. At the same time, it is normally assumed that short phases lead to small changes, while long ones lead to serious steps. In addition, we will group spreads in width, narrow, or simply average, which will allow us to delve into the current processes.
Definition of Market Strength
Marketers generally process and match purchase and sale orders from traders around the world. It’s your job to create a market. To perform its functions, the creator must have sufficiently large participation or values. If you do not have enough quantities on your books to trade at the current price level, you can move the price to a more appropriate level.
Often there are situations in which the bullish movement manages to get a better price from the floor of the bag. Why are you getting a good price? Incredible kindness from the creators? The reason is different. In fact, the market value perceived by market makers is much lower than theirs, because they have already received enough sales orders and want to get rid of them quickly, expecting a reversal of the trend or at least the transition from the market to the uncertainty stage.
Such action, repeated many times with any other buyer, will tend to reduce the spread of the day towards contraction. In other words, the upper price limit will be minimal. If, on the other hand, market makers have a bullish view, they will increase the price on their purchase order, giving you what appears to be a low price. This, repeatedly, causes the spread to expand as the price is constantly marked during the day.
Then, by simple observation of the extension of the bar, we can know the references of those who can see both ends of the market.
Another example is when you find market gaps or price gaps. This term in the technical analysis refers to a situation where there is a gap between the closing of the first bar and the opening of the next bar. For example, the market opens when market makers trap as many traders as possible in a potentially weak market and lose trades and create additional stress. As a rule, weak gaps are always in the zones of new highs, when the news is good and the bullish market seems to last forever.
It should be noted that gaps can be seen in strong markets. However, in such cases, a serious difference can be noticed in the form of an extended plane. Traders who have been trapped inside the channel will panic, convulsively trying to exit the trade at a price very similar to what they first entered. Some of them expect a break in price after having bought assets close at the upper limits of the channel. Others bought at the bottom, but do not see any serious upward movement.
In turn, professional traders are aware of the situation and, looking for the time it takes to sell their own assets, to keep the bullish sentiment raise prices, or open a new candle with a gap up. The volume increases, substantially supporting the movement. This leads to the conclusion that the movement of price is not a deceptive maneuver and the big players really see the strength of the market.
Broad spreads in most cases are designed to block most traders out of the market rather than trying to absorb them. This will tend to postpone, as it goes against human nature, buying something today that could have been bought cheaper yesterday. Such manipulations also frighten market participants who opened short positions near the last minimum in the constant bad news that appeared during this period.
So we draw an obvious conclusion. The volume that usually shows a healthy increase is the bullish volume. However, excessive volume is never a good sign, this indicates that supply can saturate demand. The low volume warns you of a clearly misleading upward movement. In this case, professionals perceive the market as weak, refusing to participate in the bullish movement. The amplifier of this signal will be the presence of a flat before the price jumps to low volumes.
We must also pay attention to the low volume rates in the downbars. This is a sign that the strength of the upward trend remains high, and the upward movement will continue in the foreseeable future.
For a bearish movement, the indications are the opposite. A bearish trend is strong when the falling bars have a high volume. However, excessive volume warns that the fall in price may not be natural and that demand may affect supply.
If the volume is decreasing on bearish sails, the sales pressure is also decreasing, which means that professionals are not interested in a further drop in prices. The market may be declining for longer due to inertia, but, soon, the price may increase due to insufficient supply.
Position size is usually the easiest way to keep maximum transaction loss under control, and sometimes it is the only way. The size of the forex position is how many forex batches (micro, mini or standard) you order per transaction. Your risk is broken down into 2 parts-transaction risks and account risk.
Position size is usually the easiest way to keep maximum transaction loss under control, and sometimes it is the only way. The size of the forex position is how many forex batches (micro, mini or standard) you order per transaction. Your risk is broken down into 2 parts-transaction risks and account risk.
Position size is usually the easiest way to keep maximum transaction loss under control, and sometimes it is the only way. The size of the forex position is how many forex batches (micro, mini or standard) you order per transaction. Your risk is broken down into 2 parts-transaction risks and account risk.
What is a lot in forex, how much is a lot and why does it matter? An obsessive approach to risk and money management, which means keeping transaction risk as low as possible or avoiding relatively large losses, whatever you call it, it separates the long-term elite survivors from the majority who eventually retire. The size of your positions is a fundamental part of risk management because the smaller the lots you handle, everything else being the same (leverage, number of lots, and more), the lower the value of a pip.
So, smaller batches of forex mean less profit in each percentage of movement in price, but also more important, less loss. It’s the losses that could end up with your capital, your trust, and your trading career. For a large number of reasons based on the history of fórex trading, currency pairs are traded in standard batches of 100,000 units of base currency (1 forex lot). To make trading more profitable for the average individual, online fórex brokers invented mini accounts with lots of 10,000 (1 mini lot) and micro-accounts with lots of the size of 1,000 units (1 micro lot). We don’t just like these innovations. We love them. Because a small lot reduces the risk for each lot traded, they give you a large number of advantages over standard lots.
They provide better flexibility to adjust the size of your positions to the circumstances:
When you’re winning, you can increase the size of the position by adding foxes.
While you’re learning, making the transition from a demo to a live account or a losing streak, small batches help you keep losses in check until your situation improves and is successful for weeks or months.
When you want to enter or exit from a staged position with only part of your planned position (another risk management technique), small lots make this technique easier to do while keeping total venture capital within 1-3 percent.
Here is how these elements link to give you the ideal forex position size, no matter what the market conditions, the mode of the transaction, or what forex strategy you are using.
Continue reading for more information on what is a lot in forex, how much is a lot, or begin to trade and see for yourself in real-time as the size of the lot in the forex influences your gains and losses.
01 – Determine the limit risk per transaction in your account.
This is the most important step in determining the size of the forex batch. Determine a percentage or a limit amount that you will risk for each transaction. The vast majority of professional traders dispose of their risk in a ratio of 1 to 3 percent of their account. Let’s take an example, if you have a $10,000 trading account, you could risk $100 per transaction if your risk is 1 percent of your account. If you risk 2%, then you can risk $200. You can also use a fixed amount, but ideally, this should be less than 2% of the value of your account. For example, you risk $150 per transaction. As long as your account balance is at $7,500, then you’re risking 2% or less. While other transaction variables may change, account risk remains constant. Choose how much you’re willing to risk in each transaction, and stick to that. Don’t risk 5% on one transaction, 1% on the next, and then 3% on another. If you choose 2% as the risk limit per transaction, then each transaction should risk 2%.
02 – Determine pip risk in a transaction.
You know the maximum risk you will take per transaction, now pay attention to the transaction in front of you. The Pip risk of each transaction is determined by the difference between the entry point where you place your stop-loss command. The stop-loss closes the transaction if the losses reach a certain amount. This is how we control the risk in each transaction to keep it within the limits set for the account, as discussed above.
Each transaction varies, based on volatility or strategy. Sometimes a transaction can have 5 pips of risk, and in another, there can be 15 pips of risk. When making a transaction, consider both your point of entry and the stop loss point. You want the stop loss point to be as close as possible to your entry point, but not so close that the transaction is settled before the expected movement occurs. Once you know how far the stop-loss entry point is, in pips, you can calculate the size of the ideal lot for the transaction.
03 – Determine the size of the forex position.
The ideal size of the fórex position is simply a mathematical formula equal to:
Pips at risk * value of the pip * negotiated lots = money at risk
We already know the figure of money at risk, because this is the maximum we can risk in any transaction (step 1). We know the Pips put at risk (step 2). We also know the value of the Pip for each currency pair (or you can search for it).
Now what needs to be done is discover the lots negotiated, what is the size of our position. Let’s assume you have a $5,000 account and risk 2% of your account on each transaction. You have the possibility to risk up to $100, and contemplate a transaction in EUR/USD where you want to buy at 1.3030 and set a stop loss at 1.2980. This situation results in 50 risk pips.
If you are trading mini lots, this way every pip move is worth $1. Therefore, taking the position of 1 mini lot will result in a risk of $ 50. But you are in the possibility to risk $ 100, therefore, you can acquire a position of 2 mini-batches. If you lose 50 pips in 2 mini fórex positions, you will have lost $100. This is the exact amount of risk you tolerate in your account; then the position size is accurately measured with respect to the size of your trading account and transaction specifications. You can enter any number in the formula to get the ideal size of your positions (in batches). The number of batches produced by the formula is linked to the value of the pip entered in the formula.
A proper selection of the size of forex positions is essential. Set the percentage you will risk per transaction; 1 to 3 percent is recommended. Note the risk per pip in each transaction. In relation to the risk taken on your account and pip, you can already calculate the batch size for your forex positions.
The smaller the size of the forex lot, the lower the risk because it reduces the following:
The cost of every 1 percent that moves against you.
Potential loss if your stop-loss order is reached. We measure the risk not by the total size of your position but by the potential loss if your stop-loss order is reached.
Yes, a smaller position means less profit when prices move in your favor, with less income as a result of trading operations. But the top priority is to have as few losses as possible. Always. A loss percentage requires a higher percentage to recover, as you have less base capital. Once you find the right combination of trading styles, instruments, and analysis that best suits you, you’ll have the time to increase batch size, risk, and profit potential.
Until you are consistently successful for many months (regardless of the percentage of successful transactions), the priority is to maintain risk and loss in any transaction within 1 to 3 percent of your account size. Benefiting only from the minority of successful transactions is fine, because many successful traders achieve it that way, as we will discuss in other articles.
One of the most challenging and time-consuming aspects is trying to find out what your trading style is and the time period that best suits you. From the perspective of technical analysis, that means finding the right tools that you will usually use and learning well. What are Forex indicators? Forex indicators are useful in […]
One of the most challenging and time-consuming aspects is trying to find out what your trading style is and the time period that best suits you. From the perspective of technical analysis, that means finding the right tools that you will usually use and learning well. What are Forex indicators? Forex indicators are useful in […]
One of the most challenging and time-consuming aspects is trying to find out what your trading style is and the time period that best suits you. From the perspective of technical analysis, that means finding the right tools that you will usually use and learning well.
What are Forex indicators?
Forex indicators are useful in helping you answer these dilemmas. What to do if a currency is making historical maximums and minimums, so there is not enough or no support and resistance to guide you in and out decisions? How do you know if you’re not shopping at the top, or selling right at the bottom, right before the trend ends? Ideally, in any case, you’d wait for a retraction of some kind, but in the meantime, you risk losing the trend!
If you’re in a winning transaction and you’re approaching your planned exit, how do you know if you should take a planned exit, or leave at least some of the position in the hope of letting the winnings run with a trailing stop?
The consensus is about 5 technical indicators that in the balance indicated between sufficient information to make appropriate decisions and not too much for you do not suffer from an information overload, paralysis by analysis. Practically, a precise combination of forex indicators can mean anything from three to seven indicators; ultimately it is your decision. You don’t have to get attached to the same tools all the time; just limit the number you’re seeing at a certain point. Those negotiating over longer periods of time have more time and can afford to see more indicators. They should also be more informed about the key long-term indicators of:
The savings of the currencies they are trading.
The macroeconomic engines of the global economy push the appetite for risk and influence all markets all the time.
This is very critical. As a minimum, it involves following a few fundamental analyses to read and at least an indicator that gives you a big perspective like the S&P 500 index (and what is driving it in the period of time you chose).
Continue reading for more information or start risk-free trading and combine the best fórex indicators in a successful way. Use software to create Expert Advisors to test and optimize your strategy and use it as a fórex robot for automated trading.
Recommended Forex Indicators
While the number of indicators you choose may vary with your preferences, needs, and trading style, the main principle in selecting your toolkit of indicators is to have a balance that gives you a good perspective of the different types of information you need, specifically:
Trading trend or range
Momentum
Support/Resistance
Timing or cycles
Trend or Range of Indicators
Indicators that follow trends, as the name suggests, are designed to take advantage of market trends. Examples of these include moving averages (Mms), the average directional index (ADX), and on-balance volume (OBV).
Range-based indicators are mostly designed to show oversold and oversold conditions in a price range that includes Bollinger Bands, the Commodity Channel Index (CCI), the Relative Strength Index (RSI), and the stochastics indicator. Some indicators, such as the moving average convergence divergence (MACD), can be used to generate either a trend-following signal or a range-based signal depending on the time periods used in the calculations.
Probably the best fórex indicator in the world is the Double Bollinger Bands -The Bollinger Bands with a brilliant extension. Dbbs are really a hybrid trend and an indicator of momentum. In markets where there is a certain regression to the average, the DBB provides points of support and resistance(s/r). When there is a trend, they show the momentum of the trend and the power to stay probably.
The basic problem traders and investors have is that they are paid to be correct about what will happen later, but the vast majority of the best-known indicators we have covered so far are lagging indicators rather than leading indicators. They inform us of the past, and with that information, what we can do in the best way is form a hypothesis about the future.
What does a trader do? uses momentum indicators. They are leading indicators because:
They can tell if a trend is strengthening or weakening.
They can tell whether an asset is overbought or over-exploited relative to past activity over a given period, and also indicate whether the trend is likely to reverse.
Knowing this can help you predict changes and have better returns.
Momentum indicators give you additional clues to put the odds of being right in your favor. There are many indicators of momentum, but now we will introduce only some of the most effective and easy to use:
Double Bollinger Bands
Three types of basic oscillators: Moving Average Convergence/Divergence (MACD), Relative Strength Index (RSI), and the Stochastic Oscillator. As with any other indicator, you can use these without knowing how well they work, although if you do, you will be able to use them more effectively and know how to adapt them to your specific situations.
You should consider using the Double Bollinger Bands and one or two oscillators you choose, especially the moving average convergence/divergence (MACD). A few lines of moving averages as we saw before (in periods of 10, 20, 50, 100 and 200) not only serve as indicators of momentum, they also provide points of support and resistance.
Points of Support/Resistance
To add to the obvious price levels highlighted in your chart ( and in periods 4 or 5 times shorter and longer) you should always see:
The s/r points generated from the trend or range indicators.
The s/r points formed by the western style graphs, both their trend lines and the target points involved in new trends.
The s/r points transmitted by the pivot points.
The use of pivot points should be taken into account. A pivot point is no more than a technical analysis indicator, normally used to determine the market’s major trend over different time periods. The pivot point for it is simply the average of the maximum, minimum, and closing prices of the previous trading day. On the following day, the negotiation at a higher point of the pivot point indicates a bullish feeling, while if below the pivot point indicates a bearish trend.
The pivot point is the base of the indicator, but it also includes other support and strength levels that are projected based on pivot point calculations. All these levels help traders to try to guess where the price might have resistance or support. Similarly, if the price fluctuates around these tells the trader that the price goes in a certain direction.
Synchronization or Cycle Indicators
Gann, Fibonacci, Dinapoli, Elliott Wave, and other similar studies are synchronization or cycle indicators. For example, the typical toolkit could include, in addition to any obvious s/r points:
A set of moving averages of periods of 10, 20, 50, 100, and 200: Again, these serve as s/r points as well as momentum indicators if they show a cross or a stratification.
Trend lines and channel lines show the trend and provide points of s/r.
Double Bollinger Bands and MACD show the changes in momentum.
Fibonacci Setbacks One of the most recent trends in every period of time possible are the points s/r. If you need to re-draw these for every period of time you examine, do so, as the primary trend can vary dramatically over different periods of time.
If you can locate any pattern on a western graph, note the levels involved of s/r (maxima, minima, necklines, shoulders, etc.). Japanese candle patterns provide short-term signs of continuing trend or a reversal.
Then you would have to apply this group of fórex indicators to the time period you are negotiating, as well as those 4 or 5 times longer or shorter. For example, if you are trading daily graphs, you should also see the weekly and two or four hours (depending on what defines your trading day whether it is 24 hours or 8 to 10 hours).
A good graphics program that includes the Metatrader 5 will allow you to store any group of indicators you want since a model on the chart can be applied to any chart of any asset your broker offers.
The purpose of this first visualization in a longer period of time (weekly, in our examples) is to find points of support and longer-term resistance that you should see in the graphs you are negotiating, hoping to find a currency pair that looks like it can reach the s/r área and provide an entry point with a lower risk. That is the first step in locating low-risk, high-yield transactions.
The second visualization would be to examine the possible inputs and outputs in the shortest time periods you are negotiating, to see if you can find situations where your entry point is two or three times further away from the exit point than is your stop loss. The point of taking the winnings is usually easy to see. It is where you can reach the correct stop-loss point that usually determines whether you take the transaction.
The third visualization would be to check in the shortest time period (from two to four hours of the time period in our examples) to see any short-term s/r points, just so you are informed of s/r. time points. If these points are held for much or too often, your transaction may be showing signs that it is failing and you would have to reduce the size of your position. However, these are quickly overcome, this is a sign of progress and a signal to consider adding to your position.
The most appropriate way to enter an MT5 indicator is to remove it from the browser window. You can also use the indicator command to insert them from the Insert menu or the indicator button in the standard toolbar.
Change the settings of an applied MT5 indicator.
The settings of using an MT5 indicator can be changed. Select the required indicators in the list of indicators and click on “Properties” or use the menu of indicators in the graph.
Use the menu to manage the indicators:
Indicator Properties Properties – opens the properties of the indicators;
Delete Indicator Delete Indicator – Deletes the selected indicator from the graph;
Delete Indicators Window Delete Indicator Window – deletes the indicator subwindow. This command is only available in the indicator menu which is in a separate sub-window. ;
List of indicators Indicator List – Opens the indicator list window.
Move the cursor to a line, symbol, or to the limit of a histogram of an indicator, it is possible to define quite precisely the value of the indicator at this exact point.
Customize the MT5 display appearance
You can customize the appearance of the indicators on the trading platform. You can configure the parameters of the indicators on your trading platform. You can configure the indicator parameters when you apply them to the graph or you can modify them later. The appearance of the indicator is adjusted in the tab “Properties”.
The Color, width, and style of the indicator are configured in the “Style” field.
Choose data to draw an MT5 indicator.
Technical indicators can be graphically based on price data and their derivatives as (Median Price, Typical Price, Weighted Close), also based on other indicators. For example, you can apply the moving average to an oscillator and have an additional AO signal line. First of all, it is mandatory to draw the indicator AO, and once drawn apply the moving mean to it. In the MM configuration select the option, “Previous Indicator’s Data” in the “Apply to” field. If you choose “First Indicator’s Data”, MM will be applied to the first indicator, it can be another indicator.
There are nice variants for the construction of an indicator:
Close – Based on closing prices.
Open – Based on opening prices.
High – based on maxima.
Low – Based on minimums.
Median Price (HL/2) – Based on medium price: (High + Low)/2.
Typical Price (HLC/3) – Based on typical price: (High + Low + Close)/3.
Weighted Close (HLCC/4) – Based on average heavy closing price: (High + Low + 2*Close)/4.
First indicator’s data – Based on values that were first applied to the indicator. The option to use data from the first indicator shall only be available for indicators in a secondary window because in the main window the main indicator is the price.
Previous indicator’s data – based on previous indicator values.
Configure additional MT5 indicator levels.
For certain indicators, it is possible to enable additional levels. Open the tab “Levels” and click on “Add” and then enter the value of “level” in the table. You can also add the description of “level”.
The line color, width, and style of the levels can be configured below. To edit a “level”, click on “Edit” or double click on the appropriate field.
For the indicators applied to the price chart, the levels are drawn by adding the values of the indicator and the specified level. For indicators drawn in a secondary window, “levels” are drawn as horizontal lines through the value specified in the vertical scale.
The MT5 display settings.
The display of the indicator for different time periods can be configured in the tab “Visualization”. The indicator shall only be shown for the specified time frames. This situation could be useful when the indicator is intended for use in specific time periods. The “Show in the Data Window” option allows you to manage the indicator information displayed in Data Window.
The forex indicators are great to guide us in manual trading. But if what we want is to automate trade and let Metatrader negotiate on its own while doing other things we cannot simply do that using indicators. Metatrader indicators do not contain trading logic. This is where Expert Advisors come in.
There are many tools that will allow you to generate unencrypted fórex robots. This is where we can help you quite a bit. Instead of spending hours coding, testing, changing, and optimizing your robots, we can offer you a tool that does it for you.
Robo-Advisor is designed to help you analyze, test, and generate strategies. It also allows you to export those strategies easily to the Expert Advisors so you can automate your trading on Metatrader.
In finance, a «dark pool» is a private market used by its participants to trade in different types of securities. They are basically parallel markets operating outside the most well-known regular markets. Liquidity in these markets is called «dark pool liquidity» (sorry I did not find a suitable translation for the term). The bulk of […]
In finance, a «dark pool» is a private market used by its participants to trade in different types of securities. They are basically parallel markets operating outside the most well-known regular markets. Liquidity in these markets is called «dark pool liquidity» (sorry I did not find a suitable translation for the term). The bulk of […]
In finance, a «dark pool» is a private market used by its participants to trade in different types of securities. They are basically parallel markets operating outside the most well-known regular markets. Liquidity in these markets is called «dark pool liquidity» (sorry I did not find a suitable translation for the term).
The bulk of dark pool transactions represent high-volume transactions conducted by financial institutions, such as those executed outside public markets such as the New York Stock Exchange and NASDAQ, so that they remain confidential and beyond the reach of the general public investor. The fragmentation of financial trading sites and electronic trading has allowed dark pools to be created and they can normally be accessed through cross-network or directly between market participants through private contractual arrangements. Some dark pools can be accessible to the public and can be accessed through retail brokers.
The main advantage for institutional investors in the use of dark pools is that they allow sellers to sell or buy very large volumes of stocks without showing their position to others, which avoids the impact on the market as neither the size of the transaction nor the identity is revealed until the transaction is executed. But, this means that some market participants are at a disadvantage, as they cannot see the transactions before it is executed; prices are agreed by dark pool participants, so the market is no longer transparent.
There are mainly three types of dark pools:
Independent undertakings established to provide a single differentiated basis for trading with different assets.
The dark pools are owned by a broker where the broker’s clients interact, most commonly with other broker clients (and possibly even with operators working for the company itself) under conditions of anonymity.
Some public markets set up their own dark pools to offer their customers the benefits of anonymity and non-deployment of orders in conjunction with a stock market «infrastructure».
Depending on the exact way a dark pool operates and interacts with other places, it can be considered and in fact, referred to as a «gray pool».
Dark pools have become increasingly relevant since 2007, with dozens of different parallel markets representing a substantial portion of US stock trading, a trend we will surely see in other countries as well. There are several types of dark pools and these can be run in multiple ways, including automatically, throughout the day, or at scheduled times.
Origin of Dark Pools
With the advent of supercomputers that are able to execute programs created by algorithms in a matter of milliseconds, high-frequency trading (HFT) is already dominating the daily volume of trading in many markets. For example, in the stock market HFT technology allows institutional traders to execute their multi-million dollar stock block orders ahead of other investors, taking advantage of fractional increases or falls in stock prices. When subsequent orders are executed, the benefits will be instantaneously earned by HFT traders who then close their positions. This way of legal piracy can be occurring dozens of times a day, producing huge profits for HFT traders.
Eventually, the HFT became an increasingly widespread practice in the markets, to the point that it became increasingly difficult to execute large operations through a single exchange. Because HFT’s large orders had to be spread across multiple markets, this alerted competitors that they could get in front of the order and snatch the inventory, rising stock prices. All this happened in milliseconds after the initial order was placed.
To avoid transparency of public markets and ensure liquidity for high-volume operations, several investment banks established private markets, which became known as dark pools. For traders with large orders who cannot place on public stock exchanges, or who do not want to make their intentions known, dark pools provide a market of buyers and sellers with sufficient liquidity to execute the transaction. By 2016, there were more than 50 dark pools in operation in the United States alone, mainly run by investment banks.
How do Dark Pools Work?
Liquidity can be collected off the market in dark pools using FIX and APIs. Dark groups are actually very similar to standard markets with very similar order types, prioritization rules, and pricing rules. However, liquidity is not deliberately advertised – there is no market depth information. In addition, they prefer not to display and display transactions in any public data feed as standard markets, or if they are legally obliged to do so, they will do so with the greatest possible legal delay, all this to reduce the impact on the market of any transaction. Dark pools are often formed from order books of brokers and other sources of off-market liquidity. When comparing these markets, careful controls should be made as to how liquidity numbers were calculated: some count both sides of the transaction, or even count the liquidity that was placed but not taken.
Dark pools offer institutional investors many of the efficiencies associated with trading in the order books of traditional markets, but without showing their shares to others. These markets avoid this risk because neither the price nor the identity of the company they are trading are shown. Operations in dark pools are recorded as Over-The-Counter transactions. Therefore, detailed information on volumes and types of transactions is left to the network to inform customers if they wish and are contractually bound.
Dark pools allow large amounts of funds to be pooled and large volumes of securities moved without investors having to show what they are doing and what their intentions are. State-of-the-art e-commerce platforms and the total lack of human interaction have reduced the time scale in market movements. This increased responsiveness of an asset’s price to market pressures has made it increasingly difficult to move large volumes of securities without affecting price. Thus, these markets can protect investors from market participants who use HFT (high-frequency trading) in a predatory manner.
Dark Pools and Price Discovery
For an asset that can only be publicly traded, it is generally assumed that the standard pricing process ensures that at any time the price is quite “fair” or “right”. But, few assets are available in this category as most can be traded off the market without adding transaction information to a publicly accessible data source. As a proportion of the daily volume generated by the asset traded so secretly increases, the public price could be considered fair as long as certain limits are not exceeded. However, if public trading continues to decline as hidden trading increases, it could reach the point where the public price does not take into account all information about the asset (in particular, it does not take into account what is traded in a hidden manner) and therefore the public price could no longer be considered as «fair».
However, where dark pool transactions are incorporated into a post-transaction transparency regime, investors have access to this information as part of a consolidated list of transactions. This can help the discovery of prices.
Regulation of Dark Pools
Although considered legal, dark pools can operate with very little transparency. Those who have been able to denounce the HFT as an unfair advantage to other investors have also condemned zero transparency in dark pools since they can perfectly hide conflicts of interest. The Securities and Exchange Commission (SEC) in the United States has stepped up scrutiny of these markets for complaints related to front-side practices. Illegal running occurs when institutional traders place their order in front of a customer’s order to capitalize on the rise in stock prices. Dark pools advocates insist that they provide essential liquidity, allowing markets to operate more efficiently.
Some traders using a liquidity-based strategy consider that dark pool liquidity should be advertised to allow a more «fair» trading for all parties involved.
If you have always wanted a robot to clean your house or take your dog for a walk, you would understand how attractive a Forex robot is. These services do not clean windows or take care of your pets, what they offer is definitely something much better: a relatively non-interventional way of trading in forex […]
If you have always wanted a robot to clean your house or take your dog for a walk, you would understand how attractive a Forex robot is. These services do not clean windows or take care of your pets, what they offer is definitely something much better: a relatively non-interventional way of trading in forex […]
If you have always wanted a robot to clean your house or take your dog for a walk, you would understand how attractive a Forex robot is. These services do not clean windows or take care of your pets, what they offer is definitely something much better: a relatively non-interventional way of trading in forex and other financial markets.
Many people dream of finding the perfect trading system, which guarantees profits and requires minimal effort for users. When many Forex robot programmers are available, there are some important questions to be answered.
What Is A Trading Bot?
As the name implies, a trading robot – also known as Robot Forex goes beyond simply testing trading strategies to currently apply them in real-time to make real transactions with live market data. When the robot generates a buying or selling signal, the platform automatically places the transaction. These systems have often been used by institutional traders for a long time in all markets. During the last few times, trading robots have become quite popular with private traders, particularly because they do not require any programming experience to create, execute and optimize them in an automated forex system.
Assuming the robot is well designed, tested, and its performance monitored, robot-assisted trading has some obvious advantages:
-You never miss an opportunity: the robot can work 24/7.
-There are no emotions, pure discipline: a trading robot eliminates the emotions of forex trading as long as you are disciplined enough to let the system work even when you believe that the rules do not apply under certain circumstances.
So if you do:
-You create a set of clear and unambiguous rules that can be expressed in a programming code.
-You have the time and experience to translate these rules into a program and test it, or use a programmer to do it. So automated trading is the best way to execute a precise forex strategy.
How Does A Forex Robot Work?
Trading robots use algorithms and advanced software to automate trading decisions. Services range from giving you a trading signal to placing and handling the transaction for you automatically requiring minimal or no human intervention. If you have a forex strategy that is strictly mechanical and does not require a human decision process, you can program your robot forex to make transactions 24 hours a day.
The most popular robots for retail customers are programmed on the Metatrader 5 platform. These robots are run on MetaTrader as “expert advisors” (trading robots) and are the implementation of some trading rules in a code that Metatrader or other trading platforms can understand and execute. MQL5 (Metaquotes Language) is the integrated programming language designed to develop forex robots with the Metatrader 5 platform and requires advanced programming skills. But, there are several tools available that allow you to generate unscheduled forex robots, known as “EA Generator” or “Strategy Builder” (EA generators or strategy developers).
What Is the Cost?
Many companies create and sell trading robots, but be careful who you do business with if you are in the market to buy one. It is not unusual for brokers, traders, and different unregulated websites to appear overnight and start selling a “get rich right away” robot, including a money-back guarantee so that your money will disappear within 30 days or less. Most of the robots that are made to be bought are not successful, so please do your research beforehand if you are thinking about buying one. The best thing is to be cautious because there are a lot of risks on the learning curve or mining data in the offers that are for purchase. As mentioned above, the alternative is to use an ea forex generator, designed to help you create, test, and export unlimited robots for Metatrader 5, without writing codes.
A Forex robot is much cheaper than a human manager or an account to copy the movements. Most companies sell robot forex for a one-time fee or a monthly fee as well as an annual fee. Even so, any forex robot needs constant parameter optimization and may fail after a successful start. In other cases, customers have access to an EA generator and even an expert within the company dedicated to consultation and support.
Those conditions do not apply to most of us, so the way most of us should use this option is using retail forex trading. Many forex brokers offer a variety of trading systems as part of their offerings. There’s nothing wrong with these, especially if you’re allowed to check them for a while to see how they work.
Expert Advisors (trading robots) are generally designed to work in specific environments, typically for a trend or markets that tend to regress, but not both. Before choosing a forex robot, you must understand what kind of markets and conditions the robot is designed for. A legitimate vendor will give you clear and concise information on what kind of conditions the robot works in, its performance, the amount of time it has been in operation, the benefit you can expect as well as the maximum you can lose.
As with any business proposition, if the benefits of a robot forex sound too good to be true, the odds are that it will. If the benefits look very out of place and their price is very low, well, I hope they allow you to test it first with a small amount of risk, otherwise, continue your search.
Ideally, as far as possible, review as much time as the robot has been operating and understand market conditions during that period of time. For example, at a time of growth and rising interest rates, the trading robots they buy will work well as the riskier currencies are favored. However, during the crises, these robots will suffer.
Typically, the more benefits you get, the greater the chance of losing. If a salesman offers you big profits and losses, he’s being honest. If the seller offers you high profits without a high risk of loss, you should be suspicious. There are many online trader forums dedicated to automatic trading; there are legitimate robot programmers and there are frauds, so consider yourself warned.
But, the main option is to build your own robot forex.
What is the Best Software for Robot Creation?
ROBO ADVISOR 007 is the only software to create robots online. With Robo Advisor 007 you can automate your forex strategy for Metatrader 5 in a comfortable and safe way. No need for you to know anything about advanced programming since the robot generator is smart enough to write the code for you. The source of the program is a very advanced algorithm that tests the strategy, similar to that of Metatrader, but much faster. The program is so fast that you can automatically create and test the strategies.
Robo Advisor 007 has several components:
The generator – The generator is in charge of creating and testing the systems automatically. The generator saves the most successful strategies in the collection. The moment a strategy is generated, it can be exported as a trading robot or send it to the editor for review and improvement.
The collection – when we are using the generator, the program stores successful strategies in a collection. You can search the strategies collected by a certain parameter and send it to the editor for export or review. You can also export the entire collection for further revalidation and use.
The editor- With the editor, you can create and edit strategies by modifying the indicators and parameters. When you edit a strategy, the program tests the historical data, displays the most important statistics, shows the balance sheet, and charts the curve of profits or losses. Since Robo Advisor tests are so fast you can improve your strategies while looking at the graphs. When you find a strategy you like you can export it as a forex robot.
Report- When a strategy is in the editor you can go to Report to see extensive information about test results in the historical data. The report page contains all statistical information, graphs, and the transaction log.
Exporting robots – You can export your robot forex to use in Metatrader. The exported robots use only standard MT5 indicators, which makes it very easy to use the robots in MT or upload your files to a VPS (virtual computer). You can confirm the operation of your robots with the software to test the strategies of Metatrader Strategy Tester with a demo account or data that are not known. If your tests are good, you can use your robot for real trading.
The idea or intention of Robo Advisor 007 is that software to create Forex robots with a good algorithm to test the strategies as well as an execution of the strategies in real time give you as a result a good benefit. Please be extremely careful when dealing with real money and always consider the risks.
How to Create a Robot with a Generator
With the powerful tools used by hedge funds or global investment managers and institutional traders, you can create forex robots with generators without any programming skills and without programming. You will see real results immediately and with just one click you can download the best robot for free and use it in Metatrader 5.
If you are a novice in the markets, you can generate strategies for forex, stocks, indices, raw materials, and cryptocurrencies with just a few clicks. You will see hundreds of strategies that are already tested and ready to be used. A robotic counselor (Robo-Advisor) gives you the possibility to use many strategies in a single account. This way, you can diversify risk and achieve more stable results.
If you are operating in the commodity market, you need to have an idea of the structure and dynamics of the supply and demand of the assets. Oil is a typical example, which is rapidly recovering lost positions, thanks to the growth prospects of global demand and the contraction of the surplus in the midst […]
If you are operating in the commodity market, you need to have an idea of the structure and dynamics of the supply and demand of the assets. Oil is a typical example, which is rapidly recovering lost positions, thanks to the growth prospects of global demand and the contraction of the surplus in the midst […]
If you are operating in the commodity market, you need to have an idea of the structure and dynamics of the supply and demand of the assets. Oil is a typical example, which is rapidly recovering lost positions, thanks to the growth prospects of global demand and the contraction of the surplus in the midst of the opening of the major world economies. Unlike Brent and WTI, gold is less sensitive to the conjuncture of the physical asset market, but at any time it can punish a trader who ignores the fundamentals.
Global demand for precious metals is dominated by jewelry and investment, which accounted for 48.5% and 29.2% in 2019. The share of gold purchased by central banks was 14.8% and the share of its use in the industry was 7.5%. The last indicator is very important. The fact is that silver is considerably higher, and the closure of industrial plants due to the pandemic caused the faster sinking of XAG/USD compared to XAU/USD. As a result, the ratio of the two metals plummeted to historic highs. It is logical that in conditions of recovery of the world economy it makes sense to expect a reduction of the coefficient, that is, to bet on a faster growth of silver compared to gold.
In the first quarter, the share of investments in the structure of global demand for precious metals increased to 49.8%, while jewelry shops fell to 30.1%. Gold consumption contracted in almost all areas compared to October-December and January-March 2019, with the exception of ETF and coins.
Changing the structure of demand is an important point for pricing. When this happens, we can talk about the stability of the existing trend. The shift from jewelry to investment is a sure sign that bulls dominate the market. Jewelry is too expensive, leading to a reduction in its consumption. On the contrary, the faster the stock of specialized funds traded on the stock exchange grows, the higher the stock price will be and the greater the army of buyers will be. Sometimes, in the context of an upward trend, gold is said to flow from east to west. In fact, the share of China and India in the consumption of precious metals in the jewelry industry in 2019 was 67%, while the main ETFs are located in the United States (including the largest fund SPDR Gold Shares) and in Europe.
The main gold producers are China (404.1 tonnes), Australia (314.9 tonnes), Russia (297.3 tonnes), the United States (221.7 tonnes), and other countries. The impact of supply on price is limited. A typical example is 2013. Then many said that XAU/USD quotes will not fall below $1300-1350 per ounce, as this is where the equilibrium point of the mining companies lies. They say they will reduce production, leading to shortages and higher prices. In fact, existing hedging technologies allow companies to price and continue production at the same volumes. The gold fell considerably, punishing buyers for themselves.
But, it is necessary to know the offer completely. In 2020, amid the pandemic and company shutdown, investors felt a severe lack of physical assets in the negotiation of forward contracts, leading to increased trading premiums in the United States and Europe, contributing to the increase in XAU/USD contributions.
Therefore, the most important element in the pricing of precious metals is the demand for investment, the value of which, in the first place, is influenced by the monetary policy of central banks. Large-scale monetary expansion contributes to the weakening of the world’s major currencies, falling bond yields, and rising XAU/USD rates.
Money management is generally the most important factor determining profit or loss in Forex trading strategies. This fact is so often overlooked that it must be repeated again and again. It is one of the key commercial essentials. The management of money itself will not give you a margin of victory-you need a good entry […]
Money management is generally the most important factor determining profit or loss in Forex trading strategies. This fact is so often overlooked that it must be repeated again and again. It is one of the key commercial essentials. The management of money itself will not give you a margin of victory-you need a good entry […]
Money management is generally the most important factor determining profit or loss in Forex trading strategies. This fact is so often overlooked that it must be repeated again and again. It is one of the key commercial essentials. The management of money itself will not give you a margin of victory-you need a good entry into trade and effective exit strategies for that-However, without smart fund management practices, a profit margin will not see your profit potential, and there is even the risk of a total loss.
There are two elements in money management that Forex traders must consider carefully: how much of their account is risked per transaction and the percentage of their account that must always be at risk, measured in full or by some kind of sector. There are no absolute answers to those questions, the best for you will largely depend on your own appetite for risk and your tolerance of loss, temporarily or permanently.
Risks in Your Account
Every time you open an operation you’re risking money. Even if you have a stop-loss, you could suffer a negative slide and lose more than you anticipated. Clearly, if you have many open trades at the same time, even if the whole holds a sense at the individual level, together can contribute to having an unacceptable level of risk. Similarly, if you keep many open trades betting all towards the same currency and in the same direction, you run the risk of a sudden loss beyond what is acceptable. So, it’s a good idea to determine a maximum number of open operations simultaneously; and repeat, but by coin.
For example, it is possible to determine that you will never have more than 2% of your risk account size in open trades or more than 1.5% at risk in a single currency. You should also be very careful when trading in currencies that are linked to another currency by your respective central banks. For example, someone who was short in the Swiss franc last January using even a relatively small amount of leverage of 4: 1 has probably had his account deleted, and this will be independent of whether you have any stop loss, as the movement has been dramatic.
Also, if you are trading with Forex or other instruments that maintain positive correlations, you may also need to put a limit on the total of open transactions that are strongly correlated. This becomes more important if you are operating beyond Forex, for example, oil and the Canadian dollar have a high positive correlation.
The exact amount of maximum risk you must take is up to you but bear in mind that once your account has been reduced by 25%, you need to increase it by 33% just to get back to square one. The lower it gets the worse it gets: a loss of 50% requires a 100% increase!
How Much Risk Per Transaction?
Now that you have some risk limits set for your account in general and by currency type, you must address a different issue as to the amount you must risk per transaction. Of course, it is okay to risk different amounts per operation, but this must be determined systematically.
There are different reasons that need to be analyzed in order to determine the size of the position in your Forex strategies, but any risk per transaction must be calculated as a percentage of its total capital. The capital of the total account can be determined by looking at the amount of cash obtained in your account-you must assume the worst-case scenario, that is, that each open transaction will result in losses.
There are two advantages to this method instead of simply risking the same amount and again this is independent of performance, which is the case when using a predetermined fixed batch size or a fixed amount of cash:
Forex strategies tend to produce payoffs or losses and not a uniform distribution of results. Using a share of capital to quantify the size of each trade, which means you will risk less when you lose and more when you are earning, which tends to maximize winning streaks and minimize bad streaks. You can never completely delete your account! Using a fixed batch size or cash amount could end your account, or at least cause a decline from which you can never recover.
Here are some of the essential elements to consider in determining the amount to be risked per operation:
– What would be the worst performance you could have and what would it look like? Could it deal psychologically with a reduction of 10%, 20%, or even worse? Should it go that far in negative territory?
– The frequency with which you negotiate will also be a factor, as this will have an impact on your maximum fall.
– What are your expected profit and loss percentages? Try your trading again. Let’s take an example, if you have a foreign exchange trading strategy where you plan to lose 80% of your trades, but earn 10 times the risk in the remaining 20%, your transaction risk should be lower than if you were planning to do 3 times your risk in 40% of your operations. And clearly, if you maintain an exit strategy that is flexible, immediately, just make a brief approximation of how it’s likely to turn out over time.
– Is it possible with the size of your account to negotiate as little as possible? Let’s take another example, if you have a $100 trading account, and what you want to risk is 1% for operation, you will have to risk a single penny per pip with a stop-loss of 100 pips. This could be impossible, depending on your broker. However, what you should do is capitalize up or otherwise change your business strategy instead of increasing your risk per transaction if that is the case.
– Is your trading account a savings product or a small amount of venture capital? If your total equity is $25,000 for example, and you have a $10,000 account, you could have less tolerance to falls by comparing it to a $1,000 account.
Always remember that your capital management strategy will act statistically with your earnings rate and the average size of your earnings to directly affect your gains or losses over time.
Stop Loss and Position Size
The stop loss should never be determined based on the minimum that can be allowed. Let’s look at an example… If you want to risk a maximum of $20 per operation, but the minimum size of the position with your broker is allowed to be $1 per pip, therefore this is a horrible reason to put a stop loss of 20 pips and a batch size of $1 per pip! What you could accomplish in this case is look for another broker or increase your trading account balance if you have enough venture capital to invest, or else find a Forex trading strategy that usually uses a stop loss of 20 pips, if you are comfortable with it.
However, it is legitimate to determine the stop loss by measuring average volatility, and, especially in trend trading, this in itself can be a very powerful money management strategy. For example, using a multiple of the average 20-day range to determine the cap, and then basing the size of the position on the percentage of account capital is a very common money management method within the trend strategies of Forex trading.
Even if you base your stop loss on technical levels, it may still be worth using a good measure of volatility to calculate the size of the position. For example, if the average range of 20 days is twice the range in a very long term, you can risk half of the reference risk per pip related to your account’s capital.
When it comes to success in trading, there isn’t a simple solution, Forex is such a vast beast that you will never know everything and you will never be right 100% of the time, that does not mean however that there aren’t a number of different things that you can do that will help you […]
When it comes to success in trading, there isn’t a simple solution, Forex is such a vast beast that you will never know everything and you will never be right 100% of the time, that does not mean however that there aren’t a number of different things that you can do that will help you […]
When it comes to success in trading, there isn’t a simple solution, Forex is such a vast beast that you will never know everything and you will never be right 100% of the time, that does not mean however that there aren’t a number of different things that you can do that will help you to move the odds a little in your favour, little things that you can do to help yourself to become a little more successful. We are going to be looking at 10 things that you can do that will ultimately help you to become or remain a profitable and successful trader.
Set Your Goals:
Setting goals is vital if you want to be successful, when it comes to pretty much anything in life, those who have goals to strive towards often do a lot better than those that are doing something blind, the exact same thing applies to forex trading. Set your goals, but make them realistic and achievable, do not just say to be a millionaire, that is a long way off, instead look to create a series of smaller ones that you can achieve within the year, this will keep you motivated to keep going when each one is achieved.
Get A Good Broker:
The broker that you chose is going to be an important decision, there are a lot of them out there, in fact, there are thousands of them, so with so much to choose from it can be quite daunting. Look for the bigger names, they are often the most reliable, look for independent reviews, look for low costs, good support, and quick withdrawals, all of these things can make a broker worthwhile. It is of course your decision which broker you go for, just be sure that you are on the lookout for the scam brokers that pop up every now and then, just looking for your money.
Choose A Trading Platform:
The trading platform that you use is also important, if you are planning on using an EA, then there is no point in getting a cTrader account, as you won’t be able to use it. Each trading platform has different features so ensure that the one that you use has what you need. The most popular platform is currently MetaTrader 4, so that would be a good one to go for if you are not sure, simply because of its huge user base and the amount of help that is available out there.
Choose the Right Strategy:
There are a lot of strategies out there, too many to try and think about, but you will need to find the one or at least the style that best suits you. If you don’t have much time, the longer-term style may be better as it requires less time at the computer, if you have a lot of free time and not a lot of patience, then something like scalping may be best for you as it brings quick trades and allows you to be at the computer for longer Try a few different ones until you find the one that is right for you.
Use Stop Losses:
Stop losses are your protection, they are there to protect your account from large market movements and can be the difference between a small loss and a completely blown account. When you create your risk management plans you should be working out how far your stop losses should be, to only lose a potential percentage of your account with each trade, many go for one or two percent per trade which is fine, just ensure that your stop losses are in place with every single trade that you make.
Risk to Reward Ratio:
You need to have a risk to reward ratio in place, this will help you to work out things like your trade sizes, as well as take profit and stop-loss levels. The risk to reward ratio details how much you will risk with each trade and also how much you will make. If you have a good risk to ward ratio, it can mean that you technically only need to win 25% of your trades in order to be profitable, which makes being profitable so much easier, so ensure that you have this in place and that you stick to it.
Keep A Log:
A trading journal is invaluable when it comes to trading, it allows you to look at what trades you have made, what went well, and what went wrong, it also allows you to ensure that you are keeping to your trading plan and risk management plans. Being able to see what you have done wrong allows for invaluable learning opportunities, something that every single trade should be trying to do. Keep this log, it can take time and can be boring, but if you want to be successful, it is vital to have.
Speak to Others:
Trading can be lonely, but it can also be very hard if you try to do it all by yourself. Join a trading community if you can, not only will this enable you to speak to other like-minded people, giving you an outlet and making you feel more included, but it also offers a great opportunity to share your own ideas in order to get feedback, but also to find new ideas that other people are posting, they may be doing some analysis that you have not thought about, giving you additional insight and trading opportunities.
Demo Accounts:
Demo accounts allow you to trade without the risk of losing any of your money, in fact, it allows you to test out pretty much anything you want with no risk at all. If you are thinking of changing your strategy then trying the changes on a demo account will enable you to see whether it works and to get through any teething issues with it without losing any of your actual capital. Take every chance you get to use a demo account and protect your main account from being a test subject.
Take a Break:
The forex markets will be around for years to come, if you are feeling stressed, tired or emotional, then there is no harm in taking a step back, take a break, go out for a bit, clear your head and mind and then come back, the markets will still be there and you will be looking at them in a much clearer way. The last thing that you want is to allow your emotions to take over and to influence your trading.
Those are 10 tips that we have for being a successful trader, there are many other things that you can do too, but the 10 that we have listed are some of the most important things that you can do as a trader and will allow you to get a jump start on being a successful and profitable trader.
For most traders, the toughest aspect of trading in Forex is dealing with financial losses. It’s not just a matter of pain and anguish, but it’s also a latent reality that losses are very often the trigger that drives traders to make their worst mistakes, which can cause even greater losses and start a vicious […]
For most traders, the toughest aspect of trading in Forex is dealing with financial losses. It’s not just a matter of pain and anguish, but it’s also a latent reality that losses are very often the trigger that drives traders to make their worst mistakes, which can cause even greater losses and start a vicious […]
For most traders, the toughest aspect of trading in Forex is dealing with financial losses. It’s not just a matter of pain and anguish, but it’s also a latent reality that losses are very often the trigger that drives traders to make their worst mistakes, which can cause even greater losses and start a vicious circle in which the trader’s account is out of control.
It follows that a trader has to have a defined strategy to cope with losses and have the ability to execute that survival strategy. There is no point in “knowing” that your losses are controlled and how to keep them under control if you are not able to apply what you know. Your loss strategy has to be real. You have to know the logic behind your knowledge of losses and believe in your truth with total faith.
The Losses Are Inevitable
Loss-making positions are inevitable; in fact, it is usually more difficult to make money with strategies that try to ensure a very high rate of profit. This is simply the natural form of market movements.
There are some traders who follow a methodology that tries to greatly reduce or even completely eliminate losses. There are only two methodologies that can achieve this and it is important to understand them perfectly:
1- Add to a position with losses by believing that he was right when he placed the original position and that he was only wrong when he opened it. You can even add a larger amount in the next position to make recovery easier. The reality is that, while this may work as a method, it is usually not optimal and we will usually have better results simply by accepting the first loss and closing the position instead of trying a “rescue”. After all, if your original stop loss was touched, why is the second operation going to be better than the first.
2- “Change with the wind” and open a position in the opposite direction. This is not really “avoiding” a loss, it is actually crystallizing a loss by changing the net position. If you go long with a 1 lot and then short with 2 lots, you will be going short with a 1 net lot with a crystallized loss in 1 long lot.
There is another thing you can do: do not close the position that is losing and let it run more and more against you. If he does, he’s liable to burn his account. Hopefully, maybe I’ve already convinced him that we should accept some losing operations. If I haven’t, please go back and read that over and over again until I’m convinced. If you are not convinced, you can write to me and explain your reasons: perhaps I could convince you by email!
Know What Losses You Can Tolerate
Once you have accepted that you will have operations with losses and go through streaks of losses (known as “drawdowns”), you have to decide how much you can psychologically tolerate losing without losing your nerves as well. For that, you have to have an honest conversation with yourself. You might think you can deal with something like a 50% drawdown on your trading account, but you might actually find yourself unable to cope with even a 25% loss when it takes place in reality. Try to visualize this happening, close your eyes, and get in position.
A second factor that has to be considered is that as you increase any drawdown on your account, it increases the amount you need to win back to reach the amount you started with. For example, if you lose 10%, then you must grow the remaining 90% by 11.11% just to return to the original 100% amount. When we have a very deep drawdown of 50%, you must earn 100% just to return to the original amount of 100%. It is a vital fact that the deepest their losses, the more difficult it will be to get back to square one. Having considered this, on the other hand, it is also true that the less you risk, the less you will win when trading progresses in a favorable way.
Credit: https://the5ers.com
Maximum Losses
A good goal to consider is never to ever, in any case, lose more than 25% of the value of your trading account, because once you lose 25% you will have to make 33.33% profit just to get back to where you started, and when you lose more than 25% of the amount you would later have to earn to return or even to increase very quickly: once you have dropped 50%, you have to earn 100%, for example. In a crazed market, your stop loss might not work at all and you could be completely eliminated if you use too much leverage.
Use A Trading Method
Once you have established what the maximum loss you can tolerate is, you need to be sure of the method you are going to use to choose when to enter and exit operations and what financial asset you are going to trade, and this method should be a proven method that produces a positive “hope”. That is, by analyzing a lot of positions, he earns more money than he loses. You need to believe that it is a cost-effective method by itself, and also subject it to a review or backtest over several years of historical data.
This is very important because, when you have a streak of unavoidable losses, you have to have the courage to continue trading. If you do not do it and stop operating, or if you lose your nerves and operate in excess, you will miss the winning streak that will come after the losing streak.
Another great advantage of a backtest is that you can use a great one in a long-term review to determine what was the worst performance in terms of drawdown and the number of consecutive losing operations. You can use this to have the assurance that you will be perfectly able to survive the bad streaks. For example, if the worst outcome of your strategy in the last 10 years and thousands of operations is 50 consecutive losing operations, and you believe that the maximum drawdown you’re going to be able to tolerate is 25%, that suggests that, if you risk 0,50% of your trading capital per transaction, you are likely to experience such a drawdown in the next 10 years. If you reduce the risk to, for example, 0.25% per operation, this drawdown depth will be less likely.
You should also use a strategy to manage fractional risk, this gives you peace of mind with the knowledge that there is a cushion to minimize the total loss of evil seasons. You will also be able to decide that, if you ever experience a reduction worse than the worst case in the last 5 years, you will have to stop trading and revisit your strategy.
Catastrophic Losses
Sometimes events happen on the market that triggers such large, sharp movements at the price that even if you are working with a stop-loss your agent will not be able to run. This means that when the stop is well activated, you can encounter much greater losses than you had anticipated. When the bond of the Swiss franc was withdrawn in 2015 we had a good example of this. The vote in favor of Brexit was a much softer example.
You can avoid this problem by ceasing to operate any currency whose central banks have a policy of swimming against the tide of the market by tying its value to another currency, and not having open positions right before there’s a huge risk of an event being scheduled, such as a referendum.
Tranquility Will Help You Weather the Storm
Once you have taken the steps outlined above, you may have the confidence to risk money on operations within the parameters you have defined. You will know more or less what percentage of operations tend to lose, the duration of the streaks, and, most importantly, that over time tends to go ahead. At this stage, it must be accepted that loss-making operations are natural, and are the only necessary sacrifices that you must make in the market to earn money. In other words, the cost of doing business.
The Forex market offers investors many advantages over other financial fields. These include a high potential for profitability, a flexible trading location, the ability to capitalize on a bullish and bearish market, and the availability of a broad Forex market schedule available from Tokyo to New York.
The Forex market offers investors many advantages over other financial fields. These include a high potential for profitability, a flexible trading location, the ability to capitalize on a bullish and bearish market, and the availability of a broad Forex market schedule available from Tokyo to New York.
The Forex market offers investors many advantages over other financial fields. These include a high potential for profitability, a flexible trading location, the ability to capitalize on a bullish and bearish market, and the availability of a broad Forex market schedule available from Tokyo to New York.
While Forex market hours are not limited to one time slot or another, and forex investors can actually open positions almost anytime they want, there are certain Forex market hours that are optimal for investment.
One of the clearest features of the foreign exchange market is volatility. What this means is that the market is always moving and moving fast. This has direct consequences for the currency merchant who seeks to make money. All an operator has to do is be in the right place at the right time and in the market can shoot in any direction, which will result in significant benefits. This, however, depends a lot on Forex trading hours.
Another aspect of large Forex trading is that you can benefit if the market goes up or down, but if the market doesn’t move at all, then obviously there will be no profits. For this reason, the hours of the currency market are so crucial.
If you open a position, when there is a limited movement in the market, the volatility will be minimal and, consequently, so will your earnings. However, if you open a position in the Forex trading hours that are occupied, the volatility will be, and as you may have guessed, so will your winnings.
Of course, like everything in life, the greater the risk, the greater the reward. In this case, the greater the reward, the greater the risk. Are you confused, sir? What I mean is, yes, if there’s high volatility, you can make more money, but you can also lose it quickly if the market moves against you.
To better understand the best hours of the foreign exchange market for trading, let’s first talk about the best and worst days for trading. It has been proven time and again that the foreign exchange market is the most active in the middle of the week. This is true of all major pairs
When exchange operations, the weekend starts early and the market is only occupied by half the average Friday and then calms down once it is 24:00 CEST. The market closes at 17:00 EST. Holidays, weekends, and days with the most important news are some examples of the currency market hours you want to avoid.
Buying the Jumps
As for the real trading hours of the currency, there are three trading sessions in the currency market, the Tokyo session (7 pm-04 am EST), the London session (03 am-12 pm EST), and the U.S. session (8 am-5 pm EST). The premise is simple. You need to find moments where several sessions overlap so it is the maximum activity in the market.
Yes, we will speak for you, the time slots in which the currency market time of several overlapping sessions are as follows:
3-4 am EST: Tokyo and London are open
8-12 pm EST: London and U.S. are open
Of course, this does not mean that you should not operate beyond these time slots, but these specific time frames could produce greater volatility and profits for the average merchant of your forex investment. Certain times of the day hold more volatility than others,and certain days of the week are more or less volatile on average. Long-term changes in volatility also affect how currency traders approach the market, and thus also the strategies employed.
In the stock market, many people think that volatility is a negative thing because usually increases as the stock market falls. In the currency, volatility is simply the amount a pair moves. Volatility can be monitored by minute, hour, day, week, or longer time frames.
If one coin is going up, that means the other currency of the pair is falling. For example, if EUR/USD is going up, the euro is going up in value and the US dollar is going down in value. Therefore, volatility does not have the bias it has in the stock market. Volatility may increase or decrease during both upward and downward trends in a currency pair, on an interchangeable basis. Volatility trends and changes in volatility tell us a lot about how we should negotiate.
How price volatility tends to be higher or lower at different times of the day, depending on the type of currency. For example, the Japanese yen during trading hours in Japan, but the volume of the currency grows during trading hours in London and New York. Hourly volatility is more relevant for short-term currency traders, but it is not an important factor for Forex traders. The various global trade sessions affect volatility within the 24-hour period.
A currency pair is typically more volatile when one or two of the markets associated with it are open for business. For example, EUR/USD is more volatile and active when London and/or New York are open because these markets are associated with EUR (euro) and USD (US dollar).
Between 13:00 and 17:00, when London and New York are open, EUR/USD experiences the greatest volatility. Trade trends are very likely to offer better results for day traders during the most volatile hours of the day, while more variable-type strategies work best when volatility is lower and the major markets associated with the pair are not open to drive it.
The volatility is changing over time, affecting the amount of pips that a currency pair usually moves during certain times of the day. The 12th hour may increase to see 40 pips of movement or fall to only 19 pips, but it is usually the most volatile hour of the day. Therefore, hourly trends do not change much, but the movements of the pips that can be seen during those hours change constantly.
Volatility According to the Day of the Week
Trading a certain pair you can find your target of 50 pip is easy to hit on Thursday, but it is hard to make 30 pips on a Monday. Each pair has different day-of-the-week trends; some days have half the volatility of others. You should not negotiate every day in exactly the same way, you may find a better or worse performance pattern on certain days.
If you look at the average volatility in the last 100 days, for example, each day of the week will have its own average. Adjust the expectations according to the day of the week. For example, over a period of 20 weeks for the EUR/USD a day trader could expect to do much more (due to larger movements and more opportunities) from Monday to Thursday, which could be expected to do on Friday or especially on Sunday. Expectations also need to be tempered on Monday, compared to a Wednesday.
Volatility Over the Long Term
The amount that the pair has moved on average, per day, in recent years tells us a lot about the current market conditions, how much we should be negotiating, and even what is likely to happen to the pair in the future.
When volatility is close to several years there are far fewer trading opportunities. Traders trading during the day and traders trading in the short term should be more restricted in the way they trade. Commissions and spread (difference between the offer price and purchase price) affect commerce much more when a pair moves only 40 pips a day, compared to when it moves 120 pips a day. The cost of trade is the same, but the potential reward for that cost is lower (however, this is not a direct relationship).
Abrupt changes in volatility often accompany a change of trend; this is because trends are often complacent and you can see volatility in decline. The status quo is shaken and traders are forced to abandon their operations quickly or face heavy losses.
Volatility is more complicated than currency pair moves each day on average. By reducing to zero, we see that volatility varies dramatically and consistently, through different times of the day, days of the week, and in time. Adapt and monitor these changes. Be aware of how volatility is quantified and constantly monitored so you can adjust your expectations accordingly.
Trading Methods Adjusted to Volatility
A fixed strategy, such as taking the risk of losing 20 pips in order to earn 60 may sometimes work in the market, but not in others. Consider using an indicator as the true range average, or controlling the volatility of currency pairs on a regular basis to set the right stop loss and target levels for current volatility. Sometimes you can risk 10 pips to make 30 with a larger position size, and as volatility increases, you reduce the size of your position and risk 30 pips to make 90 (just as an example).
In Conclusion
Volatility is more complicated than currency pair moves each day on average. By reducing to zero, we see that volatility varies dramatically and consistently, through different times of the day, days of the week, and in time. Adapt and monitor these changes. Be aware of how volatility can be measured and monitored constantly so you can adjust your expectations accordingly.
If we are going to be completely honest, we all make mistakes and when it comes to trading, we have made many, and we are sure that you have too. Some of them are not too bad, some of them though, are pretty horrible and have thrown off our trading quite a bit. If you look back, we are sure that there are some mistakes that you have made in the past, especially when just starting out that you are most likely not too proud of. We are going to be looking at some of the horrible mistakes that we have made and that other trades have made during their forex trading careers.
If we are going to be completely honest, we all make mistakes and when it comes to trading, we have made many, and we are sure that you have too. Some of them are not too bad, some of them though, are pretty horrible and have thrown off our trading quite a bit. If you look back, we are sure that there are some mistakes that you have made in the past, especially when just starting out that you are most likely not too proud of. We are going to be looking at some of the horrible mistakes that we have made and that other trades have made during their forex trading careers.
If we are going to be completely honest, we all make mistakes and when it comes to trading, we have made many, and we are sure that you have too. Some of them are not too bad, some of them though, are pretty horrible and have thrown off our trading quite a bit. If you look back, we are sure that there are some mistakes that you have made in the past, especially when just starting out that you are most likely not too proud of. We are going to be looking at some of the horrible mistakes that we have made and that other trades have made during their forex trading careers.
Spending Too Much Time Trading
One that you probably would not expect to see, but spending too much time can be just as bad as spending not enough. The majority of traders have other things in their life too, maybe a job, maybe a daily, anything else that gives you some form of responsibility. What you do not want to do is to use every minute that you have spare, or even to take away from the other things in your life. This can lead to a lot of problems, we have known traders to lose their job or to lose their families just from spending too much time on their trading. Do not let this happen to you, make sure that you divide your time up between the things that are important and don’t let trading take over.
Continuing to Trade a Losing Strategy
A lot of traders have a lot of pride, they like to think that they are correct, while it is good to be proud of what you do, it is not good to let that pride cloud your judgment. If you are trading a strategy that is losing, why would you want to continue doing it? Maybe you believe that it will eventually work, maybe you blame the markets, but one thing is for sure, these traders do not want to admit that maybe their strategy just doesn’t work at the moment. If something is not working, work out why and make changes, do not keep trying to force it to work or trading and waiting, you will only end up losing money, so you need to admit when something isn’t working and then make a change.
Trading Without Stop Losses
This one is common amongst both new traders and experienced ones and it has the same effects on the accounts of the traders and that is that they will eventually blow. Stop losses are one of the first and most simple forms of risk management that you should learn about and certainly use. The stop loss is there to protect your account, it will automatically close the trade when it reaches a certain level, yes it will lose in a negative, but it will be protecting your account. It also allows you to properly implement your risk to reward ratio. Ensure that you are using stop losses with every trade, every single trade, and your account will be a lot safer, without one, a single trade can blow even the largest of accounts.
Trading with More Than You Can Afford
One of the things that you will always be told is that you should never trade with more than you can afford to lose, what this means is that if the money that you are using is needed for something else, like bills, rent, or food, then you should not be using it. As soon as you use this money you are basically saying that you may not be able to pay the rent this month, not a situation that you want to be in. Even worse are the people who are borrowing money, getting a loan just for the purpose of trading it. This is not something that you want to do, do not put yourself into debt just to be able to trade. You should only trade what you can afford to lose, money that won’t affect your life if you lose it. Not only does it help protect your finances and life, but it also helps you to reduce the levels of stress that would come with potentially losing money that you need.
Trading It All
Emotions can have a huge effect on our trading, especially when we come across losses. When we experience those losses, we sometimes want to win it back, we do this by placing larger trades, or more trades that are not in line with our strategy for risk management. This is not something that you want to do and it is known as chasing your losses. You place larger trades in order to try and win the money back, but what happens when that trade also loses? You will end up placing an even larger one, then larger until eventually you cannot afford to make any others and you have pretty much blown your account. Avoid doing this, it is not smart and lots of people have actually gone bankrupt trying it.
Guessing the News
News events can be very lucrative, you can make a lot of money from them if you get things right, especially things like the Non-Farm Payroll announcements. The problem is that if you get it wrong, you can lose a lot of money. What some people try to do is to guess the direction that the news will make the markets move, this is never a good idea. The news can be unpredictable, the markets also do not always move in the direction that the news suggests it should. With news events the markets can jump quite a lot, so even with stop losses in place the markets can actually jump past them and you can end up losing more than you expected. Avoid trading the news unless you really know what it is that you are doing, it is far safer to avoid it than to guess at it.
Trading Without a Plan
This one is more relevant to those that are just starting out in their trading careers. Trading without a plan basically means that you are placing trades without any reason, this is the part of trading that could best be compared to simple gambling. You need to use a plan, otherwise, ask yourself why you are placing the trade that you are. If you cannot answer it properly, with analysis and things like that, or you just simply say because you think it will win, then you should not be placing it. Do not place trades without a plan, at any time in your trading career.
Those are some of the horrible mistakes that you and a lot of other people may be making. They can have a real negative effect on your trading or your life as a whole, try and avoid doing them at all costs. If you are currently doing one and can recognize that, then see what you can do to help yourself get out of doing it, you will see some huge improvements to your trading results and even possibly your personal life too.
With the suggestive quote below, Alexander Elder begins his masterpiece, Trading for a Living. Elder, who studied psychiatry in the former Soviet Union, enlisted in a ship from which he fled risking his life and after being chased by his own companions arrived in New York in 1974, with 25 dollars in his pocket and no one to ask for help. He currently presides over Financial Trading Inc., a company mainly dedicated to providing training and is widely known for its contribution to the psychology of trading.
With the suggestive quote below, Alexander Elder begins his masterpiece, Trading for a Living. Elder, who studied psychiatry in the former Soviet Union, enlisted in a ship from which he fled risking his life and after being chased by his own companions arrived in New York in 1974, with 25 dollars in his pocket and no one to ask for help. He currently presides over Financial Trading Inc., a company mainly dedicated to providing training and is widely known for its contribution to the psychology of trading.
With the suggestive quote below, Alexander Elder begins his masterpiece, Trading for a Living. Elder, who studied psychiatry in the former Soviet Union, enlisted in a ship from which he fled risking his life and after being chased by his own companions arrived in New York in 1974, with 25 dollars in his pocket and no one to ask for help. He currently presides over Financial Trading Inc., a company mainly dedicated to providing training and is widely known for its contribution to the psychology of trading.
“You can be free. You can live and work anywhere in the world. You can be independent from routine and not answer to anybody.”
In this article, we will review the main concepts of this work, which deals with a fundamental aspect, forgotten by many, which is the control of emotions, for many authors this constitutes more than 50% of our success as traders, to which we would add in second place the monetary management (money management) and in the last place we would have our trading system that contributes in a ridiculous 5%-10% to our result curve. If we devote a few minutes to these percentages we will realize that our scale of values was the opposite when we began to take an interest in the stock market.
Success in trading is achieved by understanding that control of emotions is the fundamental part of our operation, the lack of this control is what separates 95% of participants from their money. The trading industry knows this and carries out continuous advertising campaigns to attract new customers by promising a Holy Grail that never arrives and will never arrive if we look for it outside ourselves. A constant source of new entrants is needed to feed brokers, dealers, and the small percentage of traders who consistently make money.
The Amateur trader is attracted to the market by a powerful advertising machine that tries to convince him that this is a zero-sum game, all you have to do is be smarter than the rest of the participants to win large sums of money. The reality is quite different, it is not a game of Zero Sum, but a game of Negative Sum, the trader must fight, not only against the other participants but against the commissions and the slippage, that globally constitute huge amounts of money that is constantly drained by brokers and dealers.
They also convey to us the idea that sliding or slippage costs are necessary, they are the price we must pay to enter and exit the market, is the cost of liquidity. The reality is that every operation we do will be like a bite to our income statement so we must avoid markets with little liquidity and order it for the best, as well as operate with a methodology that performs an excessive number of operations.
Year after year, a large number of people approach the financial markets in order to achieve financial independence, most people with a low profile of risk aversion. Without a doubt, the first attraction that one has towards trading comes for money, however that is not the goal, in the words of Elder: “The goal is not making money, paradoxically, but to trade well”. We must worry about doing good operations and forget about the money that is at stake, only in this way can we make money consistently. By the time we let emotions take over, we’ll have lost the game.
Novice traders and those who want to enter this field often ask how much money can be earned annually, trading in the market, looking for a figure that serves as a reference, a magic figure on which to base the decision to leave a monotonous job and achieve financial independence. This is not, however, the right question, what we should ask ourselves is: How much money am I going to lose until I learn to trade and create a long-term winning trading strategy?
Planning and discipline play a crucial role, we must know at all times what our plan is and follow it to the letter, for this purpose it is advisable to take all the operations in a spreadsheet and write a diary with our operations, in the words of Elder:
“Plan your trade and trade your plan.”
This is a phrase that contains much more content than we see at first glance and that most new traders skip. In our trading journal, we must reflect the trades in as much detail as possible, which will separate us from the casino player and lead us to structure our mind and continuous improvement of our trading system. It is of course easier to write down the days when we have earned money and feel euphoric, we must be disciplined and write down every day we have operated, whether positive or negative. We must have a long-term mentality in our operation, if we are to start operating in the market we must mark a long period of survival in the market.
According to an old adage from Wall Street, “Bears make money, Bulls make money, and pigs are slaughtered”. Having added the sheep to this group, we can already classify all market participants. The price that every action, future, commodities, etc, shows us at every moment is nothing more than a psychological effect of all traders participating in a market. Every day a battle is established between Bulls and Bears. The bulls are those who think that the market will rise, the bears, on the contrary, think that it will go down, the pigs are dragged by greed and have no clear stance to take, while sheep are moved by fear of taking positions in the market and are highly influenced by other participants, analysts, and gurus. Pigs and sheep will always lose money.
According to Alexander Elder the market is a huge mass of traders, in which everyone tries to take the money from others by being smarter. In addition to this fight, traders have to face commissions and slippage, so by opening a position we are already losing money. Independent traders trade for both irrational and rational reasons, the rational reasons are the search for a net return to our capital, while the irrational ones are gambling and the search for strong emotions, We must fight to control our irrational side, which will drive us to operate excessively.
“Remember your goal is to trade well, not to trade often.”
Faced with all these obstacles the trader who works for a firm has the great psychological advantage of not risking his money, besides the discipline is imposed on him by his superiors, but respect can be left without work. Another proof that trading is pure psychology is in the numerous examples of traders who have left their companies to devote themselves independently and due to greed, fear, panic, and euphoria, Their performance has been lower than that obtained as salaried traders.
We can’t control the market, the only thing we can control is our emotions when we open up a position. Being in the market completely changes us and we stop being guided by our system and start to be guided by the movement of the mass. Mass psychology has a great application in the world of financial markets. From the tulip-mania, the South Sea Company to the technology bubble, these phenomena are explained by greed and fear of the masses.
There are two books on mass psychology that are a necessary reference for the explanation of this type of phenomenon of collective madness, Charles Mackay with his work, “Extraordinary Popular Delusions and the Madness of Crowds” and the book by the French philosopher Gustav LeBon “The Crowd”. According to mass psychology, people change completely by getting into the crowd, we are more gullible, more anxious, we strive to look for the leader and we react to emotions instead of reasoning our decisions. Mass behavior will always be more primitive than individual behavior. In the words of Charles Mackay: ‘Men go mad in crowds and they come back to their senses, slowly, and one by one, reflect on this phrase as you think about what happened during the recent technology bubble.
Like the allegory of the sirens’ songs, which captivated the sailors with a song so beautiful that it forced them to jump into the water where they died drowning, In the market, there are also siren songs that will make us follow the mass in our investment decisions. To avoid certain death the sailors tied themselves to the ship’s mast and applied wax to their ears. If on the market we hear siren songs, let us stick to our trading system and our money management rules and thus avoid indications coming from abroad and focus on our way of trading, although this is easier said than done, We’ll get him on discipline.
We must be skeptical of all information coming from outside. As we begin to operate our first objective will be to preserve capital and the second its increase. This order of priorities is reversed in most cases and we skip the first phase, when we start in the markets greed and fear dominate our behavior. If we take as a reference a daily bar chart, we could state that the opening price is marked by amateurs and the closing price by professionals. In markets like the American, it is recommended to avoid the first hour of negotiation since false movements abound and are considered as the time of the novices. Statistical studies show that the best results are obtained by avoiding this first hour of negotiation.
The trader’s work is based on looking for trends and areas of congestion, being the second much more abundant than the first, if we observe a chart the task seems easy. Experts and gurus show us graphs and tell us where we should have entered and left the market as if this was a simple task. The problem is that your broker will not let you place the order in the middle of a chart, it will always require you to do it in the closest part to the right margin, in the most current part. This brings us to a world in which we must make our decisions based on probabilities in an atmosphere of uncertainty. Most people do not accept uncertainty, as they have a strong emotional need to be right in their decisions, keeping the losing positions in the hope that the market will turn around and give us a reason and selling the winning positions prematurely to feed our ego. Wanting to be right in the market can be very expensive.
Trading is a very exciting activity and this leads novice traders to feel euphoric, for an amateur trader being in the market is like a ticket to the cinema or a football game, However, trading is a much more expensive entertainment than film or football and no one can feel euphoria in the market and earn money at the same time, “Emotional trading is the enemy of success”. We should not feel emotions about the results of our operations. We must concentrate on doing good operations and improving our skills day by day and not on the money we are earning or losing.
If we seek financial independence as traders, we must consider trading as a profession. Just like a good doctor or a good lawyer, we must devote many years of preparation or perhaps think that we can practice law, or medicine with 3 or 4 magical systems and two courses on how to operate in the market. Another common mistake is to count the money we are earning or losing while we are in the market, a good professional in any other profession would never do it. The goal of the trader is to make good trades and the money must be in the background, if we make good trades the money will come without us realizing it. We can count the money when we have closed the position, at the time of registering it in our trading journal.
I hope that this brief review of Elder’s work will help you to know better the market and especially to know yourself better, the emotional component of the stock market operation is very important and we must dedicate time if we want to belong to the select club of 5%. Although the author considers money management fundamental, it is a book of psychology and this topic only gives two tips, the rule of 2% risk per position and a maximum 6% monthly loss.
If a survey were conducted among Forex and Futures retailers and one of the questions was: “What method or system did they first use to negotiate?” Without any doubt, the vast majority of traders would say that they started with indicators such as moving averages, stochastic, MACD, Bollinger Bands, and the list would follow. I’m […]
If a survey were conducted among Forex and Futures retailers and one of the questions was: “What method or system did they first use to negotiate?” Without any doubt, the vast majority of traders would say that they started with indicators such as moving averages, stochastic, MACD, Bollinger Bands, and the list would follow. I’m […]
If a survey were conducted among Forex and Futures retailers and one of the questions was: “What method or system did they first use to negotiate?” Without any doubt, the vast majority of traders would say that they started with indicators such as moving averages, stochastic, MACD, Bollinger Bands, and the list would follow.
I’m very lucky to be able to talk and help traders with their trading objectives every day, and the list of methods and systems with indicators that I find are endless. You just have to look at any Forex forum to see how many of the new traders are scouring all the “Forex Systems” threads for the latest indicators, because people use new indicator systems whenever they can (not necessarily the most profitable).
The reason the indicators are so popular is that they feed into the new trader’s belief that the indicator can help predict where the price will go. In order to understand the indicators in the right way traders need to understand how the indicators are constructed and project their information. 98% of all indicators are built using old price information to make a late indicator. For example, a moving average is created using the old price to make a mobile line that traders can use in various ways.
The main problem with indicators is that they are always created after the event and traders are using previous information to guide them. In other words, they are using late information to make live trading calls.
A Dangerous Trading Mindset
The other major concern with indicators is that traders rarely stop at an indicator and that’s often where things begin to adjust to the trader mentality. A novice trader will normally have some winners with their first indicator. It doesn’t matter how many losses the trader has suffered or even if they terminate their account. What the trader tends to remember is that the first indicator helped him to make a winning transaction and above all the trader will remember that this first indicator helped to predict correctly the direction of the price. All the losses and bad thoughts have been completely relegated to one side because the trader has already moved on to what comes next and has already solved EXACTLY how it will do everything again and much more.
The trader often thinks: “If an indicator helped me to perform a winning transaction, then two indicators will surely help me to predict even better the direction of the price” and then when two do not help, three have to be even better, etc., but the problem is that, Like so many things in negotiation, this just doesn’t work out this way. Human beings in everyday life are programmed to think that anything worthwhile can’t be simple and new traders often spend a lot of time trying to make trading complicated by adding fantasy indicators for their trading thinking that the more indicators they use, the better they can predict the direction of the price, but this is the exact opposite of what traders have to do.
This mindset is a trap in which it is very easy to fall because the trader may find himself in the usual situation of adding more and more indicators like him begins to have more and more losses, with the erroneous mentality that indicators will help you predict the direction of the price. What ends up happening is that the trader, from the beginning of his trading trip, uses so many indicators in his charts that he ends up in a tremendous mess and in a state of paralysis of analysis. The trader finally ends up with many indicators in his charts, and they all tend to contradict each other and the trader can no longer operate, as he is very confused about what to do. So what does the trader have to do?
Forex Indicators
The simplest and least complicated method of negotiation in the world is the action of price. All that is needed to negotiate according to the share price is a chart of the stock of the blank price and its method of negotiation. The main difference between the indicators and the price share is that with the indicators you are using old and late price share information to try to predict the future, but with the stock price continually reading the live price as it is being printed on the chart.
There are no indicators or external influences at all that are used to trade according to the price share. Basically trading according to the share price is the ability to read the price and make trades on any chart, on any market, in any time frame, and without the use of any indicator at all. Below are two charts, face-to-face, with the price share chart on the left side with just the raw price share and the graph full of indicators on the right.
Training and commitment are required to succeed by operating on the basis of price action as with any other method of trading or worthwhile systems, but the reason why trading with the share price is so successful, and why many professional traders use it, is because it simplifies the negotiation process and the mentality required to be profitable.
In this guide, I only intend to show you how I structure my trading by trading in the currency market. If you can give ideas or help in your process, the goal of this post will be more than fulfilled. What I want is to be as direct and clear as possible. I’ll go point […]
In this guide, I only intend to show you how I structure my trading by trading in the currency market. If you can give ideas or help in your process, the goal of this post will be more than fulfilled. What I want is to be as direct and clear as possible. I’ll go point […]
In this guide, I only intend to show you how I structure my trading by trading in the currency market. If you can give ideas or help in your process, the goal of this post will be more than fulfilled. What I want is to be as direct and clear as possible. I’ll go point by point.
How to Trade: The Basics
Focusing on the basics and making it simple. I mean, you don’t have to rely on hypercomplex strategies, use the software that packs it and put it on the server next to your broker. You also don’t have to be the best programmer, let alone dirty your platform’s graphics to make money on Forex.
You need systems. Systems work. Companies and results-oriented work methods are system-based. You should start applying and creating systems because they will allow you:
Know what you can expect (return and risk) in results.
Measure what you do.
Knowing when what you are applying is no longer working.
Yes, that of sitting in front of the computer, looking and saying “I think EUR/USD will go up” is the most common, but is that the normal thing here is to lose money. You need winning strategies to start the fight.
Intraday or Swing Trading on Forex?
This question is an interesting question and I make a small point if you’re starting. Swing trading involves trades that usually last several days and when we talk about intraday or day trading we mean trades that close on the same day.
Well, then which one? Like everything in life, it depends (we are). You have to learn that there is no “best for everyone”. In my case, I combine both operations because I dedicate full time to this, but if you are starting or are of the people who stress with trading, I recommend that you focus on doing swing trading.
As you consolidate here you can start to scale and seek to diversify doing intraday. But again, this is just something I recommend based on my own experience and people I’ve met over the years.
Automatic or Manual Forex Trading
Not all automated Forex trading systems are a panacea, and not all discretionary or manual trading systems are bad. Stop looking at it that way, we’re just talking about execution. That’s precisely why I’m going for automated execution. We are willing to talk a lot about this and other topics and if you find it interesting I can dedicate an article just to it. But think of automation as just how strategy is carried out. Whether it’s winning or losing is the basis of everything.
Automating a losing strategy does not make it a winner, it is only about applying strategies that are profitable and ensuring that they are executed in the best way (in manual we always cheat alone).
Is Analysis the Key to Trading?
Many people think that technical analysis is the key to beating the market and defend them from the last consequences. The same thing happens to those who always think that the only way to make money in the currency market is through fundamental analysis.
So what really works? It works that really gives results and you can check. What’s the point of telling me that this or that method is the best if you haven’t even sat down to figure out numbers. Many times it’s not with what, but how. I mean, they can be different methods if they’re done right. But to do that, you need statistics of what you’re doing.
Learn to Create Robust Trading Strategies
First, let’s see what a robust trading strategy is all about. As traders, we know what has happened in the past, but we don’t know what will happen in the market tomorrow. That is why we need systems that are well adapted to the changing circumstances of the market.
How can we know systems are well adapted to spread alterations, prices.? Simulating those alterations, sort of simulating those conditions and seeing how they behave. There are different tests for this as they are: Walk Forward test, Monte Carlo and Multimercado.
These tests give us information on how robust our trading system is and give us a reference. Beware, I have said reference, not absolute truth. Then we will test them, our goal is to leave as little space as possible to chance.
Best Forex Trading Strategies
You may have doubts about how you’re going to manage to create profitable strategies and start with all this. Calm down, there are tools for this, but the important thing here is to know that the strategies that are usually more stable over time and give better results are:
Trading strategies with very simple entry and exit criteria: The opposite of what they might have told you. The simpler our Forex trading systems are, the more likely they are to continue to function over time. I have seen this and I know it firsthand.
Also, what is more likely to stop working, a system based on six indicators or a system based on one or two? That six indicators continue to produce results over years and years is not easy. However, only one or two are more so. Still, trading systems must always be monitored.
Systems with a low number of trades or trades: Sometimes, when we’re obsessed with being in the market constantly doing a zillion trades, we’re giving our broker money and taking it out of our pocket. More is not better in trading, better is better. This is about getting the most money with the least risk, not giving it to your broker.
Strategies with a controlled return/risk: You see a strategy, you look at its benefit in the last few months and years, and you’re already thinking about connecting it. Error, always look at the return associated with drawdown. The drawdown of your system is, in short, the maximum consecutive drop you have had. Why is it important? Because if that fall has occurred in the past it can happen again (and bigger, believe me). Now you’re thinking, what if this happens to me?
Establish Connection and Disconnection Rules
All methods of trading sound great. The problem is when they start to lose. Some tell you that you have to follow, that the system is the system. But what if the system is not working anymore? After all, we live in a changing world and our money is not infinite.
The truth is that most traders do not know when the system is failing or when this happens because they are applying it wrong. If you execute the strategies in an automated way you are already saving this, then what you need is a rule to disable your strategies at a certain point. To do this, simply monitor them with platforms such as bluefx or myfxbook to know what the performance of each one is.
Credit: theforexguy.com
Diversify Into Forex
If we deactivate a Ruben strategy, we stop trading. Not if you activate another one that is doing well. It’s not that you run a Forex trading system or two, it’s that you have different systems: the best ones in real and a demo base created that you can include in your real account when you disable some because their performance has dropped.
You can diversify by time frame (time frame), by assets (different currencies), or types of systems (trend, mean reversion). The goal of diversifying is to look for a more stable return, many people do this to introduce many systems without more, but if you do this you will get the opposite result, as you will be increasing the risk.
Which Currencies to Trade
I recommend that you focus on majors or major currency pairs, especially if your broker has a high spread, as these tend to be smaller. One of the advantages of automating is that you can scale your trade and do it in different currencies diversifying as I said before. Start by being profitable with a few (one or three assets) and as you evolve you can grow your portfolio.
Why Invest (Only) In Forex?
I won’t be the one telling you to invest in Forex and not in another market. Each is his father’s and mother’s and has his good and not-so-good things. Mind you, one thing is clear, wherever you do remember the power of specialization. There are traders who concentrate on one or two assets and are profitable. In the end that’s what it’s all about, isn’t it?
This operation is extrapolated to different assets such as raw materials, indices, and cryptocurrencies. Yes, cryptocurrencies as well. In fact, my operation is mainly based on currencies and cryptocurrencies (at 85% the first group and 15% the second). But I have to say that cryptocurrency trading has given me a welcome surprise this year. Again, if you’re starting, don’t do it with a lot of assets or you’ll get saturated. Start step by step and you will diversify as you evolve. The one that covers a lot, little squeezes.
Steps to Trading
If you get here not be entirely clear to you how the fuck I do trading, then I’ll summarize it for you in steps:
I create statistically profitable trading strategies and test that they are robust.
I put them in a demo account to make sure they work perfectly.
Once they meet the requirements I demand, I’ll move them to real.
In a real account, I manage my systems by connecting and disconnecting them according to their performance (always under objective criteria).
In this article, I will try to teach you to neutralize the emotions you may feel during the usual operation. Imagine, for example, that suddenly fear induces you to reverse an operation leading to a pullback, or have greedy thoughts that lead you to assume too much risk while operating; well, there are ways to […]
In this article, I will try to teach you to neutralize the emotions you may feel during the usual operation. Imagine, for example, that suddenly fear induces you to reverse an operation leading to a pullback, or have greedy thoughts that lead you to assume too much risk while operating; well, there are ways to […]
In this article, I will try to teach you to neutralize the emotions you may feel during the usual operation. Imagine, for example, that suddenly fear induces you to reverse an operation leading to a pullback, or have greedy thoughts that lead you to assume too much risk while operating; well, there are ways to neutralize sensations and thoughts, in such a way that these do not eliminate the best from you as a trader. So they can’t get the best of you. But you must always keep in mind that there are many occasions to respect fear and use it to be cautious, and there are others to push past it.
First, we must use a trigger-type strategy (trigger) which works when greed makes us risk more than we should. It’s basically a self-regulation strategy to alter the state of mind. The trigger-type strategy is so-called because it sets a positive action that counteracts a negative emotion. When you use a trigger, you are actually using an association between body and mind to get out of one state and into another.
Suppose you’re afraid to open an operation. You want to get over it. To do this we can create a trigger that reminds you of a thought that neutralizes the fear you feel when you press the send key or when you pick up the phone to give an order. The trigger may be to look at an object in the room, hear a sound, or touch something. Sight and touch are often the best triggers for many people, as they are the most powerful primary sensory channels.
For example, the windows in my office overlook a landscaped area with trees. When I look out the window and stop looking at the monitor, I associate this image with peace and quiet. The market goes up and down but the garden is always still, static before news or market turns. The garden helps me to stay stable, making me less susceptible to the emotions that can come into action in the face of the movements that occur on the screen.
In this case, we would have two triggers: the visual stimulus of looking at the garden and the slight movement of my chair to see it. The visual and kinesthetic triggers (the physical movement of my body and turning my head to the left) take me away from any fear or anxiety, something calm, stable, and balancing. My change of orientation towards the garden barely allows me to remember what is happening in the market.
The point is that a trigger becomes strongly associated with a specific mind shift, and the trigger invocation triggers the desired change. While the trigger does not induce me to get up periodically and go out into the garden, remaining totally absent from the market or anything else, it allows me to have a moment of visual refreshment and mint. In general, it is easier to trigger with a real-world stimulus, but it is not necessary. You can use a mental image as a trigger.
The trigger can be as simple as attaching your thumb to your index finger, which can trigger the internal search for a relaxing image that immediately neutralizes any thought of fear or greed. Choose a trigger that is simple for you and associate it with an image that neutralizes those thoughts. As time passes and you do it more and more times, you should notice that the association between your trigger and thought or mental image becomes stronger and stronger.
Some mental images that are effective in neutralizing negative thoughts are, for example, scenes of quiet places you have visited (a coast, mountains, a valley). Any relaxing image will do the job, but experience different images, because the stronger your attachment to the image, the more effective it will be.
The reason why triggers work is that you are building a mind-body connection between your trigger and thought or image. It is very true that it is always possible to move from a negative to a positive attitude without a trigger, using this tool the change occurs in a faster and more intense way.
For those who wish to expand on the use of the mind-body connection applied to the neutralization of negative thoughts and emotions, there are quite a few books on the subject, all of them authors enrolled in the therapeutic school known as neuro-linguistic programming. These techniques have been applied since the mid-1970s in psychotherapy, marketing, communication, education, sports, and trading.
We are always on the lookout for new ways to improve our trading and the results that we are achieving. We have probably tried a lot of things in the past that have either worked or not worked. Instead of just throwing random ideas out there, we are going to be looking at 10 of […]
We are always on the lookout for new ways to improve our trading and the results that we are achieving. We have probably tried a lot of things in the past that have either worked or not worked. Instead of just throwing random ideas out there, we are going to be looking at 10 of […]
We are always on the lookout for new ways to improve our trading and the results that we are achieving. We have probably tried a lot of things in the past that have either worked or not worked. Instead of just throwing random ideas out there, we are going to be looking at 10 of the things that have worked and have been successful in improving our overall trading. Some may be big things, others very small, but the important thing is that they have the potential to make us a better trader.
Keep a Trading Journal
One of the biggest and best things that you can do is to start a trading journal. A trading journal is basically that, a journal where you write down things that you do, your entries, exits, time trades are open, profits, losses, and more, pretty much everything that you do and the reasons for as well as the results of what you did. It sounds like a lot, but once you get used to it you can fill it out pretty quickly, and once you do it is an invaluable tool. You can use it to find out what you are doing well as well as what you are not doing well or where you are deviating from your plan, this then allows you to make adjustments and then ultimately improve on your trading.
Ask for Feedback
Feedback can be a powerful thing, especially when it comes from other traders. Often when we do something we have a sort of tunnel vision, we see what we want to see and the things that we do have a nice rosy tint on them. Getting feedback from someone else, outside of your own views will give you a new perspective and they may be able to see things that you are doing wrong or that could be improved that you could not. Sometimes it can be hard to take criticism on what you are doing, but accept it and work with it, it is a great way to improve your overall trading.
Practice
A pretty simple one, but practice does make perfect after all. Make sure that you have a demo account available for you to use, this demo account is where you can practice your new strategies or trade ideas, it lets you try things without any real risks to your capital. It is always good to use a demo account, to begin with before you try something for real, so take advantage of one whenever you can.
Budget Your Funds
The old but gold rule of only trading what you can afford to lose. This may not improve your trading directly, but it will certainly help with your mentality. If you are trading with money that you actually need then you will be putting yourself in a situation where you will feel increased levels of stress, this can then lead to bad trades being made. Instead, if we are comfortable with the money we are risking, then we have a much clearer mind and so can concentrate on our trading far better.
Watch Successful Traders
Now, we need to be clear that we are not meaning that you should simply copy other successful traders, that won’t benefit you at all. Instead, you need to look at what sort of things that they are doing. This can then give you ideas on how you can adapt your trading. The things that they are doing are clearly working, so why not try and implement some of those things into your own trading strategy? It can help give you new ideas to improve but be wary about simply blindly copying, that will only lead to losses due to you not fully understanding what it is that you are doing.
Watch the News
This does not have to be on TV or in a newspaper, there are plenty of economic calendars out there on the internet that will give you an idea of what economic news events are coming up and the effects that they could potentially have on the markets. Take a look at these each morning and it can give you an idea of what you could trade or what you could avoid. Keep it in mind when you decide which currency pairs to trade, as high volatility news events could increase the risk on certain currencies.
Try New Strategies
You have your strategy that is working which is great, but there is no harm in trying something new. The strategy that you are using is working for the current conditions, but when they change, it may not be quite as effective. Learn a new one or two, something that you can use when the markets change, not only that, but it will also give you a new view of the markets and even ways to improve your currency strategy. Just try not to go crazy and learn too much at once, this can cause you to get confused and mix them all up.
Ignore Rumors
Rumors are out there and they turn up a lot when it comes to forex and trading. People shouting about how well a currency is going to do, or that an asset is going to collapse. Yet these things very rarely happen. If you are on social media, then take absolutely everything with a pinch of salt. If you are going to look for news, then look at a reputable site, not random people over the internet or sites that are set up for clickbait. This way you can avoid making trades or not making trades based on false rumors.
Use Indicators
Indicators can take a lot of the work out of forex trading, by this we simply mean that you no longer need to do some of the analysis that you otherwise would have. They do not take it all away, you still need to read them and then work out what the data shows, but it can certainly speed up the process, it can also help to eliminate some of the human errors that we have when we read and analyze things. The data given will be more accurate and will be presented a lot quicker than if we were to do it ourselves.
Be Confident
Confidence is a great thing, you need to believe in what you are doing, if you do not believe in yourself then you will end up being reluctant to place trades, not something that will make you much money. Believe in yourself, look back at your history to see how well you have been doing, just try and ensure that you are not getting overconfident this can lead to bad trades, so just believe in yourself but be sure to keep your feet on the ground.
There are ten different ways that you can improve your trading, there will of course be a lot of other things that you can also do, each and every trader will be different with different ideas and different abilities, but there are some things that work for all traders. Try and do as many of them as you can if you aren’t already, and you should hopefully see an improvement in your trading results.
Let’s be honest, we all came into trading thinking that we were going to be rich, that is simply the expectation that a lot of new traders come into trading thinking, they have seen all the advertising spells with the present but often hidden warnings about the number of people who lost money. Due to these adverts and people on social media, people feel that trading is easy and that they will make a lot of money very easily and very quickly Or there are those that know very little about it that see it as gambling or a risk to do. Both of these expectations come from what they see from the outside, yet when we get into the actual facts, things are very different in reality than they are in their expectations. We are going to be looking at some of the differences between the realities and expectations of trading.
Let’s be honest, we all came into trading thinking that we were going to be rich, that is simply the expectation that a lot of new traders come into trading thinking, they have seen all the advertising spells with the present but often hidden warnings about the number of people who lost money. Due to these adverts and people on social media, people feel that trading is easy and that they will make a lot of money very easily and very quickly Or there are those that know very little about it that see it as gambling or a risk to do. Both of these expectations come from what they see from the outside, yet when we get into the actual facts, things are very different in reality than they are in their expectations. We are going to be looking at some of the differences between the realities and expectations of trading.
Let’s be honest, we all came into trading thinking that we were going to be rich, that is simply the expectation that a lot of new traders come into trading thinking, they have seen all the advertising spells with the present but often hidden warnings about the number of people who lost money. Due to these adverts and people on social media, people feel that trading is easy and that they will make a lot of money very easily and very quickly Or there are those that know very little about it that see it as gambling or a risk to do. Both of these expectations come from what they see from the outside, yet when we get into the actual facts, things are very different in reality than they are in their expectations. We are going to be looking at some of the differences between the realities and expectations of trading.
The Work Involved
If you go onto social media you would get the impression that there isn’t really that much work to put in in order to make a bit of money, if you have watched a trading film, which is the only reference that a lot of people get, you will either think that there is an incredible amount of work or none at all. Either way, whatever your expectation is, it is probably wrong. Those coming into trading thinking that they won’t need to put on a lot of work will be in for a shock. There is in fact a lot of work involved. In fact, it can take a very long time to put on a single trade, if you want to be profitable then this won’t happen overnight. Instead, it will happen over months or even years for a lot of people. If you want to succeed then you need to ignore the idea that it is quick and easy and instead come to realize that you are going to have to put in a lot of time and effort.
Is It Gambling?
From the outside, forex trading can look like a bit of a gamble, let’s be honest, the markets will either go up or they will go down which makes it a 50/50 chance right? Pretty easy to guess then, well not exactly. The markets are influenced by hundreds of different things, each pulling the market in one direction or another, it is up to you to work out which way it will go. You cannot however simply guess, if you do that, you are pretty much guaranteed to lose overall. Instead, you are going to need to take your time to analyze all the different indications and influences of the markets. This will enable you to see which is the most likely direction that the markets will move in. This can then give you the best chance to trade correctly, so it certainly is not gambling. It is all about weighing up the different probabilities and then trading in the most likely direction.
Required Funds
Many people seem to be coming into trading thinking that they will be able to make a lot of money off a $100 account, this is simply not the case though. Much like with anything in life, you need money to make money, the larger your account is the more profits you will be able to make. Those adverts that are promising you that you will make $100,000 on a $100 account overnight are simply trying to scam you out of your money. If you want to make a lot then you will need to start with a lot. Otherwise, you will need to slowly build up your account over a longer period of time. If you have a $100 account then you can expect to make a few quid per week, not double it up every single week.
Winning Formula
There are hundreds of strategies out there, loads of variations of each one, so why some people come into trading looking for that magic formula that will make them profits all year round is very confusing. If there was one strategy that worked, then we would all be using it and all those other strategies simply would not exist. Not to mention the fact that if there was one strategy, the markets would simply cease to function, as everyone would be using the same strategy and putting on the same trades, meaning that the markets would come to a standstill. For this reason, there cannot be a single strategy that always works, instead, you need to learn a number of different ones in order to remain profitable all year round.
Is It Random?
The simple answer is no. The markets are far from random but they certainly look like it sometimes. From the outside it looks like they simply do what they want, moving up and down whenever they want for no apparent reason. When in reality there are a lot of different things that can cause them to be and to influence the way that it moves. Trader sentiment, news events, natural disasters, and economic data are just a few of the things that can influence it. When they do take effect, the directions and the effects can be predicted, however even though it can be predicted to a certain extent, it can also move out of sync, moving against what would be expected. This is why trading is not a guaranteed thing, while it can be predicted to an extent, it does have a very small essence of randomness to it, but not as much as it may look like from the outside.
Is It A Scam?
Another popular opinion amongst those that do not actually trade is that forex is basically a giant scam, it is full of people wanting to take your money and you can’t actually make any profits. The sad truth is that this is partly true, there are a lot of scammers out there, from traders, account managers, signal providers, and even brokers. There are ones that are there to simply take your money, but this is not what all of them are doing. There Are genuine people out there that are actively trying to help you to make money, there are some great brokers that are only there to help, signal providers offering genuine signals, you get the point. So while there are frauds out there there are also some great opportunities too.
Those are just a few of the expectations that we see people have and what is actually going on. There are some similarities in places, what we see is sometimes what we get, however, there are also a lot of differences, once you actually get into trading you will come to find that there will be a lot of differences in what you experience compared to what you were thinking you were going to get.
When you tell someone about trading and forex, what do you tell people? Most likely you are telling them all the best things about trading, these good reasons are the reason why you trade in the first place after all. These stories that you are telling other people are what is creating an expectation in them of what trading and forex actually are. If you look anywhere on the internet, there will be people talking about forex and how much you can make, how easy it is, and how life-changing it is, very rarely do you hear horror stories or the opposite feelings. This creates a certain expectation from people outside of the trading circle, expectations that do not really match up to the reality of what trading is and what it involves. We are going to be looking at what some of the realities are when compared to the expectations that a lot of people have and seeing whether the general expectation is right, or if reality is completely different.
When you tell someone about trading and forex, what do you tell people? Most likely you are telling them all the best things about trading, these good reasons are the reason why you trade in the first place after all. These stories that you are telling other people are what is creating an expectation in them of what trading and forex actually are. If you look anywhere on the internet, there will be people talking about forex and how much you can make, how easy it is, and how life-changing it is, very rarely do you hear horror stories or the opposite feelings. This creates a certain expectation from people outside of the trading circle, expectations that do not really match up to the reality of what trading is and what it involves. We are going to be looking at what some of the realities are when compared to the expectations that a lot of people have and seeing whether the general expectation is right, or if reality is completely different.
When you tell someone about trading and forex, what do you tell people? Most likely you are telling them all the best things about trading, these good reasons are the reason why you trade in the first place after all. These stories that you are telling other people are what is creating an expectation in them of what trading and forex actually are. If you look anywhere on the internet, there will be people talking about forex and how much you can make, how easy it is, and how life-changing it is, very rarely do you hear horror stories or the opposite feelings. This creates a certain expectation from people outside of the trading circle, expectations that do not really match up to the reality of what trading is and what it involves. We are going to be looking at what some of the realities are when compared to the expectations that a lot of people have and seeing whether the general expectation is right, or if reality is completely different.
It’s Incredibly Easy or Hard
When all you hear about is the fact that people are making a lot of money or that people are making some great returns then it would make it seem like trading is easy, thousands if not millions of people are making money doing it, this is true, but they are putting in a lot of effort in order to get to that level, they did not simply sign up and then place trades in order to be successful, a lot of work needs to be put in. On the other hand, looking from the outside, it can look like it is incredibly complicated, with numbers all over the place, charts, indicators, and more. It can seem very complicated which would make it seem hard to do. When in reality, it is quite straightforward, it does take time and work, but it is nowhere near as complicated, most indicators are self-explanatory and when you actually start using them, they make a lot of sense.
You Need A Lot of Money
If you have watched any trading films, it would make it seem like you would need a couple hundred thousand to trade properly, and to be honest, this would be true if you went for a 1:1 leverage account. The thing is that a lot of brokers these days are offering far higher leverage. In fact, some go as high as 2000:1 which is a little extreme, but even the popular 500:1 makes it so that trading is far more accessible to the average person. Many brokers allow you to sign up with a minimum deposit of $10, which will allow you to trade, you would need a couple hundred to trade properly, still a far cry from the hundreds of thousand that you otherwise may have thought you would have needed.
Forex Is A Scam
When something seems too good to be true, then most people would consider it a scam, and many people see forex as too good to be true, a way of making money by sitting at home in your underwear. It is Perfectly understandable why people think that trading is a scam, but in reality, it is not. Yes, there are people who try to scam newcomers into trading or to take advantage of what they believe, making quick profits, but trading in itself is not a scam. It really is a way to make money at home, even in your underwear, but it takes time and effort, so don’t believe the huge and instant returns that are promised and work on your own trading. Oh, and you should also keep an eye out for those dodgy brokers, but choose a good one and you should be fine.
It’s All the Same
From the outside, all the different currency pairs look pretty much the same, the charts look pretty similar and they all work the same way. Fortunately, that is not the case, in fact, every single currency pair acts completely differently, they have different levels of liquidity, different levels of volatility and offer a new trading experience when compared to another. For this reason, it is recommended that you learn a single currency at a time, then move on to a new one, if you start with a load you will be confused and make losses. With so many different currency pairs to choose from, it ensures that trading will always be interesting and there will always be new challenges to look for.
The Gambling Aspect
For some trading and forex simply looks like a gamble, there are only two outcomes, after all, the markets will either move up or they will move down. While technically true, there is a lot more behind it than simply that. There are thousands of different things that can influence the markets. News events, natural disasters, Donald Trump tweeting something, or just other traders thinking the markets will move a certain way. You need to take all of this into consideration, once it has been analyzed you can work out the most likely direction of the markets, it is not simply a 50/50 chance of it moving one way or another. Some people do of course come into it and gamble, but they very quickly learn that you cannot be successful by trading that way.
Managing your expectations is vital when it comes to trading, many people come into it with expectations that are far too high, thinking that they can make a lot of money overnight, this just won’t happen. If you have your expectations in the right place then you will be in a much better place to achieve your overall goals. Managing your expectations is vital for a successful trading career.
Those are some of the differences in the expectations that people have compared to the realities of trading. From the outside forex looks like a very different beast than it is from the inside. You don’t really know what is involved until you are in it and when you are, your expectations will be quickly broken as you realize what it is really about.
Many investors wonder how to invest in silver in the most appropriate way since silver has traditionally held up well to inflation and has contributed to the offsetting of investors’ portfolios. When everything else goes wrong, silver becomes one of the best investment alternatives, just like gold. In today’s article, we will analyze the different […]
Many investors wonder how to invest in silver in the most appropriate way since silver has traditionally held up well to inflation and has contributed to the offsetting of investors’ portfolios. When everything else goes wrong, silver becomes one of the best investment alternatives, just like gold. In today’s article, we will analyze the different […]
Many investors wonder how to invest in silver in the most appropriate way since silver has traditionally held up well to inflation and has contributed to the offsetting of investors’ portfolios. When everything else goes wrong, silver becomes one of the best investment alternatives, just like gold. In today’s article, we will analyze the different options with which we can invest in silver since the possibilities to invest in this unique precious metal are very wide.
Silver As A Refuge
It has usually been associated with silver as an active refuge, but it is much more than that, it is a natural element that has a multitude of uses in different fields, ranging from industry to luxury. Historically, gold has played a role closely linked to the monetary field. This historical fact is due to its properties, of which the five most important are the following: its scarcity, its durability or resistance, its divisibility, its homogeneity, and its difficult falsification.
Differences Between Gold and Silver
The main difference between gold and silver for investors is that silver has a much more industrial use than gold, therefore silver in relation to gold has to be more valued as a raw material. We do not want to claim that silver is a commodity per se, but in relation to gold, it is, on the other hand, if we compare it with steel, this valuation would change.
Because of this industrial attribute, there have been large discrepancies between the value of silver and gold. Gold has covered inflation, is an international currency, is relatively not very volatile, and is the stock of value par excellence. Silver however has great industrial use, has not covered inflation, and is quite more volatile than gold. For these qualities, it seems that having gold in the portfolio is more interesting than silver, but this also has good qualities, and depending on the period, silver has been a better investment than gold, as has happened recently. From the minimums of the pandemic to the maximums of the post-quarantine rally, silver was revalorized by more than 100%, while gold did so by around 30%.
Risks of Silver Trading
The risks of investing in silver are not as limited as those of gold, but arguably, the main risk of investing in silver is mainly opportunity cost, because, if we invest in it is waiting for a recession and finally comes an expansive cycle, while the entire stock market goes up your silver investment will fall or fall flat. Another risk is deflationary pressure, since if a crisis comes, where silver is supposed to act better but is linked to a very strong deflationary trend, silver might not behave at all well, because this makes it better with inflationary tensions. Finally, there is a certain cyclical risk, since silver, when used industrially, can have a cyclical component depending on the economic cycle or industry in particular where silver is needed.
How To Invest
Undoubtedly, investment in physical gold is traditionally the most common form of investment and widespread option. It consists of the physical acquisition of a silver ingot, silver jewelry, silver coins, or any element that contains silver mostly in its composition. This option has the advantage that you possess silver physically. On the other hand, it has the disadvantage that you have to bear some storage costs because, being such a valuable product, most investors do not keep it at home.
In this sense, there are different companies that are dedicated to the storage of any gold product, and that offers you the possibility of buying gold physically but not having to store it, I mean, you own the amount of silver you buy and it will be 100% insured. To emphasize that the acquisition of physical silver is more related to the idea of acquiring the good more like a luxury good than as an investment asset.
Investing in silver through the stock exchange is a way of owning silver by means of a title that accredits a right over the silver and not by means of its physical possession. This way of acquiring, which as we will see below has many variants, has a more investment approach. As in most situations, it has pros and cons in each of its different branches.
Silver ETFs
Silver ETFs are traded funds that try to replicate the behavior of silver. Although the fund must maintain a legal obligation to have all derivative contracts issued backed by silver, the ETF holder owns that derivative contract (ETF) which replicates the silver price, and not a proportion of the silver reserve. In this way, the investor, who owns the derivative, is exposed to the yields of the precious metal.
The advantages and disadvantages of silver ETFs are a projection of the advantages and disadvantages of the overall investment in ETFs. Investing in a silver ETF and not in physics has the advantage that it requires a lower cost, both for the execution of the investment and storage. In addition, as they are listed in the market as any stock they have the advantage of having greater liquidity compared to investment funds, giving the possibility to liquidate the position at any time in the market.
On the other hand, it has the disadvantages that the investor did not pose the silver physically, but a title (right) on some silver reserves. There is the possibility that the ETF does not faithfully replicate the price of silver, depending in part on how the ETF is composed. The ETFs are subject to commissions in their purchase, it will be necessary to take into account what are the commissions that can charge us for the operation and what impact it will have on the replication of the silver price.
Investment Funds
These are funds that develop their entire investment strategy around silver, gold, or other precious metals, either by acquiring companies that develop activity within the silver sector, either by own acquisition of silver in any of its tradable forms or by acquisition of ETFs silver. In addition, they are also often exposed to other precious metals, which increases the diversification of the fund. In addition, as you comment later on it is very complicated to find companies that have only exposure to silver and not to more precious metals.
The advantages of investing in silver through this form are the professionalized management of the fund, focusing on generating value for the shareholder. At the same time, it gives the possibility to invest in shares or other funds where it is not possible individually.
The disadvantages are the costs associated with the management of the fund, greater than in the ETFs, which can weigh the profitability.
Listed Silver Companies
Investing in shares of listed silver companies is the most direct way to invest in silver. We will differentiate two main types of businesses that operate in the sector with different business models: pure mining and royalty companies. In either option, we are exposed to greater risk than in the rest of the alternatives, which implies that we can enjoy both higher profits and higher losses. Within these two, the business model of royalties can be more interesting and less risky.
Seeing all the conflicts that are currently developing, the lower interest rates, the US elections, and the real risk of a slowdown, or even a recession triggered by the coronavirus, It seems not unreasonable to think that people will continue to support their investment strategy in buying gold with the aim of reducing risk and further diversifying their portfolio. Therefore, we could be looking at a good time in the cycle to buy silver.
Is forex trading riskier than stock trading? And Why? To answer this question we must analyze what is the best market to trade, whether Forex or stocks, and that is what we will try to reveal in this article because a person who is just beginning in order to know the different markets you have […]
Is forex trading riskier than stock trading? And Why? To answer this question we must analyze what is the best market to trade, whether Forex or stocks, and that is what we will try to reveal in this article because a person who is just beginning in order to know the different markets you have […]
Is forex trading riskier than stock trading? And Why? To answer this question we must analyze what is the best market to trade, whether Forex or stocks, and that is what we will try to reveal in this article because a person who is just beginning in order to know the different markets you have to decide in which of them you will make your investment and two of the best options are precisely Forex or stocks.
Over time, money is losing value as a result of inflation and a large part of your capital may disappear if you don’t work. So what you should do is have your resources constantly work for you. In order to achieve this goal, one of the ways to achieve this is to become a trader, a race full of emotions that begins when you choose a market to start trading. In the following paragraphs, we will make a comparison between two giants of the modern economy: stocks vs Forex.
The Stock Market
Stocks are financial instruments that provide the ownership of a company. Depending on the number of stocks held, a person can become the owner of a business together with the other shareholders and is entitled to the profits (or losses) that are given. It should be mentioned that the percentage of the company controlled by the investor is equal to the number of its stocks. The higher the number of shares you have, the greater your participation will be and you will enjoy better profits.
Thousands of people and institutions gather in the stock market to negotiate securities that represent ownership of several companies listed on the market. The stock market has been the main asset exchange market since the time of the industrial revolution. But thanks to the arrival of new technologies and the expansion of the Internet, other markets have emerged that counterbalance traditional actions.
Credit: pacforex.com
The Forex Market
Forex, also known as the currency market, refers to the market where participants trade and exchange coins from any country. Currency is how money is officially issued by a nation’s central bank and serves as a means of exchange outside and within a given economy. There are people and companies that carry out transactions from different nations, therefore it is necessary a scenario in which it is possible to exchange these different currencies.
“We will analyze the most relevant aspects of Forex vs Stocksto determine which may be the best investment.”
Ease of Access
Forex trading, in contrast to the stock market, is not based on physical stock exchanges but is OTC (over the counter). This means that negotiations are conducted via the Internet and people can access them anytime and anywhere, which translates into superb accessibility.
We must know that today, the negotiations with stocks (and in general with any financial instrument) are conducted via the Internet. Anyone who wants to trade, whether with currencies or stocks, just select a broker, open an account and download the trading platform. In this respect, both the Forex and stock markets are easily accessible.
Credit: Investment School
Leverage
First of all, it should be borne in mind that, both in stocks and in the foreign exchange market, entry requirements are minimal and in some cases, it is possible to open accounts without making any deposits. An important element to consider is leverage, which can be accessed when negotiating. This leverage is like a loan that the broker makes to its clients to make a trade with more money than we have.
In the stock market, the usual leverage is 1:2 (you can borrow 2 dollars for every dollar you have of capital), while in Forex it can reach 500:1. There is no need to be too smart to choose the best option. The high margins offered by brokers give this point to the currency market. But…leverage can become a problem for some traders, especially for those starting out in this market. This tool allows you to multiply profits, but the same will happen with losses. So you need to use leverage with responsibility and knowledge.
Another aspect to compare between Forex and the stock market is the different trading costs. In Forex, commissions are usually lower due to the large number of brokers that exist. On the other hand, stock exchange brokers charge commissions, spreads, and other fees that can significantly increase commercial costs.
It may seem that these small costs do not have much incidence because they will mean a few cents, but as time goes by you will see how they add up and become a major expense. These small expenses can deplete a portion of your earnings. At this second point, the Forex market takes the lead with its higher leverage ratios and lower transaction costs.
Operating Hours
Probably the most obvious difference, when comparing Forex to stock trading, is trading schedules. The stock market is limited by timetables of exchanges worldwide. Forex is open 5 days a week and 24 hours a day. This Forex feature allows people to trade at any time, providing for investors who have traditional jobs. But, although the Forex market is widely accessible, there are hours with higher volumes and therefore better opportunities.
One of the features of Forex is that volatility and liquidity levels remain relatively constant over time, allowing traders to generate profits in the short term. However, that doesn’t mean that you should envy yourself to the market and spend all your time viewing the graphics. The market won’t go anywhere.
Another positive aspect of foreign exchange trading is that if you open a position and get important information that forces you to close the position, you can do it immediately without waiting for the opening of the stock exchange. When deciding between trading stocks or currencies, the advantage of Forex is obvious. Its great accessibility is a plus.
Diversity of Offers
One of the most diverse markets is the stock market. There you will find the stocks of hundreds of open capital companies belonging to a wide variety of sectors and industries. This may seem positive, but such diversity can become confusing and prevent a quick analysis of available options. Can you imagine having to analyze hundreds of stocks and then buy just one of them?
Looking at the Forex market versus the stock market, it is possible to show that with currencies the scenario is significantly different. In Forex, the most quoted instruments are the so-called major pairs (groups of currencies composed of the most important currencies) and the US dollar is part of the vast majority of transactions. A trader who is aware of the key factors affecting the dollar will have a good overview of the other currencies.
Similarly, most Forex brokers offer one more possibility: CFDs (difference contracts). These instruments allow transactions with different assets without actually having them. ¡ That means even on Forex you can trade stocks! And so, when comparing Forex vs stocks, it is the currency market that takes the lead once again thanks to CFDs.
In conclusion, thanks to its greater accessibility, vast amount of possibilities, and superior freedom, Forex manages to position itself as a better investment option than stocks. While it is true that Forex risk may be higher because of increased leverage, we have options to have good risk management and minimize them.
Risk, something that you are either afraid of or something that you love, whichever one is you, controlling it is vital if you want to become a successful trader. When you first started you probably created something along the lines of a risk management plan, this will tell you what you should be trading with […]
Risk, something that you are either afraid of or something that you love, whichever one is you, controlling it is vital if you want to become a successful trader. When you first started you probably created something along the lines of a risk management plan, this will tell you what you should be trading with […]
Risk, something that you are either afraid of or something that you love, whichever one is you, controlling it is vital if you want to become a successful trader. When you first started you probably created something along the lines of a risk management plan, this will tell you what you should be trading with each trade, what your stop losses should be and all sorts of other important information, its purpose is to protect your account from losses so that you are able to survive a number of losses before losing your account.
The thing is though, a lot of people make one, but make a small one, one with not a lot of information in it, or they simply decide to just ignore the rules that they have worked out. Whichever way they do it, they are avoiding the controlling of their risk, and eventually, this will lead to disaster and the possibility of a completely blown account. When the risk involved starts to rise, we often end up doing things that we would;t ordinarily do, such as closing out trades early, closing out for losses, or simply coding everything through a panic. We will promise to learn from these mistakes, but as soon as we get into a similar situation, we will normally do the exact same thing, not learning from the past, simply because we are not using proper risk management.
The issues start to arise when the risks that you are taking are larger than your risk tolerance levels allow, some of us love the risk others hate it. A lot of traders, especially newer ones will spend all of their time looking and working out when to enter a trade, but they often don’t put a lot of thought into when they will get out, this is where risk management needs to come into play. It is all about working out when you need to get out of your trades, both in winning and losing positions, but of course, being able to limit your losses when your trades are going the wrong way is vital and one of the most important aspects of your trading. So while it is important to know when to get into trades, you need to also work out when you will get out, prior to actually getting into it.
You need to work out where your risk tolerance lies and then adjust your risk management to suit it, the last thing that you want is to be a nervous wreck every time that you put on a trade. It is the same the other way around too though, you want to have some form of caring with each trade, if you do not care about the risk then you will be making silly trades, making trades you probably shouldn’t a risking far too much with each trade, simply because you do not care about the consequences. So it is a bit of a balancing act, but we are now going to look at some of the things that you can do to help manage your risk.
Trade Sizes
Trading with a large trade size can mean that you can make a lot more profit on each trade, on the flip side, you can also make much larger losses, the volatility will go through the roof the larger the trade size you use. So while it can be exciting, especially for those with good risk tolerance, it can be a nightmare for those without, and potentially a disaster for your account. You need to bring your trade sizes more in line with your account balance. Many people decide to risk between 1% or 2% per trade, this gives you a lot of leeway for losses, a loss will only cause you to lose up to 2% of your account and so when you do lose, it is limited and sustainable. If you aren’t able to work out what your trade size should be then it would be best to start small and then work your way up until you reach the appropriate level.
Holding Trades
For many there is only short-term trading, something only becomes long-term trading when one of the short-term trades stays in the red, people just don’t want to close out trades when they are in the red and this is an extremely risky move to make. The longer that you hold onto a trade, especially when it is in the red, the more volatility it is exposed to, this volatility is what is dangerous to your trade and can continue to take it in the wrong direction. You need to be able to limit how long to hold onto trades. If your average trade length is 10 hours, then why would you suddenly hold on to one for 7 days? You shouldn’t and so you need to set a limit to your trade times, try to keep them relatively the same, there is no harm going a little over now and then, but do not suddenly start holding on to them for 10 times your normal length.
Stop Losses
Stop losses! Use them! That is about all we need to say. Stop losses can save an account, they are that important, if you aren’t quite sure what they are yet, they are a limit that you put on each trade, a certain level, when the markets reach that level the trade will automatically close. If you are trading a strategy that requires longer-term trades then you won’t want to be in the position where you need to sit in front of the computer for the next 12+ hours, so instead, in order to protect your account you will put on a stop loss to ensure that you only risk the amount that you are willing to risk. This is a fantastic way of protecting your account and something that you should certainly use.
To go along with the stop losses and take profits, these work in exactly the same way but instead of closing out losing trades, they will close out trades that are positive. This is a way of ensuring that you take the expected or wanted profits, often when a trade goes positive it will eventually return back to a negative figure, this is a way of ensuring that you take the profits even when you are not at your trading terminal.
Risk to Reward Ratio
Your risk to reward ratio details how much you should be winning and how much you should be losing on each trade, this also dictates where you put your stop loss and take profit levels that we mentioned up above. It is important that you understand how this works, it can make or break a strategy as having a bad risk to reward ratio can make your strategy unprofitable. If you are trading at a 1:1 ratio then it can be quite hard to be profitable, you will need more winning trades than losing to be profitable, something far easier said than done. Instead aim to have a reward ratio of at least 2:1, some go as high as 10:1, which would mean that you would only need one trade to be profitable out of every 10 in order to be in profit. Work out what works well for your own risk tolerance as well as your strategy.
Those are a few of the things that you can do to help control your risk when trading, there are of course far more things that you can do, these are just some of the basics. What is important for you to take away is that you need to manage your risk, without doing so you will end up losing a lot more than you expected, so get on top of it and you will be in a good position for being a profitable trader.
There are a lot of advantages to trading forex over some of the other methods of trading such as stocks, some of these advantages are the leverage that you can use, the liquidity in the markets, and the volatility that the markets can give. Each of these gives you a huge advantage as a trader […]
There are a lot of advantages to trading forex over some of the other methods of trading such as stocks, some of these advantages are the leverage that you can use, the liquidity in the markets, and the volatility that the markets can give. Each of these gives you a huge advantage as a trader […]
There are a lot of advantages to trading forex over some of the other methods of trading such as stocks, some of these advantages are the leverage that you can use, the liquidity in the markets, and the volatility that the markets can give. Each of these gives you a huge advantage as a trader and can help boost your potential earnings. Of course, they can also add a bit of risk to your trading too. We are going to be looking at some of the advantages of trading forex today.
Leverage
The first advantage that we are going to be looking at is leverage, but before we work out why it is good, let’s get a little understanding of what it actually is. Leverage basically allows you to borrow the money that is needed to make a trade from your brokers. It allows you to place trades that are far larger than your balance would otherwise allow you to make, this is one of the reasons why it is so sought after. So if we take a simple example, let’s imagine that you have a balance of just $100, you would not be able to place much with a 1:1 leverage on the account, so we go for a 100:1 account. This means that for every $1 that we have in our account, the broker will top it up to $100, so will add $99 themselves. So that $100 account is now acting like a $10,000 account, allowing you to make far more trades. Of course, some brokers go higher, at 500:1, 1000:1, or even 2000:1, the latter two are a little too high and the 500:1 seems to be the sweet spot.
So that is what leverage is, but how is it helpful to us as traders and why is it one of the major advantages of forex trading? To put things simply, leverage allows us to trade a lot more and thus make a lot more profits. After all, why would you trade with an account with just $100 in it when you could be trading the equivalent of a $10,000 account. You should bear in mind, that while the brokers are giving you this money to trade with, it is not yours to keep, you will have to return it, and should you lose, you may have to pay it back, although most brokers now offer negative balance protection to help this. The main advantage is that it lets you trade with more and so they can earn more in profits. Larger trades mean larger profits and that is the main advantage to it. It does come with risks, but with proper risk management it is very manageable, so do not be afraid of taking larger leverage, just bear in mind that it does come with some risks.
Liquidity
The forex markets are one of the most liquid markets in the world, this simply means that there is a lot of money available to be traded at any one time. Liquidity is basically defined as the ability for a currency or asset to be traded on demand. As the forex markets are so liquid, this basically means that you are able to trade at any given time whenever you want, and the more liquid that a currency pair is, the lower the spread cost that comes with it. With high levels of liquidity also comes a certain level of calm, the markets will not jump up and down as violently when there is a lot of liquidity in the markets, making it a slightly safer investment opportunity. While the forex markets as a whole are incredibly liquid, there are some pairs that are a little less liquid and so the spreads may be higher and there may be larger jumps in those currency pairs.
Some of the higher liquidity pairs include EURUSD, GBPUSD, USDJPY, EURGBP, AUDUSD, USDCAD, USDCHF, and NZDUSD. Some of the lower liquidity pairs include the exotic pairs such as PLNJPPY, these sorts of currency pairs cannot be purchased in huge lot sizes due to the lack of liquidity, however, with smaller trade sizes they can offer large jumps and large potential profits and losses.
Volatility
Volatility within the forex markets is basically a measure of the frequency and the size of changes to a currency’s value. If something is described as having high volatility, this simply means that that currency or currency pair has frequent movements within its market price and those movements can be sharp and large, whereas a currency that is considered to have lower volatility will simply move up and down at a more controlled pace and those movements will not be as sudden and the price is far less likely to simply jump up and down.
Both high and low volatility pairs can offer us some advantages as a trader, if we take high volatility, the profit potential of these pairs is far higher than low volatility pairs. Imply due to the fact that the markets will be moving a lot more and when they do move, they move a much larger distance. So a single trade on a highly volatile pair has a lot higher profit potential in a shorter period of time than one on a low volatile pair. Having said that, there are advantages to a low volatility pair too, they are much safer to trade, you do not need to worry about any sudden jumps in the wrong direction and they are often considered as being a lot easier to predict. The slow movements allow you to constantly analyze the markets and changing conditions, allowing you to get in and out at a much more comfortable level. Which one works for you the best will simply come down to your own preferences and your own trading style.
So that is Leverage, Liquidity, and Volatility, all three offer you very different advantages to trading forex, and combined they are the reason why forex trading is becoming so popular for both professionals and retail traders. Ensure that you get an understanding of how each one works, this will enable you to much better maintain your account and to understand the risks and advantages that you are getting from your account and the markets that you are trading. Do not be afraid to experiment with different pairs that offer different volatility and liquidity, part of being a good trader is trying out new ways to make a profit.
It is possible that you have come this far because you are thinking about trading when news is published and taking advantage of the big moves that occur at that time. You may also simply wonder if this is possible or how it can be done. The best thing is to go point by point […]
It is possible that you have come this far because you are thinking about trading when news is published and taking advantage of the big moves that occur at that time. You may also simply wonder if this is possible or how it can be done. The best thing is to go point by point […]
It is possible that you have come this far because you are thinking about trading when news is published and taking advantage of the big moves that occur at that time. You may also simply wonder if this is possible or how it can be done. The best thing is to go point by point to see how and what news affects when we do trading, everything you should contemplate, and some things that don’t usually tell you.
What Economic News Impacts Trading?
As you may know, there are different news items that affect trading, especially in forex, such as macroeconomic events (for example, interest rate decisions), government policy decisions, employment news publications. Basically, we can distinguish between:
Economic News: GDP, inflation, unemployment or oil reserves, any related economic aspects that can affect a country and its currency.
Political News: decisions and governmental actions that are carried out in the country in question and have direct involvement in currency.
All of them are important (though some to a lesser or greater extent than others) and you can often see how when they are published it makes the currency pair in question move significantly. But how do we know when and what data will be published and the impact it will generate?
How to NOT Predict Trading News
It’s obvious, isn’t it? We already know when they’re going to be published, we’re going to put a lot of money in and let the flute play. NO. This might not work for you. And even if you get it right, you’ll end up losing everything. Events such as the one that occurred in the Swiss Franc (black swan) or the Brexit have left the graveyard full of traders. Even some brokers have had to close. Why?
News Trading Errors
Behind an excuse of losing money by trading when a story is published there is usually one or several of these causes:
Strong Leverage: Enter the market strong with a small account to earn a lot of money in a short time. In the end, your account does not resist and a minimal movement to the contra makes you lose count. Serious error.
Bet Mode: not having a trading system and think that this goes up or down because it comes out in the media, my brother-in-law has told me or because yes. If you don’t have a system, start working for it.
Stop-loss Strategies: Strategies with very small stops often do not have good results when the price moves aggressively. The institutional (the big ones) sweep them away. It’s not that these kinds of strategies are wrong or anything, but consider reviewing how they behave when these data are posted and limiting your trading if it doesn’t affect them in a positive way. This can be done not by being in front of the screen if you operate manually or by disconnecting your systems if you do so automatically.
News-Based Trading Systems
You may have read or thought that trading with the news can be very easy if you place a purchase order and a sales order. This hypothesis starts from the idea that price moves without setbacks. Most of the time this is not the case, since the price can be directed without a trend, either in its initial phase or during the entire period.
The price moves aimlessly before the news. We place a purchase order (above) and a sale order (below). Do not take into account the zones, it is just an example to see it.
Suppose we leave them as they are. They activate both and we lose the difference. Suppose now that when the first is activated we cancel the other. In this case, we also lose because we opened activated the purchase and subsequently the price falls. This doesn’t have to be like this forever, I just give you this example to you realize that what we’re dealing with isn’t as wonderful as appears in your mind.
Be careful with it. Try it, but be very careful and check results with backtesting. Logic makes us think that this can go well but then when we see the results we realize that often this is not so. These types of operations are usually displayed by brokers and platforms so that you operate when there is a lot of volatility and with a lot of money. Then they do their business, earn commissions and win when the customer loses. As a trader, you must be above these things and concentrate on your business and your operation.
Trading with Volatility and News
It is normal that you can think after all this when you open your trading platform “what if the flute sounds? what if it does?”. We’ve all read the typical news in the newspaper where it tells you that x person won an incredible amount of money with x event. Quick and easy. Here the survival bias is very high. Don’t tell you that that could be 0.0001%
Actually, with all this, I’m not telling you that you can’t trade when news comes in, I’m telling you to get your mind off the fact that you make a lot of money luckily. If you do not use high leverage and for example apply swing trading strategies or you have a % risk in each small trade if you diversify. this news will not affect to a greater extent.
In fact, be clear that most of the time there will be a complicated situation in the market: currency wars, economic crises, political decisions. Volatility in the market can occur when you least expect it and you should be a trader who knows how to manage this well.
Mind-Set to Trade News Trading
Many traders think that news is the axis of their ills and that all their losses are due to this or the other. It’s not like that. These are just excuses. You may also have heard something like “but if the data is good, why does the price drop?”. Simply because in the financial markets prices are driven by expectations. That is, the price at which an asset is quoted includes what is expected of that asset in the future. So that’s why when you publish a piece of information that you assume is good, some institutional investors had already taken it into account and even though it would be even better.
You have to have a micro mindset (each operation counts) and a macro mindset (what is really important in the long term and its consequences). So if you play a card with a piece of information or a piece of news, you’re sending the macro to take it for granted. Keep this in mind or you’ll learn it by taking out your wallet and burning accounts.
New Is Not the Solution (or Problem)
Why, instead of focusing on speculation or news, don’t you focus on what you have objectively? That is data-based trading systems. When investing in the long term it makes sense to read and soak up some company and industry news. But by trading, we look for short-term moves. Do you really think you can from home predict a story that is public in a market as big as the currency market?
What you could do is concentrate on creating systems that have a positive statistical advantage and apply them rigorously. If it’s the news and it works well, great. But don’t get obsessed with the idea that news is the origin of everything. Focus on what you can control.
All this being said, in my case what I do is I keep in mind the news to keep in mind the moments where the market can move aggressively. If there is a moment (very punctual) where a lot of news (very important) will be published or a weekend where there is some decision that can make the markets shake, I try to close everything and be out. But this is at very specific times, perhaps less than 1%. Most of the time I take on this volatility and adapt my systems to them.
Ignoring News In the Press
In recent months, for example, a lot of news has been published about Brexit and most of it seemed definitive. The bottom line is that a year has passed and nothing has changed. Another situation: Trump’s ongoing tweets. You can’t predict that. Face it. It’s part of the equation of trading. And it also makes it different.
The press always has a good headline to justify what is happening. For example, after an event, the EUR/USD pair goes up. You can read or listen in some media: “The EUR/USD crossing goes up despite the measures of the European Central Bank.” However, if after that same event the pair falls you can read something like: “The EUR/USD crossing drops due to the measures of the European Central Bank.”
It’s kind of like knowing the end and creating an argument that makes sense to get to that end. We as traders are interested in the behavior in the price market, the rest is just noise that gives us little good. This is another of the big arguments why I trade through systems, they don’t get carried away by this kind of thing.
The Economic News Calendar, also known as the calendar of economic events, plays an important role in the life of every trader and investor in the world, whether this is a minor trader who speculates with a personal account or an operator trading as part of an institutional trading network (institutional operators). An economic calendar […]
The Economic News Calendar, also known as the calendar of economic events, plays an important role in the life of every trader and investor in the world, whether this is a minor trader who speculates with a personal account or an operator trading as part of an institutional trading network (institutional operators). An economic calendar […]
The Economic News Calendar, also known as the calendar of economic events, plays an important role in the life of every trader and investor in the world, whether this is a minor trader who speculates with a personal account or an operator trading as part of an institutional trading network (institutional operators). An economic calendar is a tool that shows the fundamental events that affect the trading environment of financial markets.
In financial markets like Forex, there are certain announcements that are made with some frequency that highlight very important events in the socio-political and economic world. These announcements come from government agencies, central banks, private organisations, lobbyists and others, and can sometimes serve as reference points on which economic policies are based and strategic movements are made in the business and political landscape.
For example, the onset of the global financial crisis led Governments around the world to respond in a political manner in accordance with how their countries and Governments were affected by the events from 2008 to 2010. In the eurozone, the sovereign debt crisis has boosted the change of governments, the implementation of economic policies and decisions. In the United States, we saw the birth of the Asset Rescue Program in Trouble (TARP), several major bailouts, and the easing policies of the Federal Reserve Bank. Several of these decisions were made around the world, changing the aspect of the calendar of economic news as we know it, forever.
The globalized nature of the world today means that these announcements directly affect the global economy, with far-reaching effects on how we live our lives and how future events will shape our future. Financial market operators have had to come to understand how these announcements affect the investment climate in a country, region, or global markets, and depending on the content and tone of these economic announcements, positive or negative sentiment in a currency, market or economy can develop. This in turn leads investors to operate in different markets in a certain way, as a result of the volatility that occurs. These ads are known as market news.
Market news is not published randomly but is published according to a well-planned month-to-month calendar, in a full-year cycle. This economic news publishing program is what is known as the economic calendar. For Forex traders, it is also known as the Forex calendar or Forex news calendar, because most of the news it shows has an immediate and direct (and sometimes lasting) impact on the currency market. Indeed, the economic calendar affects all markets, although the degree of affectation varies.
Components of the Economic Calendar
What is the Economic News Calendar made of? What is in this tool that traders need to consider? Here is a detailed description of the specific components of the Economic Calendar:
The date and time of publication of each economic news item included in the calendar. In this case, the operator can clearly see the exact time when the news will be released, which usually appears in Eastern United States time by default. Some economic calendars have tools that allow the operator to change time settings to match their local time. However, the global standard of reference is eastern time in the United States. Therefore, the operator needs to know how far from the Eastern Time Zone of the United States its own time zone is, in order to know the moments of the day when it must be attentive to the markets.
The economic news itself. Logically the trader should know what is economic news to be published and with which he is trying to act accordingly.
Below is a nice video created by Trading 212 regarding Economic Calendars…
In the case of Forex, the currency of the country of origin of each news item. This is the currency that is usually affected by the news, and therefore traders will be on the lookout for the currency pairs in question to see which pairs present the greatest trading opportunities. Usually, the ISO abbreviation of the currency will be displayed, or the flag of the country with the affected currency will be displayed.
The degree of impact on the market of the publication of the news. This is an indication of how strong the impact of the news can be on markets, measured by the degree of market volatility and the range of price movements. News on an economic calendar is classified into low-impact (green), medium-impact (amber), and high-impact (red) economic news. Some calendars will use the colour codes next to the news, while others may use stars (*) to indicate the degree of impact on the market so that the highest-impact news has a 5-star rating (*****) and low-impact news has two stars or even a single star.
Some economic calendar providers will display a «Detail» box. Operators can click here for more information on a particular news item, as well as the impact on the market in case there are higher than expected or lower than expected numbers.
Economic calendars usually show the previous value, expected value, present value, and revised value of each economic news item. This is where traders can get information about the benchmarks for each data and the actual numbers of the news as it arrives. Some providers provide a historical chart or template that shows the performance of a particular story in recent months or years for comparative analysis.
Sources of Economic News Calendars
The economic calendar can be obtained for free on the websites of almost every major Forex broker. There are also other external providers that can be useful. It is up to each trader to search the websites of Forex brokers, online market analysis sites, online forums related to markets, and analysis service providers to find a good economic calendar that offers complete and up-to-date information. Different economic calendar providers can add certain features that will make their calendar versions more attractive. This does not affect the dates and times of publication of each news item.
How to use the Economic Calendar?
Now that we know what the content of the economic calendar is, it is essential to understand how to use it correctly. While there are no strict rules on the use of economic calendars, here’s a guide on how this tool can be used to trade in markets like Forex.
Rule 1: Always study the news program on the economic calendar in a block of time of an allowance, and do this for the following month in advance. This is so that the trader can take note of the high-impact news and the dates and times on which this news is scheduled for publication. This allows you to plan your operations accordingly, so that you do not have open positions that may be negatively affected by the publication of the news, eliminating its gains or significantly increasing the unrealised losses of losing trades. It is impressive how many traders simply ignore this simple fact, at their own risk.
Rule 2: Use world time tools (showing the current time in any time zone) available in the search engines to know the time difference between the local time and the time shown in the economic calendar. This will allow you to adjust your time settings accordingly. This will help you not to miss the negotiation opportunities that will bring particular economic news.
Rule 3: Use historical data to study how a particular story affects markets. If you want to know what is the way in which a currency pair or index will react to the publication of a certain economic news item (as an important economic indicator), then the most appropriate response might be to study your past behavior using historical data and graphs. This will prevent a trader from setting a profit goal of say 100 pips, for a story that will only move the market around 50 pips, for example. It will also help to know whether an individual economic news item is unstable.
Rule 4: Trading only with high-impact news is recommended, as these are the events that move markets and create the volatility needed to produce good trading opportunities. Low-impact economic news does not create enough volatility, and therefore is not suitable for high-profit markets because it generates small-scale movements.
Rule 5: Use calendars that have automatic update tools that add the current numbers to the calendar at the time the news is published. This will help you closely monitor your operations.
Conclusion
In summary, we can conclude that an economic calendar is an important tool for traders in all financial markets. It must be used in a complete and correct manner so that operators can derive the maximum benefits from the information it provides. Sometimes an operator may have to combine two or three calendars in order to get everything they want from an economic calendar, as some may have additional features and have shortcomings in other respects.
Trading is mainly based on planning. Knowing the economic calendar well in advance can help the trader to plan his operations in such a way that he does not end up trapped in some of the surprises that may occur during economic news publications.
Also, note that the market is constantly evolving. Some economic news that was low-impact a few years ago has become more important to markets and has a high impact due to the emergence of new sectors that are now engines of the global economy. An example of this is housing data in the United States. Before 2006, some of the housing sector indicators were not very important, but as the subprime mortgage crisis was identified as the main cause behind the global financial crisis, US housing data has become a highly monitored economic news item.
Finally, the trader should be aware of adding new economic news and removing some that are irrelevant and even archaic. Some of this news can be highly impacted, such as the JOLTS employment report from the United States, which was born out of the labor sector crisis in that nation.
With all the warning signs that you got all over the place about trading, the little notices that say things like “Risk Warning: CFDs are complex instruments and come with a high risk of losing money rapidly due to leverage. 77% of retail investor accounts lose money when trading CFDs with IC Markets (EU) Ltd. […]
With all the warning signs that you got all over the place about trading, the little notices that say things like “Risk Warning: CFDs are complex instruments and come with a high risk of losing money rapidly due to leverage. 77% of retail investor accounts lose money when trading CFDs with IC Markets (EU) Ltd. […]
With all the warning signs that you got all over the place about trading, the little notices that say things like “Risk Warning: CFDs are complex instruments and come with a high risk of losing money rapidly due to leverage. 77% of retail investor accounts lose money when trading CFDs with IC Markets (EU) Ltd. You should consider whether you understand how CFDs work and whether you can afford to take the high risk of losing your money.” You would think that trading would be pretty hard wouldn’t you? Well, the truth of the matter is that trading forex is simply not that difficult, at least not as difficult as you may think it is.
That is quite a bold thing to say, considering so many people have lost money. In fact, a lot of people have lost everything that they own due to trading, but is that because it is hard? Or is it due to the fact that there may have been some flaws in their plans, or even in their own personality which has caused them to lose, or maybe it was simply the unfortunate event where they signed up with a scammy broker or apparent account manager. Whatever the reason was, there are things that you can do to prevent these losses and ultimately make forex trading a lot simpler and dare we say it, easier.
The concept behind trading is simple, we are taking one currency, converting it to another, and then converting it back once the price of the currencies has changed. If they change in the right direction then we profit, if they change in the wrong direction then we lose. That is the very basic concept of trading and why it is fundamentally very easy to do. All you need to get started is a broker, of which there are thousands, a little money, some brokers allow you to trade from as little as $10, and an internet connection. You can then use your phone or computer to load up an application and start trading, that is as easy as it is to start trading.
So if it is so easy, why do so many people fail and lose money? The simple fact is that they did something wrong, it was not the markets that did anything wrong, they work how they work. It is up to use to analyse and work out what it is that they will be doing, something that a lot of these losing traders did not do due to either a lack of knowledge or simply not being bothered and wanting some quick profits. Trading and forex are not rich quick schemes, even though it is described like this in various places. It is a methodical, long-term endeavor that takes patience and understanding.
Forex is all about creating a plan and then sticking to it, if you are able to do this then there is a good chance that you could end up being a successful and profitable trader. When we start trading we always need to create a trading plan, this plan then includes a number of different things like our strategy and our risk management plans. These things combined make it so that trading can become a lot simpler, it can be a lot more straightforward and more importantly, it can become a lot easier.
Your trading plan should involve creating your strategy. It is important to understand that you need to develop a good understanding of your strategy. Simply having one is not good enough, you need to understand how it works and also why it works. Doing this will enable you to adapt things should the market conditions change, and they will change, regularly. Being able to adapt will mean that you are able to maintain your profitability and also keep risks low in multiple different trading conditions, something that a lot of new traders fail and so end up losing out.
The other and arguably the most important thing that you need to have in place in order to make trading more successful and easier is our risk management plan. This will set out the different aspects of you trading that is to do with risk Your risk to reward ratio will detail how much you will risk on each trade and how much you are aiming to profit. With this being a positive ratio, 3:1 as an example, you only need to be right 33% of the time in order to be profitable, something that is much more achievable than some people who try and be right 80% of the time. This risk management plan will also detail things such as where you will be putting your stop losses. Trading without a stop-loss, putting extra risk on your account, is not something you want to be doing at all.
Another tip for making trading easier is to keep a trading journal. This journal is somewhere that you will be writing down pretty much everything that you do. It is a little tedious and a little boring, but it is vital and doing it gives you access to a whole lot of information that is beneficial to you. You are able to use what you have written down to analyse your own trading, to find out what you are doing right and what you are doing wrong. You can then use this to try and alter your trading or your trading rules to be a little more profitable. Consistency in doing this will result in much safer and more profitable trading.
The final tip to give you is simply the fact that you need to ensure that you are not taking on any scams. There are a lot of them out there, do not take people’s word for granted and if something looks like it is going to be too good to be true, it most certainly is, so beware. Trade yourself, learn yourself and you will thank yourself for it, as you will be able to trade for years to come and will be able to adapt should you need to, not something you would be able to do if you were relying on someone else.
Trading seems very difficult from the outside, especially with all the warnings about it, but when you dig a little deeper there are things and rules set in place that are there to protect you. These are there to make things easier for you and they are there to help you to be profitable. Do not rush in, plan your trades, plan your education and things will end up being a lot easier than you may think they are.
Novice traders are often surprised to learn that when it comes to being profitable in the long run, controlling risk is as fundamental as making good trades. Position size, Risk, and money management are no less fundamental than entry strategies and trade exit strategies and must be considered scientifically and completely. If you succeed, then […]
Novice traders are often surprised to learn that when it comes to being profitable in the long run, controlling risk is as fundamental as making good trades. Position size, Risk, and money management are no less fundamental than entry strategies and trade exit strategies and must be considered scientifically and completely. If you succeed, then […]
Novice traders are often surprised to learn that when it comes to being profitable in the long run, controlling risk is as fundamental as making good trades. Position size, Risk, and money management are no less fundamental than entry strategies and trade exit strategies and must be considered scientifically and completely. If you succeed, then as long as you can maintain a trading margin (which is not so complicated, there are several well-documented trading margins), you will have a solid model to make a lot of money. You don’t need to choose spectacular trading operations to make large amounts of money, you just have to keep doing the right thing constantly, and let the magic of managing money be composed of snowballs growing from your bottom line. To get it right, start by asking the right questions.
How much money should I put into my trading account?
You have hired an account with a broker, and are ready to start trading. Just deposit some cash. How much should you put? You should be honest with yourself, and consider how much money you have that is available for wealth creation. It should not include assets such as a house or car in that calculation, or pensions: the correct question would be, how much free cash can you get in your hands, without debt, and use it to try to increase your profits? When you have this figure, you should be thinking of placing between 10% – 15% of it in something risky, like Forex Trading. You may think this is a small amount, but it really isn’t – please read on and I’ll explain why.
The risk or “Barbell”
Imagine that there are two traders, trader A, and trader B. Both have USD 10,000 in liquidity, which is all the cash that each of them can get to invest in creating wealth. After opening brokerage accounts, Trader A invests its $10,000, while Trader B invests 10% of the same amount, $1,000, while the remaining $9,000 is invested in United States-guaranteed Treasury bonds that pay a low interest rate.
Consider your respective positions. Trader A will be at a psychological disadvantage, as the account represents all the money he has, so the losses will probably be painful for him. You also need to worry about the broker, lest he files for bankruptcy and be unable to repay any of his funds back unless the broker is backed by a government deposit insurance program and obviously as we always recommend, will have to be a regulated broker.
Even then, its capital could be held back for over a year before he could get any insurance. Because of his fears, even though he knows that the best risk per trade for his trading strategy is 2% of his share account per trade (explain the issue of how to calculate later), he decides to risk less than this. He decides to risk only one-tenth of the total amount, so he will risk 0.2% of his capital on each operation.
Trader B feels much more relaxed than Trader A. She has $9,000 parked with lots of security in US Treasury bonds and has $1,000 in her new brokerage account. Even if he loses the entire account, in the end, he would have lost only 10% of his investment wealth, which would not be fatal and could be recovered. It is the collections over 20% that are challenging to recover. Trader B is psychologically more prepared for risk than Trader A. She has calculated that the ideal risk by trading for your trading strategy is 2% of the capital of your account per trade, just like Trader A, but unlike Trader A, She’s gonna risk that amount in full.
Both Trader A and Trader B will start by risking the same amount per cash transaction, $20.
Trader B, with the account under $1,000 and the $9,000 in US Treasury bonds, ends up with a total profit of $811, of which $117 is interest received at the end of the year on US Treasury bonds. Trader A, with the largest account of $10,000, ends up with a total profit of $627. Although they initially start with the same risk, if they diversify risk capital between a very conservative fixed income and a more risky investment, it pays Trader B a significant profit and gives her the peace of mind to aggressively play the risk as it should be.
How much money should I risk?
This is not a difficult question to answer if you know the average or average benefit you can objectively expect to make in each transaction and are only interested in maximizing your total long-term benefit: use a fixed fractional money management system based on the Kelly Criteria (a formula to will be explained in more detail in the next paragraph). A fixed fractional system has the risk that the same percentage amount of the value of your account in each trade, as shown in the above example of Traders A and B using 0.2% and 2%.
Fixed fractional money management has two major advantages over other strategies. First, you risk less during losing streaks, and more during winning streaks, when the effect of composition really helps to build the account. Second, it is virtually impossible to lose your entire account, as you are always risking X% of the remaining, and never everything.
The last question is, how is the size of the risk fraction calculated? The Kelly Criterion is a formula that was developed to show the maximum amount that could be risked in a trade and would maximize the long-term benefit. If you know your approximate odds for each operation, you can easily calculate the optimal amount using a Kelly Cries calculator. In the best Forex strategies, the amount advised by Kelly’s formula is typically between 2% and 4% of the capital account.
A warning: the use of the total amount suggested by Kelly is bound to result in large reductions after losing the veins. Some veteran traders, such as the prominent Ed Thorp, have suggested using half the amount suggested by a Kelly Criteria calculator. This generates 75% of the long-term benefit, but only 50% of the reduction, produced by the full Kelly criteria.
Monetary management: Part of “Holy Grail”
It’s no exaggeration to say that the main reason why traders still fail, even when they’re following the trend and getting their inputs and exits mostly right, is because they are not following the money and risk management techniques set out here in this article, as part of a global trading plan. Forget the trade result you take today and worry about the overall results of the next 200, 500, or 1000 trades you will take in your place. If you are able to make a profit of only 20% of your average risk by trade, which is feasible using a trend-tracking volatility-breaking strategy, it is totally possible to turn a few hundred into a million within a few years.
In this article what I want to tell you is one of my strategies that is working well in real life using the CAD/JPY pair. Why this pair? I have chosen this pair as an example but will show you different trading systems using different currency pairs. What is the Strategy Based On? In a […]
In this article what I want to tell you is one of my strategies that is working well in real life using the CAD/JPY pair. Why this pair? I have chosen this pair as an example but will show you different trading systems using different currency pairs. What is the Strategy Based On? In a […]
In this article what I want to tell you is one of my strategies that is working well in real life using the CAD/JPY pair. Why this pair? I have chosen this pair as an example but will show you different trading systems using different currency pairs.
What is the Strategy Based On?
In a very simple system, you will know that my systems are characterized by that. The reason is that they tend to be the ones that last the longest and the most robust. You’d be amazed to see the simple systems that exist that have been producing good results for years and years.
First of all, what I’m going to show you next is a profitable, not perfect Forex trading system. The curves without falls or volatility are left to the martingales and gurus.
1.1 Criteria for entry
We will enter the market by purchasing in the CAD/JPY pair when there is an upward turn in the Accumulation Distribution indicator and the price opens below the simple moving average of 19 periods. We will do the opposite (we will enter shorts in CAD/JPY) when the AD spin is down and the price opens above the average. As I write this article we are short on this pair indeed.
1.2 Exit criteria
We will close the position we have taken provided one of these conditions is met:
1.2.1 Output per indicator
We leave the buying position when the Williams Percent Range indicator falls below the marked level (59, you can see in the chart above). We will also close our short position when it passes this level.
1.2.2 Exit by stop or profit
If the indicator has not already given us a sign of closure, we will do so when our operation reaches the loss limit of 60 pips (stop loss) or we have reached our profit target (take profit) of 220 pips. The interesting thing here is that a winning operation compensates us for more than three losing trades since when we achieve 220 pips we can lose three out of 60 and still not have lost money.
Statistics of the System
With the well-defined rules of our trading system, let’s see how it has behaved in recent years and what the main features are. Note that this system has not been optimized.
The stability in the balance line, as its name indicates, measures how the return curve behaves. Our goal is that it is as stable as possible and that there are no abrupt drops. The closer to 100 the better, so an 81.73 is good data. In addition, it is important to note that we have a sample of 300 trades so it is a significant sample. If I show you this strategy with 40 trades and it is winning, it can be a chance. Logic tells us that the larger the sample, the more reliable will be. Remember that we seek to minimize chance and bring statistics to our advantage.
It’s very important to know that you have up to 11 consecutive losing trades, but considering that the risk-to-profit ratio is 1:3, it is acceptable. One of my favorite parameters when choosing a trading strategy is the profit factor or profit factor. A PF above 1.5 is good. This ratio tells us how much our system earns when it pays compared to how much it loses when it loses. Simply put, our system on average earns more when it wins than it loses when it loses. And we’re very interested in this.
Another star point for me within a trading system is return/drawdown. Why? Because it is a yardstick to measure what has fallen the profit curve and that profit obtained. When you do real trading you don’t only care about the return, but you care about how to get that return and try to minimize these drops. A ratio of 7.48 is more than okay.
What Can We Expect from this Strategy?
Let’s see how this strategy behaves by comparing buying and short transactions. Not bad. Both when the CAD/JPY pair has maintained a trend and when the pair has steered without a clear direction the lengths and the shorts have remained stable. Now we see those falls as they are. There are no peaks too strong and they are also kept under control.
Is It a Forever Strategy?
This strategy is not the only strategy I apply and it will not last forever. It is a strategy of a portfolio of systems that I apply in an automated way in Forex. It is a portfolio that rotates with rules of connection and disconnection of systems depending on their behavior.
You must understand that there are trading systems whose statistical advantage disappears and that you must therefore stop trading. This is nothing else that stops being profitable because a certain pattern is no longer profitable. This happens on a day-to-day basis with some businesses, with trading also happening, for example, when a large number of traders exploit a method. The advantage disappears, therefore.
Instead of applying or learning the foolproof method of trading on Forex or any other asset, learn to measure what you are going to apply before, during, and after. If you can measure, you can improve, but above all, you can make informed decisions.
Is This the Best Strategy Ever?
The goal of this article is not to remove the arsenal. But it is a system that I have been applying in real life with good results. The important thing is that you understand that a simple strategy can work very well over time, that you need data to evaluate it and criteria to manage it. And that this is all just a work plan.
If you are trying with any kind of financial market for a significant period of time, you will start testing and forming some kind of system. Then, inevitably, you will begin to focus on technical or fundamental analysis, or maybe a little of both. The perfect understanding of the difference between the two types of […]
If you are trying with any kind of financial market for a significant period of time, you will start testing and forming some kind of system. Then, inevitably, you will begin to focus on technical or fundamental analysis, or maybe a little of both. The perfect understanding of the difference between the two types of […]
If you are trying with any kind of financial market for a significant period of time, you will start testing and forming some kind of system. Then, inevitably, you will begin to focus on technical or fundamental analysis, or maybe a little of both. The perfect understanding of the difference between the two types of analysis is the most important issue you should focus on when trying to make a decision about what kind of trader you want to be.
First, a bit of a disclaimer…
No matter what type of analysis you decide to use, it can be cost-effective. However, none of these types of analysis is 100% guaranteed. The fact that you become a good analyst from a technical or fundamental point of view does not mean you will inevitably earn money. As traders, what we’re looking for is the most likely scenario, not working with certainty. The long-term look is what you should focus on, which really means that you make transactions focused on what is most likely to happen, knowing that will not always work.
Technical Analysis
Most retail traders focus on technical analysis as it can be defined with some ease. What I mean by this is that it looks for things like support, endurance, trending lines, moving average crosses, and the like. For example, a trader who is using technical analysis to trade in the markets will observe the full share price.
With technical analysis, you can get a configuration like the following:
The EUR/USD pair has been removed from the upward movement. By using your Fibonacci recoil tool, you acknowledge that we have withdrawn 50% of the maxima, which is an area in which most traders related to Fibonacci would be interested in going long. Beyond that, we have the exponential moving average of 200 days just below the candle on the daily graph, which of course shows support. Finally, the candle formed a hammer, which is also bullish.
A trading system based on a technical analysis tells the trader to prolong.
The trader based on technical analysis is paying attention to what the price does, not necessarily to what it should do. Just follow what the market tells you in terms of price, and this makes trading in financial markets a little easier. This is why you don’t have to think about many other variables other than what the price is making and whether or not it comes close to your technical configuration concept. If you choose any other factors to participate in trade, such as fundamental analysis, something we’ll get to in a moment, things can get a little more complicated.
Fundamental Analysis
The fundamental analysis focuses on economic factors and what a market “should do”. What I want to express with that is that you will take the figures and the economic announcements and try to find out where the price is going. On an equal footing, if interest rates rise in one country over another, then that currency should rebound over the other. For example, interest rates are expected to continue to rise in the United States at the same time as the ECB remains quiet for the foreseeable future. If that is the case, the EUR / USD pair should eventually fall based on interest rate spreads. There is a multitude of announcements that could be looking at, perhaps, GDP figures, employment, and, of course, the prospects for interest rates.
Ultimately, Forex tends to move in the direction of expected interest rate movements. However, there are other problems that may arise, such as geopolitical situations. For example, Brexit has wreaked havoc on the price of sterling for some time. This is because there are many doubts and not necessarily due to the prospect of the interest rate. In a sense, however, even that route will lead to interest rates, at least in the long term. The idea, of course, is that there is a lot of uncertainty about the British economy when they leave the European Union, and we do not know what they will do with EU-related trading.
The EU is, of course, the UK’s largest trading partner, so this could obviously have a significant negative effect on the UK economy. People are essentially fleeing the British pound because of fear, or the fact that they believe that the Bank of the UK will have to keep interest rates extraordinarily low as the economy slows down. In the end, even the most opaque reasons eventually lead to interest rates, although it may not necessarily be immediately apparent.
Fundamental Vs. Technical
The most typical way traders get involved in the market is a combination of both types. For example, by using Brexit as a backdrop, we know that the British pound has fought for some time. A technical trader will understand the basics of that situation and recognize that selling the British pound makes more sense in general.
They understand the fundamentals of the negative for the British pound, although they don’t get too involved with all the nuances of economic advertisements. They just know the feeling is negative. With that information, they then begin to look for patterns of the sale in chandeliers, failures in resistance, or some other type of scenario in which we break down the support as examples.
With the use of both types of analysis, although most traders using a mixture probably use technical analysis of about 80%, the reality is that it gives you a bias in which to trade with the market. After all, fundamental long-term biases determine exactly what determines the trend, while the technical analyst simply looks for signals to get involved.
There is no right way to operate in the currency market, although it must be borne in mind that technical analysis is much simpler than fundamental because, at the end of the day, fundamental analysis suggests what “should happen,” ignoring what appears on the chart. So, I think most people use a little of both to make their trading decisions.
Forex or Forex Trading is a market, also known as OTC (Over-the-counter) and is the largest market in which billions of dollars are executed daily. It’s even bigger than America’s stock markets. But given its OTC nature, no trader can really calculate the correct numbers regarding currency rotation. However, foreign exchange is in fact a […]
Forex or Forex Trading is a market, also known as OTC (Over-the-counter) and is the largest market in which billions of dollars are executed daily. It’s even bigger than America’s stock markets. But given its OTC nature, no trader can really calculate the correct numbers regarding currency rotation. However, foreign exchange is in fact a […]
Forex or Forex Trading is a market, also known as OTC (Over-the-counter) and is the largest market in which billions of dollars are executed daily. It’s even bigger than America’s stock markets. But given its OTC nature, no trader can really calculate the correct numbers regarding currency rotation. However, foreign exchange is in fact a large market and is therefore integrated by many participants. From your bank or from large specialized investment firms, foreign exchange markets always offer a piece of the action to whoever you are and wherever you are (even from home).
The basic concept of currency trading is very simple. You trade or speculate against other traders in the direction that you take a currency. Therefore, if you believe the euro will rise, you WOULD COMPARE the euro, or SELL the euro if you are convinced that the euro would fall. It is as easy as that.
Learn the Fundamentals of Currency
Before you prepare to deposit your funds and start trading there are some important points you must understand, each of which are described below.
Brokers of the Forex: To start trading with Forex, you will need to operate with the help of a foreign exchange broker. There are many currency brokers that allow you to open a forex account with just $5 dollars. The forex broker is the one who allows your purchase and sales orders and also allows you to investigate the markets (also known as technical analysis or fundamental analysis) to help you make the best decisions…and obviously allows you to deposit more funds or withdraw your benefits whenever you want.
Trading Venue: You need to have a trading platform from which you can conduct your transactions, which are then sent to the settlement broker. In addition, a trading platform is essential to enable it to carry out its technical analysis and also to view current market prices. Most retail brokers offer the MT4 trading platform (Metatrader 4), which is free. You can also open a Forex Trading demo account and practice trading with virtual money forex to gain the necessary experience before trading with real money.
Timetables of Forex Trading: While you may have heard that currency markets never sleep, you really do. Firstly, you will not be able to trade on weekends (Sundays and Saturdays). But for the other days of the week, the currency market works 24 hours a day. This is due to the fact that currency trading is global. At any time, you will always find an overlap of a new market session while closing the previous market. What time of day or what trading market session plays an important role if you are an intra-day trader or a scalper? Now that you already have an overview of Forex trading, here are some final tips to remember before you start trading for yourself.
Pips: Pip is a measure of the change in the value of a currency pair and is the fifth decimal place. For example, if EUR/USD changes from 1.31428 to 1.31429, the change is called 1Pip (1.31426 – 1.31427 = 0.00001). When you negotiate, the more pips you make, the more benefit you have. Example: Buying EUR/USD at 1.31428 and selling (or closing your trade) at 1.31528 would give you 100 Pips in earnings.
Quotations for the Reading: Forex quotes are presented at a Bid and Ask price (which vary in pips and from one broker to another). The price of the Offer is the price at which it can be bought and the Selling Price is the price that can be sold. Therefore, a EUR/USD quote would look like this 1.31428 (Bid) /1.31420 (Ask).
What is the Spread? Spread is no more than the difference between the price Bid and Ask. Therefore, in the above example, for 1.31428 / 1.31420, the spread would be 8 Pips.
What is an Asset Leverage? Leverage is the amount of capital by which you can ask your broker to expand (or increase) its trading value. Leverage is often quoted in relationships like 1:50, which means that when you trade with a leverage of 1:50, your $100 is magnified to $50,000. Leverage is very important both in terms of making more profits and risk management and therefore its operations.
What is a Batch? Much is a unit by which you conduct your trade. In financial terms, much is also known as a contract. There are pre-established lots (or contract sizes) that you can negotiate. For example, a standard batch is no more than 100,000 units (known as 1 batch).
Tables of the Reading: The ability to understand and read graphics is very essential for trading. Depending on your approach, you have the ability to choose between a line, bars, or candles and trading accordingly (for example, trading based on candle patterns).
Placing orders (How to buy and sell): In Forex trading, it is possible to buy or sell any currency pair. Most trading platforms give you this option. You buy when you think the price will rise and you sell when you think the price will fall. There is common terminology used in foreign exchange trading, which is Buy Low, Sell High; that is an important point to remember.
Types of Orders: In addition to buying and selling, another point to remember is the types of orders. There are two types of basic orders: market orders and pending orders. At the time of clicking on “Sell” or “Buy”, you are basically buying (or selling) at the current market price. On the other hand, a limited order tells the broker that he wants to buy or sell only at a certain price.
Find a Forex Broker
As mentioned, there are many Forex brokers in the market today and therefore you may feel extremely confused about how to choose the currency broker that is right for you. To summarize briefly, remember the following points when choosing a forex broker. Look for a regulated Forex broker, this is extremely important to stay away from scam situations.
See if the broker sets a minimum deposit
What is the advantage you have with a broker?
What is the minimum size of the contract you can negotiate?
Types of deposit and withdrawal, as well as terms and conditions
Trading methods allowed by the broker
Start Operating
Finally, now you have chosen a Forex broker to trade with him, it is recommended to first open a demo account or a practice account. Most Forex brokers offer unlimited demo trading accounts (but will be disabled if not used for 30 days). This is an excellent way to be familiar with foreign exchange markets and also help you understand your style of trading (scalper or intraday trading, swing trading, etc.) and approach (fundamental or technical analysis). You can look for various commercial methods and systems or you can develop yourself when you have an excellent knowledge of the technique or fundamental indicators.
Conclusion
Forex trading is one of the most dynamic and active forms of trading in financial markets. The heart of everything is the basic fluctuations in currency values that drive everything else. Learning to trade Forex and understanding foreign exchange markets can provide a good basis for trading other markets such as derivatives or equities.
Working out how to set up your risk management plan is quite a big question. In fact, there are a hell of a lot of things to think about and different aspects to implement. Due to that fact it will be impossible for us to tell you about all of them, as some are individual […]
Working out how to set up your risk management plan is quite a big question. In fact, there are a hell of a lot of things to think about and different aspects to implement. Due to that fact it will be impossible for us to tell you about all of them, as some are individual […]
Working out how to set up your risk management plan is quite a big question. In fact, there are a hell of a lot of things to think about and different aspects to implement. Due to that fact it will be impossible for us to tell you about all of them, as some are individual to each trader. We can, however, go over some of the different things to think about when it comes to your risk management plan. It is up to you how much you do, but remember, one of the keys to being a successful trader is that you have a proper risk management plan in place, to protect your trades, your accounts, and your overall capital. So let’s take a look at some of the things that we should be thinking about when we are setting up our risk management plans.
The first thing that you are going to need to do is simply gain an understanding of what trading is and how it works. There is no bigger risk than to try a trade without actually understanding how it works. So while this won’t exactly go into your risk management plan, you can’t really start to create your plan without actually understanding what it is that you are creating. Trading and forex is a never-ending learning hobby, you will be constantly learning and will never know everything, this also means that you will be constantly learning new ways to reduce risks, so be sure that you are aware of this and always willing to learn more about forex and trading.
You then need to understand how leverage works, it can be a gift but also a curse. Leverage basically allows you to trade with more capital than you have in the account, sounds fantastic, but with this increased trading power also comes increased risks. With leverage of 100:1, you can use a $1,000 account to trade the equivalent of $100,000. This enables you to increase the trade sizes that you can put on, increasing your profit potential, but these larger trade sizes also mean that you have the potential to lose far more with each trade. Ensure that you know the risk of the leverage that you are using, do not go too high, as this can cause issues depending on your strategy, we would suggest not going over 500:1 for any strategy.
You then need to get your trading plan sorted, you need to decide on a strategy that you wish to use, there are hundreds of them out there, try and find one that suits you, something that goes along with your personality. If you hate waiting then go for a shorter time frame strategy like scalping, if you do not have much time to sit at the computer then go for a longer-term one like position or swing trading. This trading plan should also act as a sort of decision-making tool for you when you wish to place a trade. To set out some rules that you need to follow, they will help you work out the right entry and exit price for you to place your trades with. When you do this, you should also keep your trading journal to detail the trades that you make to ensure that they are all in line with your strategy.
You can also set a risk to reward ratio, this is basically detailing how much you are going to risk in order to make a certain amount of money. Many people go for at least 1:3, this means that for every $1 that you risk you will want to try and make $3. For a $100 trade would potentially lose $100 but will have a potential profit of $300. This sort of strategy will mean that you can be wrong more times than right and still be in profit. It is important to set this out correctly as it can make it far easier to work out where to place stop loss and take profit levels.
We briefly mentioned them but you need to learn to use a stop loss and take profits with every single trade that you take. If you place a trade without a stop loss then you are potentially risking the entire account balance on a single trade with a risk to reward ratio of infinite losses. These are paramount to protecting your account from trades gone bad, we don’t need to explain the importance, but any sort of successful trader will be using stop losses.
Learn to control your emotions, something that you have probably heard before, but it is important when it comes to being consistent and minimising losses. Emotions such as greed and overconfidence can really hurt your trading efforts, causing you to place trades that you probably shouldn’t or placing trades that are larger than your account or risk management can take. Try to avoid using these emotions to trade with, if you feel them coming on then work out some coping mechanisms, even if that is as simple as simply walking off and going outside for a bit. If you are feeling emotional or have clouded vision, then try to avoid trading at those times.
Keep an eye out for the news, the news can cause huge movements and spikes in the market, so knowing what news events are coming up and how they may affect the markets can give you an advantage and the opportunity to get out of the markets before they happen. It is always advised that you do not trade during news events or disasters, so knowing when they are coming up (news events that are) will give you the opportunity to get out before they cause the markets to move. It is impossible to see them all coming but knowing some of them will at least be helpful.
You should also get to know the limits of your account, if you have a balance of $1,000 you will have very different limits to someone with an account of $10,000. There will be different possibilities when it comes to trade sizes and the risk management that you can do, as well as different profit potentials. This isn’t a large point, but just be aware of your limits so you do not over-trade on your account.
The final thing that you should be doing is using a demo account, every change that you make to your strategy or your plans you should demo the changes first, this ensures that you are not risking your own money on an untested change. Try the change for a period of time before you do anything else on a live account. Demo demo demo, that is the moral of the story and if you don’t there is a very good chance that your account will eventually blow.
So those are some of the things that you can do and that you should be thinking about when it comes to creating your risk management plan and policy, there are of course other things to think about, but doing at least these things will give you a good starting point for it.
I’m not here today to talk about algorithmic trading or systems or tools. I’d like to tell you something that is in the focus of traders in recent days and especially because it is an important issue because it affects the lives of many people. As you know, if it affects people’s lives it affects […]
I’m not here today to talk about algorithmic trading or systems or tools. I’d like to tell you something that is in the focus of traders in recent days and especially because it is an important issue because it affects the lives of many people. As you know, if it affects people’s lives it affects […]
I’m not here today to talk about algorithmic trading or systems or tools. I’d like to tell you something that is in the focus of traders in recent days and especially because it is an important issue because it affects the lives of many people. As you know, if it affects people’s lives it affects the economy and, of course, the currency market. But how does the forex market react in this environment? We’ll tell you…
I’m sure you’ve heard of Covid, but just in case, let’s discuss. It is a virus that we can catch through the mouth, ears, nose, and even the eyes and affects the respiratory system. Symptoms are dry throat, cough, sneezing, muscle cramps, breathing problems, high fever and can be as fatal as kidney failure leading to death.
It seems that there is a consensus and that the virus started in Wuhan (China) in about December 2019 last month and has traveled through Japan, Thailand, and now America. There are several hundred people infected and he has several deaths on his back.
How Coronavirus Impacts Markets
Understanding history will help us understand the reaction of markets in a similar case, bearing in mind that each circumstance is different from the previous one. The outbreak of the virus is reminiscent of the SARS pandemic in 2002 and 2003 that killed some 800 people, most of them from China and Hong Kong, according to World Health Organization data.
SARS had a significant impact on Asian currencies, in its rates and actions from the point where infections were officially identified by the World Health Organization in February 2003 to the peak of new daily infections.
How many times have we already warned that the markets least like fear and uncertainty? With this background, the investor keeps his portfolio and prefers to be out of the market before possible strong movements that affect him in a bad way. This leads to falls in global indices and greater volatility in the foreign exchange market.
Coronavirus and the Currency Market
To the point, Ruben. It is clear that because of the nature of the coronavirus the currencies that are most affected are the Asian ones. The Japanese yen (JPY) is acting as a refuge, as it usually does in times of economic uncertainty. That is why we can see in most crossings how it is being strengthened with respect to other currencies. The Chinese yuan (CNH) is looking very weak and in most pairs, we can see strong movements down the currency.
Also important is the Australian Dollar (AUD) which, due to its direct relationship with China, is being negatively affected. This is because of Australia’s trade relationship with China. Any signs of slowdown or risk directly affect AUD.
What to Do As a Trader
It is impossible to predict what happens with active x and establish clear rules for buying or selling in these situations. The ideal is as we always say to rely on cost-effective systems that have an advantage and management with connection and disconnection rules. Systems should be created by already contemplating data or market scenarios with high and low volatility. That being so, you should have no problem when events happen. Manage your systems as if you were a watch and adjust your risk so when the volatility is triggered it affects you as little as possible.
There are traders who prefer to stay out until everything happens, fully understandable as well. But remember that most of the time there’s going to be some event that’s going to create uncertainty for you.
You would have most likely have been told plenty of times that if you want to be good at something, you will need to practice, practice and practice. The same goes for trading, you will only become truly good at it, or more efficient at it if you put in the work and practice. The […]
You would have most likely have been told plenty of times that if you want to be good at something, you will need to practice, practice and practice. The same goes for trading, you will only become truly good at it, or more efficient at it if you put in the work and practice. The […]
You would have most likely have been told plenty of times that if you want to be good at something, you will need to practice, practice and practice. The same goes for trading, you will only become truly good at it, or more efficient at it if you put in the work and practice. The practice needs to be focused though, you need to concentrate on a specific aspect of your trading, if you are struggling with your analysis speed, then there is no point in practicing other aspects of trading. Doing these things over and over is known as deliberate practice, the idea of doing the same thing over and over so that you improve on it.
Practicing is not all about the simple thing of doing something over and over though, in order for it to be effective you also need to have some additional aspects thrown in, if you are practicing something, how are you going to work out whether or not you are doing better now than you were before? You would of course have some form of measurement, a way of seeing your progress, and a way of ensuring that you are in fact getting better at what you are doing.
If you are going for your analysis time, simply start a stopwatch before you start and then end it when you finish, this was you can see the progress, of course, this is tricky in this regard as different analysis takes different time, especially if there is more happening in the markets, so ensure that whatever way you measure it, it is recordable and has as much information that is needed to make it relevant. So when we look at the art of deliberate practice, we can break it down into three different stages:
The Act
The act is simply doing what it is that you need to do, the result of what you do doesn’t matter, it can be either successful or not successful, this does not matter. The important thing is that you tried to do it and that you tried your best. When we think about this in a trading scenario, it is simply the act of putting on trades, either in demo or in live (although if you are just starting out then we would recommend demo trades).
Feedback
One of the things that many people find hard is to give themselves some honest feedback, people often either go too nicely or too harshly on themselves. So instead you need to be able to give yourself some third-party feedback. You can still do this by yourself, but it will require you to record everything that you have done and everything that there is to know about each action that you have taken. This will then allow you to look back at it from a new point of view to see what has gone wrong and what has gone well. Keeping a trading journal is perfect for this.
Incorporation
The third stage of trading is the incorporation of the information you have received. This is where you need to look at the feedback that you received and then put it into action. If there is something that is constantly going wrong, then stop doing it, look at what it is and adjust it to hopefully be more successful. If you do this with a new aspect every single day then you will be slowly changing your routines and your trading habits to be better suited and more successful. Constantly going through the three cycles will keep the improvements coming through this form of practice.
Those are the three stages of deliberate practice, but we need to remember that it doesn’t always start out easy, trading and this form of practice get easier and quicker the more you do it. When you first start out you will be pretty slow, working out what to write down and then working out what it actually means. The more that you do it though, the better you will be at it and the quicker the entire process becomes.
There are however things that people do, and do quite a lot which can hamper the progress of this form of deliberate trading, so let’s take a little look at what they are, remember, these are things that you need to try and avoid as much as you can, as they will only end up setting you back.
Mindlessness
The act of deliberate trading as we discussed above is all about repeating a certain action with the mind that you will be improving it. The problem comes from that old saying of doing something for 10,000 hours and you will be an expert. Unfortunately, this is not the case. If you are simply doing something over and over without understanding why you are doing it, or mindfully recording what you’re doing, then the work that you are putting in is pretty much useless. Simply repeating something does not mean progress, you need to have a focus on the errors and then rectify them, not simply doing it over and over again.
Inconsistency
Being consistent is important, at the start of the process you need to be consistent in order to properly work out where the weak spots are and what it is that you need to improve. Once you are past that initial stage then consistency is important in order to ensure that you are constantly doing the right thing and that you will not end up falling back into the bad habits which were causing the issues in the first place. Track errors, change them, and then keep them changed.
Not Tracking Progress
You need to be tracking your progress and what it is that you are doing. This cannot be said enough as even when not doing this form of practicing, you should be tracking what it is that you are doing. If you aren’t doing this, how are you going to know whether or not you have made any progress? The simple answer is that you won’t. We understand that it takes up time and that it can be boring, but it is so vital that you do it that if you manage to forget, it makes the entire process completely pointless and a waste of time. So set up a trading journal, you will thank yourself in the long run, as there are very very few successful traders without one.
Pride
Pride can be a good thing, being proud of the work that you do is always good, but you don’t want to let it take over. If you do, then it can cause you to simply stop improving If you are too proud of your work, why would you need to improve it? It’s already perfect. If you have this mentality then your progress will simply stop and you will just keep on doing exactly what it is that you are doing. So don’t hold onto things too much and remember that anything may need changing at some point, just be open and ready when it needs to be changed.
Have you been practicing or do you plan on doing it? Just remember to always be open to changes, record what it is that you are doing and you will be able to improve on your overall trading. Practice can be fantastic too, so as long as you understand why you are doing it and not simply aimlessly doing something over and over again.
In this article, I will present a practical guide with the 3 key points to achieve financial freedom. This means that someone who does not follow these premises will not be able to reach it, but the odds of becoming financially independent are much higher considering everything I am going to tell you next. What […]
In this article, I will present a practical guide with the 3 key points to achieve financial freedom. This means that someone who does not follow these premises will not be able to reach it, but the odds of becoming financially independent are much higher considering everything I am going to tell you next. What […]
In this article, I will present a practical guide with the 3 key points to achieve financial freedom. This means that someone who does not follow these premises will not be able to reach it, but the odds of becoming financially independent are much higher considering everything I am going to tell you next.
What is Financial Freedom?
Financial freedom is to be able to spend your time in the way you prefer, whenever he receives a regular income that allows you to live well by bearing all your expenses without having to work to get a salary. That is, to invest money in certain assets until they generate a higher income than our expenses. That’s what we call financial freedom. This sounds very nice, and it’s also very easy to say, but we know it’s hard to get. Although not impossible…
Normally, people have a job, to which we dedicate about 40 hours a week or so, and for which we receive a salary that allows us to live. In this situation, it seems a utopia to be able to generate revenue on a regular basis without the need to exchange our time for money, but believe me, it is possible.
Why Should Financial Freedom Be Achieved?
It’s not an obligation. If you are completely happy working 8 hours a day and you would not like to do anything else during those 8 hours more than your tasks at work, and you think you will be able to continue working in the same until 65 years (minimum), you’re probably not interested in financial freedom.
Now, imagine that every month you were given an amount of money that allowed you to live well without the need to go to work. In that case, we can say that we are free financially, so if really what we want at that time is to work… Great!
The Fundamental Requirement for Financial Freedom
Most importantly, bearing in mind that if we do not meet this requirement we will not be able to achieve financial independence:
Have a powerful reason.
That is, to have a motivation that allows us to be constant until achieving our goal. It is very difficult to make a habit of any new behavior that we want to implement. On many occasions, if you have not yet reached financial freedom with your current habits, it will be necessary to develop new habits that allow you to reach them.
And if it is sometimes difficult to establish simple habits such as going to the gym one day a week to leave a good tipín for the summer, achieving financial independence is not something that is usually achieved within a few months of establishing some habits. This process takes years, but in my opinion, the reward gained and the duration of the subsequent gratification far outweigh the effort.
The question is…
And you, what are you willing to do to achieve financial freedom? In the end, the goal is not to achieve financial independence, the goal is to be very clear why we want to have free time to decide what to do with it. Spend more time with family? Children? Travel the world? There are thousands of reasons, but you must have a very powerful one that allows you not to give up on the road until you get it. Therefore, the first essential step if we want to achieve financial freedom is to find the main motivation that makes us wake up every morning convinced that we will work to achieve our goal.
Step 1: Calculate how much money you need.
It is very important to keep track of our income and expenses. In this way, we can know if we need 600€, 1500€ or 4000€ monthly to live well with all our needs met (not only the basic ones, we also have to go out with friends, go to dinner, travel, etc.). And not only that but surely a person with 25 years can live and save money with 1000€ per month but someone with 40 years, a mortgage and 3 children will obviously need more income to live well. That is why we need to consider not only how much money we need to live well today, but also in the future, and to do so we need to see what our expenditure might be in the future.
Step 2: Start generating profitability for your money
IMPORTANT: It is impossible to achieve financial freedom without investing our money. This needs to be clear. If we don’t want to invest our capital in any assets, we will never achieve financial freedom. The alternative to exchanging our time for money is to exchange our money for more money, if we are not condemned to work 40 hours a week until we retire.
It is true that sometimes this investment can start out small, and that there are thousands of assets in which to invest (open a business, invest in real estate, invest in vending machines, invest in the stock exchange, do trading…). I will assume that throughout my career as an investor I get an average of 12% annual return. This means that if I invest 1,000,000€ I would get an annual income of 120,000€. Or if I invest 400,000€ I would get an income of 48,000€ per year (on average), or what is the same, 4,000€ per month.
And how can I get that kind of money?
Imagine that my goal is to achieve financial freedom 20 years from now. If I start with an initial capital of €20,000, and I am able to save and invest €500 per month at 12%, within 20 years I will have achieved €496,543 (with inflation of 2.5% per year).
Step 3: Don’t start It’s already costing you too much
In the example we saw above, we can see that after investing 20,000€ + 500€ monthly would be able to reach almost 500,000€ in 20 years. Do you know what would happen if I waited a year to start? If instead of starting to invest today I waited 365 days more, in 20 years would no longer have 496.543€, but 445.657€. I mean, I lost 50,000€ just to start a year later. Doing exactly the same thing, let’s be clear. And what if with my current saving capacity I am unable to achieve Financial Freedom? In that case, a number of things need to be considered.
The first, although it may sound redundant, is that we need to be able to maximize our savings capacity, and for that, there are two options: either we reduce spending, or we increase revenue (or both).
Before you tell me that it is not possible to further reduce expenses, if you really have a strong motivation to achieve financial freedom, you must be in control of what you spend your money on. Only then will you be able to rethink and see clearly whether all your expenses are justified or there is some way you think you can save more at some point. Know what you spend on clothing, food, gasoline, vehicle maintenance, insurance, loans, leisure…
And on the other hand… how do you increase income?
In the first case, if our main source of income is work, we have to think if we can materialize some task on our part that we can take to benefit the company in which we work so that a salary increase can be justified. Are you certainly being as productive as you can? Could you increase your productivity by making some changes to your work routine? Do you lose something by proposing a raise to your boss?
If you are a novice in the Forex market and you don’t know exactly what a lot on Forex is and what this is all about, in this article I will show you what it is and how to know what amount you should use or what amount in lots you should use in your […]
If you are a novice in the Forex market and you don’t know exactly what a lot on Forex is and what this is all about, in this article I will show you what it is and how to know what amount you should use or what amount in lots you should use in your […]
If you are a novice in the Forex market and you don’t know exactly what a lot on Forex is and what this is all about, in this article I will show you what it is and how to know what amount you should use or what amount in lots you should use in your case to trade on Forex.
What are Pips and Lots?
The first thing to understand is that pips and lots are two concepts in the currency market that are related when calculating gains or losses in a move that can make a quote for a currency pair.
The pips measure how much the currency varies and the lots measure how much you buy or sell from that currency crossing. That’s why the more you flow in pips and the greater what you’ve bought or sold the more it will affect your account.
When you trade in the currency market you do it as if it were in a pack. What does this really mean? A lot is 100,000 units, so if for example, you make a purchase in the pair EUR/USD of a lot, you are performing an operation worth 100,000 dollars. This type of trading can be done even with much less money in your account, as brokers offer leverage for it.
What is a Micro Lot and a Mini Lot?
You must be thinking that leverage and $100,000 doesn’t sound very good to start with. Definitely not. Therefore, it is possible to do it for the minimum possible and that is where the mini lots and micro-lots come in.
Mini lots are one-tenth of a lot, so if a lot is equal to 100,000 units, when you operate a mini lot in EUR/USD you do it for $10,000. Okay, this is something else, but what if I want to do it for less? Is it possible? Indeed, there is also the possibility of a micro lot, that is 1,000 units. Following the example above, 1,000 dollars.
How to Calculate the Value of a Forex Lot
Understood all these now I will explain how you can know the value of a lot in a currency and how it will affect your account every change that occurs in the price.
Step 1: Choose the currency pair. GBP/JPY.
Step 2: Calculate how much a pip is worth. In most cases, the pip at a crossover is the fourth decimal. In the crossings with JPY is the second (yes, I have put it on purpose for you to learn it well).
GBP/JPY is currently listed at 175,150
If GBP/JPY moves and its price goes to 175.170 there will be two pips varied (175.170 – 175.150).
How much is this variation in my account with a micro-lot?
1000 units * 0.02 = 20 yen.
Step 3: Calculation in your currency. How much does this mean if your account materialized in dollars? We just need to do a conversion by looking at the USD/JPY rate, which currently stands at 107,750. Thus, if one dollar is equivalent to 107,750 yen, 20 yen is equivalent to 0.18 euro.
That is, the change of two pips in our account implies a variation of 18 cents.
Can we give another example for the classic EUR/USD?
Step 1: we have it, EUR/USD.
Step 2: Suppose EUR/USD varies from 1.12500 to 1.2490.
We have mentioned above that in most pairs a pip supposes the minimum variation in the fourth decimal place. This is the case, a drop in the price of the pair of 10 pips or 1 pip.
If in this case, you have bought a mini lot (10,000 units):
0.0001* 10,000 =1 dollar per pip.
You’d be missing a dollar more commissions in this scenario.
Step 3: What if your account is in euros?
1/1.12500 = 0.88 euros. It would vary instead of one euro, 88 cents.
Just as we have calculated the value of one pip in this last case or two in the previous one, we can do it for 100 or 200 and so depending on the entry price and stop calculate what is the maximum you can lose or win in each operation. Easy, isn’t it?
Online Calculator
All right, Ruben. I have understood everything, but I find it a drag to have to be doing these calculations to be able to calculate the potential gains and losses in each operation. Relax, I have a solution for you, here you have a calculator where to do all this in a simple way.
Just choose the currency of account, the balance (use equity), the percentage that you are willing to risk, and stop-loss in the currency crossing you have chosen. From here the rest calculates as you will see automatically.
Commission Per Lot on Forex
You know how lots and pips work in the currency market. I have previously told you that brokers allow leverage so in Forex you will be able to move more amounts than you have in your account.
First, you should be very careful with all this talk. Leverage generates greater potential gains, but also potential losses that can end your account. Now, leveraging here in a controlled manner is another matter. Why does the broker allow you to beat yourself up and move more money than you actually have? Because he’s interested, that means more commissions for him. At times when there is more volume on the market, the more money you will receive for it. Even with all this, I have to tell you that competitive brokers allow you to move up to $100,000 by paying only $7 in commissions. The cost is relatively low for financing the operation.
I recommend that you practice all this in a demo account so that you do not have any doubts. The above calculation can help you do your calculations, but it’s OK to start doing it yourself manually and then check if it’s OK. Also, as you learn and progress my advice is that you can automate all this so there is no miscalculation. Remember that every failure here costs money.
In the end, you have already seen that this pips and lots is not at all complex, everything is in standing with attention to understanding how it works and making a couple of practical examples like these.
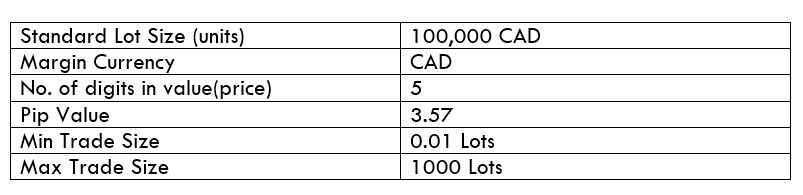
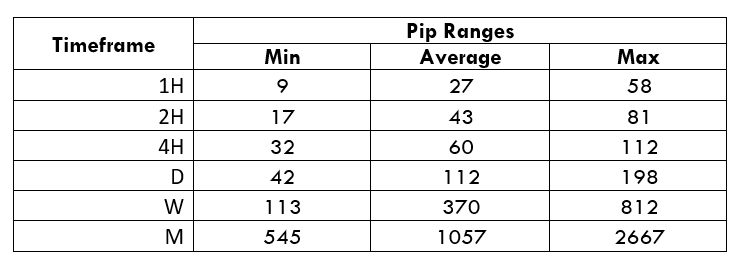
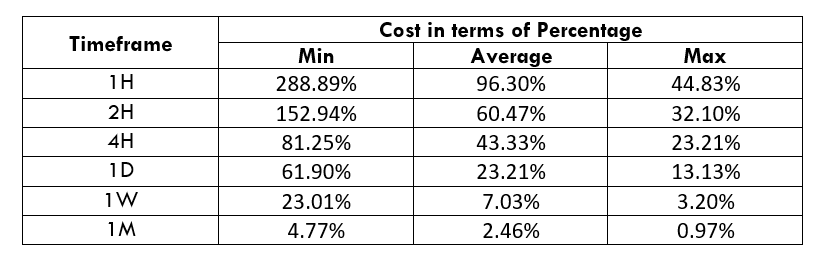
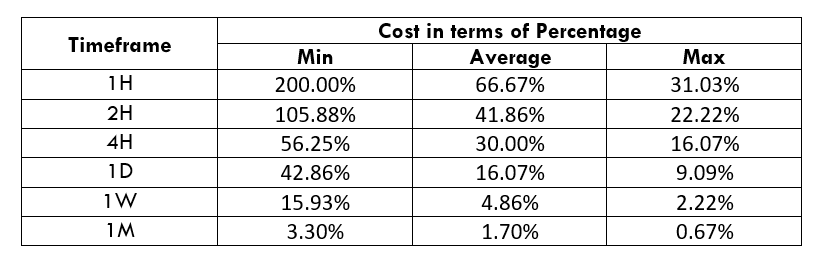
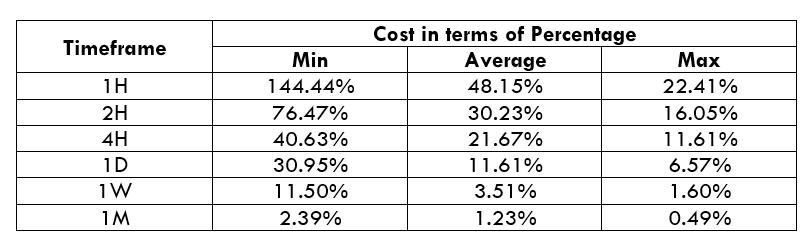

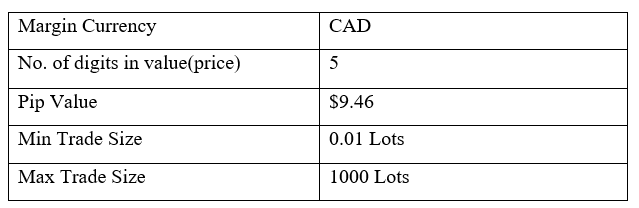
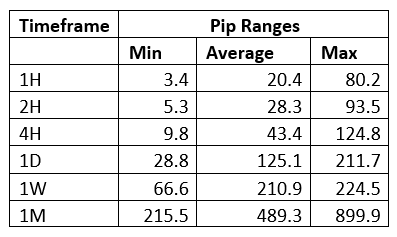
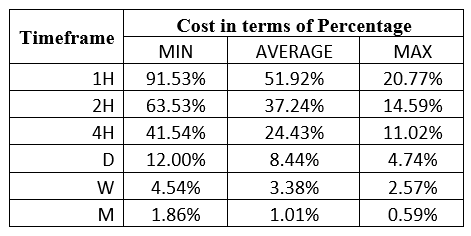
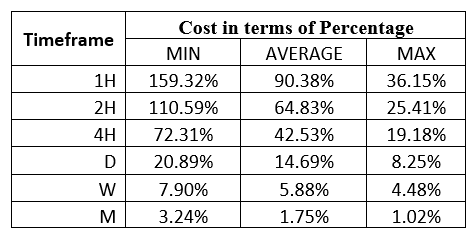
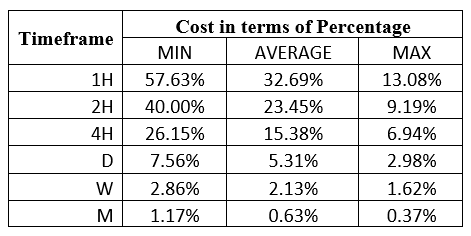

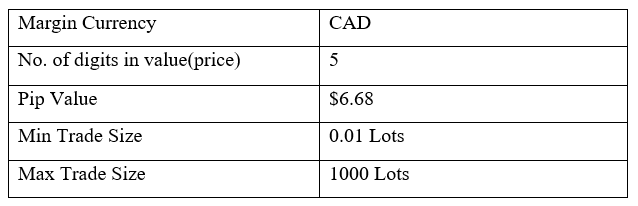
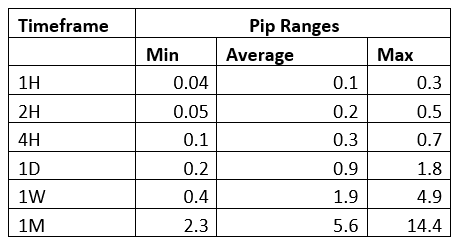
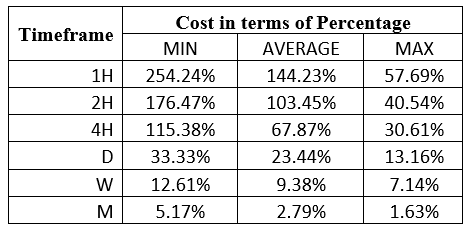
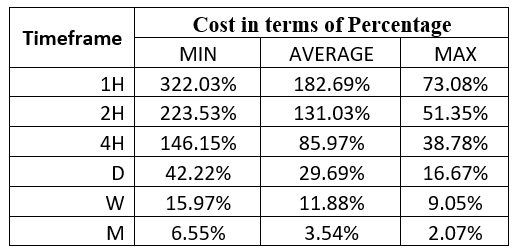
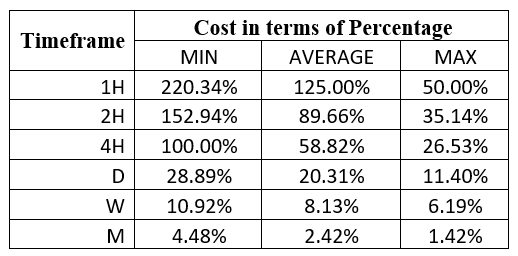

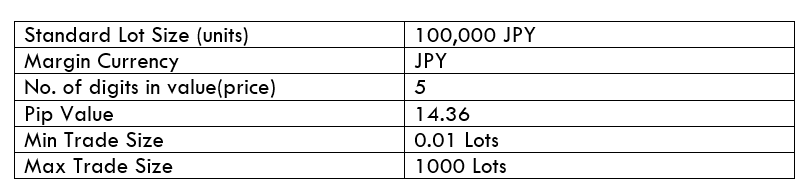
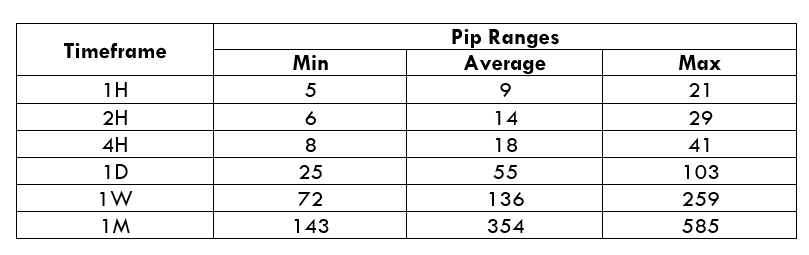
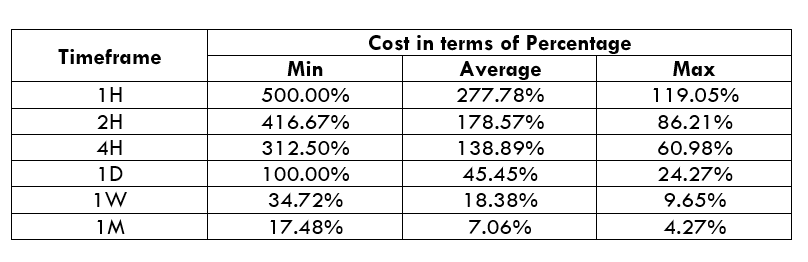
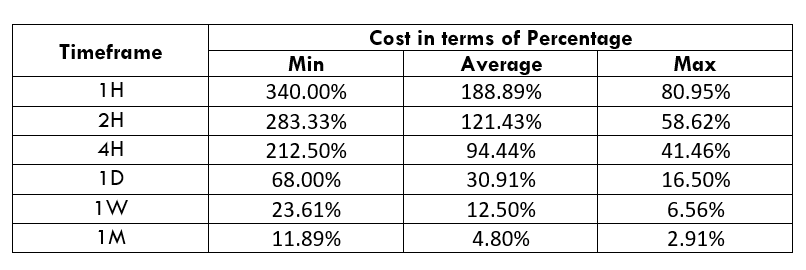
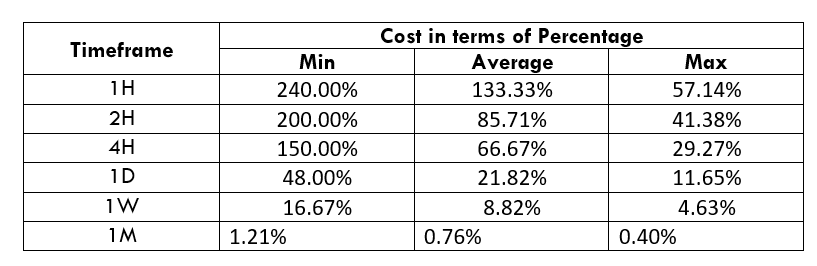
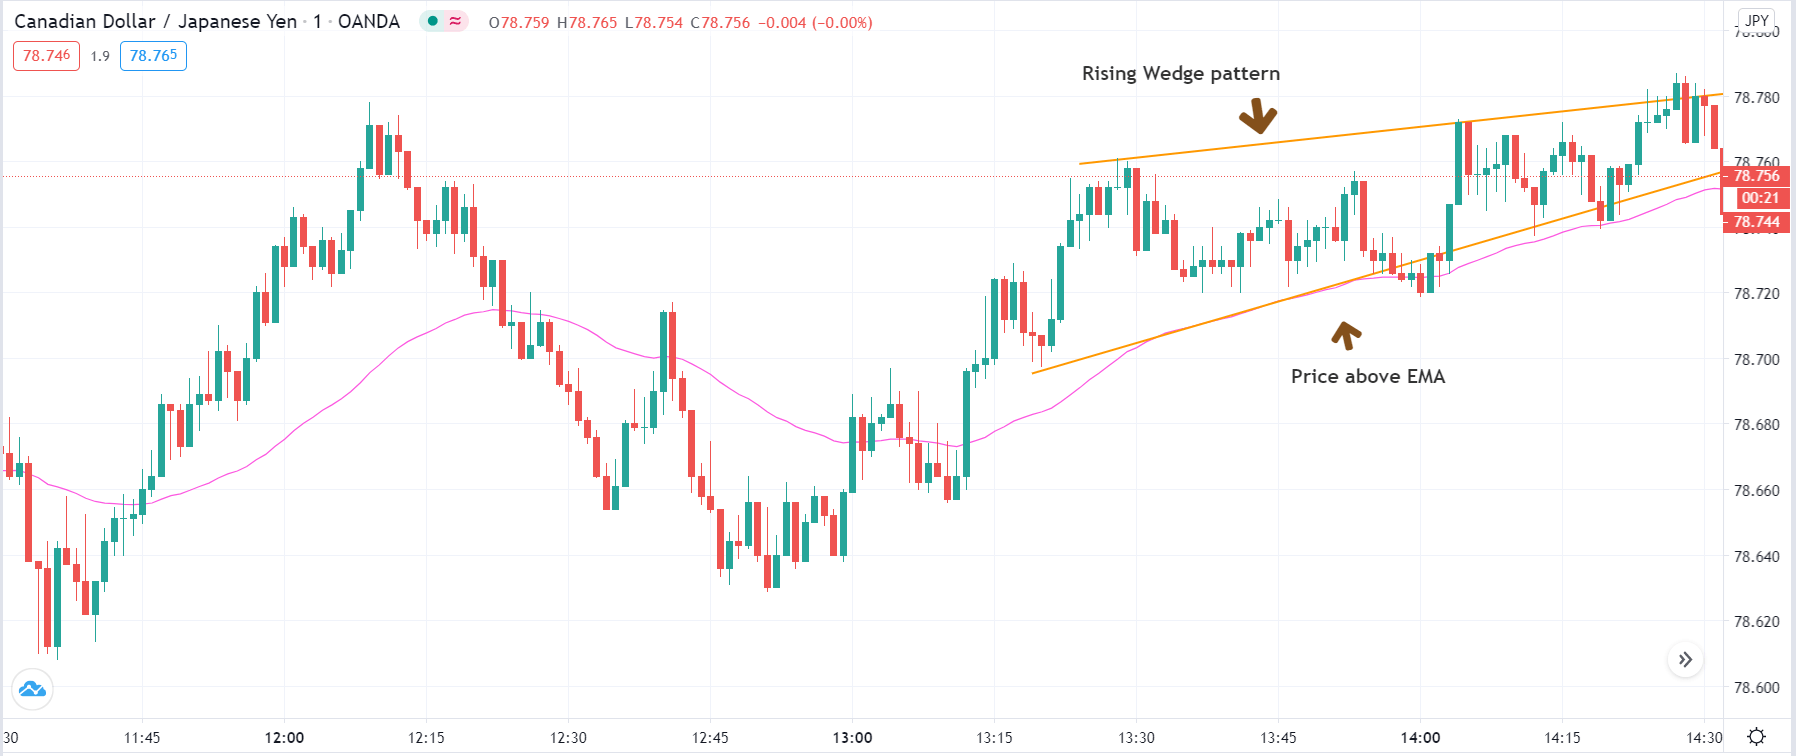
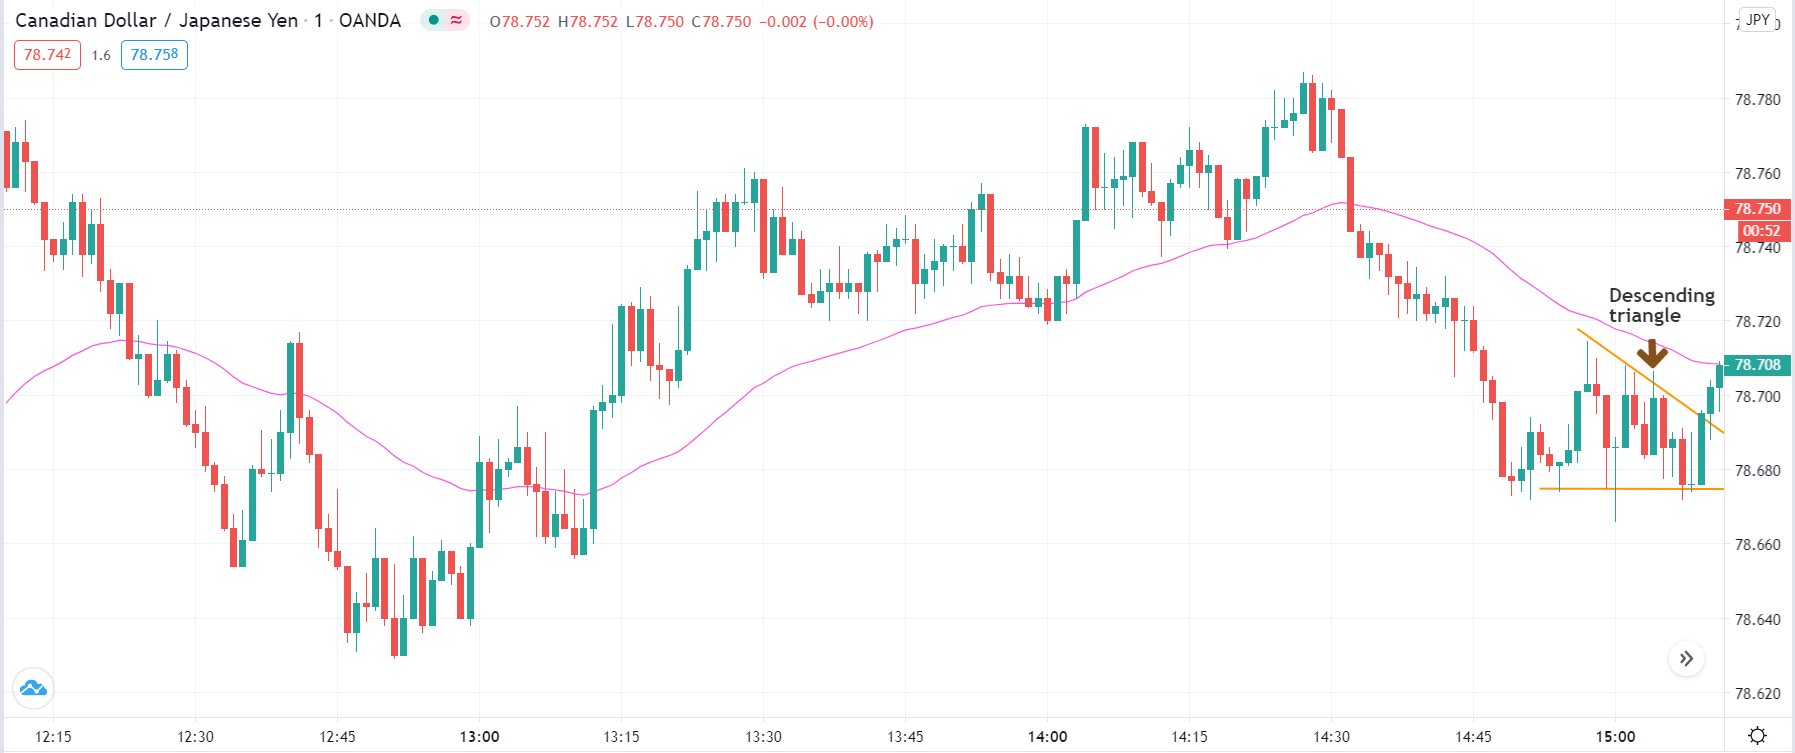
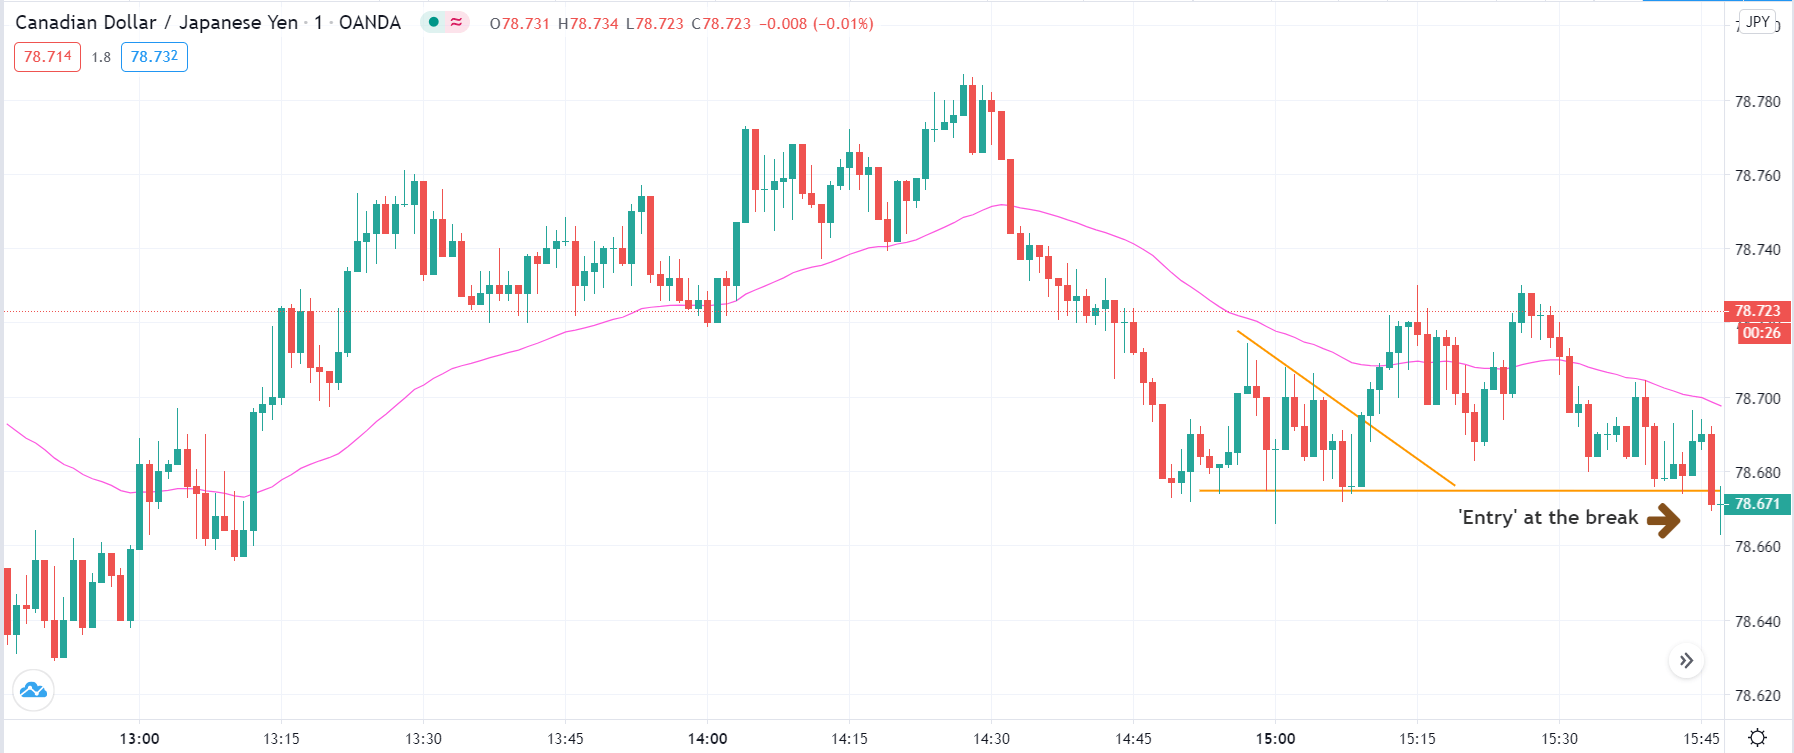
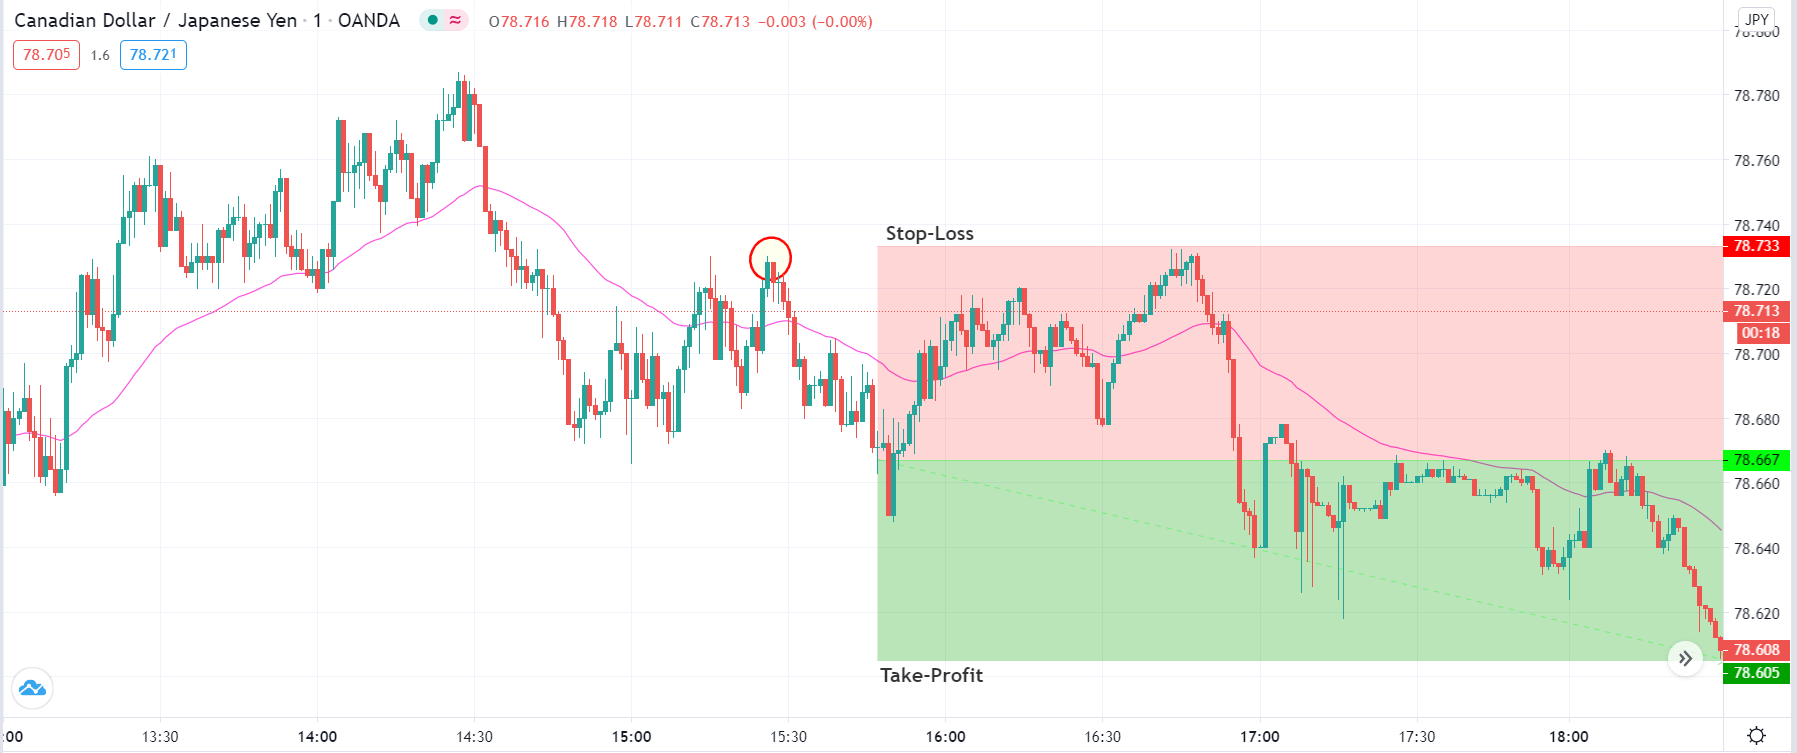
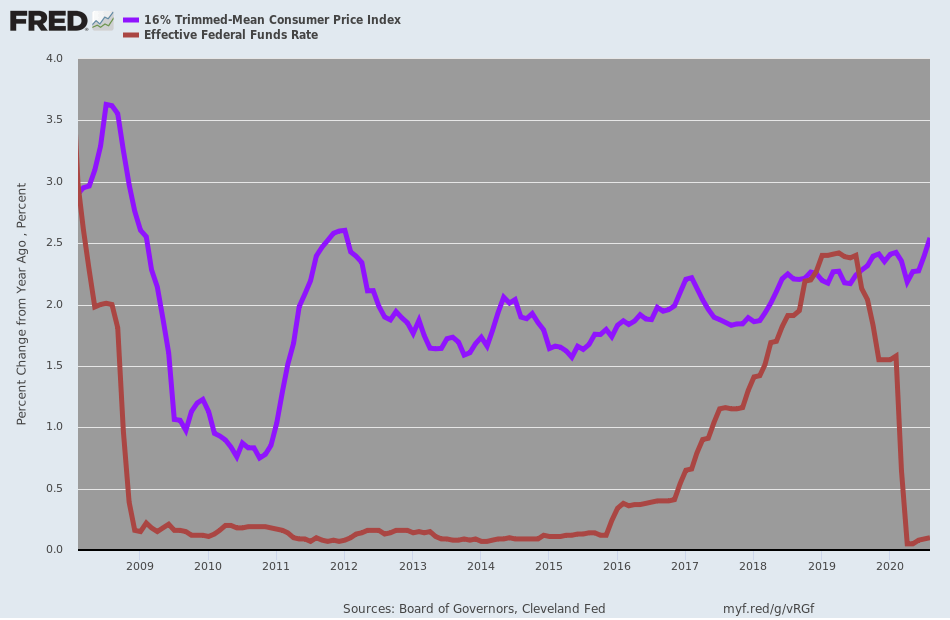
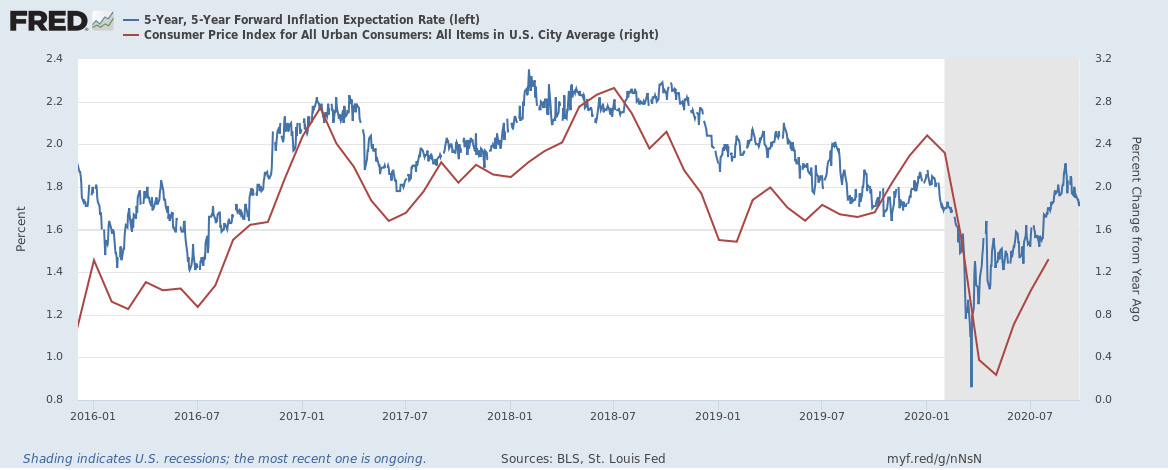

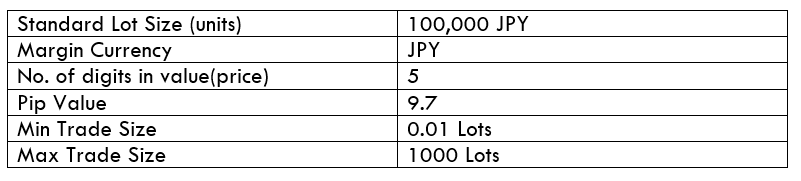
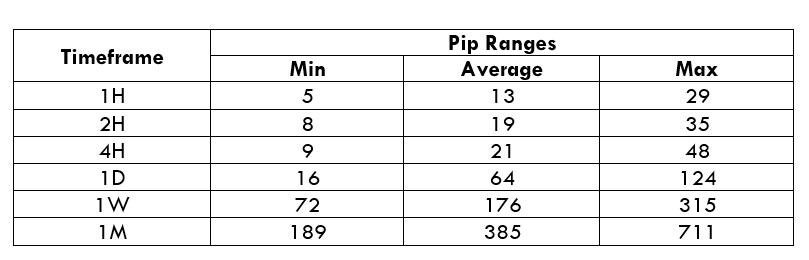
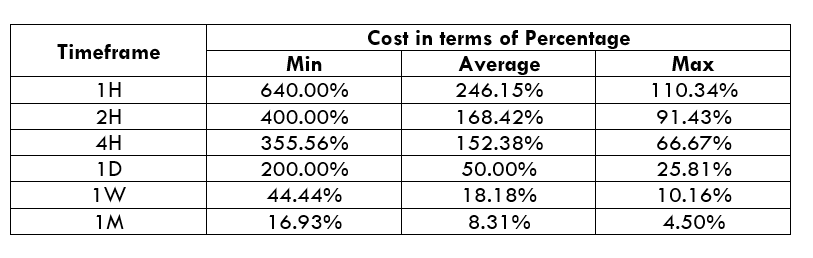
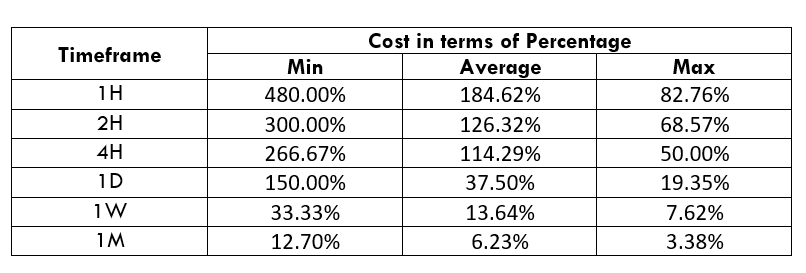
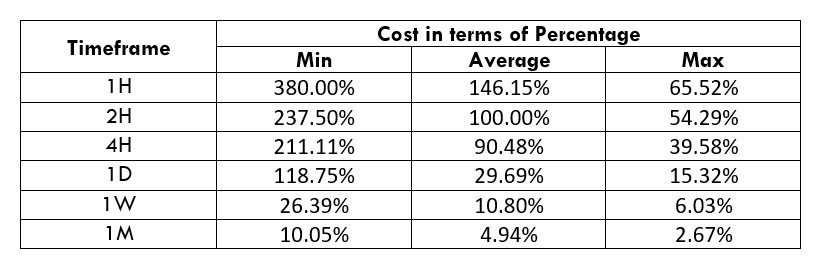

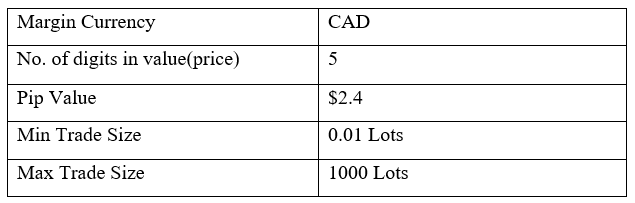
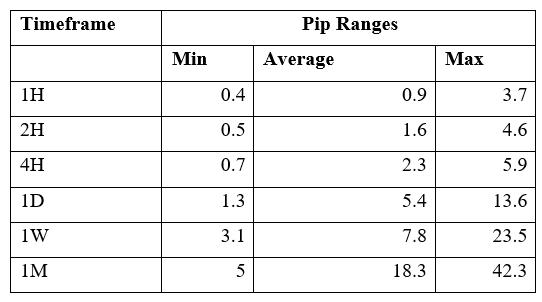
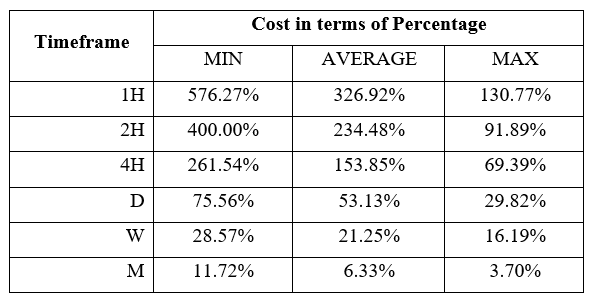
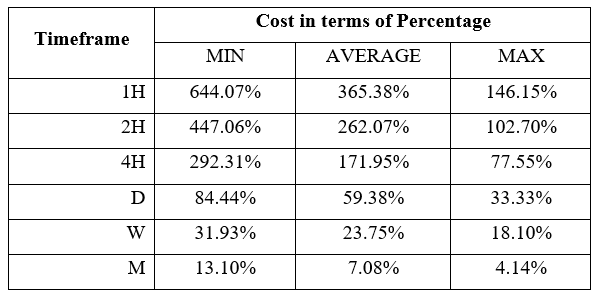
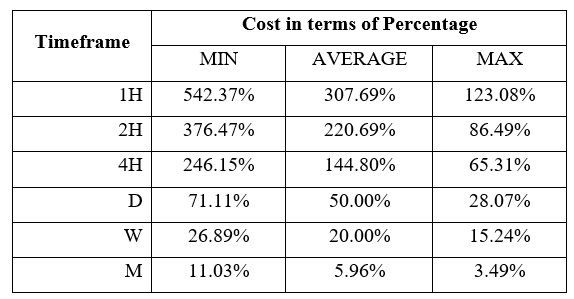
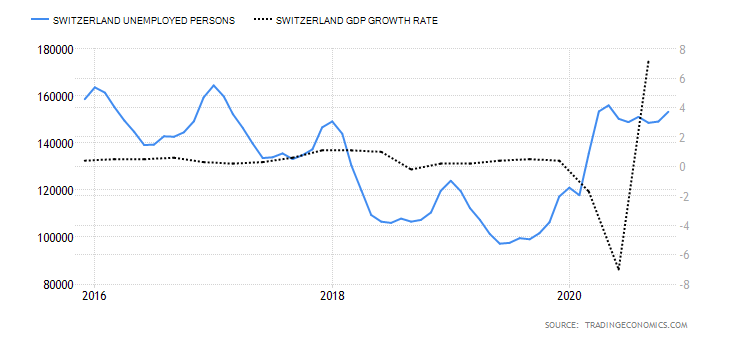
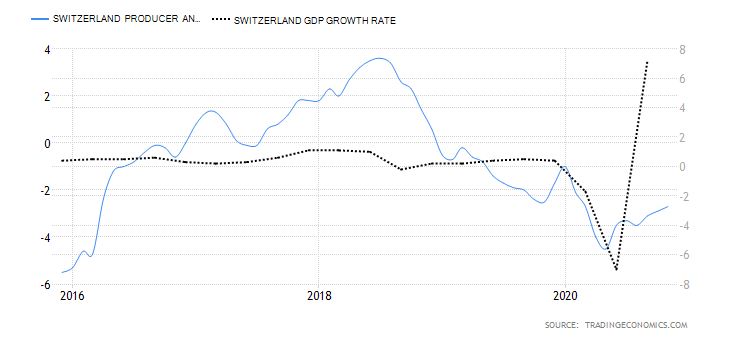
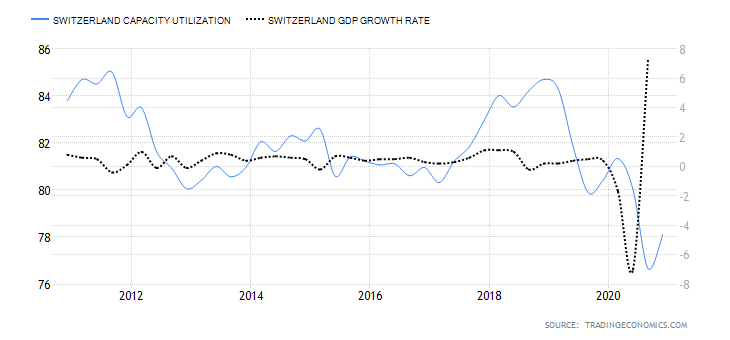
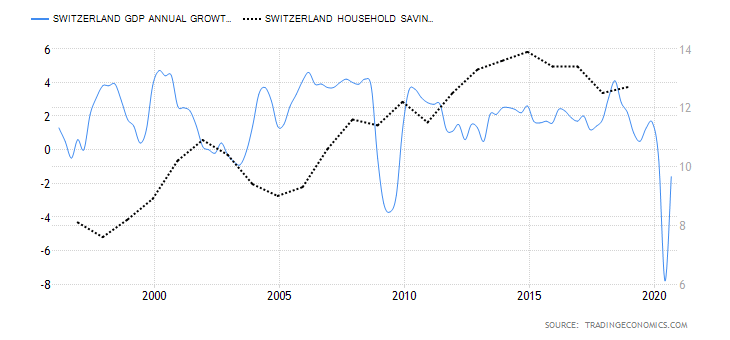
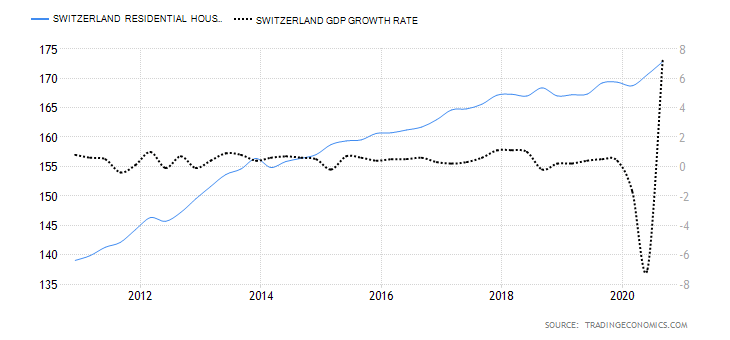
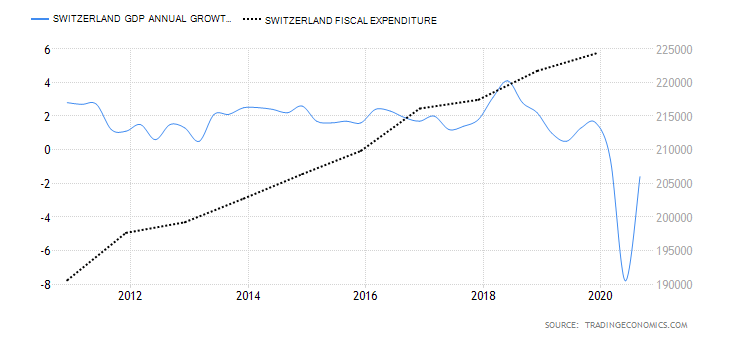
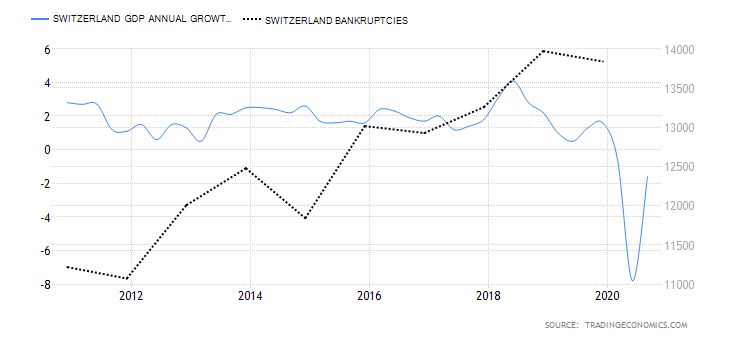
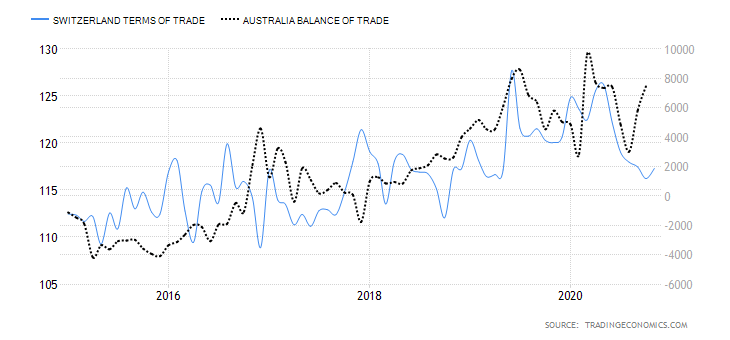
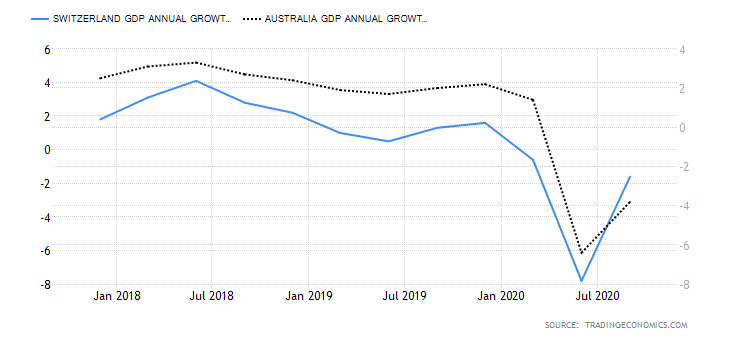
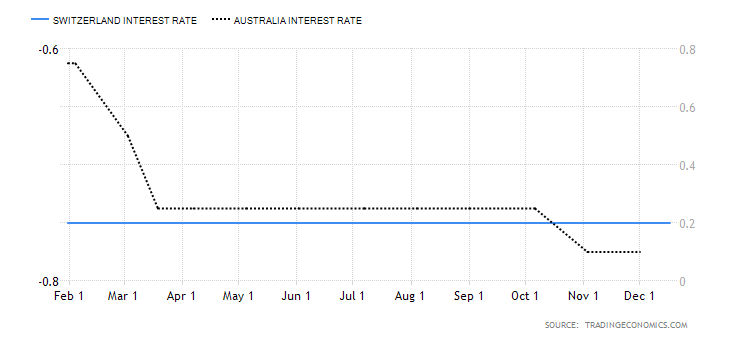
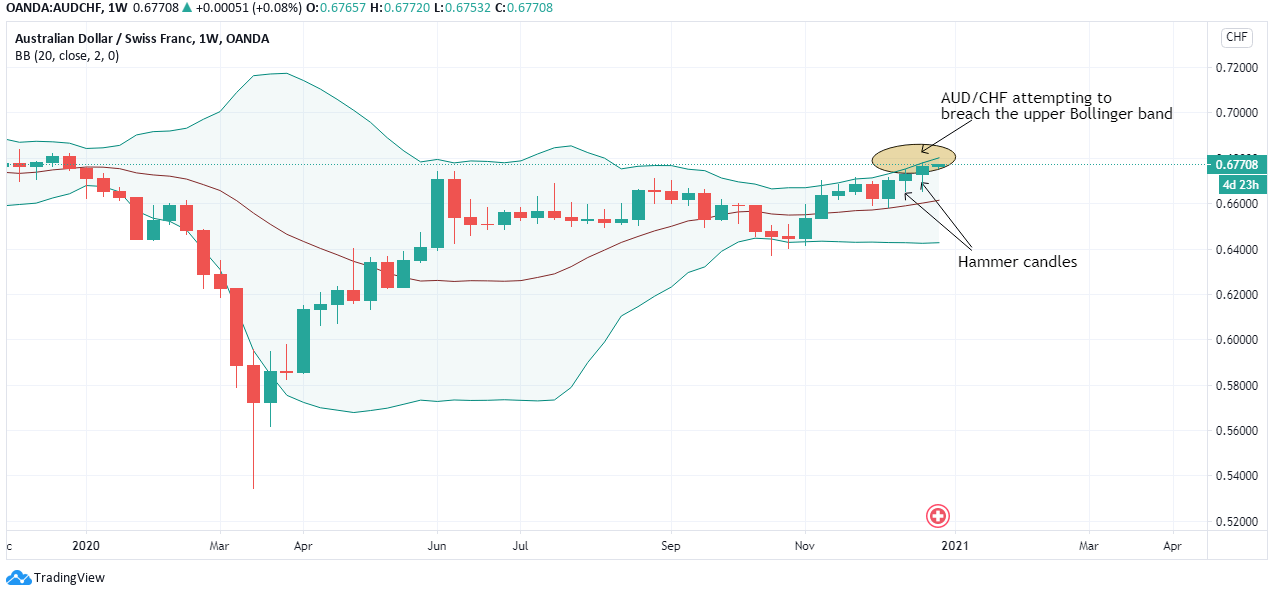

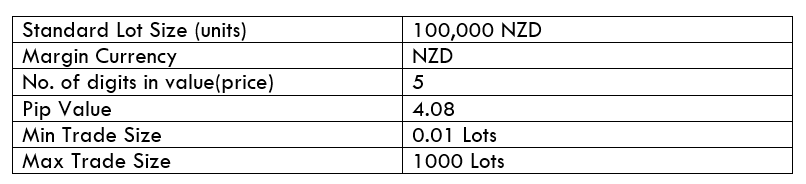
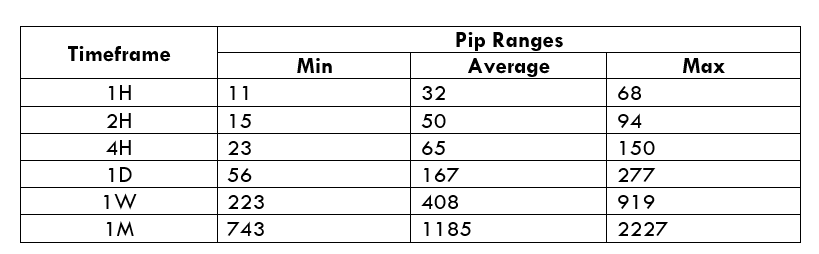
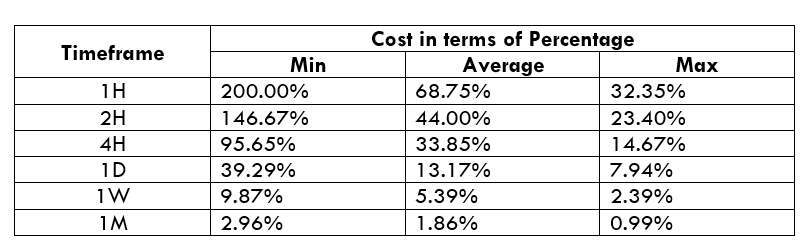

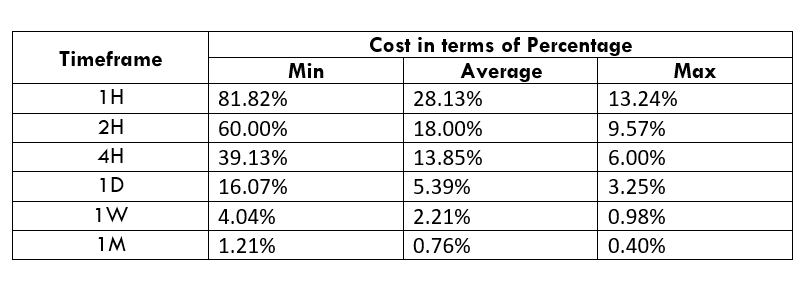
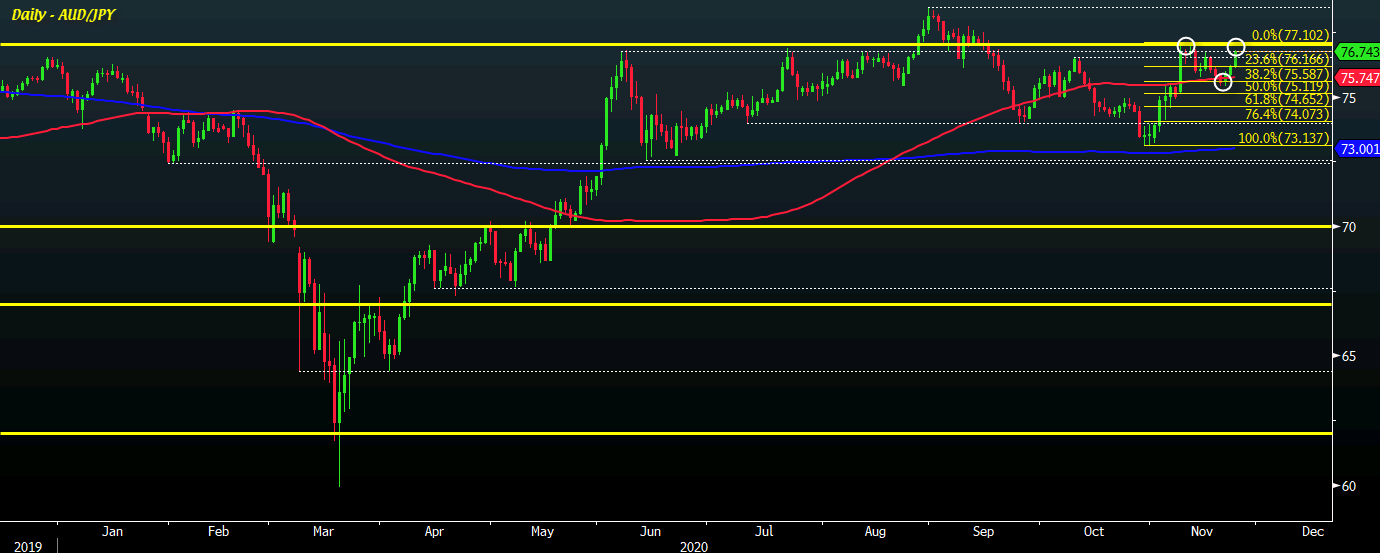
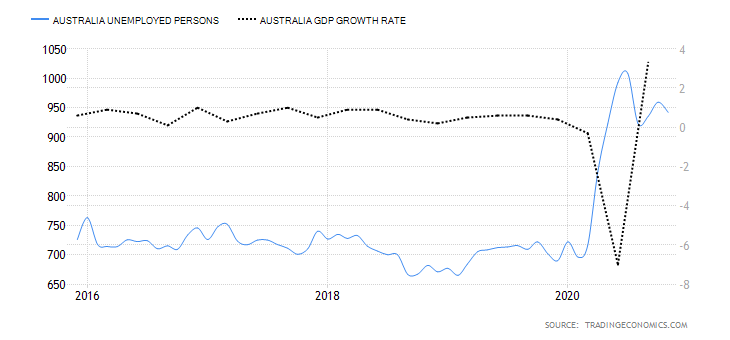
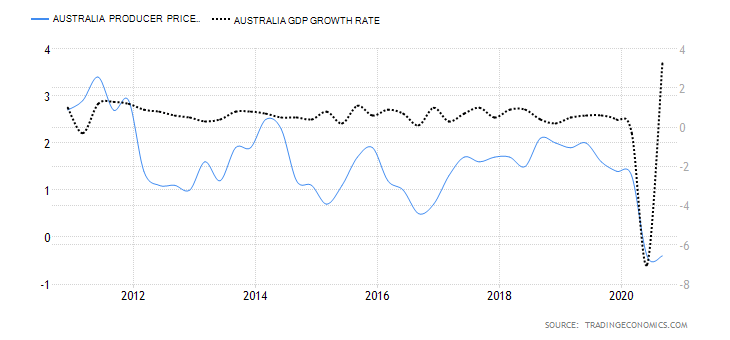
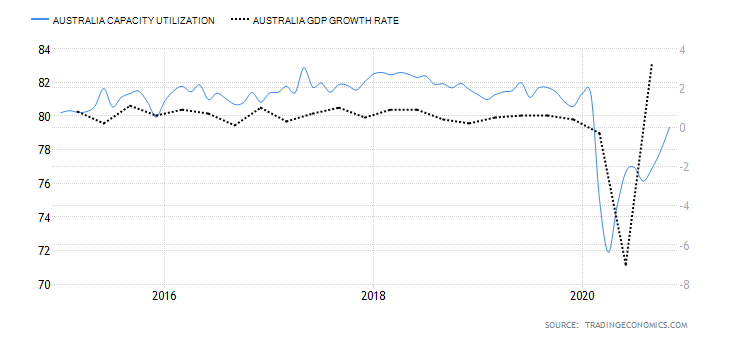
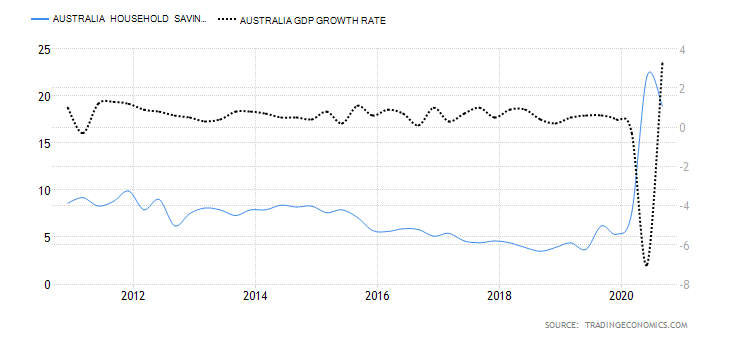
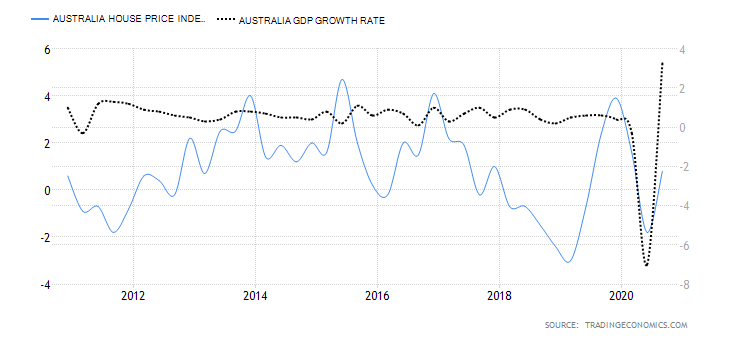
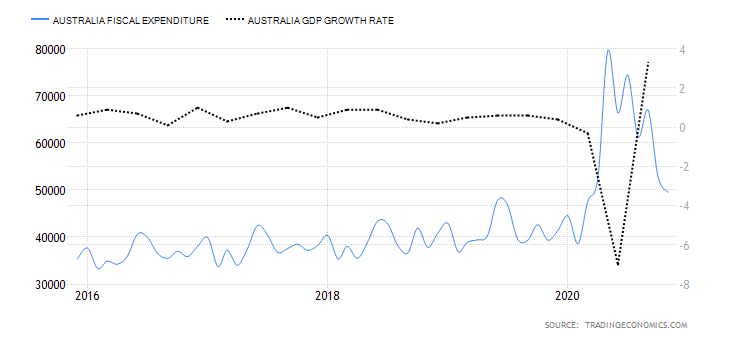
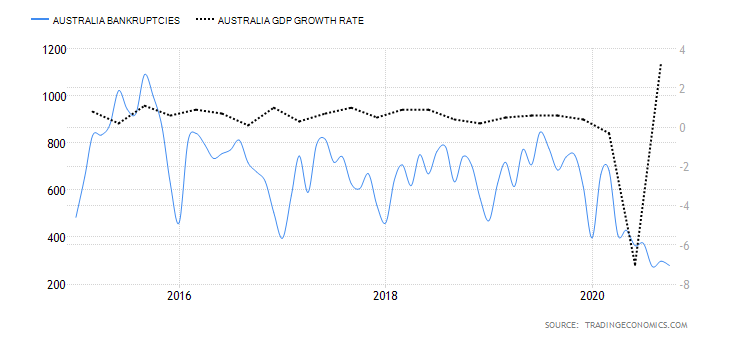
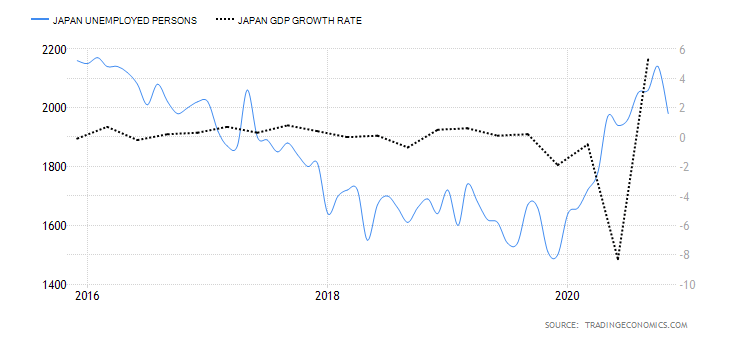
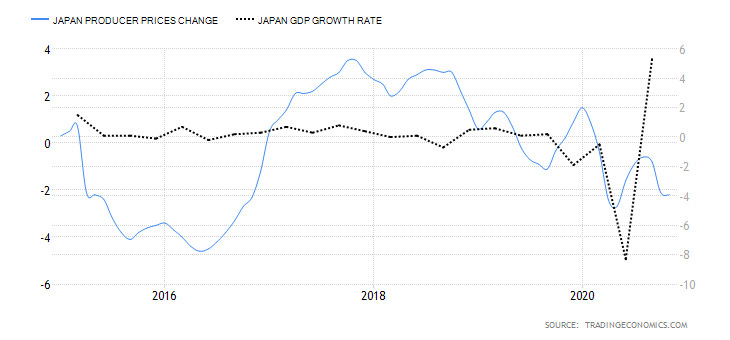
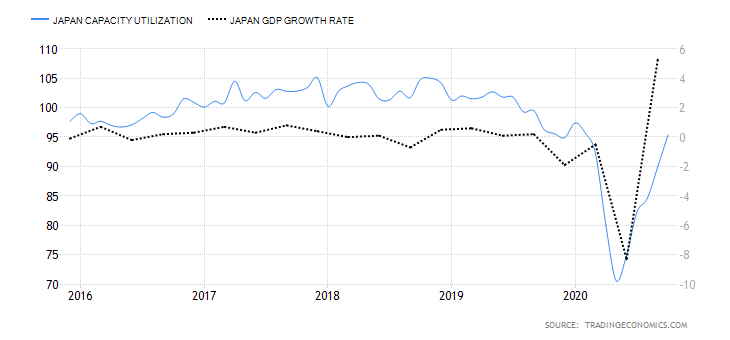

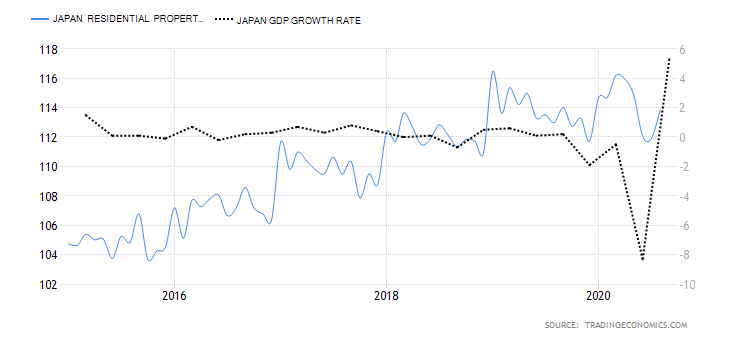
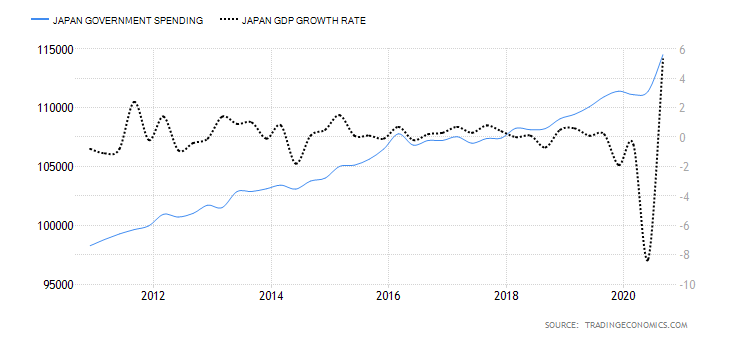
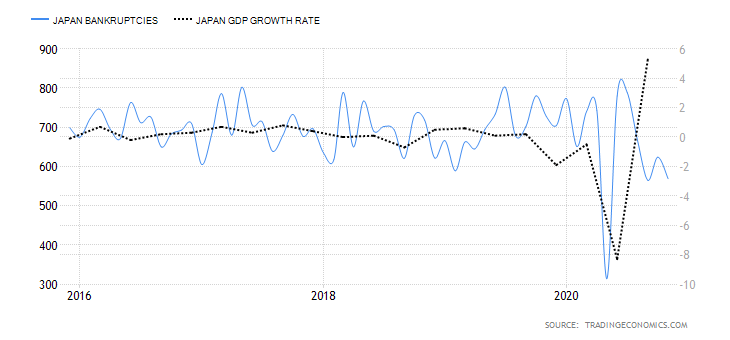
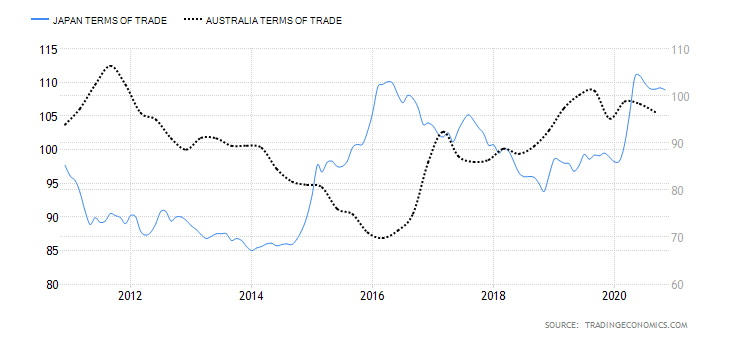
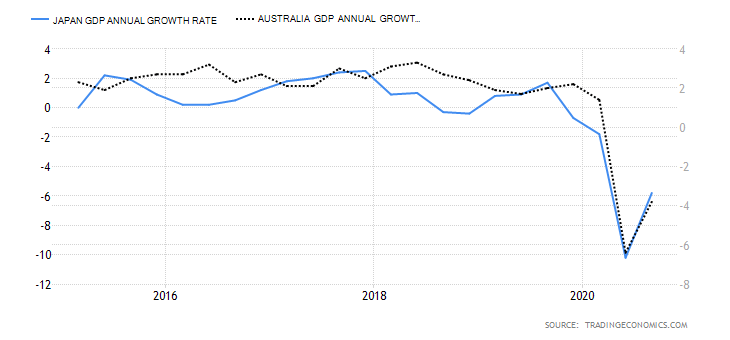
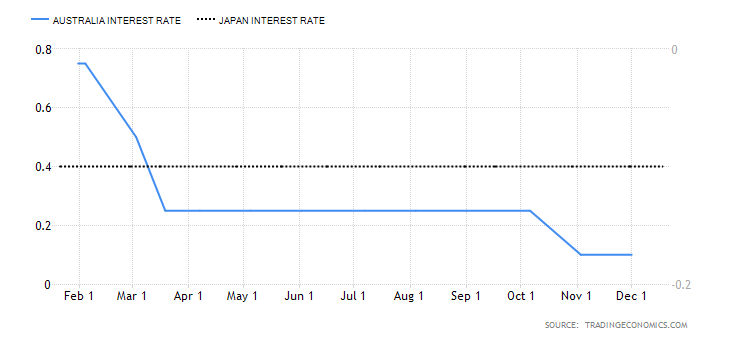
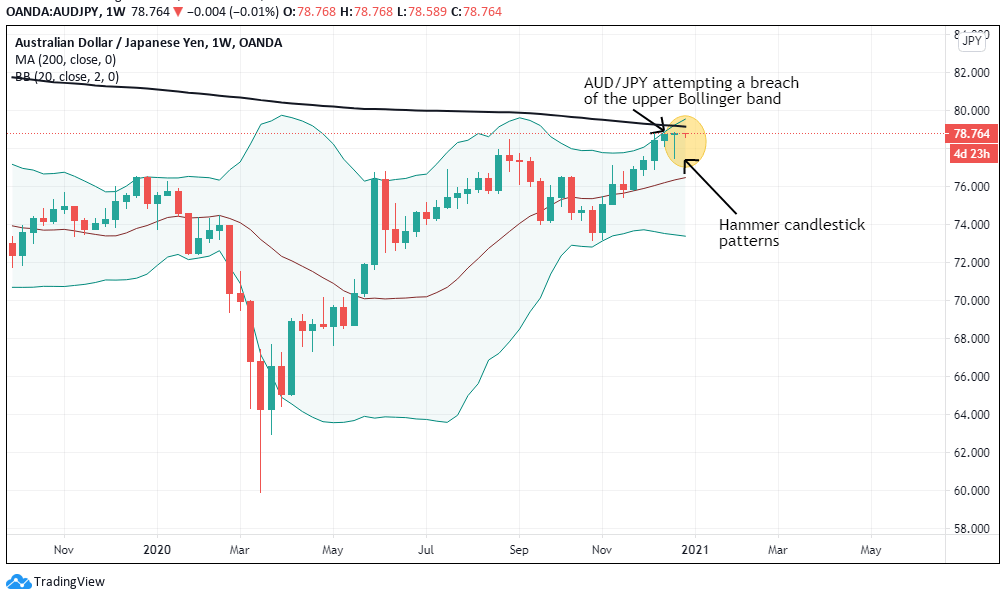

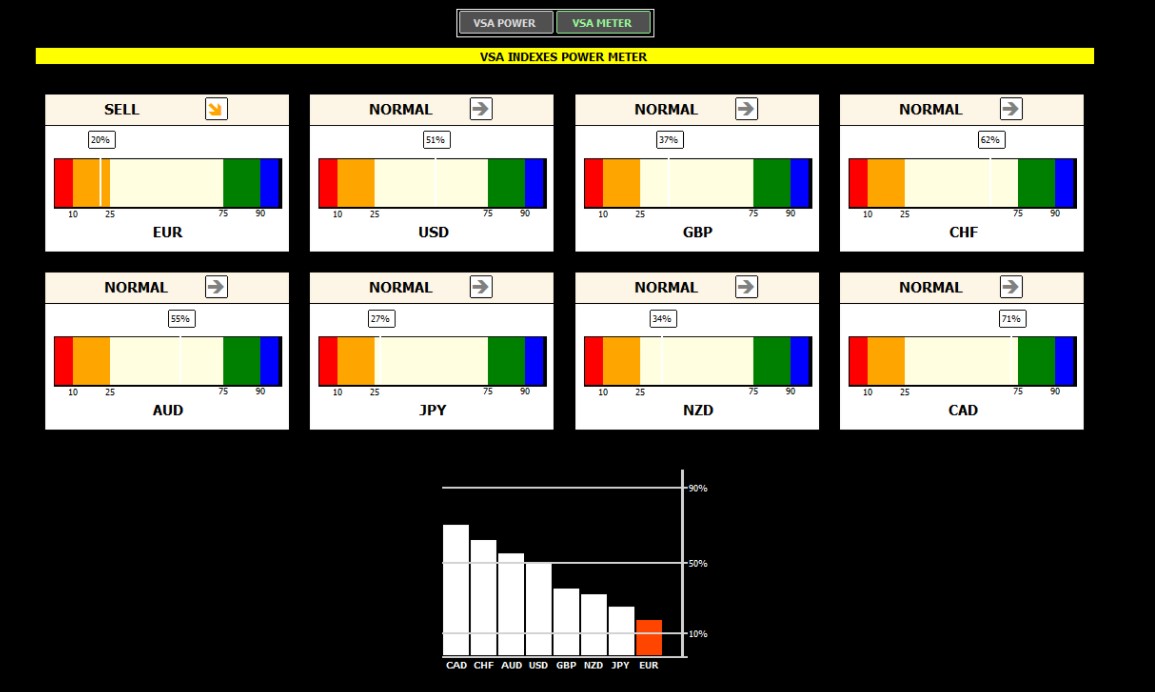
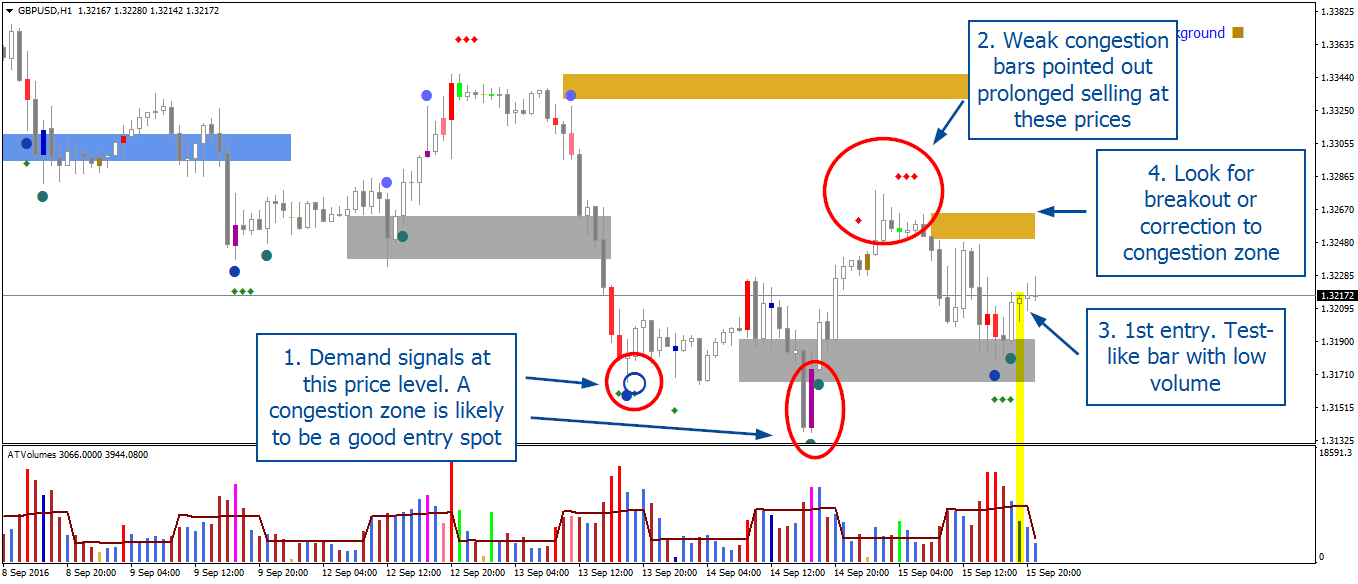
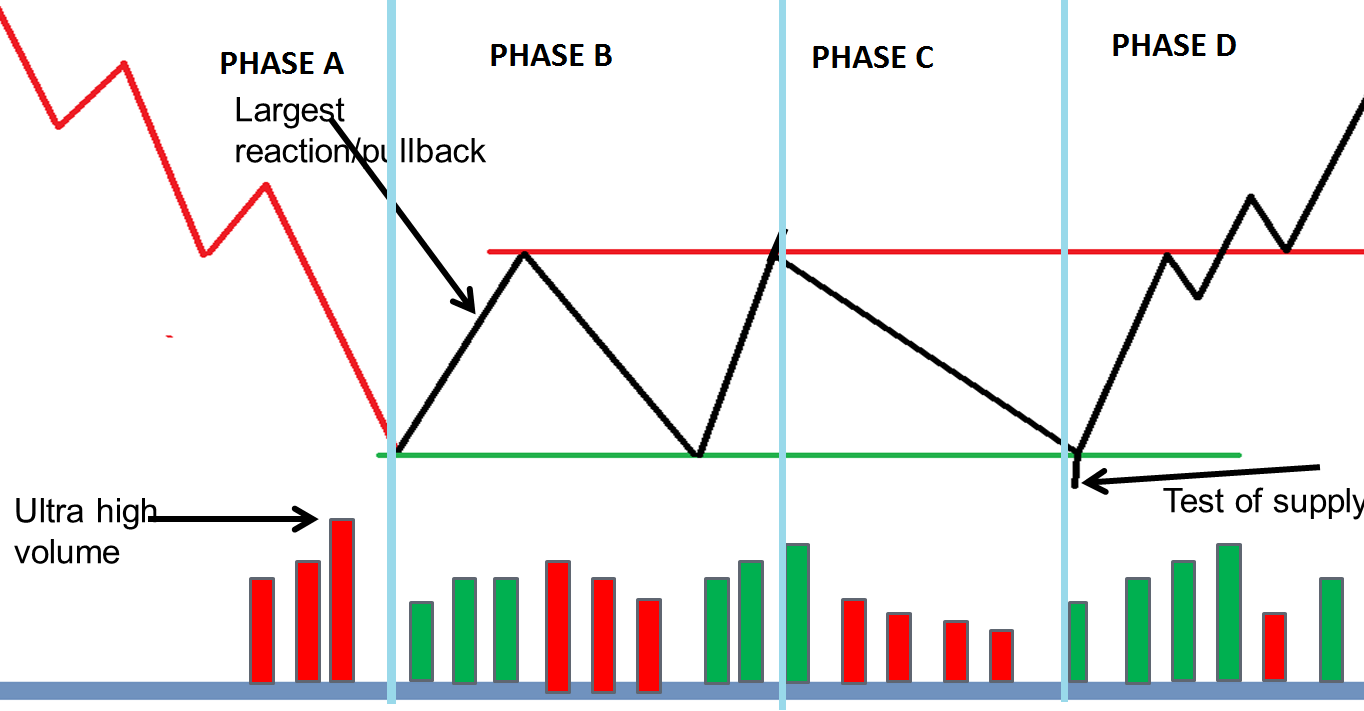
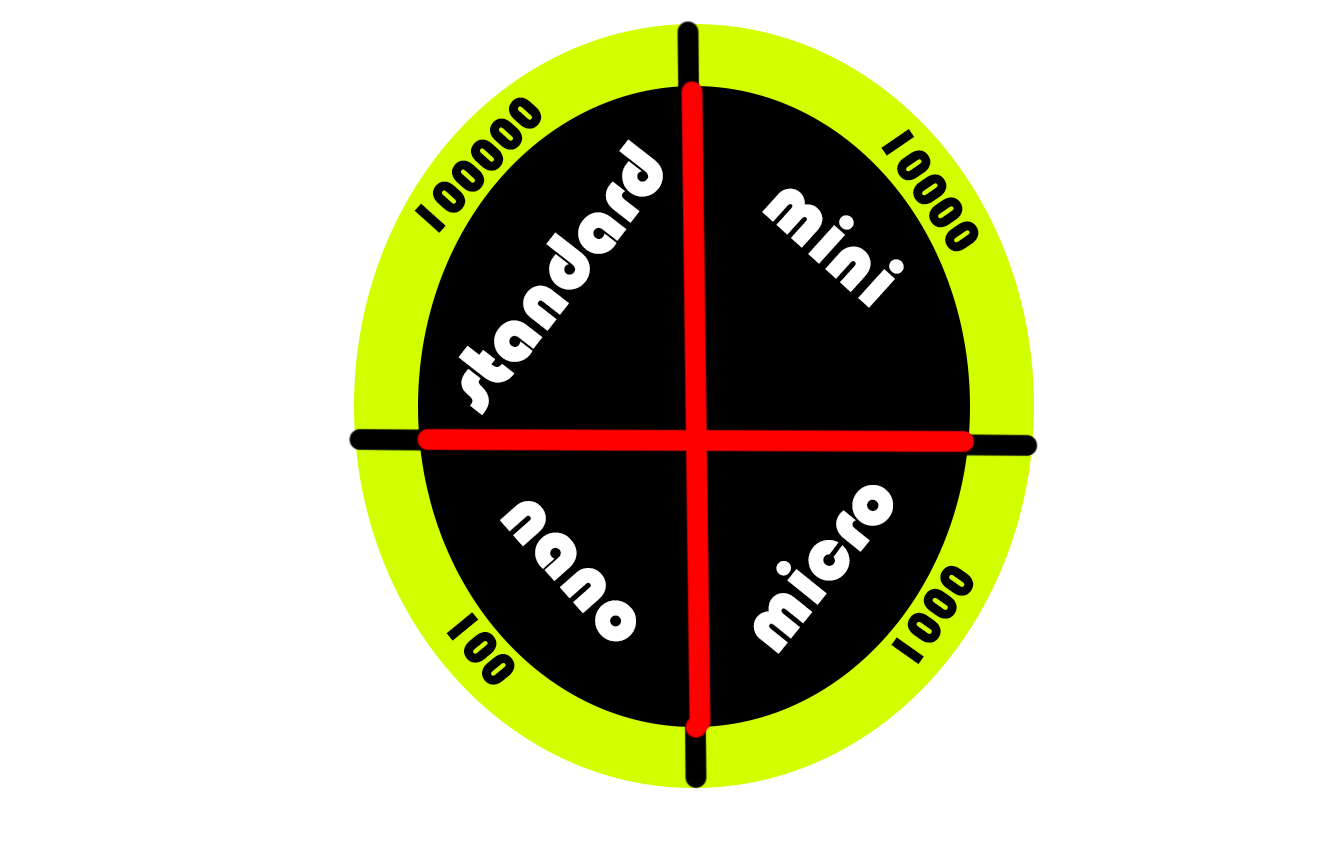

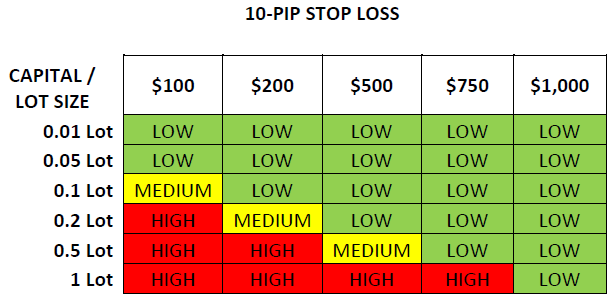
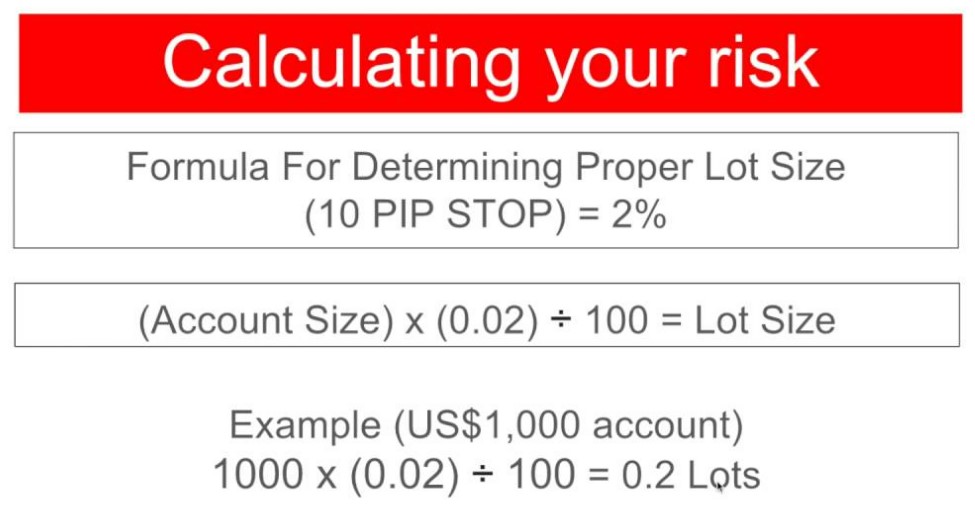
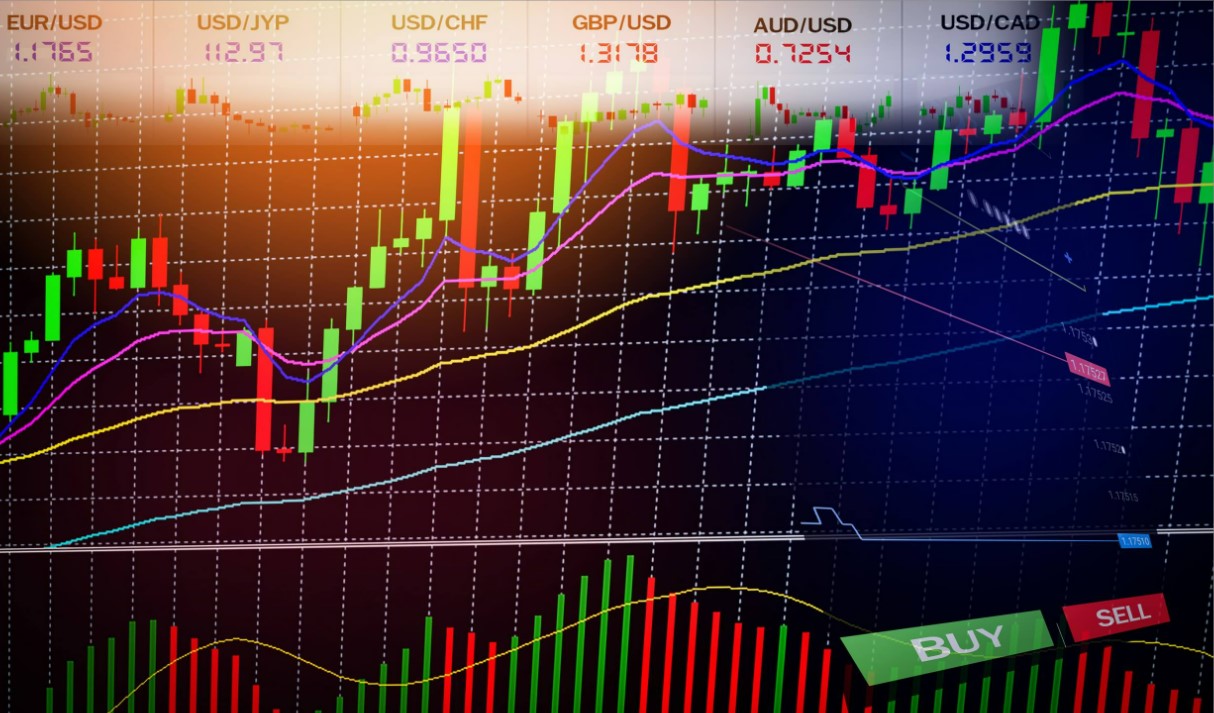
:max_bytes(150000):strip_icc():format(webp)/dotdash_Final_Four_Types_of_Forex_FX_Trend_Indicators_Nov_2020-01-df673b5bd0764b14bc7a6b2b6d53bb55.jpg)
:max_bytes(150000):strip_icc():format(webp)/dotdash_Final_Four_Types_of_Forex_FX_Trend_Indicators_Nov_2020-03-995620c669434f8c907032c46be7e891.jpg)
:max_bytes(150000):strip_icc():format(webp)/dotdash_Final_Four_Types_of_Forex_FX_Trend_Indicators_Nov_2020-05-0112d62d43b64703997192dad9f396e8.jpg)


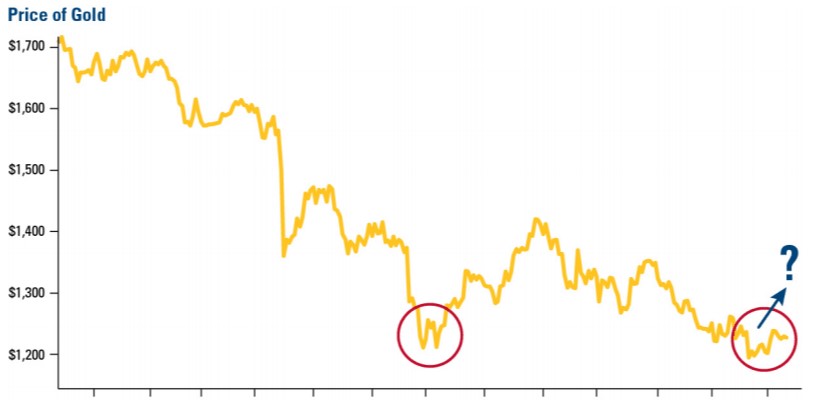
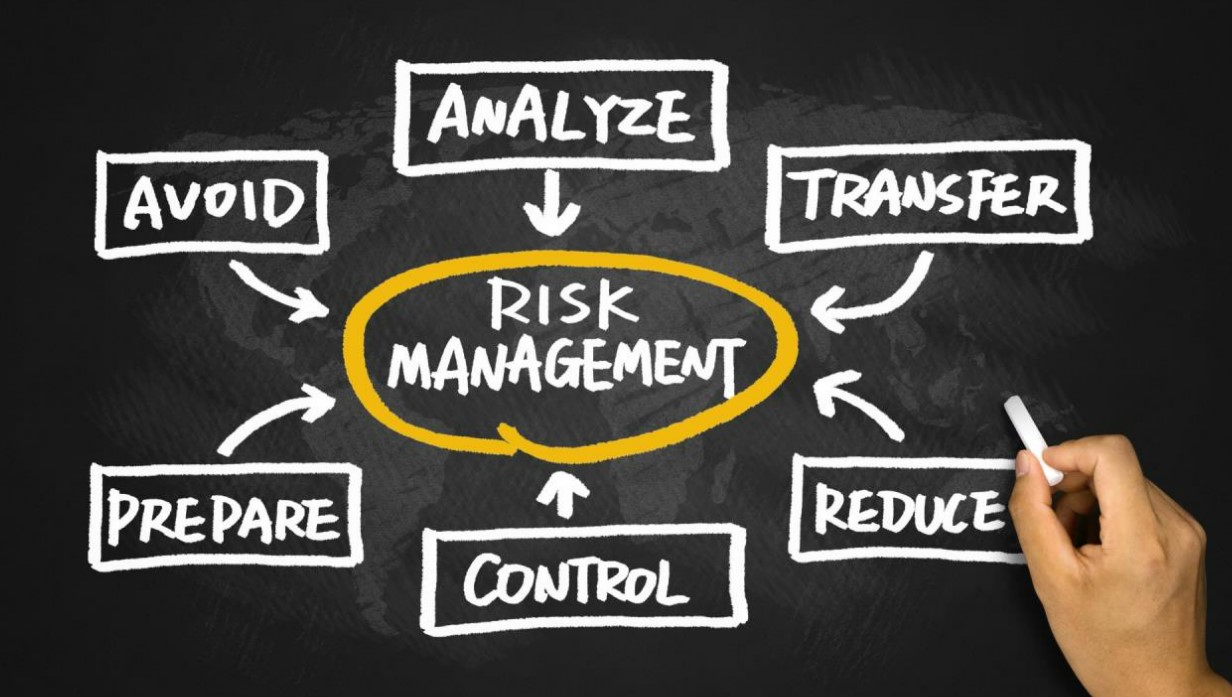

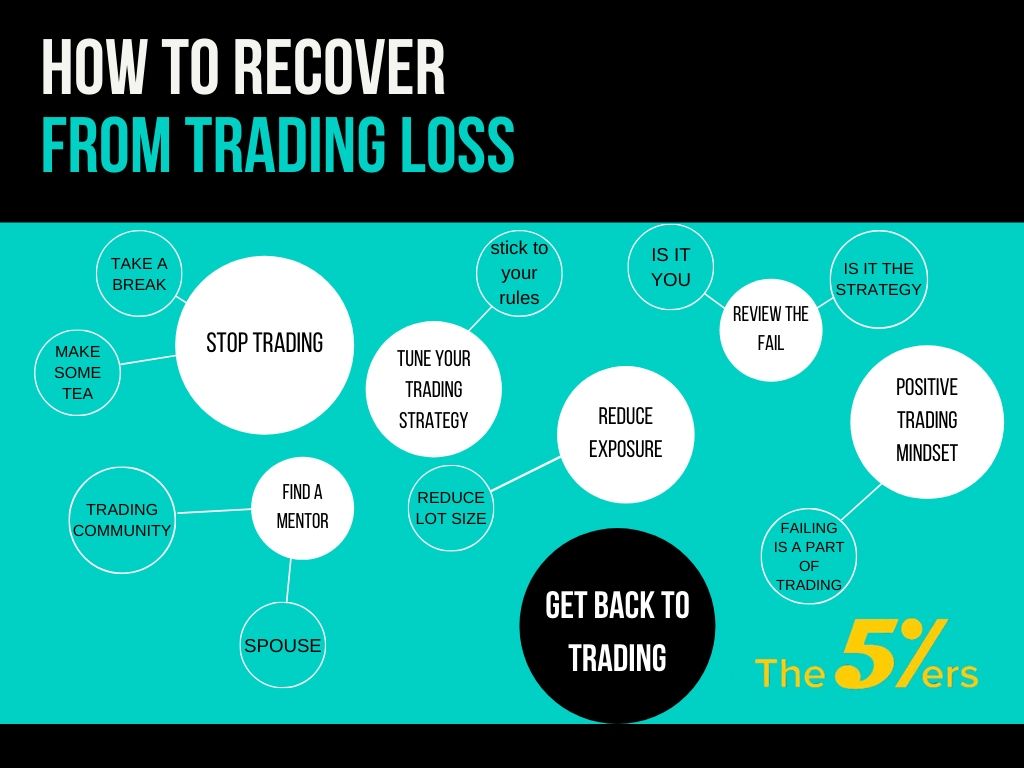


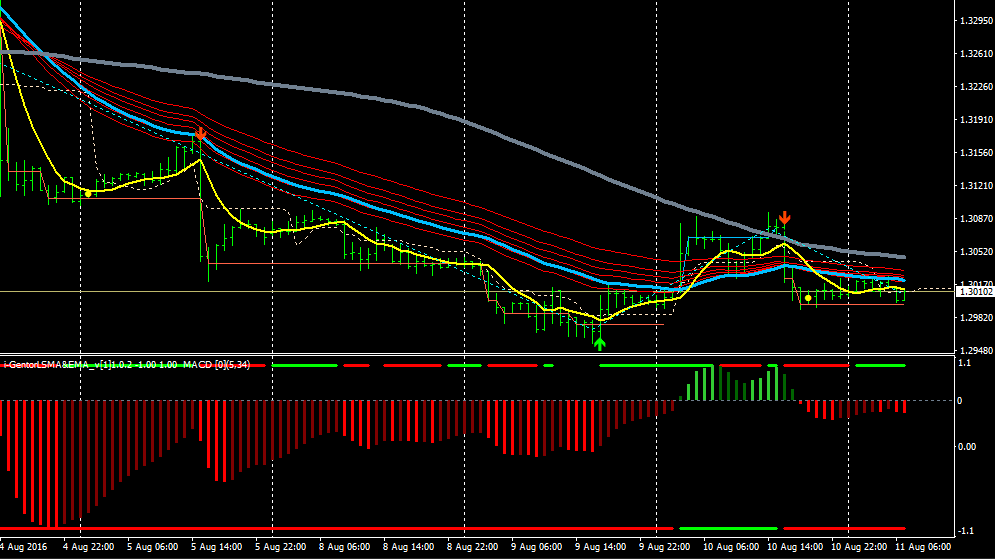
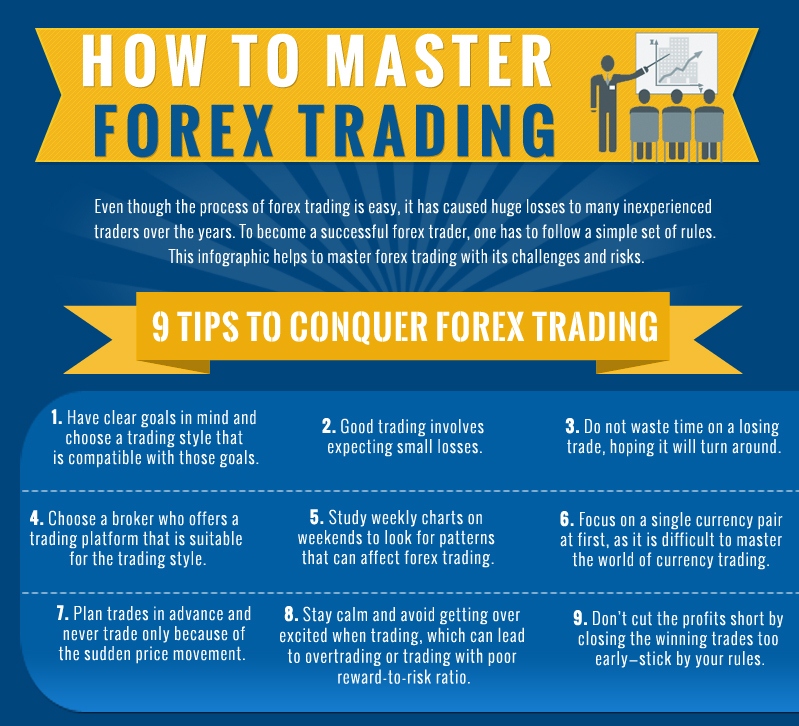
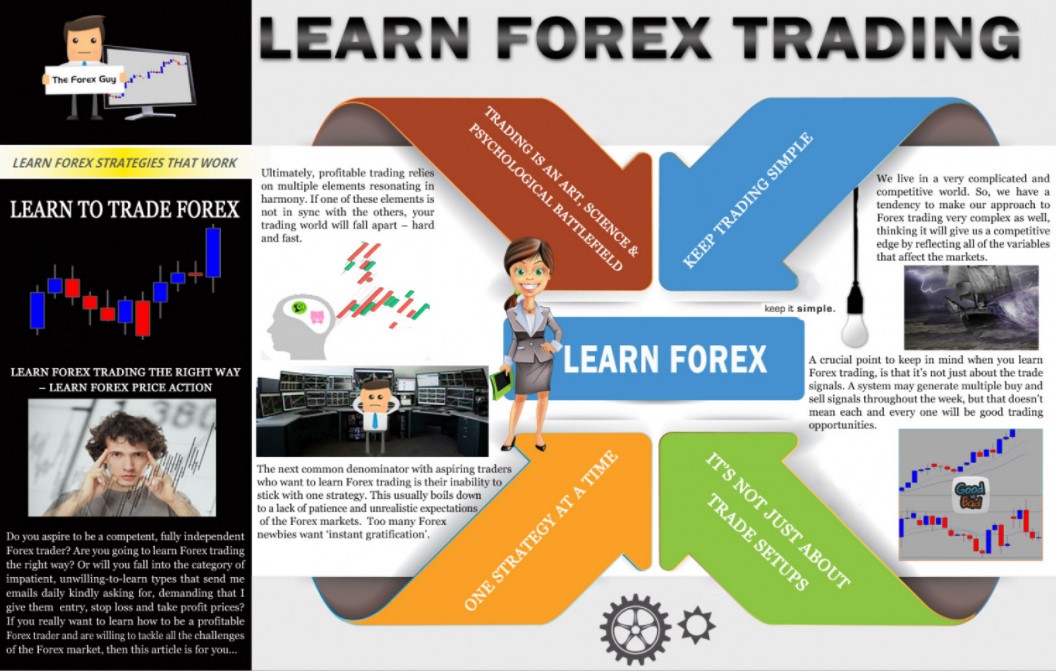


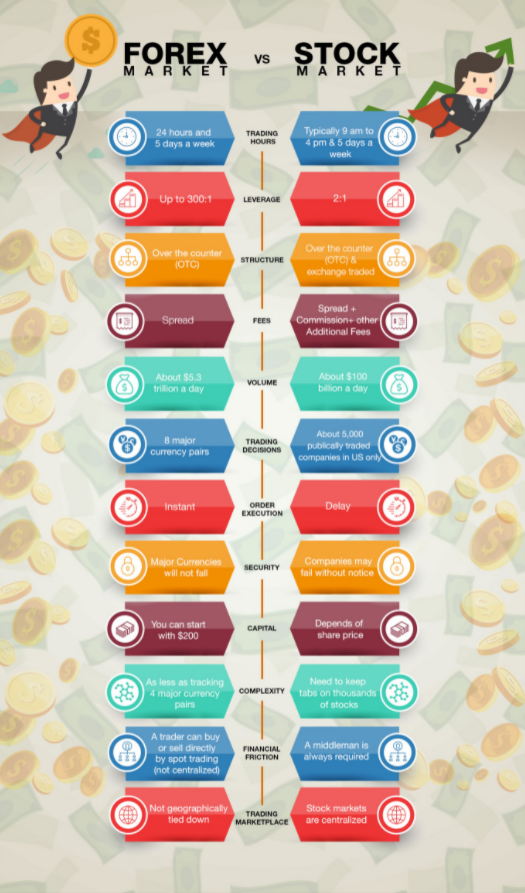
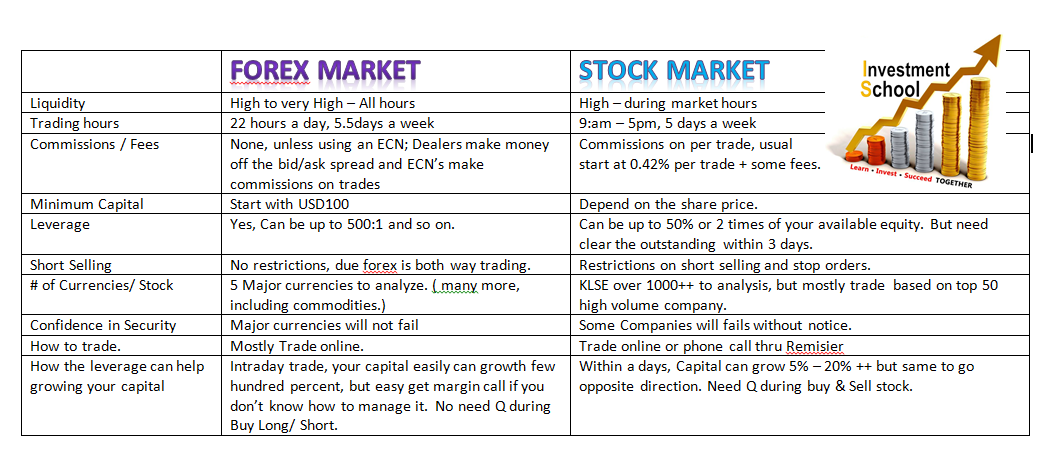


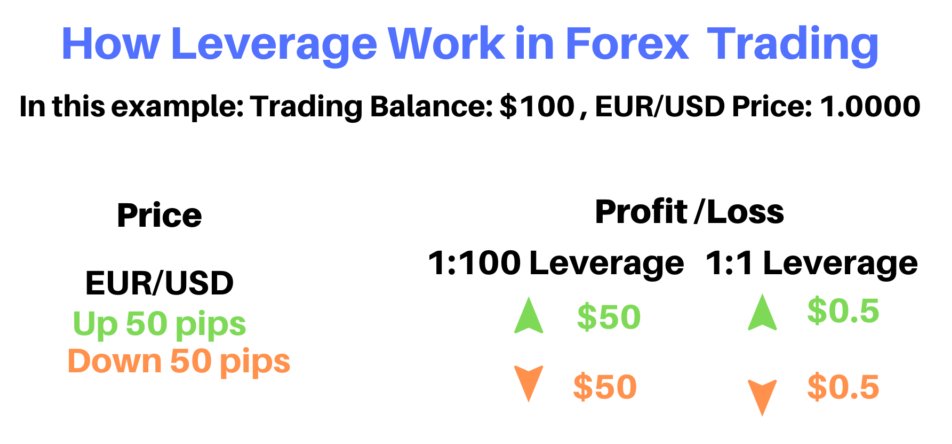
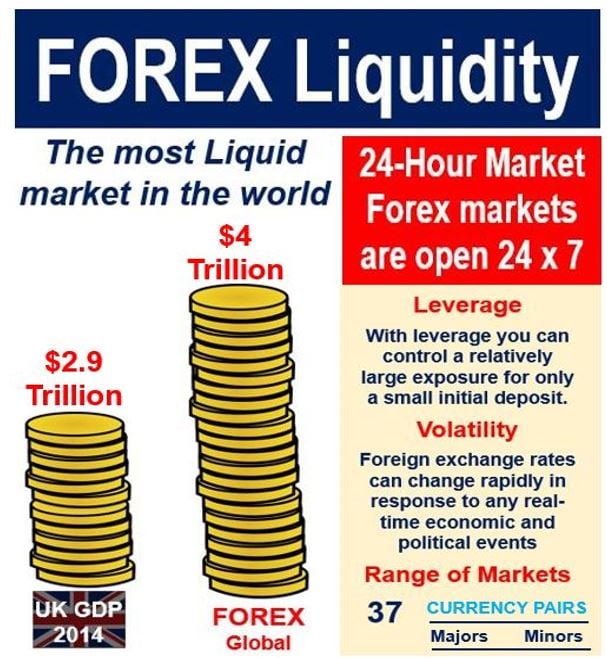 The forex markets are one of the most liquid markets in the world, this simply means that there is a lot of money available to be traded at any one time. Liquidity is basically defined as the ability for a currency or asset to be traded on demand. As the forex markets are so liquid, this basically means that you are able to trade at any given time whenever you want, and the more liquid that a currency pair is, the lower the
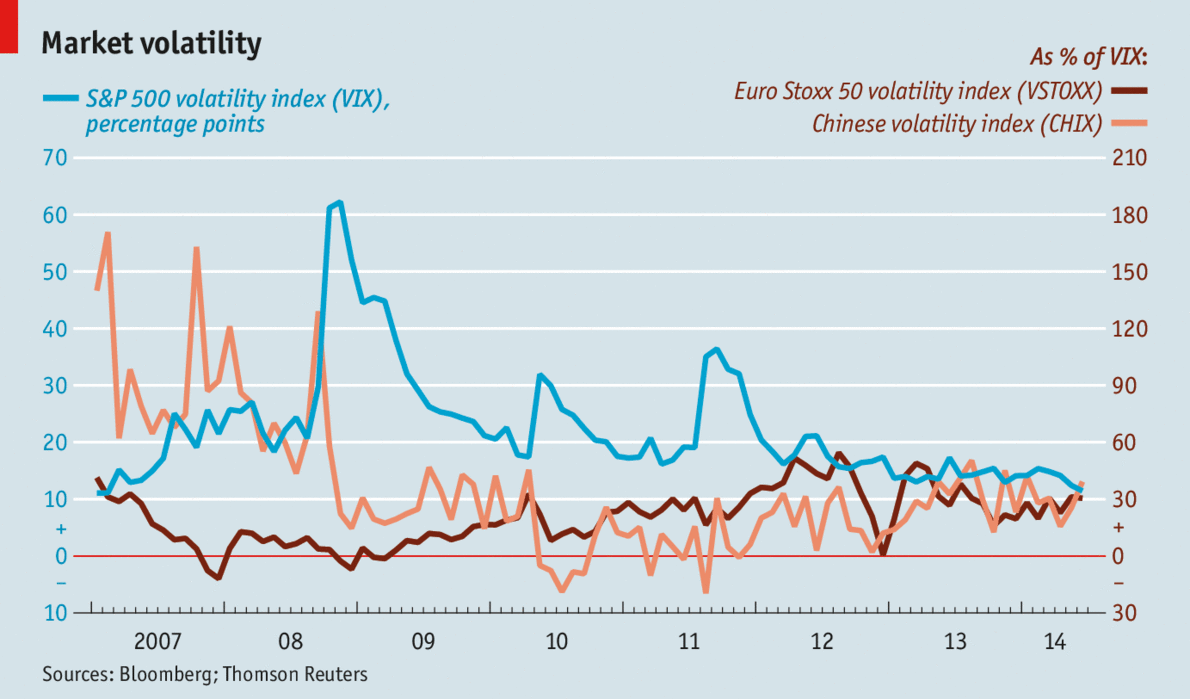
 It is normal that you can think after all this when you open your trading platform “what if the flute sounds? what if it does?”. We’ve all read the typical news in the newspaper where it tells you that x person won an incredible amount of money with x event. Quick and easy. Here the survival bias is very high. Don’t tell you that that could be 0.0001%
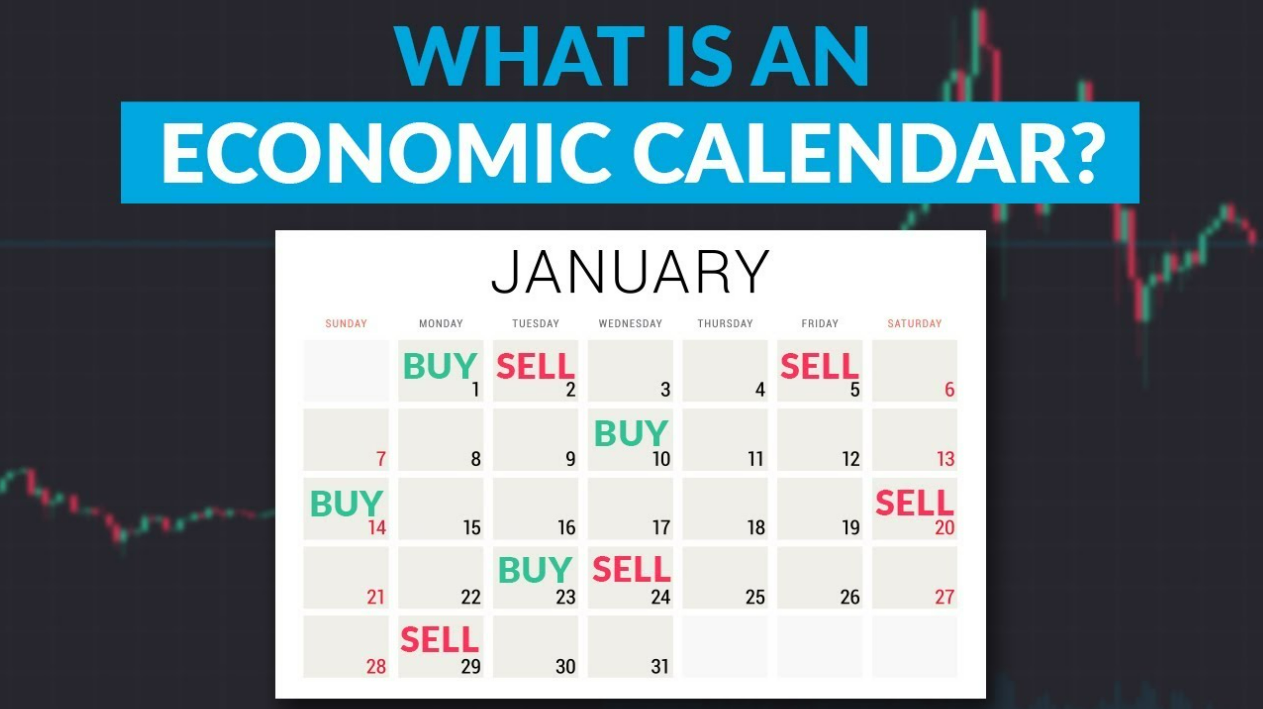


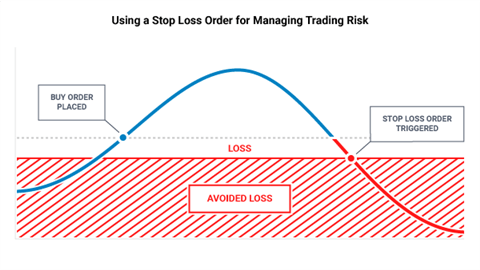


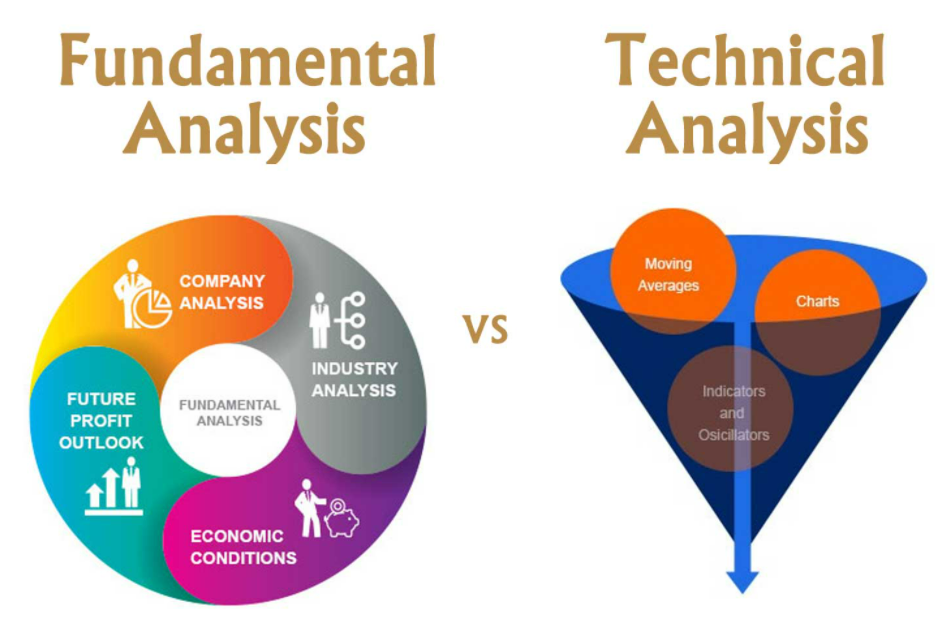
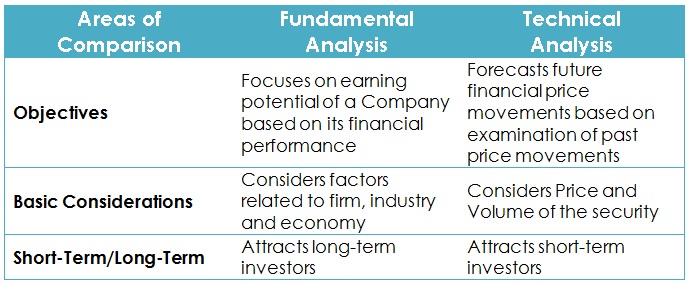
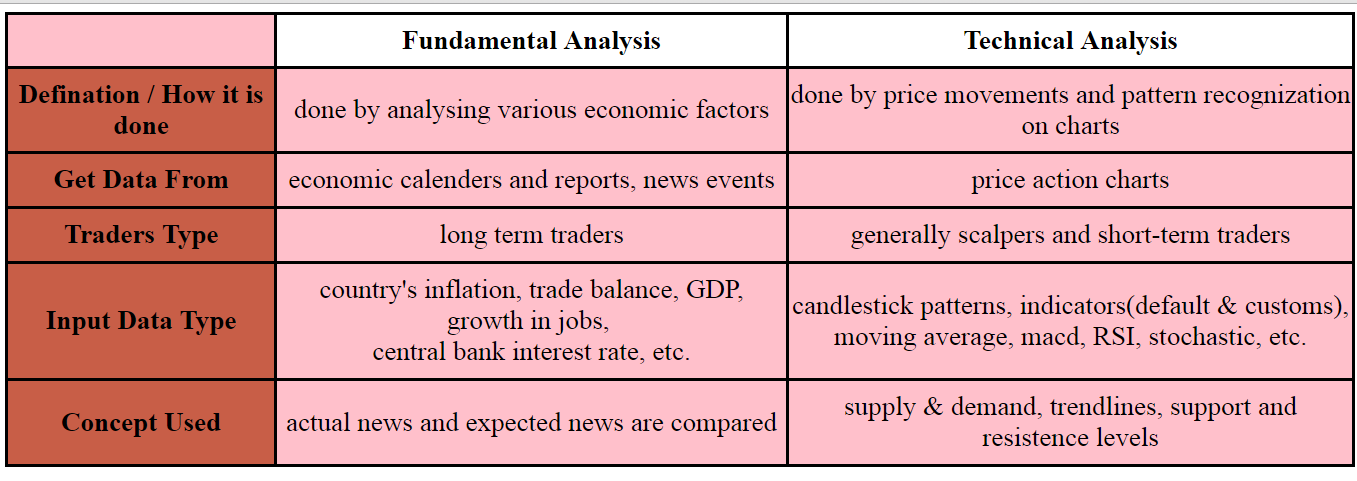
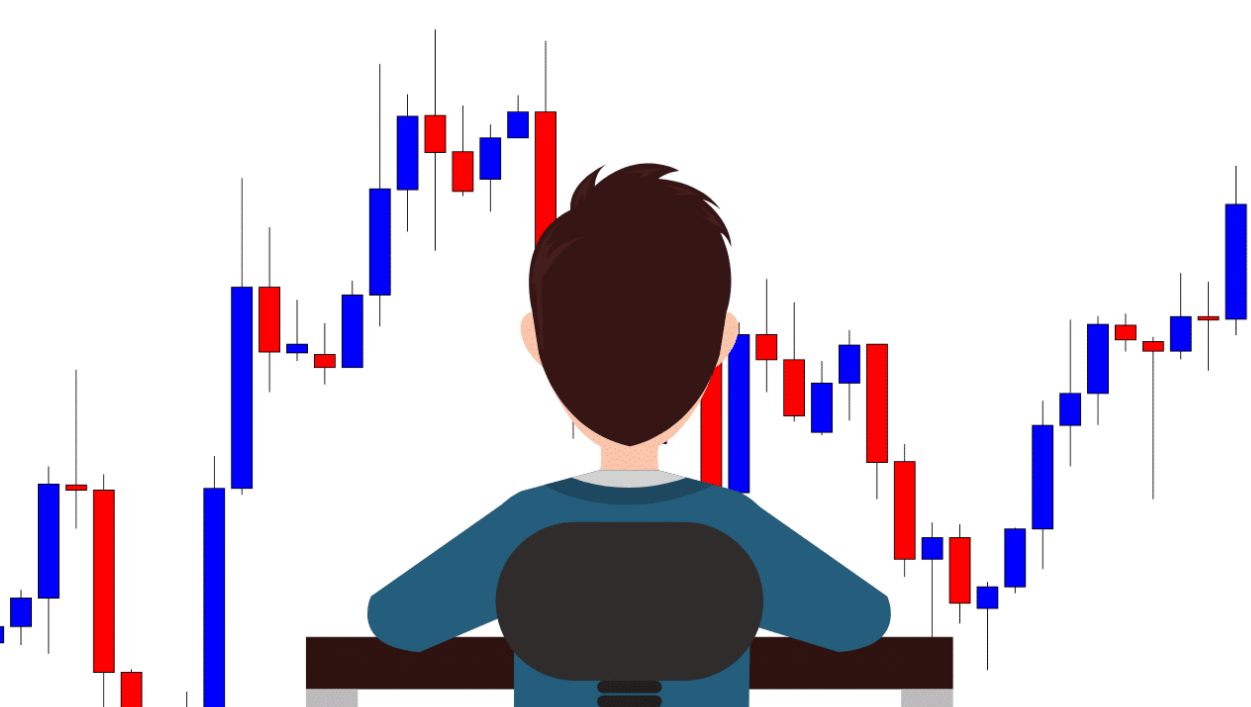

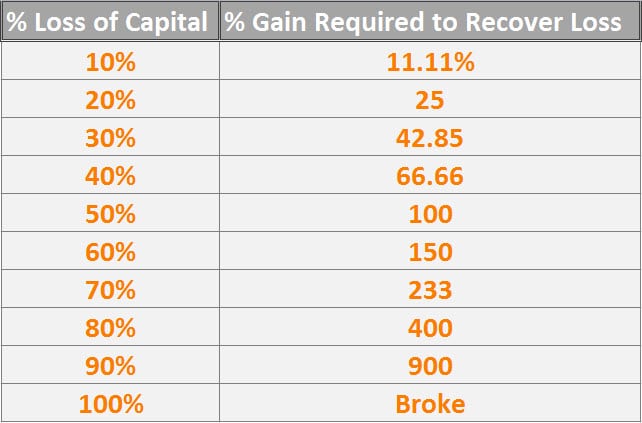


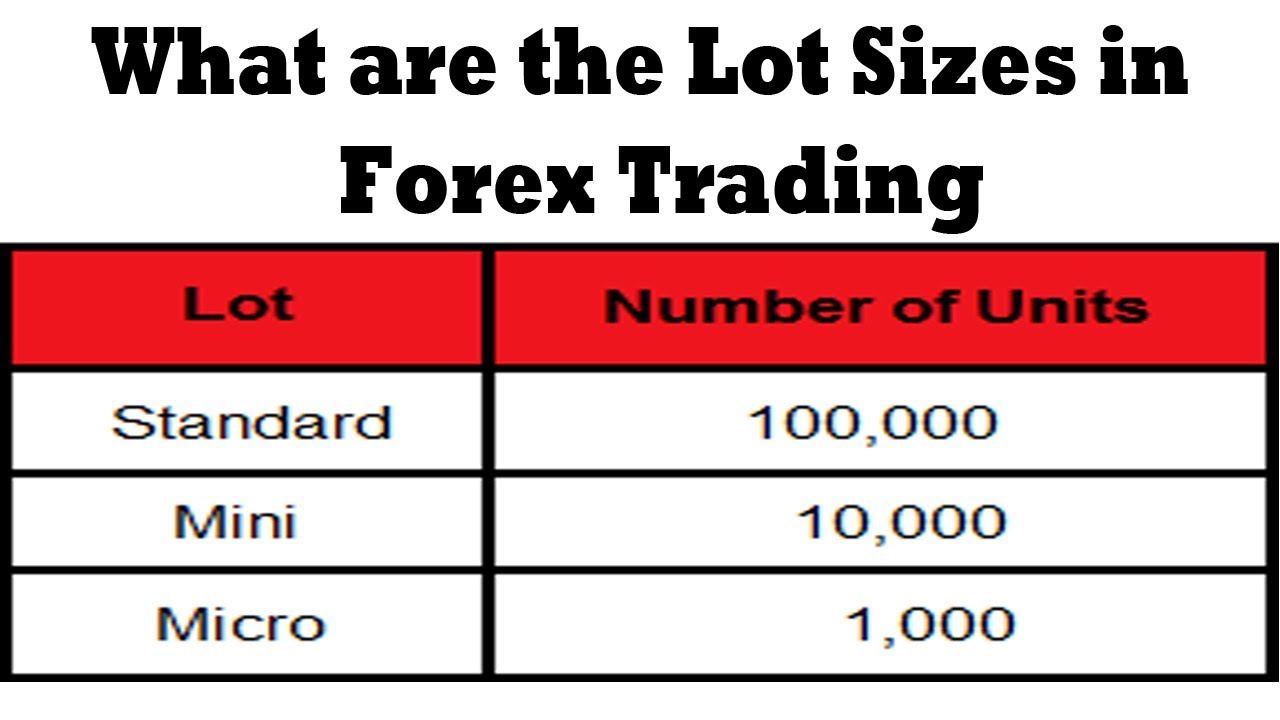