Categories
Forex Market Analysis

Daily F.X. Analysis, May 05 – Top Trade Setups In Forex – Buckle Up for Seris of U.S. Events! 

On the forex front, the ICE U.S. Dollar Index marked a day-low of 98.64 Friday before paring losses to close flat at 99.08. Research firm Markit will publish final readings of April Manufacturing PMI for the Eurozone (33.6 expected), Germany (34.4 expected), France (31.5 expected). The Eurozone Sentix Investor Confidence Index for May will be released (-28.0 expected). The Commerce Department will report March factory orders (-9.4% on month expected) and final readings of durable goods orders (-14.4% on month expected).

Economic Events to Watch Today

EUR/USD – Daily Analysis

Today in the early Asian session, the EUR/USD currency pair struggling to break a bearish channel around 1.09 after the registered biggest daily drop by 0.67% to 1.0899 level in over a month on Monday due to broad-based U.S. dollar strength.

The GDP of the Eurozone dropped 3.8% in this quarter from the previous 14.4%. The ECB expects a 5% – 12% contraction in Eurozone’s economy this year. The International Monetary Fund (IMF) has forecasted the same Eurozone’s economic contraction as 5%, which was in line with the ECB’s projection. The ECB Vice President Luis de Guindos said in April that he expected a worse recession to be faced by the European economy than the rest of the world.

At 13:30, the Sentix Investor confidence showed a massive decline in the economic conditions of Europe by -41.8 against the expected -25.9. It showed that investors and traders had lost confidence in the European economy, and it weighed heavily on EUR/USD pair on Monday.

On the other hand, the economic data from the United States came in worse than expected. 

The Factory Orders dropped to a record of 10.3% during the month of March against the forecasted 9.7% decline. However, in contrast to the economic data, the U.S. Dollar Index remained strong during Monday when it gained about 0.4% and it to 99.59 level, which is the highest since Thursday. The key factor will be the NFP data on Friday this week, and investors will be looking forward to it.

Daily Support and Resistance

  • R3 1.0927
  • R2 1.0921
  • R1 1.0912
  • Pivot Point 1.0906
  • S1 1.0896
  • S2 1.0891
  • S3 1.0881

EUR/USD– Trading Tips

On Thursday, the EUR/USD price trading sharply bearish falling 1.0880 level after violating the ascending trendline on the 4-hour timeframe. On the 4 hour chart, the EUR/USD has formed a strong bearish engulfing candle, which is suggesting selling bias among traders. Typically such a pattern shows that buyers are exhausted, and sellers may dominate the market. On the lower side, the EUR/USD may find next support around 1.0835 level and violation of which can open further room for selling until 1.07600 level. 

GBP/USD – Daily Analysis

The GBP/USD currency pair stopped its 2-day bearish rally and took modest bids near the 1.2465 while representing 0.15% gains on the day, having hit the intraday high of 1.2471 mainly due to recovery in the risk sentiment in the financial market. The U.S. dollar is losing its bullish traction, which eventually keeps the currency pair supportive.

Currently, the GBP/USD is currently trading at 1.2468 and consolidates in the range between the 1.2431 – 1.2471. However, the traders are cautious about placing any position due to nervous sentiment ahead of the UK-US trade talks and the final reading of British Services PMI for April.

Moreover, the outlook for GBP looks more pessimistic, given the extent of the loss faced by the coronavirus pandemic by the city. Another reason included in the pessimistic view for GBP outlook included the U.K. government’s attitude towards the extension of the Brexit negotiation period as well as the potential of Britain for a cautious reversal of economy after lockdown.

The drop of GBP/USD pair in the absence of any macroeconomic data and news from Great Britain was caused by the strength of the U.S. dollar across the board. Despite the poor Factory Orders data from the U.S. on Monday, the U.S. Dollar Index rose about 0.4% and remained strong against its rival currencies.

The strength of the U.S. dollar, along with the pessimistic outlook of GBP, dragged down the GBP/USD pair towards 1.240 level on Monday. The next key factor for pair would be NFP data from the U.S. on the coming Friday.

Daily Support and Resistance

  • R3 1.2597
  • R2 1.255
  • R1 1.2497
  • Pivot Point 1.2451
  • S1 1.2398
  • S2 1.2352
  • S3 1.2299

GBP/USD– Trading Tip

The GBPUSD pair is trading sideways around 1.2435, testing a double top pattern around 1.2425. The recent Doji pattern on GBP/USD pair is suggesting chances of bullish correction over 1.2425 support level. This may lead the GBP/USD prices towards 1.2515 level. On the lower side, the violation of 1.2420 support can lead the Sterling prices towards the next target level of 1.2316. Overall, the trading bias of GBP/USD remains bullish, considering the 50 EMA as it’s keeping the Cable bullish above 1.2420 today.  

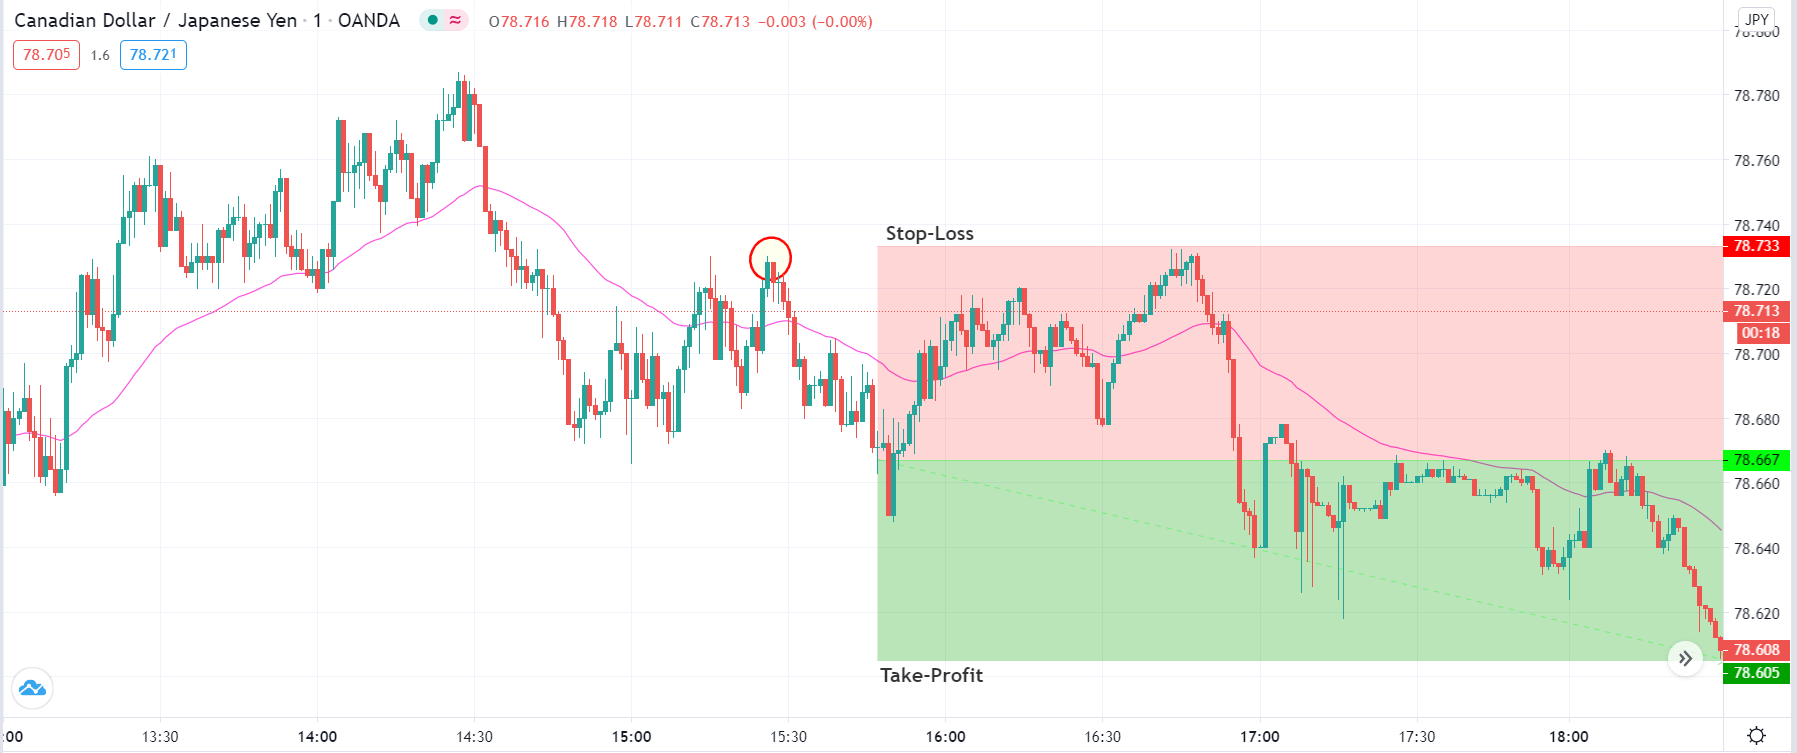
USD/JPY – Daily Analysis

The USD/JPY was closed at 106.718 after placing a high of 107.067 and a low of 106.633. Overall the pair USD/JPY moved sideways during Monday and remained flat. The risk-off sentiment in the market emerged on Monday after the U.S. administration started an investigation into the origin of the virus. The U.S. administration has decided to prove that China deliberately withheld the information from the world, which led to the global spread of coronavirus. However, WHO confirmed that it had not received any evidence from U.S. administration about the speculations about the origin of the virus that is Wuhan’s laboratory.

U.S. President Donald Trump announced that China should be held responsible for the global coronavirus spread. According to him, China should have informed about the hand-to-hand transmission of the virus earlier as well as it should have stopped the virus from spreading across the globe and in order to punish China for its mishandling of the situation, the U.S. has announced to come up with a retaliatory measure against China.

Trump on Monday also announced to cancel the phase-one deal that was signed between China & the U.S. if China will fail to fulfill its promise of buying $200 worth of U.S. goods. Coronavirus has hit the economies of all countries by lockdown, and it is unclear whether the Chinese economy is able to fulfill its promise or not.

Furthermore, the fact that the U.S. is blaming China over the global pandemic of coronavirus has raised fears of a new trade war between China & the U.S. This rising tension has created the risk-off sentiment in the markets and supporting U.S. dollar. 

The U.S. Dollar Index rose 0.4% on Monday and reached a level of 99, which is highest since Thursday. The pair USD/JPY was also supported by the strength of the U.S. dollar on Monday. In the absence of Japanese traders due to Japan’s Bank holiday, the movement of USD/JPY was solely dependent on USD on Monday. The pair showed very slow progress almost remained flat throughout the day.

Daily Support and Resistance    

  • R3 107.46
  • R2 107.27
  • R1 107.01
  • Pivot Point 106.82
  • S1 106.56
  • S2 106.37
  • S3 106.11

USD/JPY – Trading Tips

The technical side of USD/JPY is mostly unchanged as the pair continues to consolidate around 106.700. As we can see in the 4-hour chart above, the USD/JPY pair is struggling to cross over the downward trendline, which is extending resistance around 106.950. As of now, the USD/JPY pair has also formed a symmetric triangle pattern, which is currently supporting the pair around 106.440. The 50 EMA is also keeping pressure on the pair around the same level of 107.050. Below this level, we may see a selling trend in the USD/JPY pair until the next target levels of 106.44 and 106. 

All the best for today! 

Categories
Forex Signals

Gold Prices on a Bullish Run – Is It Going after 1,770? 

The safe-haven-metal prices extended its 4-day winning streak and rose to the fresh 7.5-year high of $1,760 level since November 2012 while representing 0.90% on the day, although the Federal Reserve’s President Jerome Powell rejected negative rate once again. However, the reason for the gold upticks could be attributed to the renewed tension between the US-China trade tussle. Whereas, the dollar index, which tracks the value of the greenback (gold’s biggest nemesis) against majors, is also sidelined near 100.34. At this moment, the yellow-metal prices are currently trading at 1,761.78 and consolidate in the range between the 1,743.02 – 1,764.73.

The central bank repeatedly showed disagreeability to using negative interest rates to respond to the economic impact of the coronavirus pandemic, Federal Reserve’s President Jerome Powell said CBS during a 60-minute interview held over the weekend. 

Despite this, the gold rose to multi-month highs mainly due to the White House trade advisor Peter Navarro said during his this week interview that China sent hundreds of thousands of passengers on aircraft to Milan, New York and around the world through planning to spread the virus after hiding it from all over the world for almost 2-months.

In the meantime, the reasons for the intensified trade tension could also be attributed to the statement to blocking chip supplies to Huawei Technologies. On the other hand, the uptick in the stocks, which usually have an inverse relationship with gold, also failed to erase gains in yellow-metal.

Whereas, the Federal Reserve Chair Powell said that both the Central bank and Congress should help the economy recover from the virus outbreak recession. As markets were pricing negative rates earlier this month, President Trump called them a gift enjoyed by other countries. However, Powell destroyed expectations for negative rates on Wednesday. Elsewhere, Bank of England (BOE) Governor Andrew Bailey and Bank of Japan (BOJ) Governor Haruhiko Kuroda on Thursday hinted that their focus is on bond purchases and other lending programs to keep borrowing costs low and recover the economy from the virus outbreak recession crisis.


Gold – Technical Outlook

Support Resistance 

1758.2 1771.4

1750 1776.4

1745 1784.6

Pivot Point 1763.2

Gold prices continue to trade on a bullish run, and it seems to head towards the next resistance level of 1,770. Overall this marks a 138.2% Fibonacci retracement level, which holds around 1,780 level. On the lower side, the precious metal gold may find support at 1,756 area and 1,738 area while the continuation of a bullish trend may lead to gold prices towards previously suggested target levels of 1,770. The 50 EMA and MACD both are supporting bullish bias for gold. Let’s keep an eye on 1,763 now to stay bearish below and bullish above this level. Good luck! 

Categories
Forex Basics

CADPLN Asset Analysis

Introduction

In the CADPLN currency pair, CAD is the major currency Canada and PLN is the currency of Poland. In this exotic currency pair, CAD is the base currency, and PLN is the quote currency.

Understanding CADPLN

This pair’s price determines the value of PLN, which is equivalent to one CAD. We can quote it as 1 CAD per X numbers of PLN. For example, if the CADPLN pair’s value is at 2.7983; therefore, we need almost 2.7983 PLN to buy one CAD.

CADPLN Specification

Spread

Spread is a trading cost, which is simply the difference between the Bid price and the Ask price. The broker controls the value of Spread; therefore, traders don’t have to do anything with this. This value depends on the execution model used for the trade.

Spread on ECN: 13 pips

Spread on STP: 18 pips

Fees

The trading fees that forex brokers take are similar to the stock market. It is automatically deducted from traders’ account. Note that, the fees has no impact on STP account.

Slippage

In the case of high volatility, it creates a difference between the execution level and the price open level, which is known as Spread. The main reason to occur slippage is the market volatility and the broker’s execution speed.

Trading Range in CADPLN

The trading range is the representation of the minimum, average, and the maximum volatility of this pair on the 1H, 4H, 1D, 1W, and 1M timeframe. Using these values, we can assess our profit/loss margin of trade. Hence, this proves to be a helpful risk management tool for all types of traders.

Procedure to assess Pip Ranges
  1. Add the ATR indicator to your chart
  2. Set the period to 1
  3. Add a 200-period SMA to this indicator
  4. Shrink the chart so you can assess a large time period
  5. Select your desired timeframe
  6. Measure the floor level and set this value as the min
  7. Measure the level of the 200-period SMA and set this as the average
  8. Measure the peak levels and set this as Max.
CADPLN Cost as a Percent of the Trading Range

As per the volatility values of the above mentioned table, we can see that the cost changes with the change in volatility of the market. Later on, we have got the ratio between total cost and the volatility and converted into percentages.

ECN Model Account 

Spread = 13 | Slippage = 5 | Trading fee = 8

Total cost = Spread + Slippage + Trading Fee

= 13 + 5 + 8

Total cost = 26

STP Model Account

Spread = 13 | Slippage = 5 | Trading fee = 0

Total cost = Spread + Slippage + Trading Fee

= 13 + 5 + 0

Total cost = 18

The Ideal way to trade the CADPLN

The CADPLN is an exotic currency pair that has enough liquidity and volatility in the price. As a result, a trader may find it easier to trade this currency pair.

Wee can see that the percentage values did not move above 288%. It is an indication that the cost of trading in the lower timeframe is higher, and in a higher timeframe, it is lower.

Moreover, with the increase of trading cost, volatility is another risk that a trader may face.

Therefore, the best time to trade in this pair is when the volatility remains at the average value. If the volatility decreases, trading will be ineffective. On the other hand, if the volatility increases, there is a possibility of an unwanted stop loss hit. Therefore, sticking to the average value is suitable for this pair.

Furthermore, another way to reduce the cost is to place a pending order as ‘limit’ and ‘stop’ instead of ‘market.’ In that case, there will be no slippage in the calculation of the total costs. Therefore, the total cost will be reduced by five pips.


Limit Model Account

Spread = 13 | Slippage = 0 | Trading fee = 0

Total cost = Spread + Slippage + Trading Fee

= 13 + 0 + 0

Total cost = 13

Categories
Forex Assets

CAD/JMD Asset Analysis

Introduction

CAD/JMD is an exotic currency pair. CAD is the Canadian Dollar, and JMD is the Jamaican Dollar. The CAD is the base currency in this pair while the JMD is the quote currency; meaning that the exchange rate of the CAD/JMD pair is the quantity of JMD that can be bought by 1 CAD. If the exchange rate for the pair is 105.68, it means that 1 CAD buys 105.68 JMD.

CAD/JMD Specification

Spread

In forex trading, the spread represents the difference in the value at which you can buy a currency pair and that at which you can sell. The spread varies with different currency pairs.

The spread for the CAD/JMD pair is:

ECN: 2.4 pips | STP: 7.4 pips

Fees

When trading forex with an ECN account, the broker charges a commission for every trade. With STP accounts, no fees are charged on trades.

Slippage

In times of market volatility or if the execution of trade is not instant, there will be a discrepancy between the price at which you initiate a trade and the price it executed. This discrepancy is called slippage.

Trading Range in the CAD/JMD Pair

Since the price of a currency pair constantly changes, knowing by how much the price changes across different timeframes can help forex traders better understand volatility. This knowledge is vital, especially when estimating potential loses or gains. If, for example, the CAD/JMD pair has a volatility of 20 pips during the 4-hour timeframe, it means that trading the pair has a potential profit or loss of $189.2

Below is a table showing the trading range for the CAD/JMD pair.

The Procedure to assess Pip Ranges

  1. Add the ATR indicator to your chart
  2. Set the period to 1
  3. Add a 200-period SMA to this indicator
  4. Shrink the chart so you can determine a larger period
  5. Select your desired timeframe
  6. Measure the floor level and set this value as the min
  7. Measure the level of the 200-period SMA and set this as the average
  8. Measure the peak levels and set this as Max.

CAD/JMD Cost as a Percentage of the Trading Range

Trading any currency pair comes at a cost. These costs vary across different timeframes and volatility. Expressing them as a percentage of the trading range will help to inform the trading decision for the pair.

Below are analyses of the trading costs for the CAD/JMD pair across different timeframes.

ECN Model Account

Spread = 2.4 | Slippage = 2 | Trading fee = 1

Total cost = 5.4

STP Model Account

Spread = 7.4 | Slippage = 2 | Trading fee = 0

Total cost = 9.4

The Ideal Timeframe to Trade CAD/JMD

From the above cost analyses, we observe that lower timeframes and low volatility correspond to higher trading costs with the CAD/JMD pair. For both the ECN and the STP accounts, the highest costs are when volatility is the lowest at 3.4 pips. The lowest cost is when volatility is the highest at 899.9 pips.

The long-term trader enjoys lower trading costs that intraday traders. However, across all timeframes, trading when volatility is average lowers the cost and the risks associated with high volatility. Furthermore, traders can lower their costs by employing the use of forex limit orders as opposed to market orders. Limit orders eliminate the cost of slippage. Here are the trading costs when limit orders are used.

ECN Account Using Limit Model Account

Total cost = Slippage + Spread + Trading fee

= 0 + 2.4 + 1 = 3.4

We can notice a significant reduction in the trading costs of the CAD/JMD pair. The highest cost has reduced from 91.53% to 57.63% of the trading range.


Categories
Forex Assets

CAD/BBD Asset Analysis

Introduction

The CAD/BBD is an exotic currency cross. CAD is the Canadian Dollar, and the BBD is the Barbadian Dollar – the official currency of Barbados. Here, the CAD is the base currency, and the BBD is the quote currency. Thus, the exchange rate of the CAD/BBD pair is the amount of BBD that can be bought using 1 CAD. For example, if the exchange rate for the pair is 1.4961, it means that 1 CAD buys 1.4961 BBD.

CAD/BBD Specification

Spread

One of the costs of trading forex is the spread. It is deducted by the forex broker and is calculated as the difference between the ‘bid’ and ‘ask’ price. The spread varies depending on the type of trade executed. Here are the spread charges for ECN and STP brokers for CAD/BBD pair.

ECN: 12 pips | STP: 17 pips

Slippage

In forex, slippage occurs when a trader opens a trade, but that trade is executed at a higher price. The slippage is influenced by market volatility and the speed at which the forex broker executes your trade.

Trading Range in the CAD/BBD Pair

In forex, the trading range shows how a given currency pair fluctuates over time. It shows the minimum, average, and the maximum volatility of pair across different timeframes. The analysis of the trading range can help us the profitability of trade over different timeframes.

The trading range for the CAD/BBD pair is shown below.

The Procedure to assess Pip Ranges

  1. Add the ATR indicator to your chart
  2. Set the period to 1
  3. Add a 200-period SMA to this indicator
  4. Shrink the chart so you can determine a larger period
  5. Select your desired timeframe
  6. Measure the floor level and set this value as the min
  7. Measure the level of the 200-period SMA and set this as the average
  8. Measure the peak levels and set this as Max.

CAD/BBD Cost as a Percentage of the Trading Range

Here, we will take the total costs in both the ECN and STP accounts as a ratio of the above volatility and express it as a percentage. This analysis will help us understand the trading costs associated with the CAD/BBD pair across different timeframes; which can be useful to determine which risk management technique is optimal.

ECN Model Account

Spread = 12 | Slippage = 2 | Trading fee = 1

Total cost = 15

STP Model Account

Spread = 17 | Slippage = 2 | Trading fee = 0

Total cost = 19

The Ideal Timeframe to Trade CAD/BBD

From the above analyses, we can see that the trading cost for the CAD/BBD pair is highest at the 1-hour timeframe. The highest trading cost for both the ECN and the STP accounts coincide with a period of lowest volatility of just 0.04 pips. The shorter timeframes have relatively higher trading costs that the longer timeframes. Therefore, longer-term traders tend to enjoy lesser costs.

We can also notice that the overall trading costs reduce as the volatility of the CAD/BBD pair increases from minimum to maximum. Therefore, opening trades when the volatility is above the average can help shorter-term traders reduce their trading costs. More so, intraday traders also significantly lower these costs by adopting the use of forex limit orders over the market orders. The limit order types remove the costs associated with slippage. Below is a demonstration with the ECN account.

ECN Account Using Limit Model Account

Total cost = Slippage + Spread + Trading fee

= 0 + 12 + 1 = 13

Removing the slippage costs reduces the trading costs significantly for the CAD/BBD pair. For example, the highest trading cost has reduced from 322.03% to 220.34% of the trading range.


Categories
Forex Basic Strategies

The Dual Candlestick Pattern Strategy

Introduction

Previously, we discussed a strategy that was based on a single candlestick pattern that uses the concept of ‘rejection’ in the market. However, the pattern may not provide a great amount of success as does not take into consideration the various factors of the market such as trend, momentum, volume etc. In today’s article, we try to formulate a strategy that addresses some of the issues and increase the probability of success. To increase the probability of successful trades, we combine two candlestick patterns and a technical indicator to find trades.

The first candlestick pattern we will watch for is the ‘Rising Wedge Pattern’ that occurs in an uptrend. The same pattern, when observed in a downtrend, is called a ‘Falling Wedge Pattern.’ The second candlestick pattern that is of importance to us is the ‘Descending Triangle’ pattern which essentially confirms the commencement of a new trend in the market. Let us look into the specifications of the strategy.

Time Frame

The strategy is specially designed for trading on very short-term price charts such as the 5 minutes or 1 minute. That means this is a hardcore intraday trading strategy.

Indicators

We make use of just one technical indicator in the strategy, and that is the 20-period Exponential Moving Average (EMA).

Currency Pairs

As we are trading extremely on small time-frames, the strategy can be traded on major currency pairs only. Few preferred ones are EUR/USD, GBP/USD, USD/CAD, GBP/JPY, EUR/CAD, EUR/JPY, NZD/USD, and EUR/GBP.

Strategy Concept

The ‘Dual Candlestick Pattern’ strategy is a simple yet powerful strategy that can be used very often in the market. The strategy revolved around the concept of ‘momentum’, which is extremely crucial in the market. When we gauge the momentum of the market, we get an understanding of the shift in market sentiment. Nothing can be as superior as this when it comes to analysing the market sentiment. The first candlestick pattern gives us an indication that the market is losing the momentum of its current trend and that it could reverse any moment. The price action suggests that the market is unable to move higher, and the price is getting more and more expensive for buyers to take the market higher. Once this becomes evident after a reversal, the second candlestick pattern confirms that the reversal is ‘real’ and there could be further ‘legs’ in the trend.

Since we are waiting for many events to occur in the market, we will end up entering late, i.e. when the majority of the move has happened. Due to this, the risk-to-reward of trades executed using this strategy will not exceed more than 1:1. Even though the probability of occurrences of trades is less, they have a greater degree of accuracy.

Trade Setup

In order to execute the strategy, we have considered the 1-minute chart of CAD/JPY where we will be illustrating a ‘short’ trade. Here are the steps to execute the strategy.

Step 1: Firstly, we spot the ‘rising wedge’ pattern in the market where the pattern must be formed above the exponential moving average. What this indicates is that the market has moved into an intermediary uptrend but might be weakening due to the loss in momentum. Our job is to take a trade in the direction of the reversal. Similarly, when a ‘falling wedge’ pattern is formed in the market, it indicates that the sellers are losing momentum and buyers will take over the market. This pattern has to form below the EMA for an upward reversal.

Step 2: Next, we wait for the market to turn on the other side and reverse in direction. After the reversal takes place, the price should form a ‘descending triangle’ pattern below the EMA. The ‘descending triangle’ pattern confirms two things. First, the market has put a ‘lower high’ and ‘lower low’ which are the essentials of a trend and second, the buyers are not strong enough to take the price higher. In a downtrend, the market should form an ‘ascending triangle’ pattern above the EMA that would confirm the reversal. Here the pattern signifies that the market has put a ‘higher high’ and ‘higher low’ along with the inability of the sellers to take the price lower.

Now, let us see the rules for ‘entering’ a trade.

Step 3: In a ‘short’ trade setup, we enter the market when price breaks the ‘support’ line that was created by the ‘descending triangle’ pattern. In simple words, we ‘short’ the currency pair right when the price starts moving below the previous ‘low’ and creates a situation of breakdown. This type of ‘entry’ is shown in below image where we enter right at the break of the ‘support.’ In a ‘long’ trade setup, things are reversed. This means we enter the market when price breaks above the resistance of ‘ascending triangle’ pattern and starts moving higher than the previous ‘high.’

Step 4: Once entered, it is important to determine the stop-loss and take-profit levels for the trade. In a ‘long’ trade, stop-Loss will be set above the first ‘lower high’ that was laid in by the market after reversal. Whereas, in a ‘short’ trade, the stop-loss will be placed below the first ‘higher low’ that was laid in by the market after reversal. Depending on the number of pips of the stop-loss, take-profit will be set by an equal number of pips. This is done to ensure that the risk-to-reward of the trade is at least 1:1. But since we are trading against the trend, we will move our stop-loss to breakeven as soon price moves 80% of the take-profit

Strategy Roundup

The two patterns needed for the strategy might appear several times in the market but are observed separately. It is difficult to spot both the patterns together, which reduces the frequency of trades. One way to increase the frequency of trades is by watching for these patterns during the market opening, as volatility is high. But the focus here should be on taking successful and high probability trades.


Categories
Forex Basic Strategies

Current Economic Conditions

Introduction

One of the primary indicators of a country’s GDP is how the economy is performing presently. The current economic conditions are the best indicators of business and economic cycles in the economy. They can tell us whether the economy is going through expansions or contractions. Thus, the current economic conditions are the best indicators for establishing recessions or recoveries, and can also be used to forewarn about potential overheating of the economy.

Understanding Current Economic Conditions

The current state of the economy is a culmination of several macroeconomic and microeconomic factors. Previous economic trends, government and central banks’ policies influence the current economic conditions. Therefore, the current economic conditions can be said to be a gauge of the effectiveness of previous fiscal and monetary policies.

In the US, for example, the Federal Reserve published the current economic conditions in The Beige Book. The Beige Book published the current economic conditions of the 12 Federal Reserve Districts. Below are the components used to determine the current economic conditions.

Employment and wages: The current economic conditions assess the overall levels of employment and changes in wages. Here, the changes are assessed based on industry. It covers the number of people who were laid off, new hires and job vacancies.
Prices: The prices of goods and services produced within the economy are monitored for inflation. The levels of inflation can be used to assess the living standards and the changes in the cost of doing business.
Manufacturing: The changes in the levels of manufacturing shows the growth of the output and potential changes in employment levels.
Consumer spending: This shows the changes in the welfare of households. Consumer spending correlates to living conditions and could be used as an indicator of future economic expansion or contraction due to changes in aggregate demand.

Banking and financial services: This section shows the changes in the issuing of new loans and the rate of defaults. The changes in the number of loans issued correspond to the changes in economic activities. The changes in commercial and industrial loans indicate whether businesses are investing and expanding. The repayment schedules indicate the financial health of businesses. Credit standards, delinquency rates and deposits are also included in this category.

Real estate and construction: This category shows the changes in the construction of new residential and commercial buildings. It further shows the sale of new houses. The occupancy levels and the changes in rental rates are also included here.

Services: This section reports the changes in the demand for professional services such as the demand for payroll services, accountancy and deal advisory services. It also shows the changes in the activities in the services sector as a whole.

Agriculture, energy and natural resources: this section reports the changes in the agricultural conditions. It shows the changes in crop production, the market prices for the harvest, cost of farm inputs, storage costs, and any subsidies received in the agricultural sector. This section also shows the changes in the mining sector.

How can current economic conditions be used for analysis?

By businesses: The current economic conditions show the trends in demand. Businesses can use the data contained in this report to either scale up their production to match rising demand or lower production in case of shrinking demand. Furthermore, producers get to see the regions where their products are performing well and where the sale is dismal. This data can help them make informed decisions for targeted advertising to improve sales or to exit a particular market segment if the costs outweigh potential profits.

By governments and central banks: The data on the employment situation, consumer spending, inflation and agriculture are useful for the government and central banks to make informed policy decisions. The current economic situation effectively shows if the economy is contracting, stagnating, expanding or overheating. Therefore, this data is crucial in informing the type of policy that will be implemented by the central banks and the government. The policies can be expansionary, contractionary or stay the course, accordingly. Furthermore, the current economic conditions can be used as a scorecard to assess whether previous fiscal and monetary policies brought about the intended changes within the economy. If not, then the government and central banks will know how to tweak the policies to achieve the desired results in the economy.

Impact on Currency

When it comes to fundamental economic indicators, forex traders pay the most attention to how the data will affect future monetary policies by central banks.

Source: St. Louis FRED

If the current economic conditions data indicate that the economy is in a recession, forex traders can then anticipate lower GDP levels, and adopt a bearish stance on the currency. Furthermore, they can also anticipate that expansionary monetary policies will be put in place to spur economic growth. Lowering the interest rates as an expansionary policy is negative for a country’s currency. Although the cost of money will be cheaper, investments will also have lower returns relative to other countries. As a result, the currency depreciates.

Conversely, if the current economic data indicates that the economy is expanding, reaching peak levels, forex traders can anticipate higher levels of GDP; thus, adopting a bullish stance on the currency. For the authorities, monitoring the current economic conditions helps determine if the economic expansion is too rapid, resulting in overheating. To prevent the overheating, central banks and governments will implement contractionary monetary and fiscal policies. These policies are meant to ensure sustainable growth in the economy by making the cost of borrowing higher to discourage excessive borrowing. However, the rate of return on investments and government bonds increases. This increase leads to increased demand for investments in the country and consequently, the appreciation of the currency.

Sources of data

In the US, The Beige Book is published by the US Federal Reserve Board. This report is released eight times a year, two weeks before each Federal Open Market Committee meeting since it is used to guide their decision of short-term interest rates.

In the Euro Area, the current economic conditions are published by the Economic Research Institute ZEW.

Categories
Forex Basic Strategies

Inflation Expectations

Introduction

Inflation is one of the most tracked economic indicators by policymakers, economists, consumers, businesses and analysts. The effects of inflation are felt throughout the economy – no exceptions. Inflation expectations can help every player in the economy better to prepare themselves in anticipation of future inflation levels. Therefore, we must understand the how the anticipation of the inflation rate impacts the economy.

Understanding Inflation Expectations

Inflation is the increase in the general prices of goods and services that are produced within an economy, over a specific period. This increase in the prices of goods and services tends to erode the purchasing power of a currency. Therefore, assuming there is no increase in wages, consumers can only be able to purchase a lesser quantity of goods and services. There are several causes of inflation, but the primary cause occurs when more money is supplied in the economy relative to the wealth.

Inflation rate: is the percentage increase in the prices for a basket of goods and services over a specific period. It is used to compare inflation over different periods.

Inflation expectation is the opinion about the future rate of inflation. This opinion is derived from different players in different sectors of the economy to guarantee the validity and ensure it the data is comprehensively representative. These players include investors, central bankers, and consumers. Their inflation expectation is based on a variety of economic activities they intend to undertake.

How to Calculate Inflation Expectations

These are the two main methods of calculating inflation expectations.

Market Survey

The central banks conduct surveys to determine inflation expectations. Households, businesses and economic experts are polled to ascertain if their welfare has improved and what they anticipate. The questioned asked mostly includes household finances, inflation, investment activities, changes in the ease of doing business and inflation. The polled panel is nationally representative

Market-based Method

In this method, the expected inflation can be determined by the understanding of the price differential between government bonds and the Treasury Inflated Protected Securities (TIPS). The Treasury Inflated Protected Securities tends to increase the amount of the bonds in tandem with inflation.

In this case, the pricing difference = yield of a government bond – Yield of the TIPS

Let’s look at an example;

Suppose the yield of a 10-year bond is 5%, and the yield of a 10-year TIPS is 3%, the market pricing is 5% – 3% = 2%

The 2% can be said to be average annual expected inflation over the next ten years.

How can inflation Expectations be used for analysis?

The data on inflation expectations can be used by a variety of players in the economy. The inflation expectations data is the primary leading indicator of the rate of inflation in an economy.

Source: St. Louis FRED

Here are some of the ways different market participants can use the inflation expectations data.

Investment decision making: Businesses use the expected inflation data to make business decisions about future productions. They can choose to make changes on their product quality or quantity depending on the inflation outlook.

With expected inflations data, businesses can also make adjustments regarding factors of production. If the higher inflation rate is expected, businesses could opt into paying upfront for production inputs of their businesses. This upfront payment enables them to hedge against a future increase in the cost of businesses, thus protecting their bottom line. Furthermore, businesses can use this data during negotiating for employee contracts and wages.

Household decision making: Inflation expectations plays a vital role in households’ budgeting process. The data enables them to make rational decisions regarding expenditure, savings and investments. If they anticipate higher inflation, households can decide to put more funds into the purchase of essential products and cut back on savings and investments, since higher inflation erodes the value of money.

With lower inflation expectations, households might elect to increase their savings and investment activities since the potential increase in purchasing power will leave them with more disposable income.

Central banks and governments: One of the core mandates of the central banks is to ensure that the rate of inflations is kept below the targeted rate. Using the inflation expectations data, the central banks and governments can make informed policy decisions. These decisions are whether to implement expansionary or contractionary policies.

When the rate of inflation is expected to drop and result in deflation, central banks and the government will adopt expansionary monetary and fiscal policies. These policies include lowering interest rates to pump more money into the economy. Dramatically falling in the rates of inflation can be bad for the economy, as the reduced prices encourage complacency in the economy and could result in stagnation.

Conversely, expectations of higher rates of inflation will compel central banks and governments to adopt contractionary monetary and fiscal policies to avoid an overheating economy. Such policies will include increasing interest rates to make the cost of money more expensive and encourage investments and savings.

Impact on Currency

Since inflation expectations inform the decision of the central banks, it plays a vital role in the forex market.

When inflation expectations hint to lower rates of inflation, the outlook is negative for a country’s currency. The expansionary policies that ensue results in depreciation of the currency since the rate of return of investments will be less lucrative. The low-interest rates also make foreign bonds and treasury bills more attractive compared to local bonds; which results in a net outflow of investments.

Conversely, expectations of higher rates of inflation are positive for a country’s currency. The central banks will adopt contractionary policies like raising the interest rates, which makes an investment into the country more lucrative; increasing the demand for local currency hence appreciation.

Sources of Data

In the US, the inflation expectations data are released monthly on the last Friday of the month. The University of Michigan collates the data.

A comprehensive and historical breakdown of the US inflation expectations data can be accessed at St. Louis FRED here and here.

Statistics on global inflation expectations can be accessed at Trading Economics.

Categories
Forex Assets

JPYINR Asset Analysis


Introduction

JPYINR is a currency pair where JPY is the currency of Japan. On the other hand, the Indian Rupee (INR) is the currency of India. It is an exotic currency pair where the JPY is the first currency, and the INR is the second currency

Understanding JPYINR

In this currency pair, we can determine the value of INR, which is equivalent to one JPY. It is quoted as 1 JPY per X INR. For example, if the value of JPYINR is at 2.4458, then about 2.4 INR is required to purchase one JPY.

JPYINR Specification

Spread

The subtraction of Bid price and the Ask price is the spread. It is a charge that the broker takes from a trader when they open a trade. Therefore, the spread is controlled by the broker. This value changes with the execution model used for executing the trades.

Spread on ECN: 12 pips

Spread on STP: 17 pips

Fees

Fees is the charge that broker takes from traders. Fees in the currency market works almost the same of other financial market. Note that, STP accounts does not have any fee, but a few pips is applicable on ECN accounts.

Slippage

Slippage is the difference between the execution price and the entry market price. Slippage occurs due to the market volatility and the broker’s execution.

Trading Range in JPYINR

The trading range is the representation of the minimum, average, and the maximum volatility of this pair on the 1H, 4H, 1D, 1W, and 1M timeframe. Using these values, we can assess our profit/loss margin of trade. Hence, this proves to be a helpful risk management tool for all types of traders.

Procedure to assess Pip Ranges

  1. Add the ATR indicator to your chart
  2. Set the period to 1
  3. Add a 200-period SMA to this indicator
  4. Shrink the chart so you can assess a large time period
  5. Select your desired timeframe
  6. Measure the floor level and set this value as the min
  7. Measure the level of the 200-period SMA and set this as the average
  8. Measure the peak levels and set this as Max.


JPYINR Cost as a Percent of the Trading Range

With the volatility values from the above table, we can determine the chance of cost with the change of volatility. We have got the ratio between the total cost and the volatility values and converted into percentages.

ECN Model Account 

Spread = 12 | Slippage = 5 | Trading fee = 8

Total cost = Spread + Slippage + Trading Fee

= 12 + 5 + 8

Total cost = 25

STP Model Account

Spread = 12 | Slippage = 5 | Trading fee = 0

Total cost = Spread + Slippage + Trading Fee

= 12 + 5 + 0

Total cost = 17 

The Ideal way to trade the JPYINR

As per the above data, we can say that the JPYINR is very liquid and volatile currency pair. Hence, it is very easy to trade in this exotic-cross currency.

If we look at the timeframe, we can see that the volatility in the lower timeframe is higher compared to the higher timeframe. However, in the higher timeframe it is often hard for traders to trade as it requires a lot of trading equity. Based on the structure, we can say that it is better to follow the average cost of this currency pair

Another way to reduce the cost is to place orders as ‘limit’ and ‘stop’ instead of ‘market.’ In that case, there will be no cost for slippage on the total cost calculation. Therfore, the total cost will reduce by three pips.

Limit Model Account

Spread = 12 | Slippage = 0 | Trading fee = 0

Total cost = Spread + Slippage + Trading Fee

= 12 + 0 + 0

Total cost = 12

Categories
Forex Assets

JPYKES Asset Analysis

Introduction


In the JPYKES currency pair, JPY is considered as the currency of Japan. On the other hand, KES is the currency of Kenya. It is an exotic currency pair where the JPY is the first currency, and the KES is the second currency.

Understanding JPYKES

The JPYKES represents how much KES is required to have one JPY. It is quoted as 1 JPY per X KES. For example, if the value of this currency pair is at 1.0286, then about 1.0286 KES is required to purchase one JPY.

JPYKES Specification

Spread

Spread comes from the difference between the Ask price and the Bid price that a broker takes as a charge. The brokers control this value; therefore, traders don’t have to do anything with this. This value depends in the execution model used for executing the trades.

Spread on ECN: 19 pips

Spread on STP: 24 pips

Fees

Every broker takes fees from trading in any currency pair, which is similar to the stock market. However, there is no fee on STP accounts, but a few pips on ECN accounts.

Slippage

Slippage is the difference between the open price of the trade and the actual execution level. The main reason for slippage is the market volatility and the broker’s execution speed.

Trading Range in JPYKES

The trading range is the representation of the minimum, average, and the maximum volatility of this pair on the 1H, 4H, 1D, 1W, and 1M timeframe. Using these values, we can assess our profit/loss margin of trade. Hence, this proves to be a helpful risk management tool for all types of traders.

Procedure to assess Pip Ranges

  1. Add the ATR indicator to your chart
  2. Set the period to 1
  3. Add a 200-period SMA to this indicator
  4. Shrink the chart so you can assess a large time period
  5. Select your desired timeframe
  6. Measure the floor level and set this value as the min
  7. Measure the level of the 200-period SMA and set this as the average
  8. Measure the peak levels and set this as Max.

JPYKES Cost as a Percent of the Trading Range

With the volatility values from the above table, we can determine the chance of cost with the change of volatility. All got the ratio between total cost and volatility values and converted into percentages.

ECN Model Account 

Spread = 19 | Slippage = 5 | Trading fee = 8

Total cost = Spread + Slippage + Trading Fee

= 19 + 5 + 8

Total cost = 32

STP Model Account

Spread = 19 | Slippage = 5 | Trading fee = 0

Total cost = Spread + Slippage + Trading Fee

= 19 + 5 + 0

Total cost = 24 

The Ideal way to trade the JPYKES

The JPYKES is a currency pair that has sufficient volatility and liquidity. Therefore, it is simpler to trade this currency pair.

The percentage values are above 500% in a lower timeframe. This means that the costs are low regardless of the timeframe and volatility you trade.

Digging it a little deeper, the cost increases when the volatility decreases, and the cost decrease when the volatility increases. In a lower timeframe, this pair is very volatile at above 600%; therefore, traders should be cautious to trade it.

However, the best time to trade in this pair is when the volatility remains at the average value. In that case, this pair can provide a decent profit with balanced volatility and cost.

Furthermore, traders can quickly minimize their costs by using orders as ‘limit’ and ‘stop’ instead of ‘market.’ By using these orders, the slippage will not be considered in the calculation of total costs. Therefore, the total cost will reduce by five pips.

Limit Model Account

Spread = 19 | Slippage = 0 | Trading fee = 0

Total cost = Spread + Slippage + Trading Fee

= 19 + 0 + 0

Total cost = 19

Categories
Forex Assets

CAD/BRL Asset Analysis

Introduction

CAD/BRL is an exotic currency pair. CAD is the Canadian Dollar, and the BRL is Brazilian Real– the official currency of Brazil. For this pair, the CAD is the base currency and BRL the quote currency. Therefore, the exchange rate for the CAD/BRL pair represents the amount of BRL that can be bought by 1 CAD. Let’s say the exchange rate for the pair is 4.1564; this means that 1 CAD buys 4.1564 BRL.

CAD/BRL Specification

Spread

When trading a currency pair, the spread is the difference in the price at which you can buy the pair and that which you can sell. Forex brokers earn their revenues using spread from traders.

The spread for the CAD/BRL pair is:

ECN: 31 pips | STP: 36 pips

Fees

Another way for forex brokers to earn revenues is by charging a commission for every trade made. The fee charged depends on the broker. STP accounts usually do not have a trading fee charged.

Slippage

When initiating a trade, you instruct your broker to execute the trade at a particular price. Slippage in forex is the difference between the price you instruct the broker and the price the broker executes your trade. The primary causes of slippage are prevailing volatility and your broker’s efficiency.

Trading Range in the CAD/BRL Pair

In forex, the price of currency constantly fluctuates across different timeframes. Trading range in forex helps to analyze the market volatility for a currency pair across different timeframes. The volatility for a currency pair can help a trader estimate the amount of profit or loss that is to be expected when trading in different timeframes.

Let’s say, for example, that for the 4-hour timeframe, the volatility of CAD/BRL pair is 10 pips. A trader can expect to either gain or lose $24 by trading a standard lot of the CAD/BRL pair.

The table below shows the trading range for CAD/BRL.

The Procedure to assess Pip Ranges

  1. Add the ATR indicator to your chart
  2. Set the period to 1
  3. Add a 200-period SMA to this indicator
  4. Shrink the chart so you can determine a larger period
  5. Select your desired timeframe
  6. Measure the floor level and set this value as the min
  7. Measure the level of the 200-period SMA and set this as the average
  8. Measure the peak levels and set this as Max.


CAD/BRL Cost as a percentage of the Trading Range

Expressing trading costs as a percentage of the trading range can help traders determine the difference in the trading costs across various timeframes. It is worth noting that these costs are calculated as Percentage of pips in the different timeframes.

Total cost = Slippage + Spread + Trading Fee

The tables below show the percentage costs to be expected when trading the CAD/BRL pair.

ECN Model Account

Spread = 31 | Slippage = 2 | Trading fee = 1

Total cost = 34

STP Model Account

Spread = 36 | Slippage = 2 | Trading fee = 0

Total cost = 38

The Ideal Timeframe to Trade CAD/BRL

From the above cost analysis, we can observe that shorter timeframes when volatility is lower, have higher trading costs. The highest trading costs for both the ECN and the STP accounts are during the 1-hour timeframe, which coincides with the least volatility of 0.4 pips. The least trading costs for either account is at the 1-month timeframe coinciding with the highest volatility of 42.3 pips.

You can also notice that the trading costs reduce as the volatility increases across timeframes. For shorter-term traders, opening CAD/BRL trades when volatility is above average can help reduce trading costs.

Another method which forex traders can implement to reduce trading costs is by using limit orders instead of forex market orders. Forex limit orders eliminate the costs associated with slippage. Here’s how it works.

ECN Account Using Limit Model Account

Total cost = Slippage + Spread + Trading fee

= 0 + 31 + 1 = 32

You can notice that trading costs have marginally reduced. The highest trading cost has reduced from 576.27% to 542.37%.


Categories
Forex Course

151. Summary Trading Breakouts and Fake Outs.

Introduction

In the past few articles, we have discussed a lot of things related to trading breakouts and fakeout. The purpose of this article is to summarize the fundamentals of these concepts and understand what we have discussed until now.

Breakout trading is one of the most popular and straightforward approach to trade the market. Most of the technical indicators lagged in the market, but the breakout trading is a way to finish this lag between the entry and the trading signal. By trading the breakout, the goal of the trader is to enter the market right when the breakout happened and holds the trade for the brand new higher high or lower low.

Volatility plays a significant role in the breakout trading to ride the longer moves, in the stock market you can use the volume indicator to find out the market volatility, but in forex trading, there is no way to see the volume visually. To overcome this issue, there are various indicators in the market used by the traders to gauge the market volatility of any underlying asset. Using these below indicators, you can measure the volatility.

  1. Bollinger Bands.
  2. Moving Average.
  3. Average True Range {ATR}.

There are usually two types of breakouts which are very popular among traders.

  1. Continuation.
  2. Reversal.

Continuation – Continuation is a type of pattern trading where the traders look for a trending market. When the price action pulls back enough and break the most recent higher high in an uptrend, it means the breakout happens, and any long trade will be highly appreciated.

Reversals – Reversal trading is also an effective way to trade the top and bottom of the market. In reversal trading, traders often look for the most recent higher low to break in an uptrend to take the selling trade. Conversely, the break of the most recent lower high is a signal to go long in an underlying asset. Breakout is the only way to catch the top and bottom in the market.

Fakeouts

A fakeout is a term used in a technical analysis which used to refer to a situation where the trader enters into a trade, but the signal never developed and the market immediately reverse against the trader. These are the most frustrating situations for the traders to deal with. Every newbie to the professionals face these kinds of situations in their trading, and it can cause a considerable amount of losses to the trader.

Most of the traders often wonder why these things happened with them. The primary causes behind these problems are the traders sometimes didn’t scan the market very well, or they didn’t focus on all the market variables. For example, sometimes news did this kind of unnecessary movements, so before entering in the trade always check is there any news coming up in the upcoming hours, if yes then ignore the trade and look for another opportunity.

Another thing does not add many indicators to your price chart, this thing will confuse you, and you will end up entering a trade way earlier. Make your charts clean and straightforward, and always use only one type of strategy to trade the market. The best way to avoid fakeouts is to fade the breakout. Fading the breakout means to wait for the price action to hold above or below the significant level then only activate the trade, do not make the mistake of entering in a trade when the price action breaks the major level, always wait for the confirmation first to avoid the unnecessary losses.

Categories
Popular Questions

When is london forex session?

Forex trading is a lucrative industry that has attracted traders from all over the globe. One of the reasons for its popularity is its flexibility in terms of trading sessions. The London Forex session is one of the most important trading sessions in the Forex market. In this article, we will delve into the intricacies of the London Forex session, including its time, importance, and trading strategies.

London Forex Session Time

The London Forex session is also known as the European session and is the second busiest trading session in the Forex market. It typically starts at 8:00 AM GMT and ends at 4:00 PM GMT. This session overlaps with the Asian and American sessions, making it a highly volatile and liquid trading period. During this session, the major currency pairs like EUR/USD, GBP/USD, and USD/JPY experience high volatility, making it the most active trading period.

Importance of the London Forex Session

The London Forex session is important for several reasons. Firstly, it is the financial hub of Europe and accounts for nearly 30% of the global Forex trading volume. The session is characterized by the presence of major financial institutions, including banks, hedge funds, and investment firms. The presence of these institutions drives market liquidity, making it easier for traders to enter and exit trades.

Secondly, the London session overlaps with the Asian and American sessions, creating a high degree of volatility. Traders can take advantage of this volatility to make profits by entering and exiting trades quickly. Additionally, news releases and economic events from Europe can impact the Forex market, making it crucial for traders to monitor the London Forex session.

Trading Strategies for the London Forex Session

Traders can use several strategies to trade during the London Forex session. One of the most popular strategies is the breakout strategy. This strategy involves identifying key support and resistance levels and waiting for a breakout to occur. Traders can enter a long position if the price breaks above the resistance level or a short position if the price breaks below the support level.

Another popular strategy is the trend-following strategy. This strategy involves identifying the direction of the trend and entering a trade in the same direction. Traders can use technical indicators like moving averages to identify the trend direction.

Lastly, traders can use the news trading strategy to trade during the London Forex session. This strategy involves monitoring news releases and economic events and entering trades based on the news outcome. Traders need to be cautious when using this strategy as news releases can cause significant market volatility.

Conclusion

The London Forex session is an important trading period in the Forex market. It is characterized by high liquidity, volatility, and the presence of major financial institutions. Traders can use several strategies to trade during this session, including the breakout, trend-following, and news trading strategies. It is important for traders to be aware of the time, importance, and trading strategies for the London Forex session to make informed trading decisions.

Categories
Popular Questions

How to avoid margin calls in forex?

Forex trading, like any other investment, carries a certain level of risk. One of the risks in forex trading is the possibility of getting a margin call, which occurs when the equity in a trading account falls below the required margin level. A margin call can result in the closure of open positions and the loss of investment capital. In this article, we will discuss how to avoid margin calls in forex.

Understand Margin Requirements

The first step to avoiding margin calls is to understand the margin requirements of your broker. Margin is the amount of money required to hold a position in the forex market. The margin requirement varies from broker to broker and can range from 1% to 10% or more. For example, if you want to trade a standard lot of $100,000 with a 1% margin requirement, you will need to have $1,000 in your account.

Keep Sufficient Margin

To avoid a margin call, you must maintain sufficient margin in your account. This means that you should not over-leverage your account and only take positions that you can afford. Over-leveraging occurs when you take a position that is too large for your account size. For example, if you have an account balance of $5,000 and you take a position of $100,000, you are over-leveraging your account.

Use Stop Loss Orders

Another way to avoid margin calls is to use stop loss orders. A stop loss order is an order that is placed to close a position automatically when the price reaches a certain level. By using a stop loss order, you can limit your losses and protect your account from a margin call. It is important to note that stop loss orders are not guaranteed and can be subject to slippage during periods of high volatility.

Monitor Your Trades

Monitoring your trades is an important part of avoiding margin calls. You should regularly review your open positions and evaluate their risk levels. If a position is losing money and the market conditions are not in your favor, it may be wise to close the position and take the loss. By monitoring your trades, you can avoid large losses and protect your account from a margin call.

Avoid Trading During News Releases

Trading during news releases can be risky and increase the likelihood of a margin call. News releases can cause sudden and unpredictable movements in the forex market, which can result in significant losses. It is recommended that you avoid trading during major news releases, such as non-farm payroll, interest rate decisions, and GDP reports.

Conclusion

In conclusion, avoiding margin calls in forex requires a combination of understanding margin requirements, keeping sufficient margin, using stop loss orders, monitoring your trades, and avoiding trading during news releases. It is important to remember that forex trading carries a certain level of risk, and it is essential to manage that risk to protect your investment capital. By following these tips, you can reduce the risk of a margin call and improve your chances of success in the forex market.

Categories
Popular Questions

Forex how to calculate how many pips?

Forex trading is a popular way to invest and trade in financial markets. It involves buying and selling currencies in order to profit from the changes in their value. It is important for traders to understand how to calculate pips in order to accurately monitor and manage their trades.

What is a pip?

A pip is a unit of measurement used in Forex trading to measure the change in value between two currencies. It stands for percentage in point, and is the smallest unit of movement in a currency pair. In most currency pairs, one pip is equal to 0.0001 of the quoted price.

For example, if the USD/JPY currency pair is trading at 121.50, and it moves up to 121.51, that is a one pip movement. If it moves up to 122.50, that is a 100 pip movement.

Why is it important to calculate pips?

Calculating pips is important for several reasons. Firstly, it helps traders to monitor the value of their trades. By knowing how many pips a trade has moved, traders can determine how much profit or loss they have made.

Secondly, calculating pips helps traders to manage their risk. By setting stop-loss orders based on the number of pips, traders can limit their potential losses if the market moves against them.

Finally, calculating pips can help traders to determine their position size. By knowing how many pips a trade is likely to move, traders can calculate how many lots they need to trade in order to achieve their desired profit or risk levels.

How to calculate pips

Calculating pips is relatively simple. The formula for calculating pips is:

Pip = (1 pip / exchange rate) x lot size

Let’s break this down into smaller parts.

Firstly, we need to know the exchange rate of the currency pair we are trading. This is usually expressed as a four or five-digit number. For example, if the USD/JPY currency pair is trading at 121.50, the exchange rate is 1.2150.

Next, we need to determine the lot size we are trading. A lot is a standard unit of measurement in Forex trading, and is used to determine the size of a trade. Lot sizes can vary depending on the broker and the account type, but typically range from 0.01 to 100 lots.

Once we have determined the exchange rate and lot size, we can use the formula to calculate the number of pips.

Let’s take an example. Suppose we are trading the EUR/USD currency pair at an exchange rate of 1.1200, and we are trading 0.1 lots. To calculate the number of pips, we would use the following formula:

Pip = (1 pip / 1.1200) x 0.1 lots

Pip = 0.00008928

So, in this example, one pip is equal to 0.00008928. If the EUR/USD currency pair moves up to 1.1300, that is a 100 pip movement, which would result in a profit of $10 for a 0.1 lot trade.

Conclusion

Calculating pips is an important skill for Forex traders. It helps them to monitor the value of their trades, manage their risk, and determine their position size. By using the formula outlined above, traders can easily calculate the number of pips in a trade, and use this information to make informed trading decisions.

Categories
Popular Questions

How to use fractal indicator in forex?

The fractal indicator is a popular tool used in the forex market for analyzing financial charts. It is a technical analysis tool that helps traders identify potential price reversals by identifying key levels of support and resistance. The fractal indicator is a useful tool for traders of all levels, from beginners to advanced traders. In this article, we will explore how to use the fractal indicator in forex, including what it is, how it works, and how to interpret the signals it generates.

What is the Fractal Indicator?

The fractal indicator is a technical analysis tool that helps traders identify potential price reversals in the forex market. It is based on the concept of fractals, which are mathematical patterns that occur in nature. In the forex market, fractals represent key levels of support and resistance that can be used to predict future price movements.

The fractal indicator consists of a series of arrows that appear on a chart. These arrows indicate potential price reversals, with the up arrows indicating potential resistance levels and the down arrows indicating potential support levels. The fractal indicator is a versatile tool that can be used in combination with other technical indicators to provide a more complete picture of the market.

How Does the Fractal Indicator Work?

The fractal indicator works by identifying key levels of support and resistance in the forex market. These levels are based on fractals, which are patterns that occur in price charts. Fractals are formed when a price movement breaks a previous high or low point, signaling a potential change in the direction of the trend.

The fractal indicator identifies these key levels of support and resistance by analyzing the price chart and looking for patterns that indicate a potential price reversal. When a fractal is formed, an arrow appears on the chart indicating the potential reversal point. This can be used by traders to enter or exit trades, depending on their trading strategy.

How to Interpret the Fractal Indicator Signals

The fractal indicator generates signals that can be used by traders to enter or exit trades. The signals are based on the arrows that appear on the chart, with up arrows indicating potential resistance levels and down arrows indicating potential support levels.

When a fractal is formed, it indicates a potential price reversal. Traders can use this signal to enter a trade in the opposite direction of the previous trend. For example, if the previous trend was up, and a down arrow appears, this could signal a potential reversal, and a trader could enter a short position.

The fractal indicator can also be used to confirm other technical indicators. For example, if a moving average crossover occurs at the same time as a fractal signal, this could provide additional confirmation of a potential price reversal.

Conclusion

The fractal indicator is a useful tool for traders of all levels in the forex market. It helps identify key levels of support and resistance, which can be used to predict potential price reversals. By using the fractal indicator in combination with other technical indicators, traders can gain a more complete picture of the market and make more informed trading decisions. When using the fractal indicator, it is important to remember that it is just one tool in a trader’s toolbox and should be used in combination with other analysis techniques to make informed trading decisions.

Categories
Popular Questions

How to send balikbayan box usa to philippines forex?

Sending a balikbayan box from the USA to the Philippines is a common way for Filipino expatriates to send gifts and other items to their loved ones back home. Balikbayan boxes are large boxes that can hold a variety of items, including clothing, electronics, toys, and other household items. To send a balikbayan box from the USA to the Philippines, one needs to follow a few simple steps.

The first step is to find a reliable and trustworthy balikbayan box shipping company. There are many companies that offer this service, but it is important to choose one that has a good reputation and a proven track record of delivering boxes on time and in good condition. Some of the most popular companies include Forex, LBC, and Atlas Shippers International.

Once you have chosen a shipping company, the next step is to prepare the balikbayan box. This involves packing the box with items you want to send to the Philippines. You can include a variety of items, such as clothes, shoes, toys, electronics, and other household items. It is important to pack the items carefully and securely to ensure they do not get damaged during transit.

After packing the box, it is time to seal it and label it with the recipient’s name and address. It is important to write the name and address in clear and legible letters to ensure that the box is delivered to the correct person. It is also a good idea to include your contact information in case there are any issues with the delivery.

The next step is to bring the box to the shipping company’s office or drop-off location. Depending on the company, you may be able to drop the box off at a local office, or you may need to arrange for a pickup. It is important to follow the shipping company’s instructions carefully to ensure that the box is delivered on time and in good condition.

Once the box is picked up by the shipping company, you can track its progress online using the tracking number provided by the company. This will allow you to monitor the box’s progress and ensure that it is delivered on time.

Overall, sending a balikbayan box from the USA to the Philippines is a simple and straightforward process. By choosing a reliable shipping company, packing the box carefully, and following the shipping company’s instructions, you can ensure that your loved ones receive their gifts and other items in good condition and on time.

Categories
Popular Questions

What type credt card can be used for forex?

Forex or foreign exchange trading is a popular investment option for many traders worldwide. It involves the buying and selling of currencies. It is a highly volatile and fast-paced market that requires traders to have access to various payment options, including credit cards. Credit cards are a convenient and secure way to make payments in the forex market, but not all credit cards are suitable for forex trading. In this article, we will explore the different types of credit cards that can be used for forex trading.

Credit cards are issued by financial institutions, and they allow individuals to make purchases without having to pay immediately. Instead, the cardholder can pay for the purchases at a later date, usually at the end of the month. Credit cards come with different features and benefits, including rewards, cashback, and travel benefits. However, not all credit cards are suitable for forex trading.

The first type of credit card that can be used for forex trading is a prepaid credit card. Prepaid credit cards are not linked to a bank account and require the cardholder to load funds onto the card before they can use it. Prepaid credit cards are convenient for forex traders as they allow them to control their spending and limit their exposure to the market. They also provide a secure way to make payments as they are not linked to a bank account.

Another type of credit card that can be used for forex trading is a debit card. Debit cards are linked to a bank account, and the funds are deducted from the account when a transaction is made. Debit cards are convenient for forex traders as they provide easy access to funds and can be used to withdraw cash from ATMs. However, debit cards may not have the same level of security as prepaid credit cards.

Credit cards that are linked to a bank account can also be used for forex trading. These credit cards are also known as traditional credit cards. They provide the cardholder with a credit limit, which they can use to make purchases. These credit cards are convenient for forex traders as they provide easy access to funds and can be used to make purchases online. However, traditional credit cards may have higher fees and interest rates, which can increase the cost of forex trading.

In conclusion, credit cards are a convenient and secure way to make payments in the forex market. However, not all credit cards are suitable for forex trading. Prepaid credit cards, debit cards, and traditional credit cards can be used for forex trading, but traders need to consider the fees, interest rates, and security features of each card before making a decision. It is recommended that traders choose a credit card that offers low fees, a secure payment system, and a high level of protection against fraud.

Categories
Popular Questions

Forex why do trades keep going against me?

As a Forex trader, you may have experienced a situation where trades keep going against you. This can be a frustrating experience, especially if you’ve invested a lot of time and effort into analyzing the market. However, it’s important to understand that this is a common occurrence in Forex trading, and there are several reasons why it can happen.

Lack of proper analysis

One of the primary reasons why trades keep going against you is a lack of proper analysis. Forex trading requires a lot of research and analysis, and it’s important to have a clear understanding of the market before you place a trade. This means keeping up with the latest news and events that could impact the market, as well as understanding technical analysis tools such as charts and indicators.

If you’re not properly analyzing the market, you may be placing trades based on incomplete information, which can lead to losses. It’s important to take the time to thoroughly analyze the market before making any decisions. This may mean spending more time researching and analyzing, as well as seeking out expert advice and mentorship.

Overtrading

Another reason why trades may keep going against you is overtrading. Overtrading refers to the act of placing too many trades, which can lead to increased risk and losses. This can happen when traders become too emotionally invested in the market and feel the need to constantly be making trades.

It’s important to remember that quality is more important than quantity when it comes to Forex trading. Rather than placing multiple trades, focus on identifying high-quality trades that have a higher likelihood of success. This may mean being more selective in the trades you choose to make, as well as being patient and waiting for the right opportunities to present themselves.

Lack of risk management

Another common reason why trades may keep going against you is a lack of proper risk management. Risk management refers to the process of minimizing potential losses by setting stop-loss orders and managing your position sizes.

If you’re not properly managing your risk, you may be placing trades that are too large or not setting stop-loss orders, which can lead to significant losses. It’s important to take the time to properly manage your risk and set appropriate stop-loss orders to minimize potential losses.

Emotional trading

Finally, emotional trading can also lead to trades going against you. Forex trading can be a highly emotional experience, and it’s important to keep your emotions in check when making decisions. This means being able to control your fear, greed, and other emotions that can cloud your judgment.

It’s important to remember that Forex trading is a long-term game, and losses are a natural part of the process. Rather than letting your emotions drive your decision-making, focus on remaining disciplined and sticking to your trading plan.

In conclusion, there are several reasons why trades may keep going against you in Forex trading. By taking the time to properly analyze the market, avoiding overtrading, managing your risk, and controlling your emotions, you can increase your chances of success and minimize potential losses. Remember, Forex trading is a long-term game, and success requires patience, discipline, and a commitment to continuous learning and improvement.

Categories
Popular Questions

What is an ecn account in forex?

Forex trading involves the buying and selling of currencies in the international market. The trading is facilitated by various platforms and accounts offered by brokers. One such account that has gained popularity among traders is the ECN account. In this article, we will dive deep into what an ECN account in forex is, its features, advantages, and disadvantages.

ECN stands for Electronic Communication Network. An ECN account is a type of forex trading account that connects traders with liquidity providers, such as banks and financial institutions, using an electronic network. The network matches buy and sell orders from different participants in the market, providing direct access to liquidity.

Features of an ECN Account:

1. Direct Market Access (DMA): ECN accounts provide direct market access to liquidity providers, enabling traders to execute trades without the intervention of a dealing desk.

2. No Dealing Desk (NDD): An ECN account eliminates the dealing desk, thereby removing the possibility of conflicts of interest between the broker and the trader.

3. Variable spreads: The spreads in an ECN account are variable and depend on the prevailing market conditions. The spreads are usually lower than those in a standard account.

4. Commission-based: ECN accounts charge a commission for each trade executed. The commission is usually a small percentage of the trade volume.

5. Depth of Market (DOM): ECN accounts display the depth of the market, showing the liquidity providers’ bids and asks, enabling traders to make informed decisions.

Advantages of an ECN Account:

1. Transparency: ECN accounts offer transparency in pricing and execution. Traders can see the market depth and execution prices, eliminating the possibility of price manipulation.

2. Tight Spreads: ECN accounts offer tight spreads, which are beneficial to traders, especially those who trade frequently.

3. Fast Execution: ECN accounts provide fast execution, as trades are executed directly with liquidity providers, eliminating the dealing desk’s intervention.

4. No Re-quotes: ECN accounts do not offer re-quotes, ensuring that trades are executed at the desired price.

5. Scalping: ECN accounts are suitable for scalping strategies, as they offer fast execution and tight spreads.

Disadvantages of an ECN Account:

1. Higher Minimum Deposit: ECN accounts require a higher minimum deposit than standard accounts.

2. Commission-based: ECN accounts charge a commission for each trade executed, which may increase the trading costs.

3. Complexity: ECN accounts may be complex for novice traders to understand, as they require an understanding of market depth and order types.

4. Volatility: ECN accounts may be affected by market volatility, resulting in wider spreads and higher trading costs.

Conclusion:

In conclusion, an ECN account in forex is a type of trading account that provides direct access to liquidity providers, eliminating the dealing desk’s intervention. ECN accounts offer transparency, fast execution, tight spreads, and are suitable for scalping strategies. However, they require a higher minimum deposit, charge a commission for each trade executed, may be complex for novice traders, and may be affected by market volatility. Traders should weigh the advantages and disadvantages of an ECN account before deciding to open one.

Categories
Popular Questions

How much is traded in the forex market daily?

The foreign exchange market, commonly known as forex, is the largest financial market in the world, where currencies are traded 24 hours a day, five days a week. Forex trading is the process of buying and selling currencies in order to make a profit. The daily trading volume in the forex market is massive, with trillions of dollars being traded each day. According to the Bank for International Settlements (BIS), the average daily trading volume in the forex market was $6.6 trillion in 2019.

The forex market is a decentralized market, which means it has no central exchange or clearinghouse. Instead, trading is conducted electronically over-the-counter (OTC) through a network of banks, brokers, and other financial institutions. The forex market is open 24 hours a day, five days a week, starting from Sunday afternoon and ending on Friday evening in the New York time zone.

The forex market is unique in that it is highly liquid, meaning that there are always buyers and sellers available to trade with. This is because forex trading involves the exchange of one currency for another, so there is always a demand for currencies. Additionally, the forex market is highly accessible, with low barriers to entry, making it easy for individuals and institutions to participate in trading.

The forex market is dominated by major currencies such as the US dollar, euro, Japanese yen, British pound, Swiss franc, and Australian dollar. These currencies are traded in pairs, with the exchange rate representing the value of one currency in relation to another. For example, the EUR/USD pair represents the value of one euro in US dollars.

The forex market is influenced by a variety of factors, including economic indicators, geopolitical events, and central bank policies. Traders use a range of strategies and tools to analyze the market and make trading decisions, including technical analysis, fundamental analysis, and sentiment analysis.

The forex market is also known for its high degree of leverage, which allows traders to control a large amount of currency with a small investment. This can lead to significant profits, but also significant losses if the market moves against the trader.

Despite its size and complexity, the forex market is highly regulated in order to protect traders and ensure fair and transparent trading. Regulatory bodies such as the Commodity Futures Trading Commission (CFTC) in the US and the Financial Conduct Authority (FCA) in the UK oversee forex brokers and enforce strict rules and guidelines.

In conclusion, the forex market is the largest financial market in the world, with trillions of dollars being traded each day. The market is highly liquid and accessible, with low barriers to entry, making it a popular choice for traders of all levels. The forex market is influenced by a range of factors and is highly regulated to ensure fair and transparent trading. While forex trading can lead to significant profits, it also carries a high degree of risk and should be approached with caution.

Categories
Popular Questions

How to become the best forex trader?

Forex trading is a lucrative business that has attracted many people to invest in it. However, becoming the best forex trader is not an easy task. It requires a lot of dedication, hard work, and patience. In this article, we will discuss how to become the best forex trader.

1. Learn the Basics of Forex Trading

Before you start trading, it is essential to learn the basics of forex trading. You need to understand the terminologies used in forex trading, the different types of orders, and the various trading strategies. There are many online resources that can help you learn forex trading, such as video tutorials, e-books, and online courses.

2. Develop a Trading Plan

A trading plan is essential to become a successful forex trader. It outlines your trading goals, your strategy, and the risk management tools you will use. Your plan should be realistic and based on your trading style, personality, and financial goals.

3. Choose a Reliable Broker

Choosing a reliable broker is crucial to your success as a forex trader. A good broker should be regulated and have a good reputation in the industry. You should also check their trading platform, customer support, and the fees they charge.

4. Practice on a Demo Account

Before you start trading with real money, it is advisable to practice on a demo account. A demo account allows you to practice trading without risking your money. It also helps you to familiarize yourself with the trading platform and the different trading strategies.

5. Manage Your Risk

Risk management is a crucial aspect of forex trading. You need to have a risk management plan in place to protect your capital. You should never risk more than you can afford to lose. It is also essential to use stop-loss orders to limit your losses.

6. Keep a Trading Journal

Keeping a trading journal is essential to becoming a successful forex trader. It helps you to track your progress, identify your strengths and weaknesses, and improve your trading performance. Your trading journal should include your trading plan, the trades you took, the reasons for taking them, and the outcome.

7. Continuously Learn and Improve

Forex trading is a dynamic industry, and there is always something new to learn. To become the best forex trader, you need to continuously learn and improve your skills. You should attend webinars, read books, and follow the latest news and trends in the industry.

In conclusion, becoming the best forex trader requires a lot of dedication, hard work, and patience. You need to learn the basics of forex trading, develop a trading plan, choose a reliable broker, practice on a demo account, manage your risk, keep a trading journal, and continuously learn and improve your skills. With these tips, you can become a successful forex trader and achieve your financial goals.

Categories
Popular Questions

How do the fees on forex currency contracts work?

Forex (foreign exchange) trading is a global market where traders can buy and sell currencies from around the world. Forex trading is a lucrative market that presents opportunities for traders to profit from the price movements of different currencies. However, to trade forex, traders have to pay fees on their currency contracts.

Forex fees are the costs that traders incur when they trade currencies. These fees vary depending on the broker used, the type of account held, the currency pairs traded, and the trading platform used. Some forex fees are charged upfront, while others are charged on a per-trade basis. Understanding how forex fees work is essential for traders to make informed decisions when trading currencies.

Types of Forex Fees

1. Spread

The spread is the difference between the buy and sell price of a currency pair. The spread is the primary source of income for forex brokers. The spread can be fixed or variable, depending on the broker. Fixed spreads remain constant, regardless of market conditions. Variable spreads fluctuate depending on market volatility. The spread is usually expressed in pips (percentage in point), which is the smallest price change that a currency pair can make.

2. Commission

Some forex brokers charge a commission on top of the spread. The commission is a fee charged per lot (unit of currency) traded. The commission varies depending on the broker and the account type. Commission-based accounts usually have lower spreads than non-commission-based accounts.

3. Swap

The swap is the interest paid or earned for holding a currency position overnight. Forex trading involves borrowing one currency to buy another. The interest rate differential between the two currencies determines the swap rate. If the interest rate on the currency being bought is higher than the one being sold, the trader earns a swap credit. If the interest rate on the currency being sold is higher than the one being bought, the trader is charged a swap fee.

4. Inactivity Fees

Some brokers charge inactivity fees if a trader does not trade for a specific period. The inactivity fee is charged to cover the cost of maintaining the trader’s account. The inactivity fee varies depending on the broker and the account type.

5. Deposit and Withdrawal Fees

Forex brokers may charge fees for depositing and withdrawing funds from a trading account. The fees vary depending on the payment method used. Bank transfers usually have higher fees than credit card deposits. Some brokers may offer free deposits and withdrawals for specific payment methods.

6. Platform Fees

Some forex brokers charge fees for using their trading platforms. The platform fees are usually included in the spread or commission charged. The platform fees vary depending on the broker and the trading platform used.

Conclusion

Forex fees are an essential aspect of currency trading. Traders need to understand the different types of forex fees to make informed decisions when trading currencies. The fees charged by forex brokers vary depending on the broker, account type, currency pairs traded, and trading platform used. Traders should compare the fees charged by different brokers before choosing one to trade with. Additionally, traders should always read and understand the broker’s fee schedule before opening a trading account.

Categories
Popular Questions

How do i invest in forex?

Forex, or foreign exchange, is the world’s largest financial market with a daily turnover of over $5 trillion. It involves the buying and selling of currencies with the aim of making a profit from the fluctuations in their value. Investing in forex can be a lucrative venture, but it also comes with risks. In this article, we will explore the steps you need to take to invest in forex.

Step 1: Learn the Basics

The first step to investing in forex is to understand the basics. You need to learn how the forex market works, the different currency pairs, and the factors that affect their value. You can start by reading books, taking online courses, or watching educational videos. You can also join online forums or social media groups where you can interact with other forex traders and learn from their experiences.

Step 2: Choose a Broker

To invest in forex, you need to find a broker that offers forex trading services. A broker is a company that provides you with a trading platform and access to the forex market. You should choose a broker that is regulated by a reputable financial authority and has a good reputation in the industry. You should also consider the trading fees, account types, and customer support when choosing a broker.

Step 3: Open a Trading Account

Once you have chosen a broker, you need to open a trading account. Most brokers offer different account types, such as standard, mini, or micro accounts. You should choose the account type that suits your trading style and budget. You will also need to provide some personal information and documents, such as your ID and proof of address, to verify your account.

Step 4: Fund Your Account

After opening a trading account, you need to fund it with money to start trading. Most brokers offer different payment methods, such as bank transfer, credit card, or e-wallets. You should choose the payment method that is convenient for you and has low transaction fees. You should also consider the minimum deposit required by the broker and the leverage offered.

Step 5: Start Trading

Once you have funded your trading account, you can start trading. You need to choose the currency pairs you want to trade and decide whether to buy or sell them. You should also set your stop-loss and take-profit levels to manage your risk and maximize your profit. You can use technical analysis tools, such as charts and indicators, to analyze the market and make trading decisions.

Step 6: Monitor Your Trades

After placing your trades, you should monitor them regularly to see how they are performing. You should also keep up-to-date with the latest news and events that can affect the forex market. You can use economic calendars and news websites to stay informed. You should also adjust your trading strategy as needed to adapt to changing market conditions.

Conclusion

Investing in forex can be a profitable venture, but it requires a lot of knowledge, skills, and discipline. You need to learn the basics, choose a reputable broker, open a trading account, fund it, start trading, and monitor your trades. You should also have a trading plan and stick to it, manage your risk, and avoid emotional trading. With the right approach, you can succeed in the forex market and achieve your financial goals.

Categories
Popular Questions

How to build an algorithm for forex?

Forex trading is a highly lucrative business that requires a lot of skill, strategy, and knowledge of the market. One of the best ways to succeed in forex trading is to use an algorithm. An algorithm is a set of rules and instructions that a trader can use to automate their trading strategy. It can help you to make better trading decisions, reduce risk, and increase profitability. In this article, we will explain how to build an algorithm for forex.

Step 1: Define Your Trading Strategy

The first step in building an algorithm for forex is to define your trading strategy. This involves identifying the indicators or signals that you will use to make trading decisions. There are many different strategies that traders use in forex, and each one has its own set of rules and indicators.

For example, you may decide to use a moving average crossover strategy, where you buy when the short-term moving average crosses above the long-term moving average, and sell when the short-term moving average crosses below the long-term moving average. Alternatively, you may use a momentum strategy, where you buy when the price is trending upward and sell when the price is trending downward.

Whatever strategy you choose, it is important to define it clearly and identify the indicators that you will use to make trading decisions.

Step 2: Identify Your Trading Rules

Once you have defined your trading strategy, the next step is to identify your trading rules. This involves specifying the exact conditions that must be met before you enter or exit a trade.

For example, if you are using a moving average crossover strategy, you may have the following rules:

– Buy when the short-term moving average (e.g., 20-day) crosses above the long-term moving average (e.g., 50-day).

– Sell when the short-term moving average crosses below the long-term moving average.

It is important to be specific and precise when defining your trading rules. This will ensure that your algorithm operates effectively and avoids making costly mistakes.

Step 3: Code Your Algorithm

Once you have defined your trading strategy and rules, the next step is to code your algorithm. This involves writing a computer program that will automatically execute your trading strategy based on the indicators and rules that you have specified.

There are many programming languages that you can use to code your algorithm, including Python, C++, and Java. The choice of programming language will depend on your personal preferences and the specific requirements of your trading strategy.

When coding your algorithm, it is important to test it thoroughly to ensure that it operates as intended. This involves backtesting your algorithm using historical data to see how it would have performed in the past. You can also forward-test your algorithm by trading with small amounts of real money to see how it performs in real-time conditions.

Step 4: Monitor and Adjust Your Algorithm

Once you have coded and tested your algorithm, the final step is to monitor and adjust it as needed. This involves regularly reviewing your trading performance and making changes to your algorithm to improve its effectiveness and profitability.

For example, if you notice that your algorithm is consistently losing money, you may need to adjust your trading rules or indicators to better align with the market conditions. You may also need to adjust your risk management settings to reduce your exposure to losses.

Conclusion

Building an algorithm for forex trading can be a highly effective way to improve your trading performance and profitability. By defining your trading strategy, identifying your trading rules, coding your algorithm, and monitoring and adjusting it as needed, you can create a powerful tool that can help you to make better trading decisions and achieve your financial goals. However, it is important to remember that building an algorithm requires a lot of skill and knowledge of the market, and it is not a guarantee of success.

Categories
Popular Questions

What time does new york forex close?

The foreign exchange market operates 24 hours a day, five days a week. However, this does not mean that every market is open all the time. The forex market operates through a network of financial institutions, and each of these institutions has its own trading hours. In this article, we will focus on the New York forex market and answer the question, “What time does New York forex close?

New York is one of the major financial centers of the world, and the New York forex market is one of the most important forex markets globally. The New York forex market is also known as the American Session, and it operates from 8:00 AM to 5:00 PM EST. During this time, the New York forex market is the most active forex market globally, with the highest trading volume.

The New York forex market is responsible for around 19% of the total forex market turnover, making it the second-largest forex market globally, after the London forex market. The New York forex market is dominated by institutional traders, including large banks, hedge funds, and other financial institutions. These traders trade in large volumes, and their trades have a significant impact on the forex market.

The New York forex market opens at 8:00 AM EST and closes at 5:00 PM EST. During this time, traders can trade various forex pairs, including the USD/JPY, EUR/USD, GBP/USD, and USD/CAD, among others. The New York forex market is open for trading five days a week, from Monday to Friday.

The New York forex market is unique in that it overlaps with two other major forex markets, the London forex market and the Tokyo forex market. The overlap between the New York and London forex markets is the most significant and occurs between 8:00 AM EST and 12:00 PM EST. During this overlap, the trading volume is the highest, making it the most active period of the New York forex market.

The overlap between the New York and Tokyo forex markets is much shorter and occurs between 7:00 PM EST and 12:00 AM EST. During this overlap, the trading volume is lower than during the New York-London overlap, but it is still a significant trading period for traders who trade the USD/JPY forex pair.

The New York forex market is influenced by various factors, including economic news releases, central bank announcements, geopolitical events, and market sentiment. Traders need to keep an eye on these factors and adjust their trading strategies accordingly.

In conclusion, the New York forex market is one of the most important forex markets globally, with the highest trading volume during its trading hours of 8:00 AM EST to 5:00 PM EST. The New York forex market overlaps with the London and Tokyo forex markets, making it an active and volatile market. Traders need to keep track of economic news releases, central bank announcements, geopolitical events, and market sentiment to make informed trading decisions.

Categories
Popular Questions

How to trade forex online?

Forex trading, also known as foreign exchange trading, is the process of buying and selling currencies. This form of trading has become increasingly popular over the years, thanks to the internet and the availability of online trading platforms. In this article, we will discuss the steps you need to take to start trading forex online.

Step 1: Educate yourself about the forex market

Before you start trading forex, it’s important to have a basic understanding of the market. You should familiarize yourself with the various currency pairs, market trends, and economic indicators that can affect currency prices. There are many online resources available, including articles, videos, and online courses that can help you get started.

Step 2: Choose a reliable online forex broker

To trade forex online, you’ll need to choose a reputable forex broker. A forex broker is a company that provides access to the forex market for traders. There are many forex brokers available online, so it’s important to do your research and choose a broker that is regulated, has a good reputation, and offers competitive spreads and fees.

Step 3: Open a forex trading account

Once you’ve chosen a forex broker, you’ll need to open a trading account. Most forex brokers offer different types of accounts, including demo accounts and live accounts. A demo account is a practice account that allows you to trade with virtual money, while a live account allows you to trade with real money. It’s recommended that you start with a demo account to practice your trading skills before moving on to a live account.

Step 4: Fund your trading account

To start trading forex, you’ll need to fund your trading account. Most forex brokers offer different funding options, including bank transfers, credit cards, and e-wallets. Make sure to choose a funding option that is convenient for you and has low fees.

Step 5: Download a forex trading platform

To trade forex online, you’ll need to download a forex trading platform. A trading platform is a software program that allows you to access the forex market and execute trades. Most forex brokers offer their own trading platforms, which are usually available for download on their website.

Step 6: Analyze the market and place trades

Once you’ve funded your trading account and downloaded a trading platform, you’re ready to start trading forex online. To place a trade, you’ll need to analyze the market and decide which currency pair to trade, as well as whether to buy or sell. There are many different trading strategies and analysis tools that you can use to help you make informed trading decisions.

Step 7: Manage your risk

Risk management is an important aspect of forex trading. It’s important to set stop-loss orders to limit your losses and take-profit orders to lock in profits. You should also avoid overtrading and only risk a small percentage of your trading account on each trade.

In conclusion, trading forex online can be a lucrative and exciting way to make money. However, it’s important to educate yourself about the market, choose a reliable forex broker, and practice with a demo account before trading with real money. By following these steps and managing your risk, you can increase your chances of success in the forex market.

Categories
Popular Questions

What are the best us brokers for forex?

The forex market is one of the most liquid and largest financial markets in the world, with daily trading volumes reaching up to $5 trillion. As a result, many US traders are attracted to forex trading as a way to diversify their portfolios and potentially earn high returns. However, choosing the right forex broker is crucial for successful trading. In this article, we will explore the best US brokers for forex.

1. TD Ameritrade

TD Ameritrade is a well-established broker in the US that offers access to forex as well as other financial products. Its forex trading platform, thinkorswim, is highly regarded for its advanced charting tools, customizable indicators, and extensive research materials. TD Ameritrade also offers competitive pricing, with spreads starting from as low as 0.1 pips.

2. FOREX.com

FOREX.com is a leading forex broker that is regulated by the National Futures Association (NFA) and the Commodity Futures Trading Commission (CFTC). It offers a wide range of forex pairs, as well as other financial instruments such as commodities, indices, and cryptocurrencies. FOREX.com also provides excellent customer support, educational resources, and a user-friendly trading platform.

3. IG

IG is a UK-based broker that has been operating in the US since 2019. It is regulated by the NFA and offers a wide range of forex pairs, as well as other financial products. IG is known for its user-friendly trading platform, advanced charting tools, and low spreads. It also provides excellent research materials, including daily market analysis and trading signals.

4. Oanda

Oanda is a Canadian-based broker that has been operating in the US since 2001. It is regulated by the NFA and the CFTC and offers a wide range of forex pairs, as well as other financial instruments. Oanda is known for its competitive pricing, with spreads starting from as low as 0.1 pips. It also provides a user-friendly trading platform, extensive educational resources, and excellent customer support.

5. Interactive Brokers

Interactive Brokers is a well-established US-based broker that offers access to forex as well as other financial products. It is regulated by the NFA and provides a user-friendly trading platform, advanced charting tools, and low spreads. Interactive Brokers also offers excellent research materials, including real-time market data, news feeds, and trading signals.

In conclusion, choosing the right forex broker is crucial for successful trading. The brokers mentioned above are highly regarded for their competitive pricing, user-friendly trading platforms, advanced charting tools, and extensive research materials. However, it is important to do your own research and choose a broker that meets your specific trading needs and preferences.

Categories
Popular Questions

How to tell if a forex pair is trending?

Forex trading is all about making informed decisions based on market movements. One of the most important things to know as a forex trader is how to determine if a currency pair is trending. A trend is simply the general direction in which the market is moving. By identifying trends, traders can make more profitable trades and minimize their losses. In this article, we will explore how to tell if a forex pair is trending.

What is a Trending Market?

A trending market is one in which prices are moving in a consistent direction. The movement can be either up, down, or sideways. The trend can be short-term, medium-term, or long-term. When a currency pair is trending, it means that there is a clear bias among traders towards buying or selling that currency. This is usually due to economic or geopolitical factors that are influencing the market.

How to Identify a Trending Market?

There are several ways to identify a trending market. Let’s take a look at some of the most popular methods.

1. Moving Averages

Moving averages are a commonly used technical indicator that helps traders identify trends. A moving average is simply the average price of a currency pair over a certain period of time. By plotting multiple moving averages on a chart, traders can see how the pair is trending. When the moving averages are moving upwards, it indicates an uptrend, and when they are moving downwards, it indicates a downtrend.

2. Trend Lines

Trend lines are another popular tool used to identify trends. A trend line is simply a straight line that connects two or more price points on a chart. When the trend line is sloping upwards, it indicates an uptrend, and when it is sloping downwards, it indicates a downtrend. Traders can draw trend lines on any timeframe, from minutes to months, depending on their trading style.

3. Oscillators

Oscillators are a type of technical indicator that helps traders identify overbought and oversold conditions in the market. When an oscillator is above a certain level, it indicates that the market is overbought and due for a correction. When it is below a certain level, it indicates that the market is oversold and due for a reversal. Popular oscillators include the Relative Strength Index (RSI), Stochastic Oscillator, and Moving Average Convergence Divergence (MACD).

4. Price Action

Price action is the study of how prices move on a chart. By analyzing the patterns that prices make, traders can identify trends and potential trading opportunities. Price action traders use candlestick charts to analyze the movement of prices. They look for patterns such as higher highs and higher lows in an uptrend, and lower highs and lower lows in a downtrend.

Conclusion

Trending markets are a key component of forex trading. By identifying trends, traders can make more informed trading decisions and increase their chances of success. There are several methods that traders can use to identify trends, including moving averages, trend lines, oscillators, and price action. It is important to remember that no method is foolproof, and traders should always use multiple indicators to confirm a trend before making a trade.

Categories
Popular Questions

How to make money in a forex bearish market?

Forex trading is a popular activity among investors and traders worldwide. As with any investment, the goal is to make a profit. However, the forex market is volatile, and prices can rise and fall rapidly. When prices are falling, the market is bearish, and many traders find it challenging to make a profit. In this article, we will discuss how to make money in a forex bearish market.

Understand the Market

Before you begin trading, you need to have a clear understanding of the forex market. You should know the factors that influence the market, such as economic indicators, political events, and global news. A bearish market is characterized by falling prices, and it can be caused by various factors, including a weak economy or a decline in demand for a particular currency.

Short Selling

Short selling is a popular strategy used by traders in a bearish market. It involves selling a currency pair with the expectation that prices will fall. You can profit from short selling by buying back the currency at a lower price, thus closing the trade at a profit. However, short selling can be risky, as prices may not fall as expected, and you may end up losing money.

Hedging

Hedging is another strategy used by traders to make money in a bearish market. It involves opening a second trade that is opposite to the first trade. For example, if you go short on the EUR/USD currency pair, you can open a long position on another currency pair, such as the USD/JPY. This way, you can minimize your losses in case the first trade goes against you.

Using Stop Loss Orders

Stop loss orders are essential in forex trading, as they help limit your losses. In a bearish market, prices can fall rapidly, and you may end up losing more money than you expected. A stop loss order helps you close a trade automatically when the price reaches a certain level, thus limiting your losses.

Trading with a Forex Robot

Forex robots are automated trading systems that use algorithms to analyze the market and execute trades. They can be beneficial in a bearish market, as they can identify profitable opportunities quickly. Forex robots can also help minimize your losses by using stop loss orders and other risk management strategies.

Trading on News Events

News events can have a significant impact on the forex market, and traders can use this to their advantage. In a bearish market, negative news can cause prices to fall rapidly. Traders can monitor news events and take advantage of the volatility by entering trades at the right time.

Conclusion

Making money in a forex bearish market requires patience, discipline, and a clear understanding of the market. Traders can use various strategies, such as short selling, hedging, using stop loss orders, trading with a forex robot, and trading on news events. However, it is essential to manage your risks carefully and avoid taking unnecessary risks. With the right approach, traders can make a profit in a bearish market and achieve their investment goals.

Categories
Popular Questions

How will bombing isis affect forex?

The war against ISIS has been ongoing for several years now, with numerous countries involved in the fight against the terrorist organization. The recent bombing of ISIS by the United States has raised concerns about how this will affect forex markets.

Forex, also known as foreign exchange, is the market where currencies are bought and sold. The value of a currency is determined by a range of factors, including economic indicators, political events, and global events. In the case of the bombing of ISIS, the impact on forex markets will be significant.

The recent bombing of ISIS by the United States will have a direct impact on forex markets. This is because the value of a currency is often determined by the political and economic stability of a country. The bombing of ISIS is likely to destabilize the region, which will have a knock-on effect on the value of currencies in the area.

The first currency that is likely to be affected by the bombing of ISIS is the US dollar. The US dollar is often seen as a safe haven currency, meaning that investors tend to buy the dollar during times of political and economic uncertainty. The bombing of ISIS is likely to create uncertainty, which will lead to an increase in demand for the US dollar. This will cause the value of the dollar to rise, which will have a negative impact on other currencies.

The second currency that is likely to be affected by the bombing of ISIS is the euro. The euro is the second most traded currency in the world, and it is used by many countries in the region. The bombing of ISIS is likely to create uncertainty in the region, which will lead to a decrease in demand for the euro. This will cause the value of the euro to fall, which will have a negative impact on other currencies.

The third currency that is likely to be affected by the bombing of ISIS is the British pound. The UK is one of the countries involved in the fight against ISIS, and the bombing is likely to create uncertainty in the region. This will lead to a decrease in demand for the pound, which will cause the value of the pound to fall.

The impact of the bombing of ISIS on forex markets is likely to be significant. The destabilization of the region will lead to a decrease in demand for currencies in the area, which will cause their value to fall. This will have a knock-on effect on other currencies, which will also be impacted by the bombing.

In conclusion, the bombing of ISIS is likely to have a significant impact on forex markets. The instability created by the bombing will lead to a decrease in demand for currencies in the region, which will cause their value to fall. This will have a knock-on effect on other currencies, which will also be impacted by the bombing. As always, investors will need to keep a close eye on the situation and adjust their trading strategies accordingly.

Categories
Popular Questions

How much money can you make forex?

Forex, or foreign exchange, is one of the most popular financial markets in the world. It is a decentralized market where currencies are bought and sold. The foreign exchange market is open 24 hours a day, five days a week, and is accessible to anyone with an internet connection. One of the most frequently asked questions by aspiring traders is “How much money can you make forex?” In this article, we will explore the potential earnings of forex trading.

Forex Trading Basics

Before we dive into the potential earnings of forex trading, let’s briefly touch upon the basics. Forex trading involves buying one currency and selling another at the same time. The goal is to make a profit from the difference between the buying and selling price of the currencies. For example, if you buy the euro and simultaneously sell the US dollar, you are hoping that the euro will appreciate against the US dollar, thus allowing you to make a profit.

The forex market is highly volatile and unpredictable. The prices of currencies are affected by a variety of factors, including political events, economic data releases, and central bank decisions. Therefore, forex trading requires a lot of knowledge, analysis, and discipline.

Potential Earnings of Forex Trading

The potential earnings of forex trading depend on several factors, such as your trading strategy, risk management, and capital. Let’s explore each of these factors in more detail.

Trading Strategy

Your trading strategy is the foundation of your forex trading career. It is a set of rules that you follow to enter and exit trades. There are several trading strategies available, such as scalping, day trading, swing trading, and position trading. Each strategy has its own advantages and disadvantages, and it’s up to you to choose the one that suits your trading style and personality.

Scalping is a short-term trading strategy where traders aim to make small profits from multiple trades. Day trading involves opening and closing trades within a day, while swing trading involves holding trades for several days or even weeks. Position trading is a long-term strategy where traders hold trades for several months or even years.

The potential earnings of forex trading depend on your trading strategy. Scalping and day trading can generate small profits frequently, while swing trading and position trading can generate larger profits but less frequently.

Risk Management

Risk management is crucial in forex trading. You should never risk more than you can afford to lose. The rule of thumb is to risk no more than 1-2% of your trading capital per trade. For example, if you have a trading account with $10,000, you should risk no more than $100-$200 per trade.

Risk management also involves setting stop-loss orders to limit your losses in case the market moves against you. A stop-loss order is an order to close a trade automatically when the price reaches a certain level.

Capital

The amount of capital you have also affects your potential earnings in forex trading. The more capital you have, the more you can potentially earn. However, it’s important to note that having a large trading account doesn’t necessarily mean you will make more money. It all depends on your trading strategy and risk management.

For example, if you have a trading account with $10,000 and aim to make a 10% return per month, you can potentially earn $1,000 per month. However, if you have a trading account with $100,000 and aim to make a 2% return per month, you can potentially earn $2,000 per month.

Conclusion

In conclusion, the potential earnings of forex trading depend on several factors, such as your trading strategy, risk management, and capital. It’s important to have a solid trading strategy, practice good risk management, and start with a reasonable amount of capital. Forex trading is not a get-rich-quick scheme, and it requires a lot of hard work, dedication, and discipline. However, if done correctly, forex trading can be a lucrative career.

Categories
Popular Questions

How to trade forex from usa?

Forex trading, also known as foreign exchange trading, is the buying and selling of currencies in the global market. It is the largest and most liquid market in the world, with an average daily trading volume of $5.3 trillion. With the advancement of technology, forex trading has become more accessible to individuals worldwide, including the USA. In this article, we will discuss how to trade forex from the USA.

Step 1: Understand the Forex Market

Before diving into trading forex, it is crucial to understand the market’s basics. The forex market operates 24 hours a day, five days a week, with no central exchange. Instead, it is a decentralized network of banks, financial institutions, and individual traders buying and selling currencies. The market’s volatility and liquidity make it an attractive option for traders worldwide.

Step 2: Choose a Forex Broker

To start trading forex from the USA, you need to choose a reputable forex broker that accepts US clients. It is essential to choose a broker that is regulated by a regulatory body such as the National Futures Association (NFA) or the Commodity Futures Trading Commission (CFTC) in the USA. These regulatory bodies ensure that brokers adhere to strict guidelines to protect traders’ interests.

Step 3: Open a Forex Trading Account

Once you have chosen a broker, the next step is to open a forex trading account. Most brokers offer different types of accounts, such as micro, mini, and standard accounts, with varying minimum deposit requirements. It is essential to choose an account that suits your trading needs and financial situation.

Step 4: Fund Your Trading Account

After opening a trading account, you need to fund it to start trading. Most brokers offer multiple deposit options, such as bank transfer, credit/debit card, and e-wallets. It is essential to choose a deposit method that is convenient and secure.

Step 5: Choose a Trading Platform

Forex brokers offer different trading platforms, such as MetaTrader 4 (MT4), MetaTrader 5 (MT5), cTrader, and proprietary trading platforms. It is essential to choose a platform that is user-friendly and offers the necessary tools and features for trading.

Step 6: Learn Forex Trading Strategies

Before starting to trade forex, it is crucial to learn various trading strategies and techniques. Forex trading involves analyzing charts, understanding economic indicators, and keeping up with global news and events that affect currency prices. There are various educational resources available, such as online courses, webinars, and trading books.

Step 7: Start Trading

After learning the necessary skills and strategies, you can start trading forex from the USA. It is essential to start with a small trading account and practice with a demo account before trading with real money. It is also crucial to manage your risk, set stop-loss orders, and have a trading plan.

Conclusion

Trading forex from the USA can be a profitable venture with the right skills, knowledge, and tools. It is crucial to choose a regulated forex broker, open a trading account, fund it, choose a trading platform, learn trading strategies, and start trading. Forex trading involves risks, and it is essential to manage them appropriately. With the right mindset and discipline, anyone can become a successful forex trader.

Categories
Popular Questions

How many forex day trades can you make per day under metatrader 4?

Forex day trading is an exciting and potentially lucrative activity that requires traders to make quick decisions and execute trades within a single trading day. Under Metatrader 4, one of the most popular trading platforms in the forex market, traders may wonder how many day trades they can make per day. In this article, we will explore this question and provide insights into the factors that affect the number of day trades a trader can make.

Firstly, it is important to understand what is meant by a day trade. A day trade is a trade that is opened and closed within the same trading day, typically within a few hours. Day traders aim to profit from small price movements in the market and often use technical analysis and charting tools to identify trading opportunities. Unlike swing traders, who hold positions for several days or weeks, day traders do not incur overnight financing costs and can benefit from high leverage offered by brokers.

Under Metatrader 4, there is no specific limit on the number of day trades a trader can make per day. However, there are some important considerations that can affect the number of trades a trader can execute. These include:

1. Trading Capital: The amount of trading capital available to a trader is a crucial factor in determining the number of day trades they can make. Day trading requires traders to take multiple trades within a single day, which means they need to have sufficient funds to cover their margin requirements and potential losses. The more capital a trader has, the more trades they can make without risking a significant portion of their account balance.

2. Trading Strategy: The trading strategy used by a trader can also affect the number of day trades they can make. Some trading strategies, such as scalping, involve taking a large number of trades with small profit targets. Other strategies, such as trend following, may involve fewer trades but with larger profit targets. Traders need to choose a strategy that suits their trading style and risk tolerance.

3. Trading Timeframe: The timeframe used by a trader can also affect the number of day trades they can make. For example, a trader who uses a 5-minute chart may be able to take more trades than a trader who uses a 1-hour chart. However, shorter timeframes also increase the risk of false signals and can lead to overtrading.

4. Trading Risk: The level of risk taken by a trader can also affect the number of day trades they can make. Day trading involves a high level of risk, and traders need to be prepared to accept losses. Traders who take excessive risks may find that they are forced to close out trades early, which can limit the number of trades they can make.

In conclusion, under Metatrader 4, there is no specific limit on the number of day trades a trader can make per day. However, there are several factors that can affect the number of trades a trader can execute, including trading capital, trading strategy, trading timeframe, and trading risk. Traders need to carefully consider these factors before entering the market and should always trade within their means and risk tolerance. Additionally, it is important to remember that day trading is a high-risk activity and requires discipline, patience, and a solid trading plan to be successful.

Categories
Popular Questions

What is modify order in forex trading?

Forex trading is an exciting venture that offers numerous opportunities for traders to make profits. However, it can also be a risky business if not handled with care. One of the essential aspects of forex trading is order management. In forex trading, there are various types of orders that traders can use to enter and exit the market. One of the most common types of orders is the modify order. In this article, we will explore what a modify order is and how it works in forex trading.

What is a Modify Order in Forex Trading?

A modify order is a type of order used in forex trading that allows traders to change the parameters of an existing order. With a modify order, traders can adjust the price, size, or any other aspect of an open order. This means that traders can modify their existing orders without having to cancel them and create new ones. A modify order is also known as a “change order” or “amend order.”

How does a Modify Order work in Forex Trading?

A modify order allows traders to change their open orders without having to close them and create new orders. When a trader wants to modify an existing order, they go to the trading platform and select the open order they want to modify. They can then adjust the parameters of the order, such as the price, size, or stop loss level. Once the modifications are made, the trader submits the modify order, and the changes are reflected in the order book.

For example, let’s say a trader has a buy order for EUR/USD at 1.2000 with a stop loss at 1.1900. The trader realizes that the stop loss is too tight and wants to increase it to 1.1950. Instead of canceling the order and creating a new one, the trader can use a modify order to adjust the stop loss level to 1.1950. This allows the trader to manage their risk without having to close the order and lose any potential profits.

Benefits of using a Modify Order in Forex Trading

1. Time-saving: Modify orders save traders time since they do not have to cancel and create new orders. This allows traders to focus on other aspects of trading such as market analysis and strategy development.

2. Risk management: Modify orders allow traders to manage their risk effectively by adjusting their stop loss levels, take profit levels, or order sizes.

3. Increased flexibility: Modify orders give traders more flexibility in their trading strategies since they can adjust their orders in real-time based on market conditions.

4. Better trade execution: Modify orders allow traders to execute their trades more efficiently by adjusting their orders to fit the current market conditions.

Risks of using a Modify Order in Forex Trading

1. Execution risk: There is a risk of slippage or execution delays when modifying an order. This can happen if the market moves quickly, and the order book does not update fast enough.

2. Error risk: There is a risk of making an error when modifying an order, such as inputting the wrong price or size. This can lead to unintended consequences such as missed opportunities or losses.

3. Technical risk: There is a risk of technical issues such as platform downtime or connectivity problems that can prevent traders from modifying their orders.

Conclusion

In conclusion, modify orders are an essential tool in forex trading that allows traders to adjust their open orders without having to cancel them and create new ones. Modify orders offer numerous benefits such as time-saving, risk management, increased flexibility, and better trade execution. However, there are also risks associated with using modify orders such as execution risk, error risk, and technical risk. Traders should, therefore, use modify orders with caution and ensure they understand the risks involved.

Categories
Popular Questions

What is the best way to trade forex?

Forex trading, also known as foreign exchange trading, is the buying and selling of currencies in order to make a profit. It is one of the most popular forms of trading in the financial market, and is accessible to both experienced traders and beginners. However, trading forex can be a complex and risky process, and it is important to understand what the best way to trade forex is in order to maximize your profits and minimize your risks.

1. Develop a trading plan

Before you start trading forex, it is important to develop a trading plan. This plan should outline your goals, your strategy, and your risk management techniques. Your goals should be specific and measurable, and your strategy should be based on your analysis of the market.

2. Choose the right broker

Choosing the right broker is crucial to your success as a forex trader. Look for a broker that is regulated, has a good reputation, and offers competitive spreads and commissions. You should also consider the trading platform that the broker offers, and whether it is user-friendly and has the features that you need.

3. Learn to read charts and use technical analysis

Technical analysis is an important tool for forex traders, as it allows you to identify trends and patterns in the market. Learning to read charts and use technical analysis can take time and practice, but it is an essential skill for successful forex trading.

4. Use a stop-loss order

A stop-loss order is an order that you place with your broker to automatically sell your position if it reaches a certain price. This can help you to limit your losses and protect your capital.

5. Manage your risk

Managing your risk is essential to successful forex trading. This means using tools such as stop-loss orders, setting realistic goals, and not risking more than you can afford to lose. You should also be aware of the risks associated with leverage, and only use leverage if you understand how it works and can manage the risks.

6. Keep up-to-date with market news and events

Keeping up-to-date with market news and events can help you to make informed trading decisions. This includes monitoring economic data releases, political events, and central bank announcements.

7. Practice with a demo account

Before you start trading with real money, it is a good idea to practice with a demo account. This will allow you to test your strategy, learn how to use the trading platform, and get a feel for the market without risking your capital.

In conclusion, the best way to trade forex is to develop a trading plan, choose the right broker, learn to read charts and use technical analysis, use a stop-loss order, manage your risk, keep up-to-date with market news and events, and practice with a demo account. While forex trading can be complex and risky, these techniques can help you to maximize your profits and minimize your risks.

Categories
Popular Questions

How do you read forex charts?

Forex charts are an essential tool for traders who want to monitor and analyze the movements of currency pairs. These charts provide a visual representation of the price movements over a set period, allowing traders to identify trends and predict future price movements. Reading forex charts may seem daunting at first, but with a bit of practice and knowledge, anyone can master it.

Types of Forex Charts

There are three main types of forex charts: line charts, bar charts, and candlestick charts. Each chart type has its own advantages and disadvantages, and it’s up to the trader to choose which one suits their trading style.

Line charts are the simplest type of forex chart, and they show the closing prices of a currency pair over a set period. Line charts are useful for showing long-term trends, but they don’t provide much detail about price movements during the day.

Bar charts show the opening, closing, high, and low prices of a currency pair over a set period. They provide more information than line charts and are useful for identifying trends over shorter periods. Bar charts are also useful for identifying support and resistance levels.

Candlestick charts are the most popular type of forex chart. They show the opening, closing, high, and low prices of a currency pair over a set period, just like bar charts. However, candlestick charts provide more information about price movements by using colored candlesticks to represent the price movements of a currency pair. Green candlesticks represent bullish movements (when the closing price is higher than the opening price), while red candlesticks represent bearish movements (when the closing price is lower than the opening price).

Reading Forex Charts

Once you’ve chosen the type of forex chart that suits your trading style, it’s time to start reading it. The first thing to look for is the time frame of the chart. Forex charts can be set to different time frames, ranging from one minute to one month. It’s important to choose the time frame that best suits your trading style and goals.

Next, look at the price axis on the right-hand side of the chart. This axis shows the price of the currency pair you’re interested in. The price is usually shown in pips, which is the smallest unit of measurement in the forex market. Each pip represents a change in the fourth decimal place of a currency pair. For example, if the EUR/USD pair moves from 1.1000 to 1.1001, that’s a one-pip movement.

The next thing to look for is the chart pattern. Chart patterns are formed by the price movements of a currency pair over a set period. There are two main types of chart patterns: trend and range. Trend patterns show the direction of the price movements, while range patterns show that the price is moving within a certain range.

To identify trend patterns, look for a series of higher highs and higher lows (for an uptrend) or lower highs and lower lows (for a downtrend). To identify range patterns, look for a series of similar highs and lows.

Support and resistance levels are also important to look for when reading forex charts. Support levels are price levels where the currency pair has previously bounced back up from, while resistance levels are price levels where the currency pair has previously bounced back down from. These levels can be used as entry and exit points for trades.

Conclusion

Reading forex charts may seem daunting at first, but with practice and knowledge, anyone can master it. Choosing the right type of chart and time frame is important, as is looking for chart patterns and support and resistance levels. By using forex charts to analyze the movements of currency pairs, traders can make informed decisions about their trades and potentially increase their profits.

Categories
Popular Questions

Forex market closes and opens at what time?

The Forex market is the largest and most liquid financial market in the world, with an average daily volume of over $5 trillion. It is a decentralized market, meaning that there is no central exchange where all currencies are traded. Instead, Forex trading takes place on a global network of banks, brokers, and other financial institutions.

One of the unique features of the Forex market is its 24-hour trading cycle. Unlike other financial markets, which are typically open for a set number of hours each day, the Forex market is open around the clock, five days a week. However, even though the Forex market is always open, there are certain times when trading is more active and the market is more volatile. These times are known as market opens and closes.

Forex Market Opens

The Forex market opens on Sunday at 5 pm EST (10 pm GMT) when the first financial center in the world, Sydney, Australia, begins trading. This is followed by Tokyo, Japan, at 7 pm EST (12 am GMT), and then Singapore and Hong Kong at 9 pm EST (2 am GMT). These are the primary financial centers in the Asia-Pacific region, and their opening times mark the start of the Forex trading week.

After the Asian session comes to a close, the European session begins at 2 am EST (7 am GMT), with London being the primary financial center. The European session is the most active and liquid session of the day, as it overlaps with both the Asian and US sessions. This means that there is a high volume of trading activity during this time, and the market is more volatile.

Finally, the US session begins at 8 am EST (1 pm GMT) with the opening of the New York financial center. The US session is also very active, as it overlaps with the European session. It is during this time that most of the major economic news releases are scheduled, which can have a significant impact on currency prices.

Forex Market Closes

The Forex market closes on Friday at 5 pm EST (10 pm GMT) when the New York financial center closes. This marks the end of the trading week and the start of the weekend. However, even though the New York financial center is closed, the Forex market remains open over the weekend, as trading continues in other parts of the world.

During the weekend, the Forex market is less active and less liquid than during the weekdays. This is because most of the major financial centers are closed, and there are fewer traders participating in the market. As a result, currency prices can be more volatile during this time, as there is less liquidity to absorb large trades.

It is important to note that even though the Forex market is open 24 hours a day, not all currency pairs are equally active during all sessions. Some currency pairs are more actively traded during the Asian session, while others are more active during the European or US session. It is essential for traders to understand the characteristics of each currency pair and the times when they are most active to maximize their trading opportunities.

In conclusion, the Forex market is open 24 hours a day, five days a week, with trading activity shifting between different financial centers around the world. Understanding the market opens and closes can help traders identify the most active and liquid trading sessions and optimize their trading strategies accordingly.

Categories
Popular Questions

What is forex explained?

Forex, or the foreign exchange market, is a decentralized global market where all the world’s currencies trade. It is the largest and most liquid financial market in the world, with an average daily trading volume of over $5 trillion.

Forex trading involves buying and selling currencies with the goal of making a profit. The value of a currency is determined by its supply and demand in the market, and it can fluctuate rapidly due to various factors such as economic news, political events, and market sentiment.

Forex trading is accessible to anyone with an internet connection and a trading account. Traders can use a variety of tools and strategies to analyze the market and make informed trading decisions. Some common tools include technical analysis, fundamental analysis, and sentiment analysis.

Technical analysis involves studying historical price charts and using technical indicators to identify patterns and trends in the market. Fundamental analysis, on the other hand, involves analyzing economic and political news to determine the underlying strength or weakness of a currency. Sentiment analysis is the study of market sentiment, or the overall mood and attitude of traders towards a particular currency.

Forex trading is also characterized by leverage, which allows traders to control a large position with a relatively small amount of capital. However, leverage can also magnify losses, so it is important for traders to use risk management tools such as stop-loss orders and position sizing.

There are many different trading styles in forex, including day trading, swing trading, and position trading. Day traders open and close positions within the same trading day, while swing traders hold positions for a few days to a few weeks. Position traders hold positions for longer periods of time, often months or even years.

Forex trading is not without risks, and traders should be aware of the potential for losses as well as gains. It is important to have a solid understanding of the market and to have a well-defined trading plan before entering the market.

In conclusion, forex trading is the buying and selling of currencies with the goal of making a profit. It is the largest and most liquid financial market in the world, and it is accessible to anyone with an internet connection and a trading account. Traders can use a variety of tools and strategies to analyze the market and make informed trading decisions, but they should also be aware of the potential risks and have a well-defined trading plan in place.

Categories
Popular Questions

What is hot forex?

Hot Forex is a global forex and commodities trading platform that offers its clients a wide range of trading services. It is a brand name of HF Markets Group, which is a group of companies that provides trading services around the world. Hot Forex was launched in 2010 and has since become one of the most popular forex brokers in the industry. The company is headquartered in Mauritius and has offices in various countries around the world.

Hot Forex offers its clients a choice of several trading accounts, including Micro, Premium, Zero Spread, Auto, PAMM, and HFcopy accounts. Each account has its own features, benefits, and requirements. The Micro account, for example, is designed for beginners and requires a minimum deposit of $5. The Premium account, on the other hand, is ideal for experienced traders and requires a minimum deposit of $500. The Zero Spread account offers zero spread on forex pairs and requires a minimum deposit of $200.

Hot Forex offers its clients a wide range of trading instruments, including forex, commodities, indices, stocks, bonds, and cryptocurrencies. The platform offers more than 150 trading instruments, including popular forex pairs such as EUR/USD, USD/JPY, and GBP/USD. The platform also offers a wide range of commodities, including gold, silver, oil, and natural gas. Indices such as the S&P 500 and the Dow Jones Industrial Average are also available for trading.

Hot Forex offers its clients a range of trading platforms, including the popular MetaTrader 4 (MT4) and MetaTrader 5 (MT5) platforms. Both platforms are available for desktop and mobile devices and offer a range of features and tools for traders. The MT4 platform, for example, offers advanced charting tools, multiple order types, and automated trading options. The MT5 platform offers additional features, such as multi-currency support, advanced trade management tools, and more.

Hot Forex also offers its clients a range of educational resources and tools to help traders improve their trading skills and knowledge. The company offers a range of webinars, video tutorials, and trading guides to help traders learn about forex trading and how to use the platform effectively. The platform also offers a range of analysis tools, including economic calendars, market news, and technical analysis tools.

Hot Forex is regulated by several financial authorities, including the Financial Services Commission of Mauritius (FSC), the Cyprus Securities and Exchange Commission (CySEC), and the Dubai Financial Services Authority (DFSA). The company is committed to maintaining high standards of security and transparency, and clients can be assured that their funds are safe and secure.

In conclusion, Hot Forex is a global forex and commodities trading platform that offers its clients a wide range of trading services. The platform offers a range of trading accounts, instruments, and platforms, as well as educational resources and analysis tools. The company is regulated by several financial authorities and is committed to maintaining high standards of security and transparency. Hot Forex is an ideal choice for both beginner and experienced traders who are looking for a reliable and trustworthy trading platform.

Categories
Popular Questions

What is the best time to trade in forex?

Forex trading is a 24-hour market that operates around the clock, five days a week. As a result, traders can access the market at any time of the day or night. However, not all trading hours are created equal, and there are specific times when the market is more active and volatile, making it ideal for trading. In this article, we will explore the best time to trade in forex and why timing is crucial in forex trading.

The forex market is divided into four major trading sessions, which include the Asian, European, North American, and Pacific trading sessions. Each of these sessions has its unique characteristics and trading hours, and understanding them is crucial for successful forex trading.

The Asian session is the first session to open and is known for its low volatility and liquidity. This session starts at 12:00 am GMT and ends at 9:00 am GMT. During this time, the major currency pairs, including USD/JPY, AUD/USD, and NZD/USD, are most active. However, traders should be cautious when trading during this session as the low volatility can result in sudden price movements that can trigger stop loss orders.

The European session is the most active trading session, accounting for over 50% of the total forex trading volume. This session starts at 8:00 am GMT and ends at 5:00 pm GMT. During this time, the major currency pairs, including EUR/USD, GBP/USD, and USD/CHF, are most active. The European session overlaps with the Asian session for a few hours, resulting in increased volatility and liquidity. Additionally, important economic releases, such as the European Central Bank (ECB) and Bank of England (BOE) monetary policy announcements, are announced during this session, making it a high-impact trading session.

The North American session is the second most active trading session, accounting for approximately 20% of the total forex trading volume. This session starts at 1:00 pm GMT and ends at 10:00 pm GMT. During this time, the major currency pairs, including USD/CAD, USD/JPY, and USD/MXN, are most active. The North American session overlaps with the European session for a few hours, resulting in increased volatility and liquidity. Additionally, important economic releases, such as the US Non-Farm Payroll (NFP) report, are announced during this session, making it a high-impact trading session.

The Pacific session is the least active session, accounting for approximately 10% of the total forex trading volume. This session starts at 9:00 pm GMT and ends at 6:00 am GMT. During this time, the major currency pairs, including AUD/USD, NZD/USD, and USD/JPY, are most active. The Pacific session overlaps with the North American session for a few hours, resulting in increased volatility and liquidity.

So, what is the best time to trade in forex?

The best time to trade in forex depends on the trader’s trading style, strategy, and goals. However, the European session is considered the best time to trade in forex as it offers the most significant trading opportunities due to its high volatility and liquidity. During this session, traders can take advantage of the price movements and trade the major currency pairs, which are the most liquid and offer the narrowest spreads.

Furthermore, traders should consider the economic calendar when deciding on the best time to trade. Economic releases, such as interest rate decisions, inflation data, and GDP reports, can significantly impact the forex market’s volatility and liquidity. Therefore, traders should avoid trading during the release of high-impact economic data as the market can become highly volatile, resulting in sudden price movements.

In conclusion, understanding the forex market’s trading sessions and their unique characteristics is crucial for successful forex trading. The European session is considered the best time to trade in forex due to its high volatility and liquidity, making it the most active trading session. However, traders should consider their trading style, strategy, and goals when deciding on the best time to trade. Additionally, traders should avoid trading during high-impact economic releases to avoid sudden price movements.

Categories
Popular Questions

What days has more liquidity forex?

Forex, which stands for foreign exchange, is the largest financial market in the world. With an average daily trading volume of $6.6 trillion, the forex market is more liquid than any other market, including the stock market. This liquidity is what makes forex trading so attractive to investors, as it allows for easy entry and exit from trades, as well as tight bid-ask spreads. However, not all days are created equal in terms of forex liquidity. In this article, we will explore which days have more liquidity in the forex market and why.

Before diving into the specifics of which days have more liquidity in forex, it’s important to understand what liquidity means. In finance, liquidity refers to the ease with which an asset can be bought or sold without affecting its price. In the context of forex trading, liquidity refers to the availability of buyers and sellers in the market, which determines how quickly and easily one can enter or exit a trade. The more buyers and sellers there are in the market, the more liquid it is.

With that in mind, let’s take a look at which days have more liquidity in forex. Generally, the forex market is open 24 hours a day, five days a week, from Sunday evening to Friday afternoon (EST). However, not all trading hours are created equal in terms of liquidity. Here are the three main trading sessions in the forex market:

1. Asian session: This session begins at 7:00 PM EST and ends at 4:00 AM EST. The Asian session is the least volatile of the three sessions, as the majority of the world’s major financial markets are closed during this time. However, there are a few exceptions, such as Australia and Japan, which can impact the currency pairs that include their respective currencies.

2. European session: This session begins at 3:00 AM EST and ends at 12:00 PM EST. The European session is the most active of the three sessions, as it overlaps with the Asian and North American sessions. The majority of the major financial markets are open during this time, including London, Frankfurt, and Paris.

3. North American session: This session begins at 8:00 AM EST and ends at 5:00 PM EST. The North American session is the second most active of the three sessions, as it overlaps with the European session. The majority of the major financial markets are open during this time, including New York and Toronto.

So, which days have more liquidity in forex? Generally, Tuesdays, Wednesdays, and Thursdays are the most liquid days in the forex market. This is because these days overlap with the European and North American sessions, which are the most active sessions of the day. During these days, there are more traders in the market, which means more liquidity and tighter bid-ask spreads.

Mondays and Fridays, on the other hand, are typically less liquid days in the forex market. Mondays are often slow as traders are still getting back into the swing of things after the weekend, while Fridays are slow as traders are winding down and preparing for the weekend. However, it’s important to note that there are exceptions to this rule, particularly around major economic events, such as central bank meetings, non-farm payroll releases, and GDP reports.

It’s also worth noting that individual currency pairs can have different levels of liquidity depending on the time of day and day of the week. For example, the EUR/USD pair is the most traded currency pair in the forex market, and it typically has the highest liquidity during the European and North American sessions. However, other currency pairs, such as the AUD/JPY pair, may have higher liquidity during the Asian session due to Australia and Japan being in that time zone.

In conclusion, the forex market is a highly liquid market that is open 24 hours a day, five days a week. However, not all days are created equal in terms of liquidity. Generally, Tuesdays, Wednesdays, and Thursdays are the most liquid days in the forex market, as they overlap with the most active trading sessions. Mondays and Fridays are typically less liquid days, but there are exceptions to this rule around major economic events. It’s also worth noting that individual currency pairs can have different levels of liquidity depending on the time of day and day of the week.

Categories
Popular Questions

How to open a forex broker account?

Forex trading is a global phenomenon, and millions of traders participate in it every day. Forex trading allows traders to speculate on the price movements of different currencies using a broker’s trading platform. In order to participate in the forex market, traders must first open a forex broker account. In this article, we will discuss the steps involved in opening a forex broker account.

Step 1: Choose a Forex Broker

The first step in opening a forex broker account is to choose a reputable forex broker. There are many forex brokers available, and it can be challenging to select the right one. Here are some factors to consider when choosing a forex broker:

– Regulation: The forex broker should be regulated by a reputable regulatory body, such as the Financial Conduct Authority (FCA) in the UK, the Australian Securities and Investments Commission (ASIC) in Australia, or the Commodity Futures Trading Commission (CFTC) in the US.

– Trading Platform: The trading platform should be user-friendly, stable, and offer a range of trading tools and indicators.

– Spreads and Commissions: The forex broker should offer competitive spreads and commissions.

– Customer Support: The forex broker should provide excellent customer support.

Step 2: Account Registration

Once you have chosen a forex broker, the next step is to register for an account. This process usually involves filling out an online application form and providing some personal information, such as your name, address, and contact details. You will also need to provide some identification documents, such as a passport or driver’s license, to verify your identity.

Step 3: Account Verification

After registering for an account, the forex broker will require you to verify your account. This process involves providing additional identification documents to confirm your identity, such as a utility bill or bank statement. The purpose of this step is to prevent money laundering and other illegal activities.

Step 4: Fund Your Account

Once your account is verified, you can fund your account. Most forex brokers offer a range of payment options, such as credit/debit cards, bank transfers, and e-wallets. You should choose the payment option that is most convenient for you. It is essential to note that some payment options may have processing fees or minimum deposit requirements.

Step 5: Download Trading Platform

After funding your account, you can download the trading platform provided by the forex broker. The trading platform is where you will execute your trades, monitor your positions, and access trading tools and indicators.

Step 6: Start Trading

After downloading the trading platform, you can start trading. You should first familiarize yourself with the trading platform, its features, and its functionalities. It is also essential to develop a trading strategy and risk management plan before executing your first trade.

Conclusion

Opening a forex broker account is a straightforward process that involves choosing a reputable forex broker, registering for an account, verifying your identity, funding your account, downloading the trading platform, and starting to trade. It is essential to choose a forex broker that is regulated, offers a user-friendly trading platform, competitive spreads and commissions, and excellent customer support. It is also crucial to develop a trading strategy and risk management plan before executing your first trade.

Categories
Popular Questions

How do i find the average pip movement per period for forex pairs?

When trading in the forex market, it is crucial to have an understanding of how much a currency pair typically moves during a certain period of time. This information can help traders make informed decisions about their trades, including setting stop loss and take profit levels.

The movement of a currency pair is measured in pips, which stands for “percentage in point”. One pip represents a one-digit move in the fourth decimal place of a currency pair’s exchange rate. For example, if the EUR/USD exchange rate moves from 1.1000 to 1.1001, that is a one-pip movement.

To find the average pip movement per period for a forex pair, there are a few steps to follow:

Step 1: Choose a time frame

The first step is to choose a time frame for which you want to calculate the average pip movement. This can be a daily, weekly, or monthly time frame, depending on your trading strategy and preferences.

Step 2: Determine the period’s high and low prices

Next, you need to determine the high and low prices for the chosen period. This can be done by looking at a chart of the currency pair and identifying the highest and lowest exchange rates during the chosen time frame.

Step 3: Calculate the difference in pips between the high and low prices

Once you have identified the high and low prices for the chosen period, you need to calculate the difference between them in pips. To do this, you can subtract the low price from the high price and multiply the result by 10,000 (since there are 10,000 pips in a currency pair).

For example, if the high price for the chosen period is 1.1200 and the low price is 1.1100 for the EUR/USD pair, the difference would be 100 pips (1.1200 – 1.1100 = 0.0100 x 10,000 = 100 pips).

Step 4: Divide the total pips by the number of periods

Finally, you need to divide the total number of pips for the chosen period by the number of periods. For example, if you are calculating the average pip movement for a month and the total pip movement for the month is 500 pips, you would divide 500 by 30 (assuming there are 30 trading days in the month) to get an average of around 16.67 pips per day.

It is important to note that the average pip movement can vary greatly depending on the currency pair and the time frame chosen. Some currency pairs are more volatile than others, and certain periods may see higher or lower levels of trading activity.

Additionally, the average pip movement is just one factor to consider when trading forex. Traders should also take into account other factors such as market trends, news events, and technical analysis indicators when making trading decisions.

In conclusion, finding the average pip movement per period for forex pairs is a useful tool for traders to better understand the market and make informed trading decisions. By following the steps outlined above, traders can calculate this metric and use it as part of their overall trading strategy.

Categories
Popular Questions

How are unrealized forex gain taxed?

Unrealized forex gains are a common occurrence in international trade, and they are often a source of confusion when it comes to taxation. The term “unrealized” refers to the fact that the gain has not yet been realized or converted into cash, but rather it is still in the form of a foreign currency. In this article, we will explore how unrealized forex gains are taxed, and provide a clear understanding of the tax implications for businesses and individuals.

Forex gains and losses

Forex gains and losses are the result of fluctuations in exchange rates between different currencies. When a company or individual purchases goods or services in a foreign currency, they are exposed to the risk of exchange rate fluctuations. If the exchange rate of the foreign currency increases, the value of the company’s or individual’s assets denominated in that currency will also increase.

Conversely, if the exchange rate of the foreign currency decreases, the value of the assets denominated in that currency will also decrease. This fluctuation in exchange rates can result in forex gains or losses.

Realized and unrealized forex gains

Forex gains can be realized or unrealized. Realized forex gains are gains that have been converted into cash or another currency. For example, if a company purchases goods in a foreign currency and then sells those goods in their home currency, any gain resulting from the difference in exchange rates between the two currencies would be a realized forex gain.

Unrealized forex gains, on the other hand, are gains that have not yet been converted into cash or another currency. For example, if a company holds a foreign currency account and the exchange rate of that currency increases, the value of the account denominated in that currency will also increase. However, until the company converts that foreign currency into their home currency, the gain will remain unrealized.

Taxation of unrealized forex gains

The taxation of unrealized forex gains can vary depending on the country of residence and the specific tax laws in place. In general, most countries do not tax unrealized forex gains. This is because until the gain is realized, it is not considered income.

However, there are some exceptions to this rule. For example, in the United States, unrealized forex gains are taxable if they are held in a tax-deferred retirement account such as an IRA or 401(k). This is because the gains will eventually be realized when the assets in the account are distributed.

In addition, if a company or individual has a foreign currency bank account and earns interest on that account, the interest income would be taxable in most countries. This is considered income regardless of whether or not the forex gain is realized.

Realized forex gains, on the other hand, are generally taxable in most countries. In the United States, for example, realized forex gains are considered ordinary income and are subject to the same tax rates as other forms of income. The tax rate can vary depending on the amount of the gain and the taxpayer’s income tax bracket.

Conclusion

In conclusion, unrealized forex gains are gains that have not yet been converted into cash or another currency. In general, most countries do not tax unrealized forex gains. However, there are some exceptions to this rule, such as in the case of tax-deferred retirement accounts or interest income earned on a foreign currency bank account. Realized forex gains, on the other hand, are generally taxable in most countries and are considered ordinary income. It is important for businesses and individuals to understand the tax implications of forex gains and losses, and to consult with a tax professional if necessary.

Categories
Popular Questions

How to create forex indicator?

Forex trading is a lucrative business that requires a great deal of analysis and strategy. Forex indicators are essential tools that traders use to analyze market trends, identify potential trading opportunities, and make informed decisions. These indicators are mathematical calculations based on market data, and they help traders to understand the market better.

Creating a forex indicator can seem daunting, but it is not as complicated as it seems. In this article, we will discuss the steps to create a forex indicator.

1. Choose a Programming Language

The first step to creating a forex indicator is to choose a programming language. The most popular language for forex trading is MetaQuotes Language 4 (MQL4), which is the language used in MetaTrader 4. MQL4 is an object-oriented language that allows traders to create custom indicators, expert advisors, and scripts.

Other popular programming languages for forex trading include Python, C#, and Java. Python is an excellent language for data analysis, while C# and Java are suitable for developing trading platforms.

2. Define the Indicator

The next step is to define the indicator. A forex indicator is a calculation based on market data that helps traders to identify market trends. There are several types of indicators, including trend indicators, momentum indicators, and volatility indicators.

To define the indicator, you need to specify the calculation formula, the data inputs, and the output. For example, you could create a moving average indicator that calculates the average price of a currency pair over a specified period.

3. Write the Code

Once you have defined the indicator, the next step is to write the code. This involves writing the code that performs the calculations and generates the output. The code should be written in the programming language you have chosen.

When writing the code, it is important to ensure that it is efficient and optimized for speed. This is because indicators are used in real-time trading, and they need to perform calculations quickly.

4. Test the Indicator

After writing the code, the next step is to test the indicator. This involves backtesting the indicator on historical data to see how it performs. Backtesting involves running the indicator on historical data to see how it would have performed in real-time trading.

During backtesting, you need to analyze the results to determine if the indicator is accurate and reliable. If the results are not satisfactory, you may need to tweak the formula or adjust the inputs.

5. Optimize the Indicator

Once you have tested the indicator, the next step is to optimize it. This involves refining the formula and inputs to improve the accuracy and reliability of the indicator. Optimization requires analyzing the historical data and identifying patterns and trends.

Optimization is an ongoing process that requires constant monitoring and tweaking. You need to keep testing the indicator and making adjustments until you are satisfied with its performance.

6. Implement the Indicator

The final step is to implement the indicator. This involves adding the indicator to your trading platform and using it in real-time trading. It is important to ensure that the indicator is integrated correctly and is working properly before using it in live trading.

In conclusion, creating a forex indicator requires a good understanding of programming languages, market data, and trading strategies. By following the steps outlined in this article, you can create a custom indicator that meets your trading needs. Remember to test and optimize the indicator to improve its accuracy and reliability. With a well-designed forex indicator, you can make more informed trading decisions and improve your profitability.

Categories
Popular Questions

Which forex brokers use an extra letter?

Forex brokers are intermediaries between traders and the foreign exchange market, providing access to trading platforms and facilitating trades. In the forex market, currency pairs are traded, and brokers earn commissions or spreads on each transaction.

Many forex brokers use an extra letter in their name to differentiate themselves from their competitors or to create a unique brand identity. These extra letters can represent various meanings, such as the broker’s location, specialization, or focus on a specific market.

One example of a forex broker that uses an extra letter is XM Group. The letter “M” in XM Group stands for Markets, reflecting the broker’s focus on providing access to multiple financial markets, including forex, stocks, commodities, and indices.

Another forex broker that uses an extra letter is FXTM. The letter “T” in FXTM stands for Time, reflecting the broker’s commitment to providing timely and accurate information to its clients. FXTM also offers a range of educational resources and research tools to help traders make informed decisions.

IC Markets is another forex broker that uses an extra letter. The letter “C” in IC Markets stands for Connectivity, reflecting the broker’s emphasis on providing fast and reliable connectivity to the forex market. IC Markets also offers low spreads and fast execution speeds, making it a popular choice among traders.

One forex broker that uses an extra letter to denote its location is OANDA. The letter “A” in OANDA stands for America, reflecting the broker’s headquarters in the United States. OANDA also has offices in Canada, Europe, Asia, and Australia, making it a global forex broker.

In conclusion, many forex brokers use an extra letter in their name to differentiate themselves from their competitors or to create a unique brand identity. These extra letters can represent various meanings, such as the broker’s location, specialization, or focus on a specific market. Traders should carefully consider a broker’s reputation, regulation, and trading conditions before choosing a forex broker to work with.

Categories
Popular Questions

What are the safest and most profitable tradign pairs in forex?

Forex trading involves buying and selling currency pairs in order to make a profit. The currency pairs traded in the forex market are many, and choosing the right pair to trade can be a challenging task. Traders must consider several factors when choosing a currency pair to trade, such as volatility, liquidity, and trading volume. In this article, we will discuss the safest and most profitable trading pairs in forex.

1. USD/EUR

The USD/EUR currency pair is the most popular and widely traded pair in the forex market. Both currencies are considered to be safe-haven currencies, which means they are highly sought after during times of economic uncertainty. The US dollar is the world’s reserve currency, and the euro is the second most popular currency in the world. This pair is highly liquid and has low volatility, making it an ideal choice for both beginner and experienced traders.

2. USD/GBP

The USD/GBP currency pair is another popular and highly traded pair in the forex market. The US dollar and British pound are both considered to be safe-haven currencies, and the pair is highly liquid, making it easy to buy and sell. The British pound is also heavily influenced by the performance of the UK economy, which makes it an attractive option for traders looking to capitalize on economic events.

3. USD/JPY

The USD/JPY currency pair is one of the most traded pairs in the forex market. The Japanese yen is considered to be a safe-haven currency, and the pair is highly liquid and has low volatility. The pair is also heavily influenced by the performance of the Japanese economy, making it an attractive option for traders looking to capitalize on economic events.

4. USD/CHF

The USD/CHF currency pair is another popular and highly traded pair in the forex market. The Swiss franc is considered to be a safe-haven currency, and the pair is highly liquid and has low volatility. The pair is also heavily influenced by the performance of the Swiss economy, making it an attractive option for traders looking to capitalize on economic events.

5. EUR/GBP

The EUR/GBP currency pair is a popular and highly traded pair in the forex market. Both currencies are heavily influenced by the performance of the European and UK economies, making it an attractive option for traders looking to capitalize on economic events. The pair is also highly liquid and has low volatility, making it an ideal choice for both beginner and experienced traders.

6. EUR/USD

The EUR/USD currency pair is another popular and highly traded pair in the forex market. The euro is the second most popular currency in the world, and the US dollar is the world’s reserve currency, making the pair highly liquid and easy to buy and sell. The pair is also heavily influenced by the performance of the US and European economies, making it an attractive option for traders looking to capitalize on economic events.

Conclusion

Choosing the right currency pair to trade in the forex market can be a daunting task for traders. The safest and most profitable trading pairs in forex are those that are highly liquid, have low volatility, and are influenced by the performance of the world’s major economies. The USD/EUR, USD/GBP, USD/JPY, USD/CHF, EUR/GBP, and EUR/USD currency pairs are the most popular and widely traded pairs in the forex market, making them an ideal choice for both beginner and experienced traders. As with any investment, it is important to conduct thorough research and analysis before choosing a currency pair to trade.

Categories
Popular Questions

How to invest in forex without subscriptions?

Forex trading is one of the most popular investment methods in the world. With its high liquidity and volatility, many investors are drawn to the potential for high returns. However, for many, the idea of paying for expensive subscriptions to access trading signals and analysis can be a barrier to entry. Fortunately, there are ways to invest in forex without subscriptions.

Here are some practical steps to follow if you want to invest in forex without subscriptions:

1. Learn the basics of forex trading

The first step to investing in forex without subscriptions is to learn the basics of forex trading. This includes understanding the forex market, the different currency pairs, and the various trading strategies that traders use to make profits. You can find a wealth of information online, including free courses, tutorials, and e-books.

2. Choose a reputable forex broker

Once you have a basic understanding of forex trading, the next step is to choose a reputable forex broker. A forex broker is a company that provides traders with access to the forex market. A good broker should be regulated by a reputable financial authority, offer competitive spreads and fees, and have a user-friendly trading platform. Some popular forex brokers include IG, Saxo Bank, and Plus500.

3. Open a demo trading account

Before you start trading with real money, it is recommended that you open a demo trading account with your chosen forex broker. A demo account allows you to practice trading with virtual money, which will give you a feel for how the forex market works and how to use the trading platform. This is a great way to test your trading strategies and build your confidence before you start trading with real money.

4. Develop a trading strategy

Once you have some experience trading with a demo account, it’s time to develop a trading strategy. A trading strategy is a set of rules that you follow when trading, which should be based on your goals, risk tolerance, and trading style. There are many different trading strategies, including technical analysis, fundamental analysis, and price action trading.

5. Use free forex tools and resources

There are many free forex tools and resources available that can help you make better trading decisions. These include forex news websites, economic calendars, and technical analysis tools. By using these resources, you can stay up-to-date with market news and trends, which can help you make more informed trading decisions.

6. Practice good risk management

Risk management is an essential part of forex trading. It involves managing your trades in a way that minimizes your losses and maximizes your profits. Some basic risk management techniques include setting stop-loss orders, limiting your position sizes, and diversifying your trades. By practicing good risk management, you can protect your trading capital and increase your chances of long-term success.

In conclusion, investing in forex without subscriptions is possible, but it requires some effort and dedication. By learning the basics of forex trading, choosing a reputable forex broker, developing a trading strategy, using free forex tools and resources, and practicing good risk management, you can start investing in forex with confidence and without paying for expensive subscriptions.

Categories
Popular Questions

How much does the average forex trader make uk?

Forex trading has become a popular way to earn a living in the UK. However, the question on the lips of many aspiring traders is how much do forex traders make in the UK on average? This is not a straightforward question to answer, mainly because forex trading is not a salaried profession. A trader’s earnings are determined by their level of experience, trading strategy, risk management, and the size of their trading account. In this article, we will delve into the factors that affect forex traders’ earnings in the UK and how to identify if you are on the right path to success.

Forex Trading as a Career

Forex trading involves buying and selling different currencies in the hopes of making a profit. Traders can use leverage to magnify their trades’ size, but this also increases the risk of losses. Forex trading is a highly competitive field, and it requires a lot of dedication, hard work, and discipline to succeed. It is not a get-rich-quick scheme, and traders must be prepared to endure losses before making any significant profits.

Factors that Affect Forex Trader Earnings

1. Trading Strategy

The trading strategy a trader uses significantly affects their earnings. Some traders use technical analysis, while others use fundamental analysis or a combination of both. Some traders focus on short-term trades, while others prefer long-term trades. It is essential to find a strategy that suits your personality, trading style, and risk tolerance.

2. Experience

Experience is crucial in forex trading. The more experienced a trader is, the more likely they are to make profits consistently. Experienced traders know how to manage their risks, identify profitable trades, and avoid losses. However, experience takes time, and new traders should expect to make losses as they learn the ropes.

3. Risk Management

Risk management is critical in forex trading. Traders must have a plan for managing their risks and avoiding losses. This can include setting stop-loss orders, limiting the size of trades, and diversifying their portfolio. The ability to manage risks effectively can significantly impact a trader’s earnings.

4. Trading Account Size

The size of a trader’s account also affects their earnings. Traders with larger accounts can make more significant profits, but they also face higher risks. It is essential to balance the size of your account with your risk tolerance and trading strategy.

5. Market Conditions

Market conditions can also affect a trader’s earnings. Volatile markets can provide opportunities for significant profits, but they also increase the risk of losses. Traders must keep up to date with market news and events and adjust their strategies accordingly.

How Much Do Forex Traders Make in the UK?

It is difficult to determine how much forex traders make in the UK on average, mainly because earnings vary significantly depending on the factors mentioned above. The amount a trader can make depends on their level of experience, trading strategy, risk management, and the size of their account.

According to a survey by the Bank for International Settlements, the average daily forex trading volume in the UK was $2.6 trillion in 2019. This indicates that there are significant opportunities for profits in the forex market. However, it is also a highly competitive field, and not all traders will make consistent profits.

Conclusion

Forex trading can be a lucrative career for those who are dedicated, disciplined, and have a solid trading strategy. However, earnings vary significantly depending on a trader’s level of experience, trading strategy, risk management, and the size of their account. It is essential to approach forex trading as a long-term investment and be prepared to endure losses before making significant profits. With the right approach and mindset, forex trading can provide an excellent opportunity to earn a living in the UK.