
CAD/JPY produced a bullish inside bar yesterday. The price had a bounce at the same level earlier and made a bullish move. The daily chart suggests that the price has some space to travel towards the North. However, if a bullish inside bar is followed by a bearish engulfing candle, it ends up being prolific for the sellers. The H4 chart looks bullish. On the other hand, the H1 chart looks a bit bearish biased. Thus, traders are to be very watchful to trade in the pair. Let us now have a look at three vital charts.
Chart 1 CAD/JPY Daily Chart
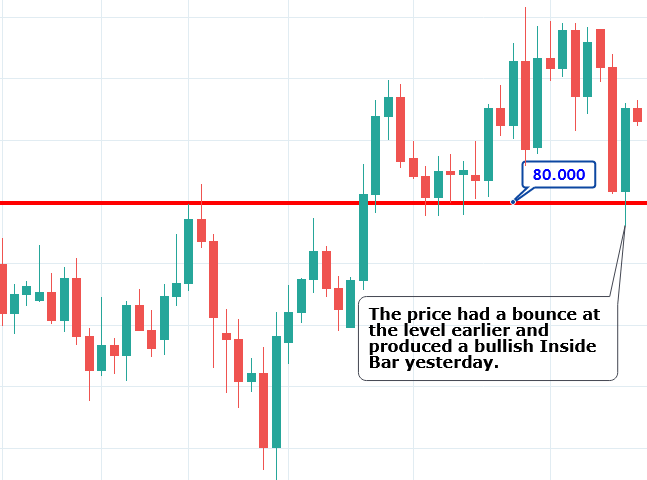
The chart shows that it had a bounce at the level of 80.000 earlier. It is a massive round number. It pushed the price towards the North, and the price made a bearish move, closing within the level. Yesterday’s candle came out as a bullish inside bar. As far as the round numbered support is concerned, the price may make a bullish move. However, if the price gets bearish and ends up producing a bearish engulfing candle closing below 80.000, the sellers may go short in the pair aggressively and drive the price towards the level of 78.300. On the other hand, if the price gets bullish, it may find its next resistance around 81.400.
Chart 2 CAD/JPY H4 Chart
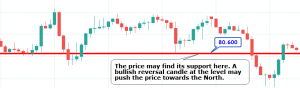
The chart shows that the price upon having a bounce at the level of 80.800 produced a spinning top and headed towards the North. It made a bullish breakout at the level of 80.600. The pair had a rejection at 80.800. It has been in a bearish correction. The level of 80.600 may work as a level of support. If the level ends up producing a bullish reversal candle, the buyers may go long above the level of 80.800. The price may find its next resistance around 81.400.
Chart 3 CAD/JPY H1 Chart
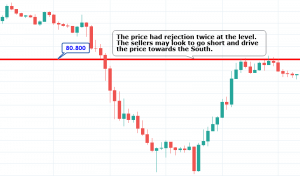
The price had a rejection at the level of 80.800 twice. It produced a bearish engulfing candle. The pair is trading around the neckline at 80.640. A bearish reversal candle may attract the sellers to go short in the pair and drive the price towards the South. The price may find its next support around 80.150. On the other hand, the buyers are to wait to go long above the level of 80.800.
The H1 chart looks bearish biased. However, the daily and the H4 chart look bullish. Considering these three charts, it seems that the pair may end up having another bullish day.