Introduction
There are millions of strategies out there in the market. Some work exceptionally well, while some fail miserably. Trading successfully is not about knowing several strategies, but about one strategy that works consistently. All professional traders are never in the hunt for trying out different strategies. They have expertise in a single strategy and know when to apply it and when not to.

Here, in this article, we shall be walking you through a simple yet extremely strategy that both day and positional traders can apply. Besides, we will enlighten you on the dos and don’ts of the strategy.
Understanding a Trend
The most evident state of the market is a trend. It is indeed the best state to trade as one can easily bet on the market’s direction. In technical terms, the trend is the state of the market, where the price makes higher-highs/higher-lows or lower-lows/lower-highs.
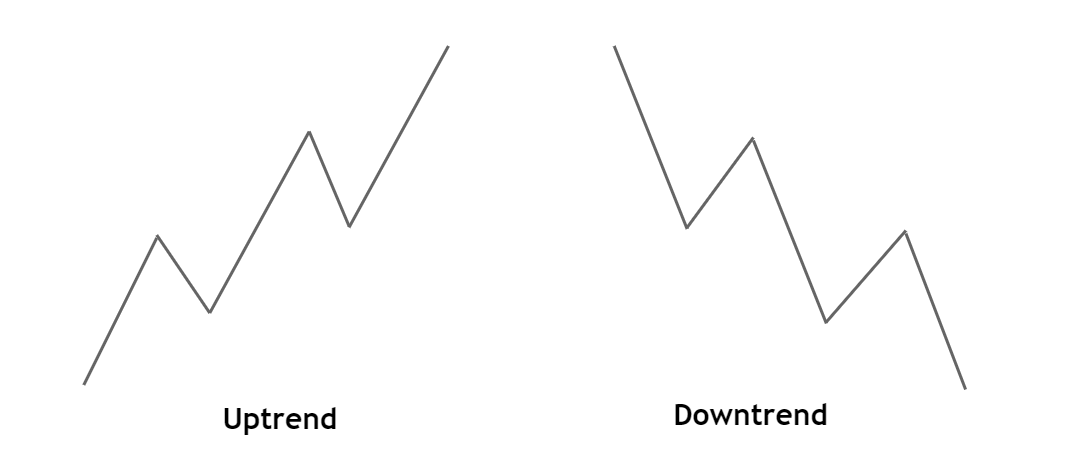
A trend alone can be of different types – based on the pattern. The above image of a trend is how an ideal trend looks like. However, the number of occurrences of this type of trend is very less. Apart from the ideal trending market, we can have other types of the same state.
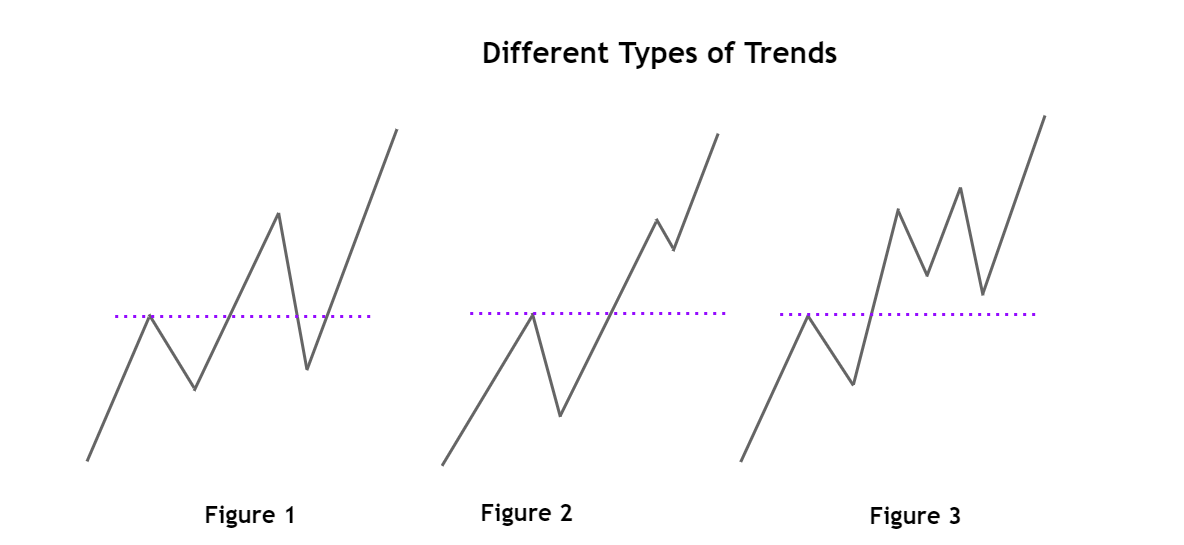
Figure 1: In this type, the market breaks about the Support and Resistance (purple line), retraces through the line, and then makes another higher high.
Figure 2: Here, the market makes a HH by breaking about the S&R (purple line), pulls back insignificantly, away from the S&R, and makes a higher high.
Figure 3: The market made HH passing through the S&R, retraced a little, tried to make a higher high, and failed. Later, it retraced more than the previous time, and then successfully made a HH.
What is the ‘Higher High Failure’ Countertrend Strategy?
The “Higher High Failure” countertrend strategy is based on the third figure of the above image. It is named countertrend because the overall trend of the market is up, but the strategy is to take a short position.
According to the strategy, in an uptrend, if the market fails to make a higher high on the very first attempt, then one can prepare to go short on the security.
Logic
In a sequence of higher highs and higher lows, if the market fails to break above the recent HH, it is an indication that the trend is preparing for another push down before heading up. The failure also indicates that the buyers are not strong enough to push the market higher with one retracement. Since the buyers are slowing down, one can swing down from the seller before the market resumes its trend. Note that the length of this south wing depends on the strength difference of the buyers are sellers.
Trading the Higher High Failure Strategy
Consider the below chart of Euro / US Dollar on the 1H time frame. We can see that the market is in an uptrend making higher highs and higher lows.
The most recent higher high made by the market was 1.11834. The market then retraced to 1.1098, tried to make a new high from the previous one, but failed by leaving a wick on the top.
The failure to make a higher high indicates that the buyers are losing momentum, and as a result, the sellers could temporarily take over the market. In addition, the wick on the top at the resistance area signifies the strength of the sellers. Thus, right after the price shoots down at holds below the S&R (grey ray), one can go short on the pair.
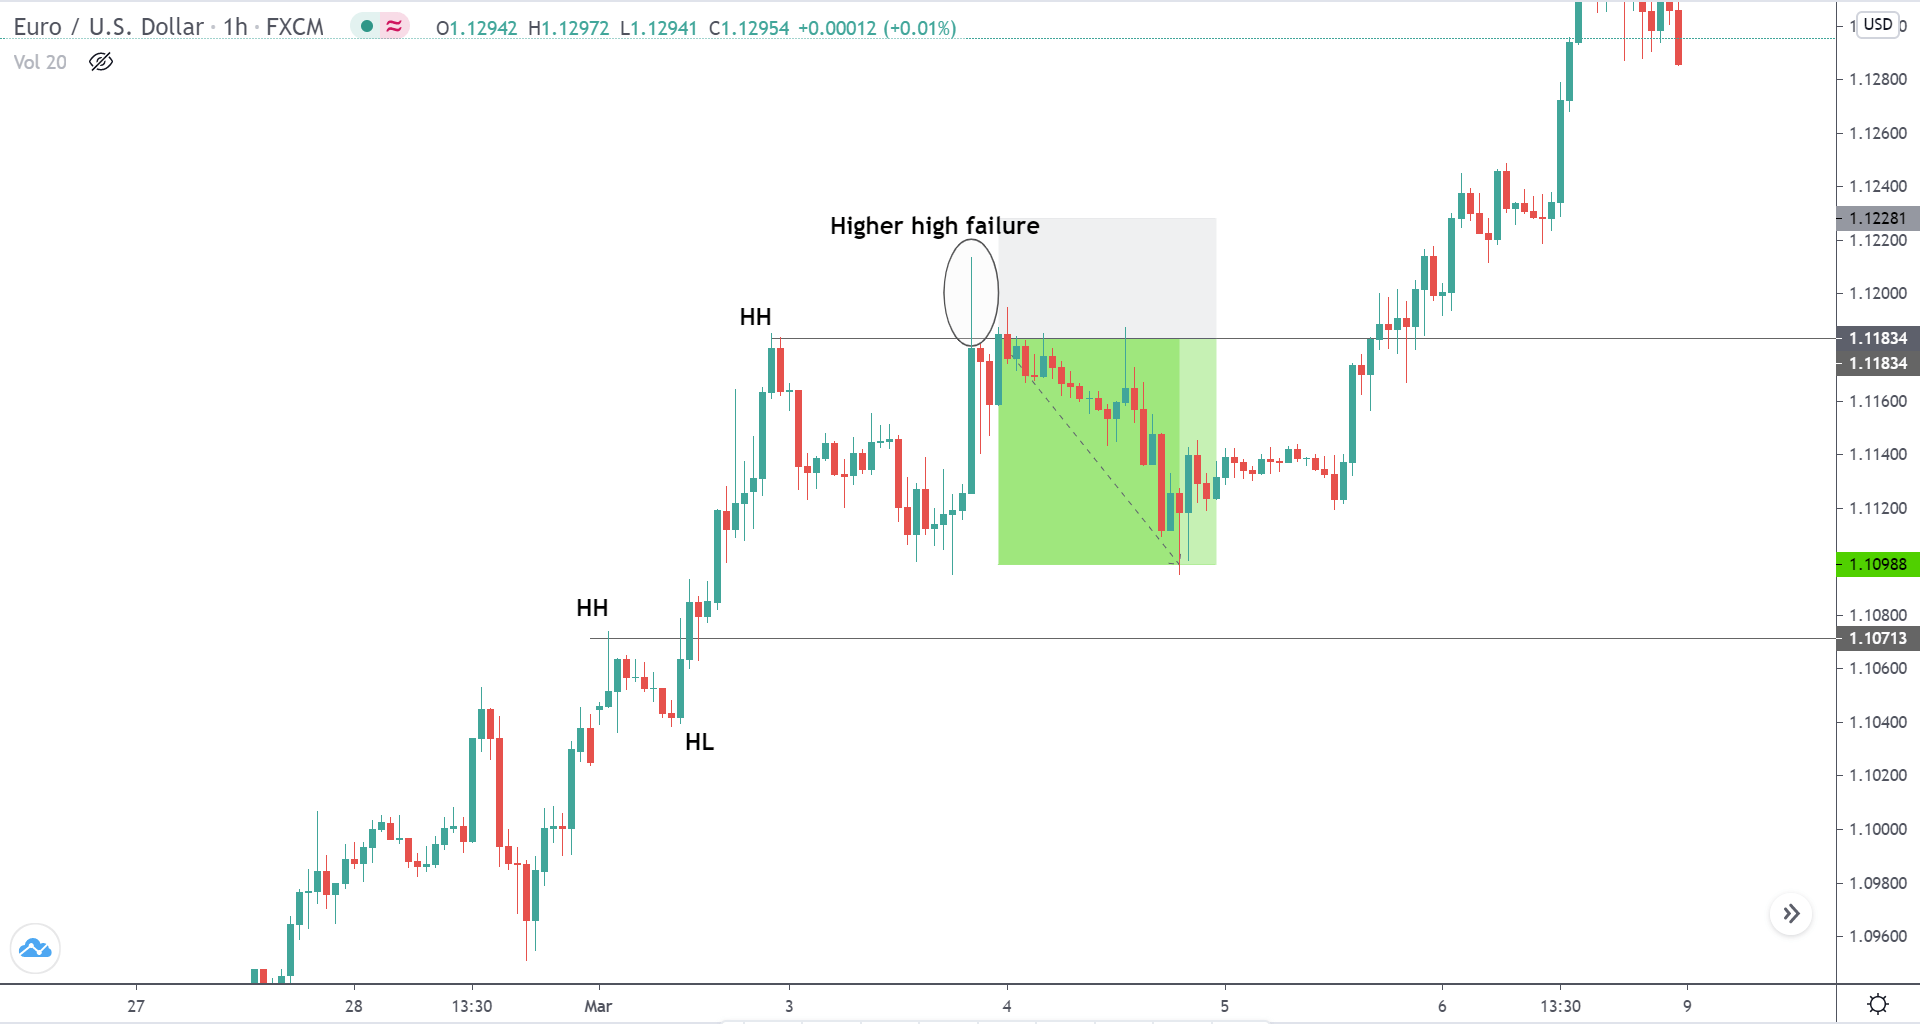
Take Profit Placement
Since the buyers shot up from 1.10988 the previous, we can expect a reaction from the same level. Hence, 1.10988 would be the safest level to place the take profit level. If the sellers are strong in momentum, one can ride down until the S&R.
Stop Loss Placement
Stop-loss few pips above the wick can keep you away from getting stopped out. But it is risky to keep the stop loss right above the resistance level.
On the flip side, this strategy will work like a charm on a downtrend as well. For a downtrend, the strategy could be termed as a “Lower Low Failure” countertrend strategy. Let’s take an example of the same and understand how to trade a down-trending market.
In the below chart of GBP/CAD, we can see that the market is in a downtrend, making lower lows and lower highs. Level 1.70006 was the most recent LL. The market retraced to the S&R and tried to make a new LL but failed. During the failure to make a LL, a spinning top candle appeared, which was then followed by a bullish candle to close above the LL level. This confirms that the sellers are have temporarily faded out, and the buyers are going take over the market.
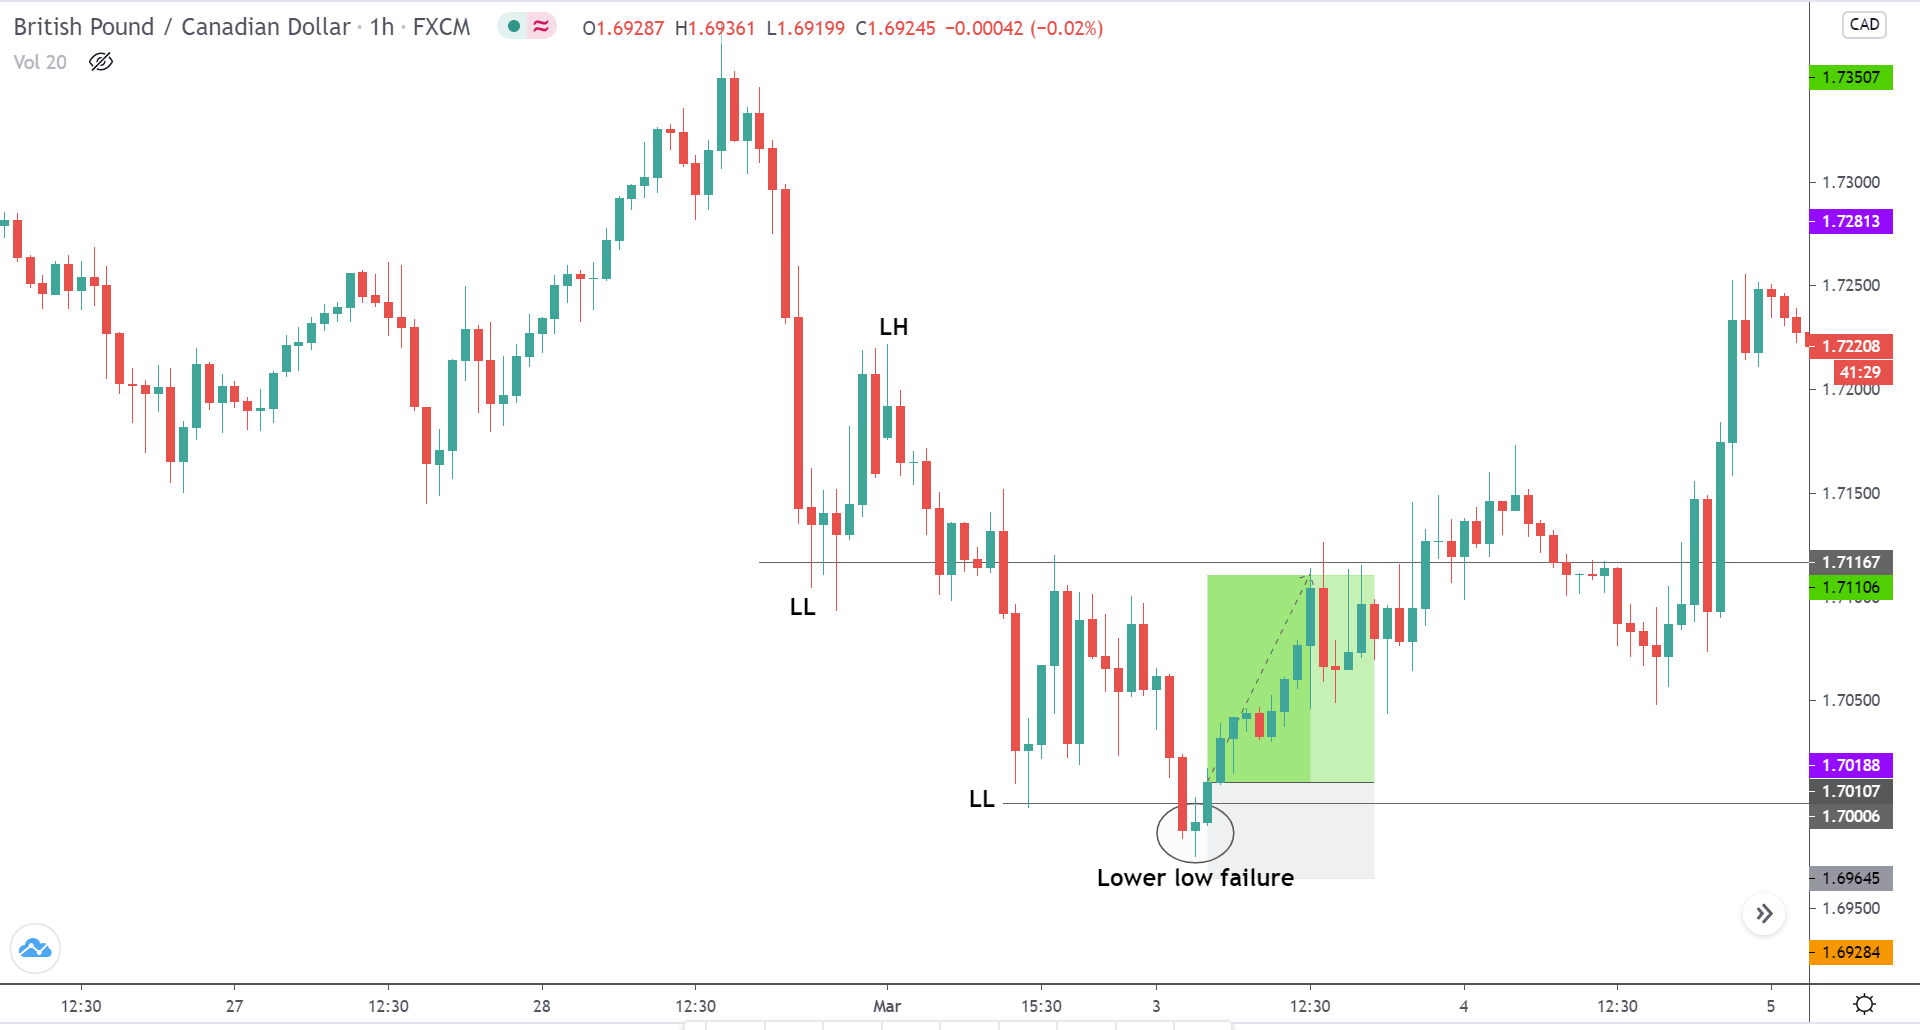
Take Profit Placement
Take profit can be placed at the price where the market tried to make a lower low previously. In this example, the TP would be at the S&R.
Stop Loss Placement
The safest stop loss for this strategy would be right below the price where it failed to make a LL.
Important Points to Note
- The price should attempt to make a higher high and fail. The strategy cannot be considered for an equal high.
- After the failure to make HH, the price should hold below the S&R level.
- The strategy will not work if the price makes HH, holds, and then drops below the S&R.
- Since it is countertrend trade, make sure to take profits at every hurdle.
- The stop loss must be above the high of the higher high failure, NOT right at the resistance.
We hope you found the strategy interesting and useful. Do test it out in the live market and let us know the results in the comment section below. Cheers!