Categories
Forex Course

151. Summary Trading Breakouts and Fake Outs.

Introduction

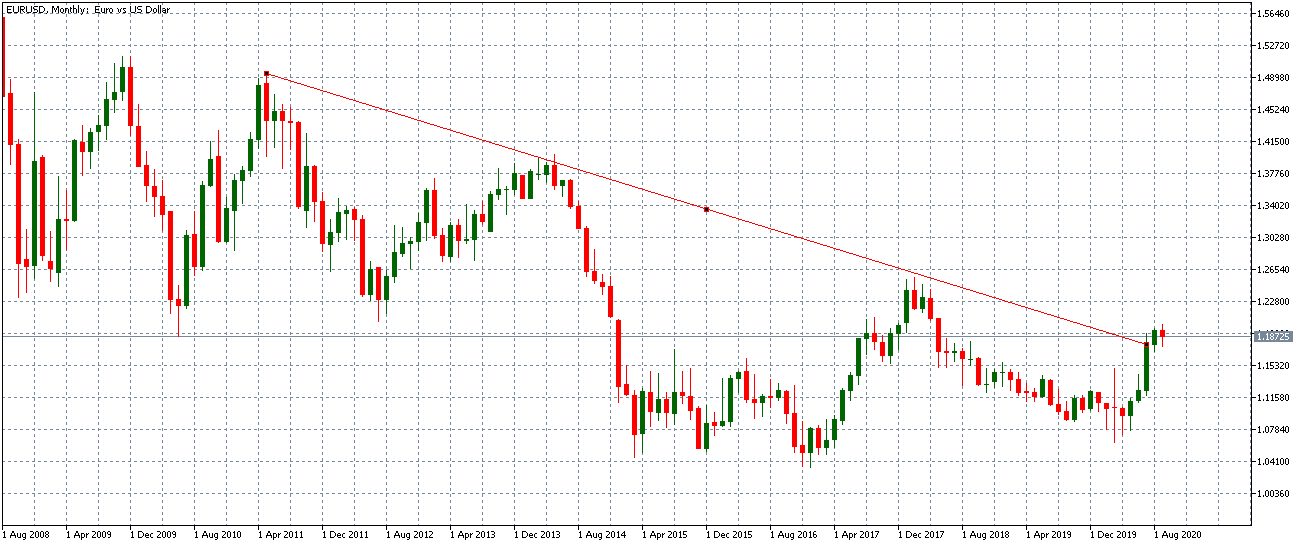
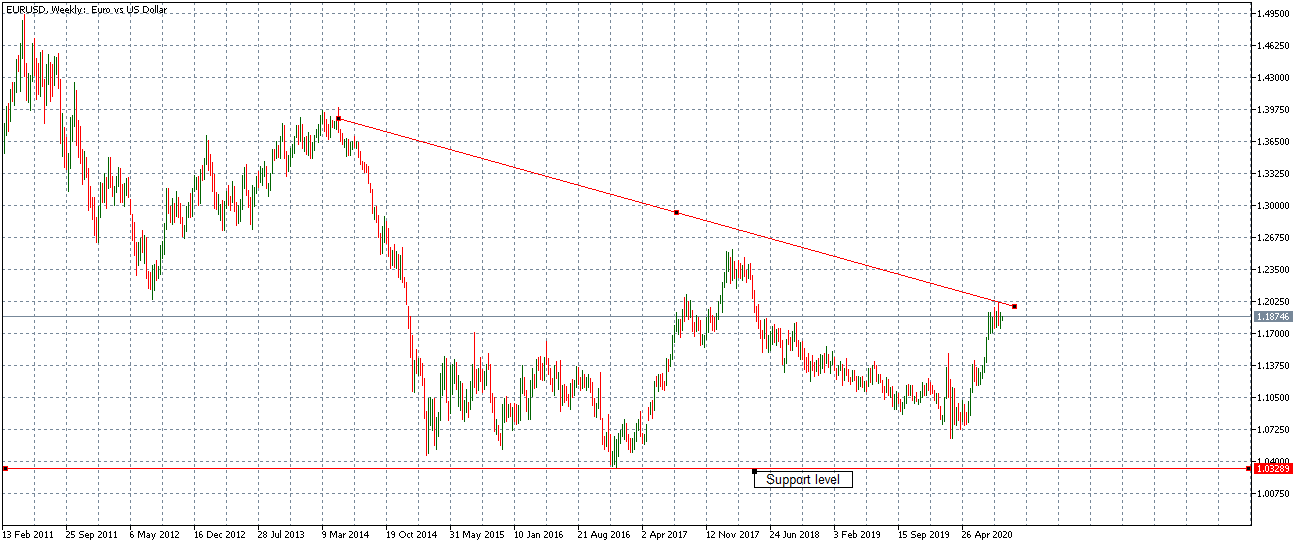
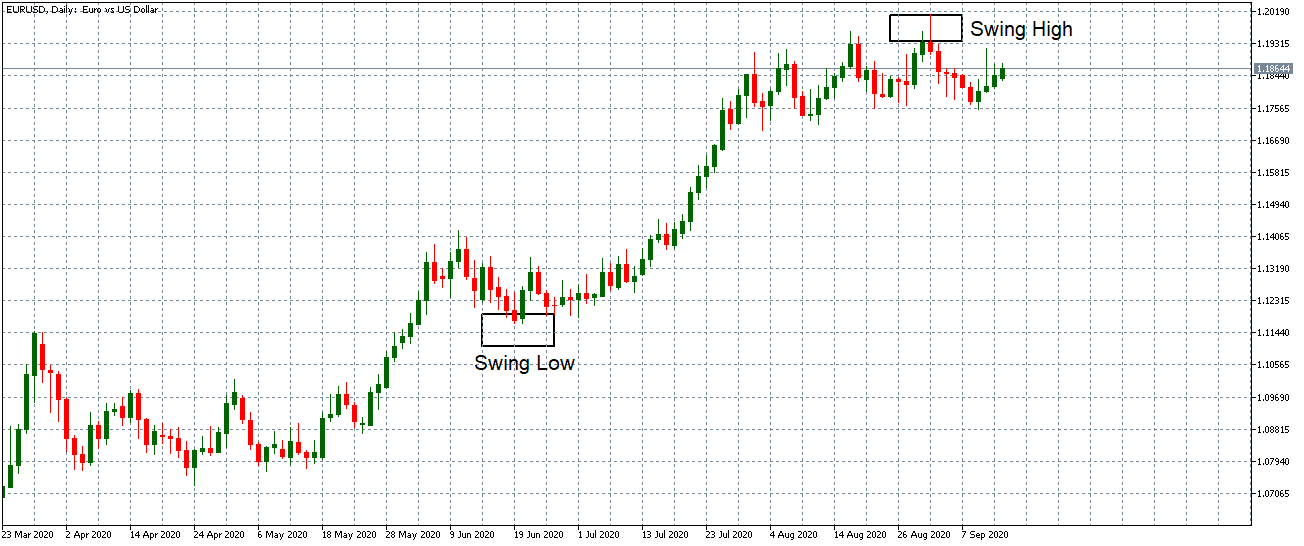
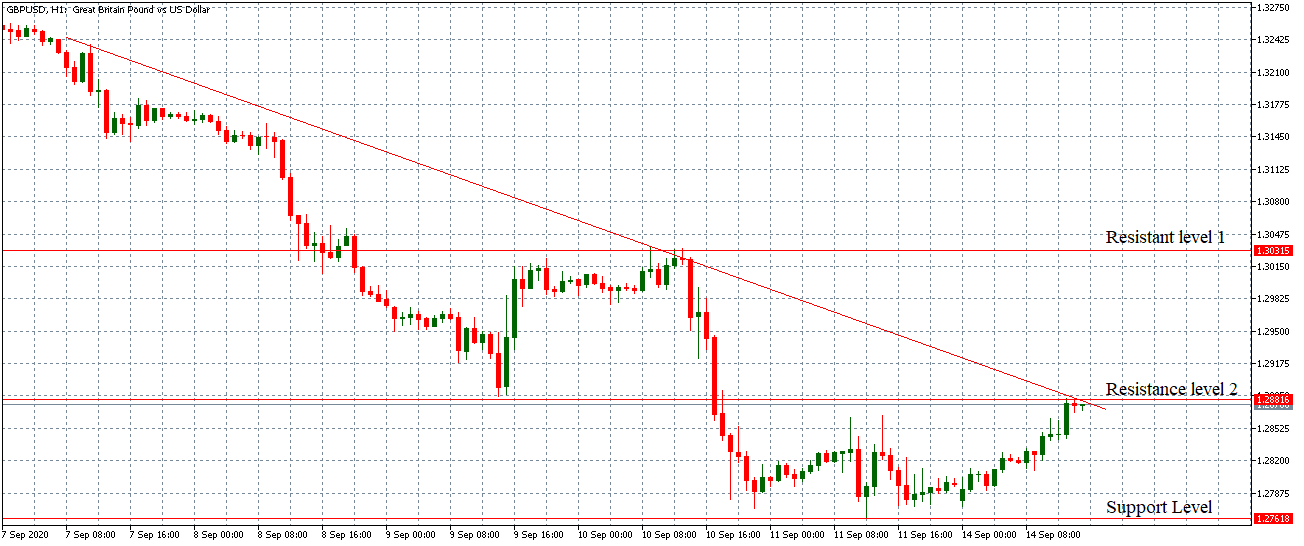
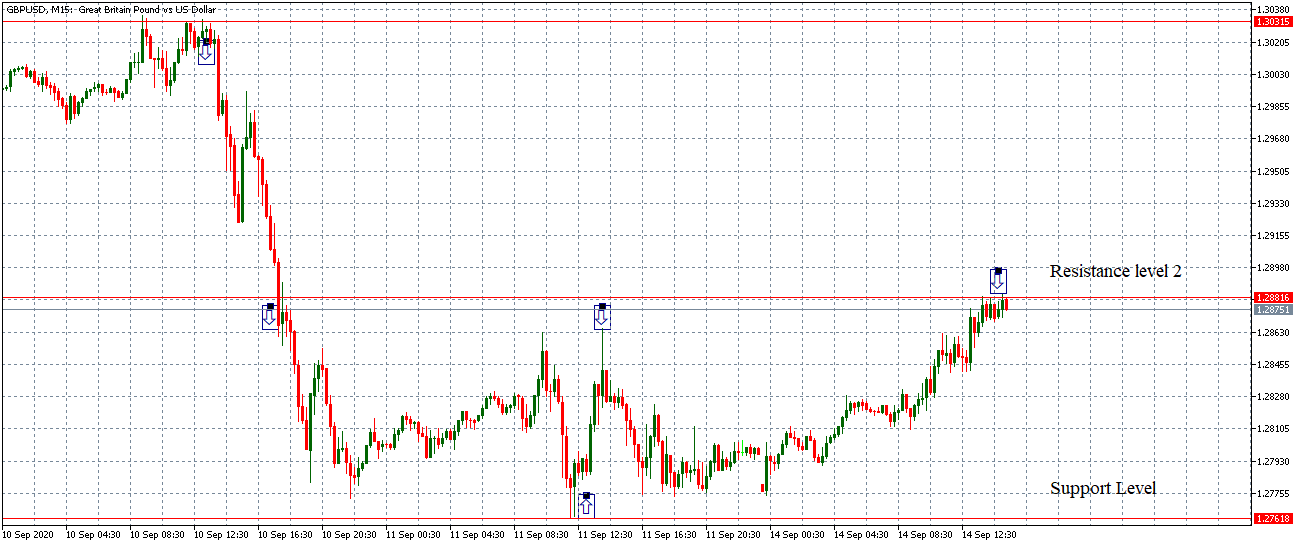
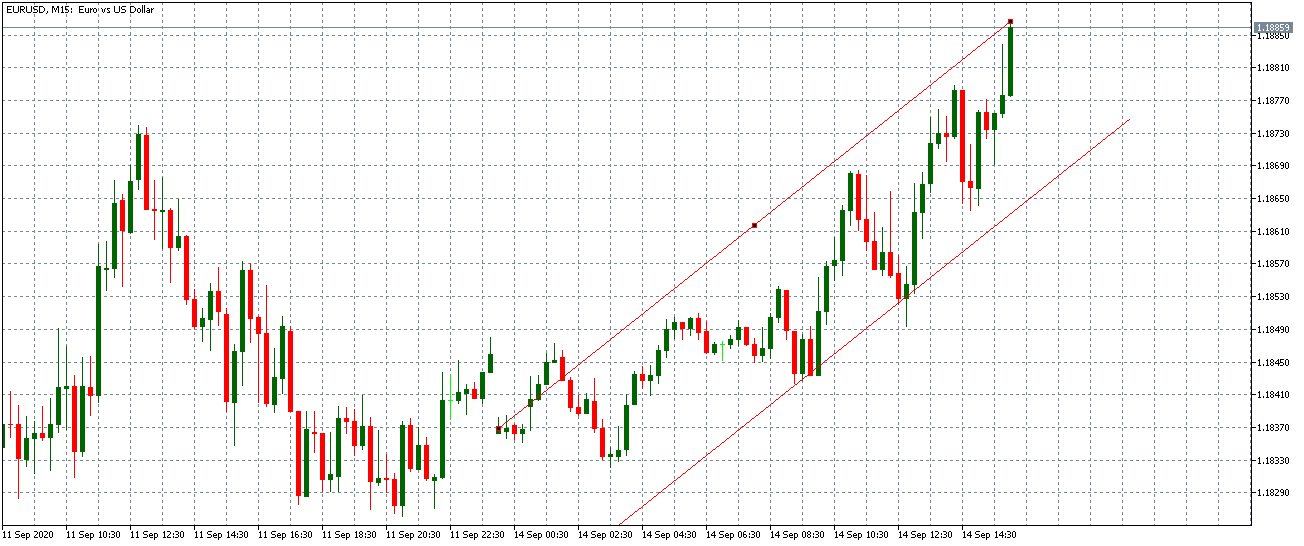
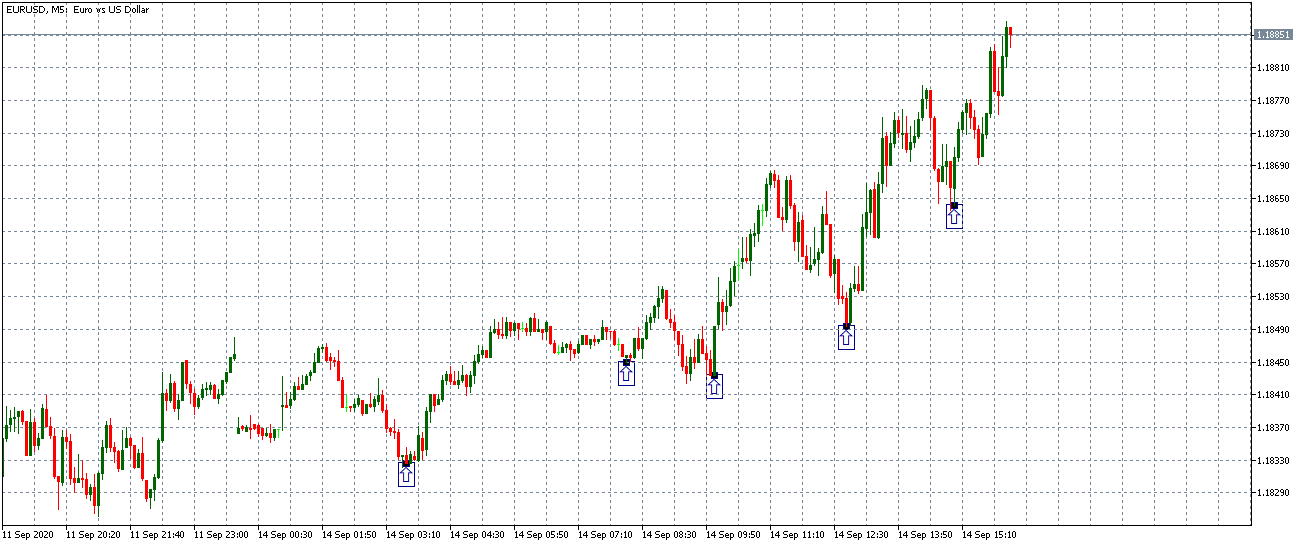
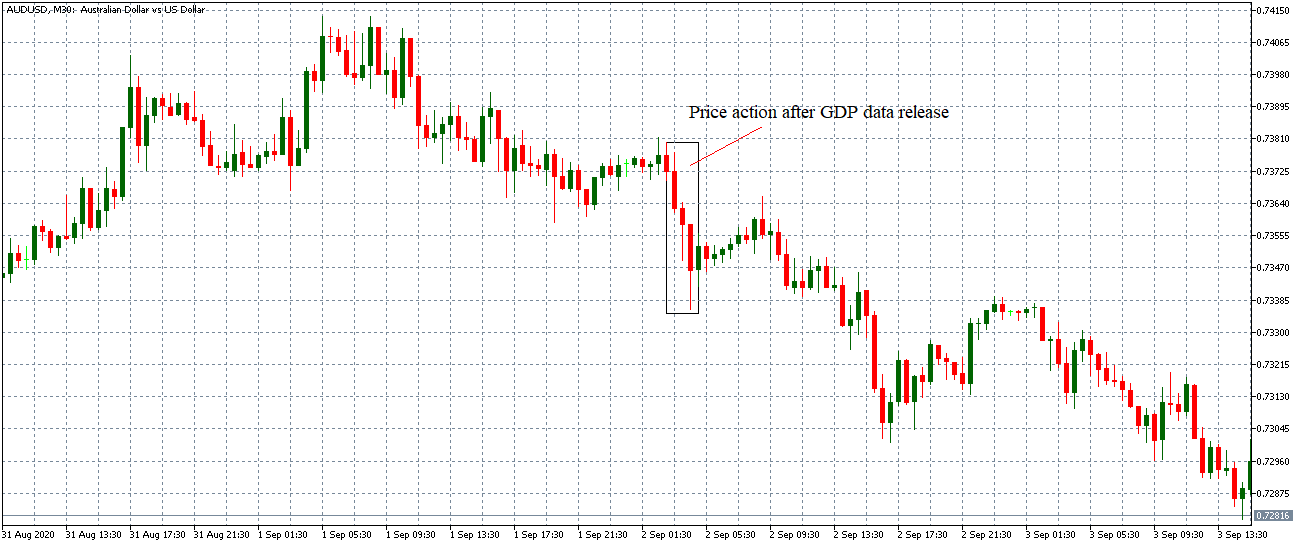
In the past few articles, we have discussed a lot of things related to trading breakouts and fakeout. The purpose of this article is to summarize the fundamentals of these concepts and understand what we have discussed until now.

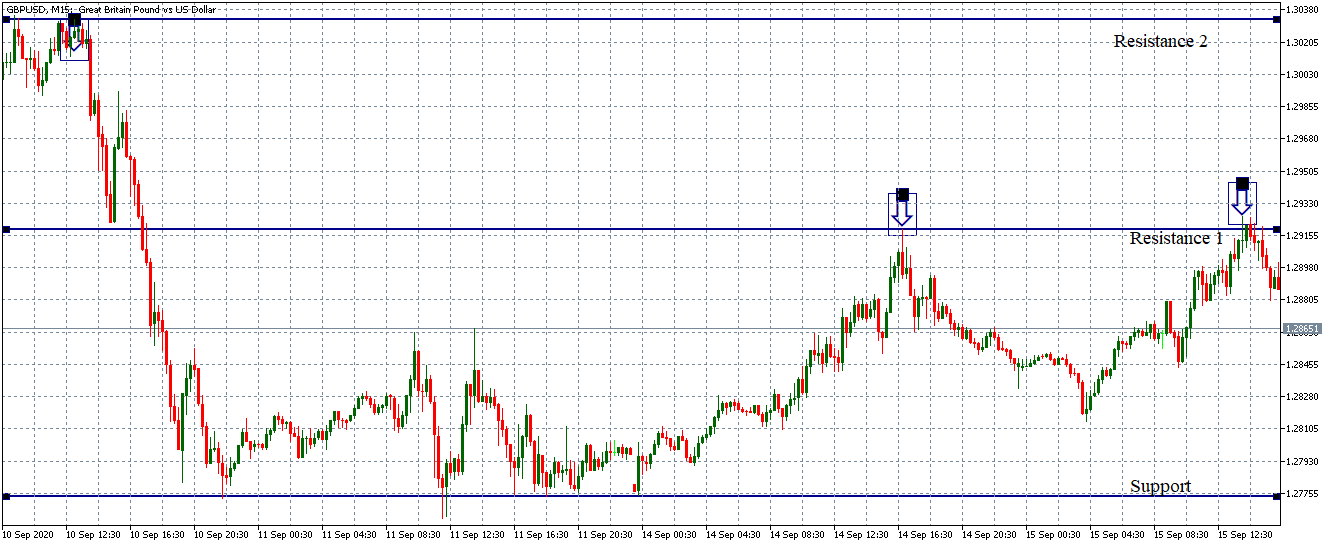
Breakout trading is one of the most popular and straightforward approach to trade the market. Most of the technical indicators lagged in the market, but the breakout trading is a way to finish this lag between the entry and the trading signal. By trading the breakout, the goal of the trader is to enter the market right when the breakout happened and holds the trade for the brand new higher high or lower low.

Volatility plays a significant role in the breakout trading to ride the longer moves, in the stock market you can use the volume indicator to find out the market volatility, but in forex trading, there is no way to see the volume visually. To overcome this issue, there are various indicators in the market used by the traders to gauge the market volatility of any underlying asset. Using these below indicators, you can measure the volatility.

  1. Bollinger Bands.
  2. Moving Average.
  3. Average True Range {ATR}.

There are usually two types of breakouts which are very popular among traders.

  1. Continuation.
  2. Reversal.

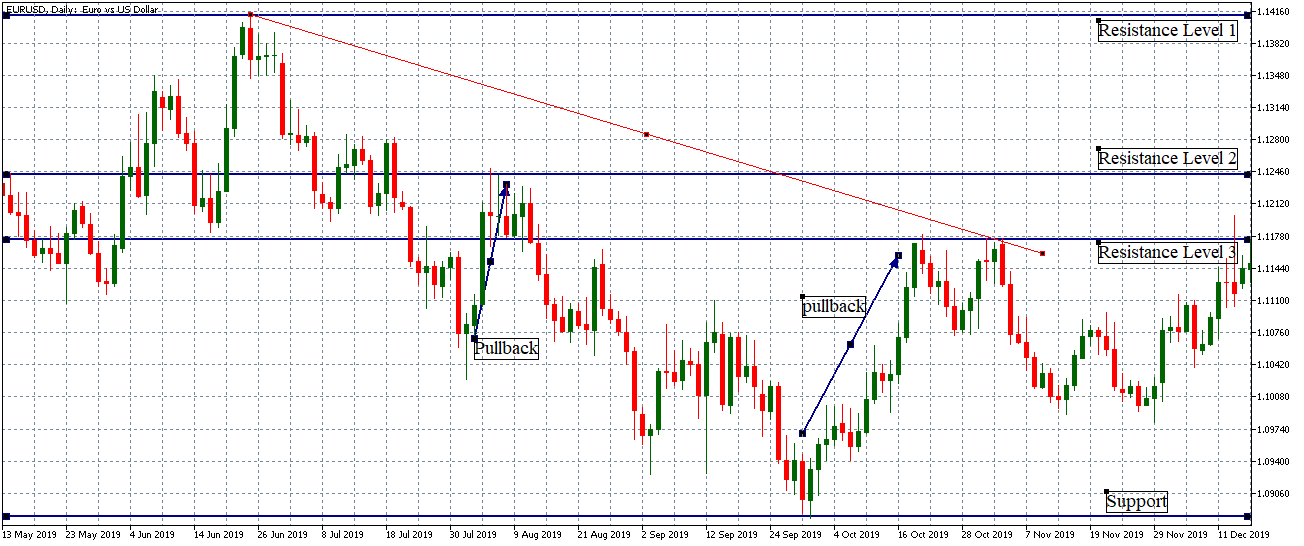
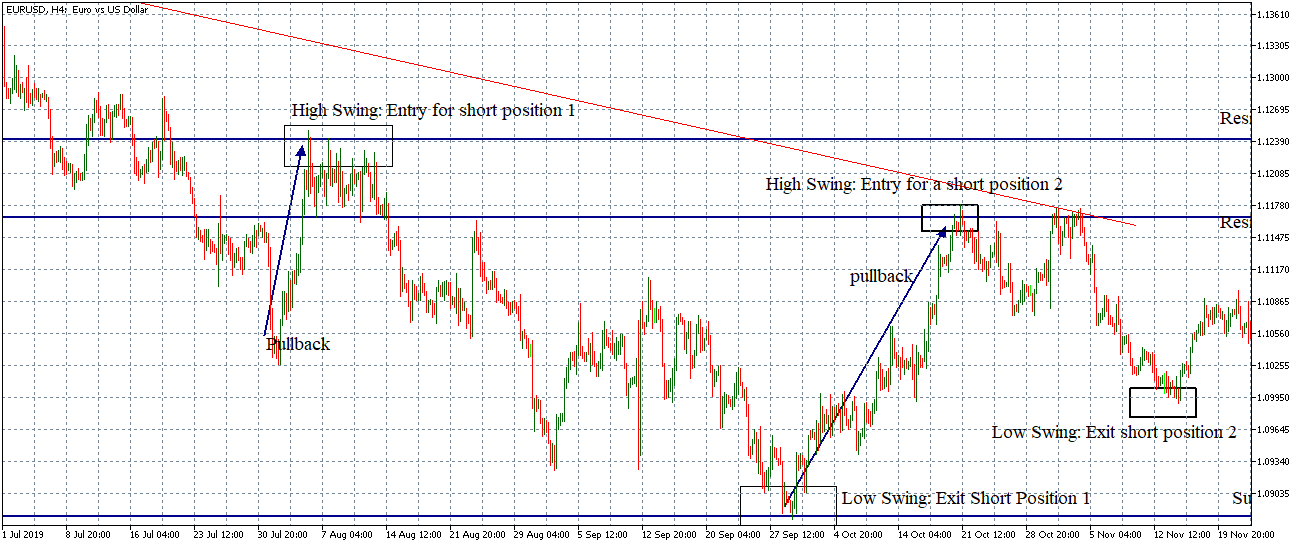
Continuation – Continuation is a type of pattern trading where the traders look for a trending market. When the price action pulls back enough and break the most recent higher high in an uptrend, it means the breakout happens, and any long trade will be highly appreciated.

Reversals – Reversal trading is also an effective way to trade the top and bottom of the market. In reversal trading, traders often look for the most recent higher low to break in an uptrend to take the selling trade. Conversely, the break of the most recent lower high is a signal to go long in an underlying asset. Breakout is the only way to catch the top and bottom in the market.

Fakeouts

A fakeout is a term used in a technical analysis which used to refer to a situation where the trader enters into a trade, but the signal never developed and the market immediately reverse against the trader. These are the most frustrating situations for the traders to deal with. Every newbie to the professionals face these kinds of situations in their trading, and it can cause a considerable amount of losses to the trader.

Most of the traders often wonder why these things happened with them. The primary causes behind these problems are the traders sometimes didn’t scan the market very well, or they didn’t focus on all the market variables. For example, sometimes news did this kind of unnecessary movements, so before entering in the trade always check is there any news coming up in the upcoming hours, if yes then ignore the trade and look for another opportunity.

Another thing does not add many indicators to your price chart, this thing will confuse you, and you will end up entering a trade way earlier. Make your charts clean and straightforward, and always use only one type of strategy to trade the market. The best way to avoid fakeouts is to fade the breakout. Fading the breakout means to wait for the price action to hold above or below the significant level then only activate the trade, do not make the mistake of entering in a trade when the price action breaks the major level, always wait for the confirmation first to avoid the unnecessary losses.

Categories
Forex Course

209. Inter Market Analysis At A Glance

Introduction

Internet analysis is referred to as a method leveraged to analyze markets by assessing the correlation between various categories of assets. This means that the ups and downs happening in one market may or may not impact the other markets. Therefore, a thorough study of their relationships is beneficial to the trader.

Understanding The Basics Of Intermarket Analysis

It works with multiple financial markets and asset classes related to each other to identify strengths or weaknesses. Rather than assessing the asset classes or financial markets individually, Inter-market analysis evaluates different correlated asset classes or financial markets like bonds, stocks, commodities, and currencies. Such analysis expands on looking at each market or asset individually while comparing them with each other.

Correlation Of Intermarket Analysis

Performing an Intermarket analysis is simple as you would need access to only data. And there is no dearth of data in today’s time; you can find them broadly and access them for free. Charting programs and spreadsheets are other things that you need for this analysis. Here you will compare one variable with another in a different data set.

In this analysis, a positive correlation can move up to +10, signifying a positive and ideal correlation between two data sets. Additionally, in a negative or inverse correlation, the value can go as down as -1.0. When the reading comes close to the zero lines, it will reflect that there lacks a discernible correlation among the two samples.

An ideal correlation between two variables for an extended time period is very uncommon. However, analysts generally agree that reading maintained below the -0.7 level or above +0.7 level is quite prominent. This level depicts around a 70% correlation. Moreover, when the correlation changes from positive to negative, it indicates an unstable relationship, which is not ideal for trading.

Please take the quiz below to know if you have got the concepts right. Cheers!

[wp_quiz id=”102178″]
Categories
Forex Course

208. Using Yuppy (EUR/JPY) As A Leading Indicator For Stocks!

Introduction

EUR/JPY is among the most popular pairs in the international foreign exchange market. In fact, it indicated approximately 3% of the overall daily transaction. Moreover, it is indicated as the seventh-highest traded currency pairs in the forex market. Both traders and investors can leverage the potentials of the EUR/JPY currency pair as they both carry a high degree of volatility.

Best Time To Trade in EUR/JPY

Although you can trade EUR/JPY at any time of the day, to leverage the most benefit, you must trade when the pair is most volatile. Between 7:30 and 15:30 is the time when the currency pair trade is the busiest.

Factors Impacting EUR/JPY Rate

When it comes to making the most lucrative trade with this pair, it is important to understand what influences its rate.

Prominence Of EUR

Like many modern currencies, the prominent factors that impact the Euro price flow are financial, political, and economic. For instance, many trade decisions regarding the Euro are backed by the European Central Bank’s monthly reports.

These reports can influence the fluctuations in the Euro’s rates, and traders and investors promptly leverage the details as quickly as they are released to determine the flow of the Euro rates.

In economic terms, news releases focusing on employment can also play an important role in the fluctuations of euro rates. These details are easily accessible and offer vital insights into the economic condition of the Euro and the movement of Euro prices.

The Prominence of JPY

Japan’s economy has more factors that play an important role in determining the flow of currency. The basic health of the economy will play a significant role in involving a high rate of export and import trading. One uncommon factor that impacts the flow of the country’s currency is situations such as a natural disaster.

The Right Way To Trade EUR/JPY

In terms of speculative trading, CFDs provide traders and investors with easy access to a plethora of markets. They like to transact with CFDs as derivatives trading implies that buying the actual currency is unnecessary. When trading, investors and traders like to harness technical analysis and assess the EUR/JPY chart. This is done to determine the relationship of the pairing and forecast the highs and lows of the markets.

[wp_quiz id=”102014″]
Categories
Forex Course

207. The Affects Of Stock Market On The Foreign Exchange Market

Introduction

The impact of the stock market on the flow of the forex market is quite significant. In fact, the foreign exchange market reflects the performance of the stock market. For instance, when the US stock market with Dow Jones, or NASDAQ, S&P 500 on the upward showing gains, the similar is likely to happen to the USD pairs in the foreign exchange market.

Rising Stock Market’s Impact

When the stock market is booming, investors from around the world will run to invest their money in the rising stocks of the nation as they are looking to obtain higher returns on the investment. With more investors demanding the currency, its value will increase significantly.

This is because if the investors want to put the money on, say, the US market, they have to convert their local currency into the US dollar. This significantly raises the demand for the dollar, hence makes the forex market perform better.

Falling Stock Market’s Impact

If the stock market is performing badly, the investors are likely to take their money out. This means that the investors will convert the currency back into the domestic ones or invest in some other country or asset. Subsequently, this will decrease the value of the concerned currency. This is something that all economies do in terms of investments.

Decision Making Based On Stock Market’s Performance 

Foreign exchange traders can leverage this information to assess the situation and predict the market. If you assess the stock of a particular currency and witness that they are moving up, then evaluate it against the currency, you will be able to make a prediction.

An increasing stock market will be influencing a boost in the value of the currency of the country. So you can base your trading decision on the same. At the same time, when the stock market is performing inadequately, you can sell the currency of that country. This is because the value of the currency will be falling in the market.

This correlation between the stock market and the foreign market can alter based on the global financial marketplace condition. The financial landscape is interconnected to different elements. Policies of central banks, political events, changes in the environment, everything affects how the trades are performed worldwide. The reason why stock influence forex is because stock includes companies that drive the economy of the country.

We hope you find this course article informative. Please let us know if you have any questions in the comments below. Cheers.

[wp_quiz id=”101824″]
Categories
Forex Course

206. The Correlation Between The Stock and Forex Markets

Introduction

The stock market encompasses individual stocks that create an index or a sector. An active under trader must define an approach to the equity as it differs depending on what she or he trades. When purchasing individual shares of an enterprise, some factors such as voting rights, dividend date, earnings per share, earnings releases, etc., play an important role.

The Relationship Between Forex and Stocks

The primary principles theory behind this is when there is an increase in the equity market rise. The demand for that particular currency also rises, resulting in more fund inflow from international investors. Additionally, it generates higher demand for the specific currency, leading it to rally instead of other foreign currencies.

On the other hand, when a local stock market does not perform well, this confidence lowers, resulting in investors to take their funds and put them somewhere safer and more lucrative.

Currency Correlation

Correlation is referred to as the measurement of the degree to which prices of two things have moved in a similar direction at the same time. For instance, if A and B prices always move up and down in sync, they have a correlation coefficient of 1, which implies an ideal positive correlation.

Contrarily if the value of these things moves simultaneously in the opposite direction, then their correlation coefficient is -1, which signifies a negative correlation.

Example – Correlation between Stock & Forex Markets

If the USA stock market performs well, international investors will sell their local currency to purchase USD-denominated stocks. When the demand for the dollar rises, it experiences an increase in value. In the Foreign exchange market, USD pairs will move in favor of the dollar ( i.e., The EURUSD falling, the USDCAD rising); hence a strong US stock market will favor the value of the US Dollar.

On the other hand, if the USA’s stock market is not performing well, investors will sell their USD-denominated shares and buy stocks or ETFs in places where they can generate more yield. This shows that the economy in the USA is performing badly. Since the demand for the dollar is less, it adversely affects the value of the US dollar.

Possibility Of Negative Correlation

There is also a possibility that the currency market will rise in answer to a volatile stock market. This may happen due to tons of other factors that contribute to currency performance. We will discuss more related to this topic in the upcoming course lessons.

Don’t forget to take the quiz below before you go. Cheers.

[wp_quiz id=”100352″]
Categories
Forex Course

205. How Global Equity Markets Affect The Forex Market?

Introduction

The equity market is also referred to as the stock or share markets. This is an extensive marketplace where traders and investors purchase and sell shares of the publicly listed organizations. The company’s share, stock, or equity is an important financial instrument that denotes the company’s ownership. Contrary to the market, when you buy a share in the stock market, you own a percentage of the company’s overall shares.

Global equity markets have a direct impact on the Forex market. A stable equity market reflects a good currency. Generally, when the country’s equity market is performing well, it attracts higher foreign investors. Therefore, it increases the demand for the local currency, resulting in a boost in a positive trade balance as well as currency appreciation.

Contrarily, when the equity market is not performing well, the investors begin to pull out their money and invest in safer securities. This results in a decrease in the demand for a particular currency.

Impact Of Global Equity Markets On The Forex Market

Forex and equity markets trades center on the currency exchanges of various countries. In case there is a rise in the equity market, more international investors will want to put their money in that particular stock.

However, to do the same, they need to transfer their local currency to the currency of a particular country. This increases the currency demand for the nation. So when there is a huge demand for the currency, its value naturally increases in the market.

Example Of How The Equity Markets Impact Forex Market

If you are looking to invest in the UK’s stock market and your local currency is US dollars. So you need first to change the USD to GBP. This way, you are selling the US dollar while purchasing the GBP.

When more people sell the USD to buy GBP, it increases the demand for pounds, thereby boosting the value of the GBP. Additionally, it also contributes to a positive trade balance. On the other hand, since more US dollars are being sold, it increases the supply of USD, which results in a fall in the value of the dollar.

So when the demand for the currency rises, its value appreciates. This makes the forex market more bullish. Similarly, if the currency demand falls, its value will also fall. It will make the forex market more bearish.

We hope you got the gist of what we are talking about. In the upcoming course lessons, we will be learning more about various equity markets and how their movement can be used to predict the Forex price charts. Cheers.

[wp_quiz id=”101514″]
Categories
Forex Course

204. The Impact Of ‘Fixed Income Securities’ On The Forex Price Charts

Introduction

Fixed income securities are investments that offer returns in terms of fixed periodic interest payments and the return of principal at the end of the security period. Contrary to variable income securities, in which the payments vary depending on the underlying measure, the payment obtained in fixed income securities are recognized in advance.

What are the Types of Fixed Income Securities?

Following are the types of fixed income securities:

Bonds: They are among the common forms of fixed income securities issued by organizations to fund the daily operations to make sure smoother and efficient production. Granted that fixed-income bonds act as a liability for the missing company, it must be redeemed as soon as the company makes sufficient revenue.

Debt Mutual Funds: These funds leverage the collected corpus for investments in different variations of fixed income securities like commercial papers, government bonds, corporate bonds, money market instruments, etc. The main benefit of these investments is that you get higher returns in comparison to the convention.

Exchange-Traded Funds: Exchange-traded funds primarily function by investing in different types of debt securities present in the market. This produces regular as well as fixed returns. This way, they offer assured stability as returns are offered periodically at a particular rate of interest. These are popular among risk-averse investors who look for stability over market advantage.

Money Markets Instruments: Certain types of money market instruments like treasury bills, commercial papers, certificates of deposits, etc., are provided as investment opportunities at a fixed interest rate and therefore are categories under the fixed income securities. Moreover, these instruments are provided for a short duration where the maturity period stands less than a year.

The Effect of Fixed Income Securities on the Movement of Currency

Understanding the relationship between fixed-income securities and currency movement is quite straightforward. Economies that provide higher rates of returns on fixed income securities are likely to attract more investments.

This makes the currency more attractive than economies that provide lower returns on the fixed income market. To determine the yields derived by the securities, you can check the official government website of a specific country.

[wp_quiz id=”97508″]
Categories
Forex Course

203. Bond Spreads Between Two Economies and Their Exchange Rate

Introduction

Bond spreads play a vital role in the movement of currencies. The difference between the bond yield of two countries is called interest rate differential. It is more impactful on the currency direction as opposed to the actual bond spreads. The difference between the interest rate between the bond yield of two countries typically moves together with the corresponding currency pair.

Understanding The Impact

The prices of different currencies can influence the monetary policy decision by the central banks across the globe. However, monetary policy decisions, as well as interest rates, can also contribute to the price movement of the currencies. For example, a stronger currency will help control the inflation rate, whereas the weaker currency will contribute to inflation.

Additionally, the central banks harness this relationship as a means to manage the monetary policies in the respective countries. By comprehending as well as assessing these relationships and the patterns, people get a window into the currency market, thereby getting a means to forecast and capitalize on the currency movements.

An Example of This Relationship

In 2000, post the tech bubble burst, traders who were earlier looking for the highest returns shifted their focus on capital preservation. However, the U.S. was provided with below 2% interest rate, a lot of hedge funds, and those who had access to the international market moved abroad looking for higher yields.

Moreover, Australia has similar risk factors as the U.S. extended interest rate of 5%. Consequentially, this attracted a lot of investment money within the country, creating asset domination. This significant difference in interest rate resulted in the growth of the carry trade. In this, the investors bought currency from low yielding countries and invested in high yielding countries, and benefited from the difference in the interest rate.

Bond Spreads and Movement Of Currency

Bong spreads differential typically move together with currency pairs. This notion emerges as the capital flows move towards high yielding currencies. When there is an increase in one currency rate with respect to another currency, the investors move towards the higher-yielding currency.

Furthermore, the cost of acquiring lower-yielding currencies rises as the bond spread differential moves in favor of selling currency.

[wp_quiz id=”97499″]
Categories
Forex Course

202. The Effects Of Bond Yields On The Forex Asset Classes

Introduction

Bonds are referred to as loans provided to big organizations, including national governments, corporations, and cities. Each bond includes a substantial amount of loan. This is because the massive operational scale of the units requires them to take money from multiple sources. Bonds are a form of fixed-income investments.

Bond Yields

Bond yield is defined as the measure of profit that you will make by investing in a bog. The less you pay for the particular bond, the more will be your profit, and the higher your yield will be. Similarly, the more money you invest in a bond, the lesser will be the profit, and subsequently, the lower will be your yield.

Bonds are traded within the foreign exchange market known as the currency pairs. It is defined as the relative rate between the currency of one country and the currency of another one. When a currency pair is traded, the traders are also acquiring one currency and selling the other.

A majority of the currency exchange transacted in the spot market. In this currency market, each participant is required to deliver their respective currency within two business days. Moreover, currency trade that involves the delivery of a currency over two days is executed on the forward market.

This market includes the costs of owning a currency relative to owing the other. And the costs are displayed in the forward’s points that are added or subtracted to the spot rate in order to produce the forward rate. Furthermore, the forward points are measured by subtracting one bond yield from the other.

How Bond Yield Impacts The Currency Movement?

Experienced foreign exchange traders will be able to identify the relationship between the value of the currency, stock prices, and bond yield. The movement in the currency value reflects the actions of foreign investors between stocks and bonds.

Additionally, the relationship between bond yields makes government bond yield serve as a valuable indicator for assessing the opinion on the effectiveness of the U.S. Federal Reserve in inflation control.

Considering that inflation is an imperative aspect that determines currency values, the data extended by the treasury is very important. Granted, the bond yield centres on inflation, as it is associated with growth.

[wp_quiz id=”97495″]
Categories
Forex Course

201. The Relationship Between The US Dollar & Crude Oil

Introduction

There is a strong and rather undiscovered string that brings together currencies and crude oil. Price actions in one area, it forces opposing or sympathetic reactions in the other. Such a correlation persists for different reasons that include the balance of trade, resource distribution, market psychology, etc.

Additionally, crude oil makes a considerable contribution to deflationary and inflationary pressures that reinforces the inter-relationships amidst the trending periods, to downside and upside.

The Relationship Between The U.S. Dollar and Oil

Oil is quoted in U.S. dollars; therefore, each downtick, as well as an uptick in the currency or in the communities price, create a direct realignment between the numerous forex crosses and greenbacks. Such movements are not that correlated in countries without major crude oil reserve.

The Changing Scenario Of Oil Correlations

Many countries harnessed the crude oil reserved amidst the historical rise of the energy market between the 1990s and 2000s. Borrowings were made excessively to develop infrastructure, execute social programs, and expand military operations.

Post the economic collapse of 2008; the bills came to sue wherein some nations delivered whereas the others decided to double down by borrowing more against the reserved in order to rebuild the trust among their impacted economies.

The substantial burden of debt assisted in keeping high growth rates until the price of the global crude oil collapses in the year 2014. This also threw commodity-sensitive countries in a recession zone. Brazil, Canada, Russian, etc. experienced a struggling period for a couple of years while they adjusted to the plummeting values of their currencies. However, they did make a comeback between 2016 and 2017.

The pressure to sell more has spread across different groups of commodities, increasing concerns related to global deflation. Subsequently, it strengthened the correlation between commodities that were affected that include economic centres without major commodity reserves and crude oil.

Moreover, currencies in countries that have major mining reserves but inadequate energy reserves witness reduced currency value in comparison to oil-rich countries.

The U.S dollar has benefited from the decline of crude oil because the U.S economic growth is for some odd reasons compared to the trading partners, maintaining the right balance.

[wp_quiz id=”97491″]
Categories
Forex Course

200. The Correlation Between USD/CAD Pair & Crude Oil

Introduction

Crude oil, also known as black gold, is the major energy source that runs the economy. Canada is among the top oil producers in the world. It is one of the major oil exporters to the USA. Canada exports more than 3 million barrels of petroleum and oil products, a figure that is sufficient to impact USD/CAD’s movement.

USD/CAD and Crude Oil – The Correlation

The volume of crude oil that Canada exports to the US generate massive demand for the CAD. Moreover, Canada’s economy depends a lot on its exports, and approximately 85% of the country’s exports go to the US.

Therefore, the value of USD/CAD is significantly impacted by how the consumers in the United States reach oil prices. If the US’s demand increases, manufacturers have to order more oil to cater to the rising demand. This can result in rising oil prices, thereby resulting in reducing the value of USD/CAD.

Conversely, if the US’s demand falls, the manufacturer will not need to order in more oil to make goods. Subsequently, the oil prices might fall, which would be bad from the CAD value. So essentially, USD/CAD has a negative correlation.

It’s all about Supply and Demand

Supply and demand are the prominent influencers of the correlation between USD/CAD and crude oil, impacting the demand and supply of US dollars and Canadian dollars.

Export of cruise oil covers a significant percentage of the US currency acquired by Canada. This means that a shift in the price and volume of crude oil will have a considerable impact on the flow of the Greenback into the Canadian dollar.

Furthermore, high crude oil prices also imply a higher flow of USD into Canada due to its exports. This implies that there will be a strong supply of the USD into the Canadian dollar, thereby increasing the value of the Canadian dollar.

Similarly, when the crude price falls, the US dollar supply will be lowered as opposed to the Canadian dollar, leading to a decreasing value of the Canadian dollar.

[wp_quiz id=”97486″]
Categories
Forex Course

199. Effects Of Gold On AUD/USD & USD/CHF Currency Pairs

Introduction

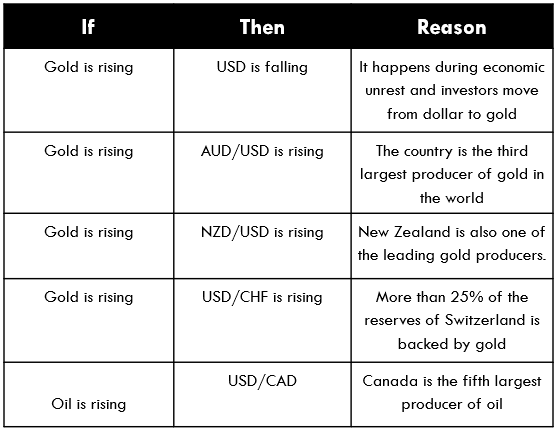
Gold is among the most traded commodities globally due to the good intrinsic value of this asset. Considering that Gold is less impacted by uncertain conditions, its prices rise when other economies perform badly and fall when there is an economic boom.

Gold impacts AUD/USD and USD/CHF in opposite manners. Price fluctuations in Gold primarily impact three major currencies that include AUD, USD, and CHF. Let’s discuss how Gold affects AUD/USD and USD/CHF.

The Effect of Gold in AUD/USD

When the price of gold rises, the AUD/USD will move upwards. These two aspects share a positive correlation; most of the time, they move together. An increase in the U.S. dollar generally contributes to the gold prices to fall and vice versa. The price of Gold perfectly depicts the economic health of the country.

During an economic crisis in the country, investors purchase Gold as protection from inflation or an economic crisis. But the inner value of the Gold does not change whether or not there is a crisis. Furthermore, gold value is displayed in the dollar, meaning every gold transaction, you spend/receive a dollar.

Australia’s Economy and its Impact on Gold Prices

AUD and Gold share a positive relationship and are inversely related to the USD. If the gold price rises, the Australian exports will increase, resulting in the expansion of the economy and foreign investment. When the gold price increases, the AUD/USD will move upwards because of the increasing demand for the AUD.

Impact on the USD/CHF

The Switzerland currency holds a positive correlation with Gold. This is because 25% of CHF is supported by the gold reserves. The refineries in Switzerland also process 70% unrefined gold every year. Additionally, Gold and CHF are inflation hedging during uncertain times.

Therefore, when the price of gold increases, the CHF value also appreciates or increases, vice-versa. Gold has a positive relationship with CHF and an inverse relationship with USD/CHF. When the price of gold rises, the value of USD/CHF falls down and vice-versa.

[wp_quiz id=”97481″]
Categories
Forex Course

198. The ‘Dollar Smile Theory’

Introduction

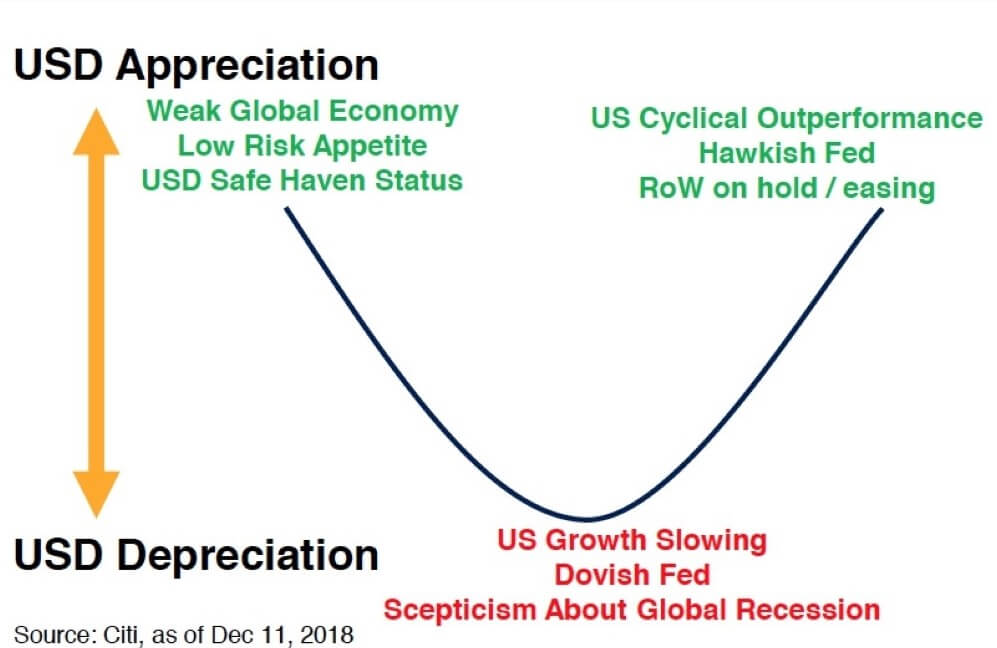
The U.S. Dollar Smile Theory is a popular notion that illustrates that the U.S. Dollar stays positive in good as well as bad market conditions. This theory was created by a former economist and strategist Morgan Stanley, and it became popular in 2007.

This was the time when the U.S. dollar witnessed a significant boost amidst the global recession. Many times, looking at the market conditions, people would think the U.S. dollar would fall, but surprisingly it continues to grow.


Source: here.

Why does that happen?

The Dollar Smile Theory answers this question.

Following are the three scenarios that Morgan Stanley put forward to explain the positive growth of the U.S. Dollar.

  • The Strength Due To Risk Aversion

The first reason that the U.S. dollar rise is due to risk aversion. This is a situation where investors rely more on safe-haven currencies such as the dollar, yen, etc. During this period, investors consider the global economy in an unstable position. Hence, they are less likely to invest in the risky asset; instead, they put their cash on U.S. dollars.

  • The Dollar Weakens to New Low – Economic Recession and Slowdown

Under this scenario, the US dollar falls to a new low. The bottom of the smile indicates the dull performance of the currency as the economy struggles with weak fundamentals. Additionally, the possibility of falling interest rates also impacts the position of the U.S. Dollar. This results in the market participants steering clear from the dollar.

Subsequently, the primary motto of the U.S. Dollar becomes to Sell. Investors move from buying the currency to selling it and moving towards currencies that are providing higher yields.

  • The Strength Of The U.S. Economy Helps

The U.S. dollar continues to grow because of the strong economy of the country. After the low, a new smile emerges as the economy sees its light at the end of the tunnel. With the signs of the recovery of the economy, a sense of optimism spreads through the market.

This increases the sentiments towards the dollar again. With the US economy enjoying higher GDP growth, the greenback continues to appreciate. This increases the interest rate in the international market.

Though the theory is quite relevant and backed by some logic, the economy is extremely volatile. So only time will tell how definite the Dollar Smile theory is in the future.

[wp_quiz id=”97467″]
Categories
Forex Course

197. Using The USDX Numbers To Trade The Forex Market

Introduction

The U.S. Dollar Index is one of the most reckoned currency indexes and trades on exchanges with the DXY ticker or the USDX ticker. This index has been around in the market since 1973, when the base value was kept at 100,000.00, which is now 100.00.

It is a very prominent factor that facilitates Greenback. And the basket used to measure the U.S. dollar index value has only been changed once post-Euro replaced many other European currencies in 1999.

Formula To Calculate USDX

USDX = 50.14348112 * the EUR/USD exchange rate ^ (-0.576) * the USD/JPY exchange rate ^ (0.136) * the GBP/USD exchange rate ^ (-0.119) X the USD/CAD exchange rate ^ (0.091) × the USD/SEK exchange rate ^ (0.042) * the USD/CHF exchange rate ^ (0.036).

Implementing The US Dollar Index to Trade Forex

The movement determined in the U.S. currency index, such as the USDX, offers traders a sense of how the currency is experiencing a change in its value against other currencies in the index. For instance, if there is a rise in the USDX level, this indicates the rise in the U.S. dollar. Similarly, when the level of USDX is falling, so is the dollar in the foreign exchange market.

Many financial reporters leverage the changes witnessed in the U.S. Dollar Index’s value to offer their viewers and audiences an idea of how the U.S. dollar performed in the foreign exchange market. This works as an alternative to analyzing how each currency increased or decreased against the dollar.

Moreover, the USDX can also act as an inverse indicator that reflects the strength of the consolidated Euro currency of the European Union, considering that the weight of Euro (57.6%) is the most in the index.

Another prominent aspect that the forex trader should consider is how the movements of the USDX is associated with the other currencies that are put against the U.S. Dollar.

For instance, when the currency pair is measured as USD/JPY, it is likely to be positively correlated, and both the currencies should rise and fall at the same time.

Contrarily, when the currency pair is measured like EUR/USD, then the currency pair and USDX are inversely correlated. This implies that they are likely to move in the opposite direction, where one will fall when the other rises.

[wp_quiz id=”97457″]
Categories
Forex Course

196. Ever Wondered What ‘Trade-Weighted Dollar Index’ Is All About?

Introduction

The trade-weighted dollar is a prominent index developed by the FED in order to measure the value of the U.S. dollar spending on its competitiveness against the trading partners. It is used to determine the purchasing value of the U.S. dollar and to summarize the impact of appreciation and depreciation of the currency against foreign currencies.

The Importance Of Trade-Weighted Dollar Index

When the value of the U.S. dollar rises, the import to the country becomes less expensive, whereas exports become expensive. A Trade-Weighted Dollar Index is used to measure the value of the foreign exchange of the U.S. dollar in comparison to specific foreign currencies.

It offers weightage or importance to currencies that are most popularly used in international trade, instead of comparing the dollar value to every foreign currency. As the currencies are weighted distinctively, the modifications in each currency will have a different effect on the trade-weighted dollar as well as corresponding indexes.

After the U.S. Dollar Index, Trade-Weighted Dollar Index is the primary tool used to measure the strength of the U.S. dollar. It is also reckoned as the Broad Index was introduced in 1998 by the U.S. Federal Reserve Board.

It was created after the integration of the Euro and to reflect the trade patterns of the U.S. more precisely. The Federal Reserve picked 26 currencies for this broad index, envisioning the acceptance of the Euro by 11 countries belonging to the European Union.

Countries Included In The Trade-Weighted Dollar

Index

Here are the countries with the weight on the index –

  • Eurozone – 18.947
  • China – 15.835
  • Canada – 13.384
  • Mexico – 13.524
  • Japan – 6.272
  • United Kingdom – 5.306
  • Korea – 3.322
  • Taiwan – 1.95
  • Singapore – 1.848
  • Brazil – 1.979
  • Malaysia – 1.246
  • Hong Kong – 1.41
  • India – 2.874
  • Switzerland – 2.554
  • Thailand -1.096
  • Australia – 1.395
  • Russia – 0.526
  • Israel – 1.053
  • Sweden – 0.52
  • Indonesia – 0.675
  • Saudi Arabia – 0.499
  • Chile – 0.625
  • Philippines – 0.687
  • Colombia – 0.604
  • Argentina – 0.507

Final Thoughts

Trade-Weighted US Dollar is a broad index that includes countries from all across the world. Traders will also find some developing countries in the broad index list, which makes it a better reflection of the value of the U.S. dollar worldwide.

[wp_quiz id=”97448″]
Categories
Forex Course

195. Understanding The U.S. Dollar Index Numbers

Introduction

The U.S. Dollar Index is a measure of the value of the Dollar in respect to foreign currencies as measured by the respective exchange rates. More than half of the index value of the Dollar is measured against the Euro. The British Pound, the Japanese Yen, the Swedish Krona, the Canadian Dollar, and the Swiss Franc. It is a market on its own as well as an indicator of the U.S. dollar strength on a global level. Moreover, it can also be used as the technical analysis to determine trends of various markets.

How Is The US Dollar Index calculated?

Below is the formula to calculate USDX

USDX = 50.14348112 × EUR/USD^(-0.576) × USD/JPY^(0.136) × GBP/USD^(-0.119) × USD/CAD^(0.091) × USD/SEK^(0.042) × USD/CHF^(0.036)

Each currency value is multiplied by its weights. When the U.S. dollar is the base currency, this comes at a positive figure. On the other hand, when the U.S. dollar is used as the quoted currency; then this would come as a negative value. Additionally, pounds and euros are only countries where the U.S. dollar is used as the base currency as they are quoted in respect of the Dollar.

How To Interpret the U.S. Dollar Index?

Similar to any currency pair, there is a dedicated chart of the U.S. Dollar Index (USDX). Additionally, the index is calculated five days a week and 24 hours a day. The U.S. Dollar Index measures the value relative to a 100.000 base.

If the index value stands at 120, this means that the U.S. dollar has witnessed 20% appreciations against other currencies in the basket. This simply implies that the U.S. dollar has strengthened in comparison to other currencies. On the other hand, if the index value shows at 70, this implies a depreciation of 30%

Final Thoughts

The U.S. Dollar Index enables traders to monitor the value of the U.S. dollar in comparison to six currencies within the bracket in a single transaction. Moreover, it also assists them to hedge the bets against risks associated with the Dollar. Investors can use this index to hedge the normal movement of currency or speculate.

[wp_quiz id=”97442″]
Categories
Forex Course

194. Introduction To The US Dollar Index (USDX)

Introduction

The U.S. dollar index is referred to as a measure of the value of the U.S. dollar, which is relative to the value of a series of currencies that are the most important trading partners of the country. The USDX is similar to other forms of trade-weighted indexes that also use the exchange rates from the leading currencies.

U.S. Dollar Index – A Brief History

In the year 1970, the U.S. Dollar Index switched between 80 and 110. This was the time when the U.S. economy was witnessing recession and rising inflation levels. With the Federal Reserve increasing interest rates to cut inflation, money flowed into the U.S. dollar, resulting in a rise in the USD index. In February 1985, the USD Index hit 164.720; this is the highest it has ever been.

However, this caused significant issues for the U.S. exporters whose goods were no longer competitive internationally. Subsequently, strong actions were taken by the U.S. government to make the currency more competitive, with five nations agreeing to manipulate the U.S. dollar in the forex markets.

This made the Dollar Index dropped by 51% over the course of four years. Since that time, the index has tracked the performance of the economy as well as liquidity flows.

Fundamentals of U.S. Dollar Index

This index is presently calculated by factoring in the exchange rates of six leading world currencies, including Euro (EUR), British Pounds (GBP), Canadian Dollar (CAD), Swiss Franc (CHF), Swedish Krona (SEK), and Japanese Yen (JPY). The biggest component of this index is the EUR, which accounts for approximately 58% of the basket. The weights of the rest of the currencies in the index include –

  • GBP (11.9%)
  • JPY (13.6%)
  • SEK (4.2%)
  • CAD (9.1%)
  • CHF (3.6%)

What Impact The Price Of The USD Index?

The USD Index is primarily impacted by the demand for and the supply of the U.S. Dollar. Related currencies of the baskets are also an important factor. These factors impact the price of each pair of currency in the formula that is being used to calculate the value of the U.S. Dollar’s value. The demand and supply of currencies are determined by monetary policies.

In the upcoming course lessons, we will be learning more about the US Dollar index. So, stay tuned. Please take the quiz below before you go. Cheers.

[wp_quiz id=”97429″]
Categories
Forex Course

193. Summary – Carry Trading

Introduction 

Carry trade involves borrowing or selling of an asset that has a low-interest rate, for the purpose of using the fund proceeds to make another investment with a higher rate of interest. By paying a lower rate of interest on assets and collecting a higher interest rate from another asset, traders make a difference in the interest rate.

Currency Carry Trading – How Does It Work?

In currency carry trading, the trader borrows one currency known as the borrowing fund. And, then they use this fund to purchase another currency. The traders pay low-interest rates on the borrowed currency while collecting a higher interest rate on the purchasing currency. This type of trade gives traders an effective alternative to purchasing low and sell high, which is difficult to do on other trading options. AUD/JPY and NZD/JPY are the most common currency pairs to carry trade.

Opportunities & Risks Involved

The most profitable time to perform a carry trade is when the country’s central banks are increasing or about to raise the interest rate. Low volatility situations are also profitable for these trades as traders are more likely to take more risks. Granted that the value of the currency does not fall, traders are likely to get a good amount.

There is a big risk associated with currency carry trading, primarily because of the uncertainties associated with the exchange rate. When high leverage levels are used in this trade, it implies that even small movement in the exchange rates can result in a substantial loss if the traders fail to hedge their positions properly.

Risk Management 

While lucrative, carry trading comes with its own share of risks. This is because currencies are prone to volatility. Moreover, the negative market sentiment of the traders within the currency market can also have a substantial impact on carry pair currencies. Without improper risk management, traders could end up bearing a high degree of risk. The best way to avoid risk in a carry trade is when the market sentiment and fundamentals support them.

Final Thoughts

If you are looking to invest in a carry trading, the first steps are to select the most lucrative broker vs currency pair combination. The charges of brokers vary significantly across various currencies. Therefore, it is important to ensure that the trade offers an effective risk-adjusted return. Cheers.

Categories
Forex Course

192. Criteria To Carry Trade The Forex Market and Risks Involved

Introduction

In the previous lesson, we discussed instances when a carry can work, and when it’s bound to fail. But, having this knowledge won’t be of much help if you do not know the best criteria for a currency carry trade and the risks involved.

Criteria to Carry Trade

There are two basic criteria to carry trade the Forex market profitably.

The interest rate differential between two currency pairs needs to be high with no prospects of reducing in the near term.

The currency pair that we choose has to be on a bullish trend in favor of the currency with the higher interest rate. The reason for this is to ensure you can remain bullish on the high yielding currency and profit from the interest rate differential for the longest possible time.

Let’s take the example of the AUD/JPY pair. Japan’s interest rate has remained at -0.1%, while in Australia was held at 0.25%. That means the interest rate differential between the AUD/JPY pair has been 0.35%. Therefore, if you were to borrow and sell the JPY to buy the AUD, you’d expect a pay-out of 0.35%. Note that this is the same as going long on the AUD/JPY pair.

In this scenario, going long on AUD/JPY from March 2020 to October 2020 would have earned you over 900 pips. At the same time, you’d be earning an interest rate differential of 0.35%.

Risks Involved In Carry Trading

So far, a carry trade sounds like a risk-free strategy. But, like any other investment, the carry trade has its fair amount of risks – especially when leverage is involved.

Remember, in the previous lesson, we mentioned two conditions for a carry trade to thrive. First, there had to be low volatility in the market. The reason for this is to ensure that your open position is not wiped out due to currency fluctuations before you reap the profits of interest rate differential. Note that using trailing stop orders can help mitigate the risk of price fluctuations in the forex market.

The second condition for a carry trade to thrive was the stable economic conditions that might encourage the hiking of interest rates. If the economic climate is full of uncertainties, like with the ongoing coronavirus pandemic, central banks are more likely to cut interest rates than hike them. Therefore, if extreme interest rate cuts occur while you are in a currency carry trade, it could result in losses. 

[wp_quiz id=”99537″]
Categories
Forex Course

191. Carry Trading Doesn’t Work All The Time!

Introduction 

Now that you understand what a carry trade is in the forex market, the next logical step is to show you when this strategy works and when it fails. We already know that the carry trade entirely depends on interest rates between two countries.

Let’s take the USD/JPY pair. The interest rate in Japan is -0.1%, and that in the US it is 0.25%. So, if you were to borrow and sell the JPY to buy the USD, your interest rate differential would be = 0.25 – (-0.1) = 0.35%.

In this case, you’d expect profits of 0.35%. By now, we already know that forex traders always anticipate the monetary policy actions of central banks.

When do Carry Trades Work?

There two main instances when carry trades become popular:

Firstly, it is during periods of low volatility. When there are minimal price fluctuations, traders may be induced to take on more risks to increase their profits – carry trade. In this case, provided the value of the currency doesn’t fall, the rollover earned is a good incentive.

Secondly, it’s when traders anticipate that central banks will raise interest rates. In this instance, traders will anticipate that the interest rate differential will increase, as will the pay-out.

When Do Carry Trades Not Work?

We’ve already established that for a carry trade to be effective, the interest rate differential needs to be high or increasing. That means that one country should be increasing its interest rate while another decreasing.

Similarly, the country with the lower interest rate should be decreasing while the one with the higher interest rate remains constant. Another scenario could be if the country with the lower interest rate remains constant while the one with the higher interest rate increases. If you find all this confusing, let’s explain using an example.

Economic indicators in the US points towards higher possibilities of a recession. Say the unemployment levels are increasing, manufacturing is falling, GDP is contracting, and retail sales are nose-diving.

Forex traders can anticipate that the Federal Reserve will cut interest rates to stimulate the economy. In this case, the USD will be considered a high-risk currency since investors will have a higher aversion towards it. Now, instead of purchasing the USD, investors will opt for other currencies with a more stable outlook.  The logic behind this is that the interest rate differential has reduced or is expected to reduce vis-a-vis USD/JPY.

[wp_quiz id=”99265″]
Categories
Forex Course

190 – Introduction To Carry Trading The Forex Market

Introduction 

When it comes to forex trading, we have so far covered how you can make money by taking advantage of price fluctuations. What, then, do you do when the price of a currency pair remains relatively stable for extended periods? Certainly not nothing! You carry trade.

In the financial market, carry trade means borrowing a financial asset with a low-interest rate, sell it, and purchase another one that pays a higher interest rate. That means the cost of borrowing (lower interest rate) is lower than the proceeds (higher interest rate). In this case, the profits you earn is the difference between the two interest rates, also known as interest rate differential.

For us to explain how the carry trade works, we first need to explain how the interest rate in the financial market works.

Carry Trade Example

Say you go to a bank and take a loan at an interest rate of 2% per annum. If the loan amount is, say, $2000, the interest charged per year would be:

= 2/100 * 20000 = $400

Now, instead of putting the money under a mattress, you decide to buy a corporate bond, which in total, pays a yearly interest rate of 10%. This means that at the end of one year, you should expect interest income of:

= 10/100 * 20000 = $2000

In this scenario, you have earned $2000. Remember, the borrowing cost was $400, which means you have a profit of $1600. In other words, you have earned an 8% in terms of interest rate differential.

If that doesn’t sound like much money, let’s see how you feel when we apply leverage to the borrowing.

Leveraged Carry Trade Example

Say you have a stock portfolio worth $20,000 and put this up collateral for a $2,000,000 loan with an annual interest rate of 2%.

You take this money and invest in another financial asset that pays an annual interest rate of 10%. In this scenario, the interest rate differential is still 8%. How about your profit?

= 8/100 * 2,000,000 = $160,000

With collateral of $20,000, you have made a profit of $160,000. That is an equivalent of 800% return.

Currency Carry Trade

In the forex market, if you let your position stay overnight, you will be charged a rollover fee. The rollover fee is the interest rate differential between the two currencies in the currency pair. Your account will be debited or credited accordingly, depending on whether the interest rate differential is positive or negative.

Stay tuned to learn more about Carry Trading in our upcoming articles.

[wp_quiz id=”99174″]
Categories
Forex Course

189. Summary – Trading The News

What did we learn till now? 

Sometimes in the forex market, the movement of prices seems random. In the previous series of courses, we have shown that most of the randomness you observe can be explained. By now, you should be capable of identifying the various news releases published daily. You should also be able to determine which currency pairs the news release is likely to impact.

In this final course, we’ll recap all that we have learned so far.

When it comes to news trading, a forex trader can either have a directional bias to trading or have a non-directional bias. For directionally biased traders, they have to:

  • Familiarise themselves with the economic calendar to know when economic indicators are scheduled for release
  • Understand the impact that each indicator might have and which currency pairs are best to trade
  • Understand that the analysts’ consensus or expectations are what determines if the news release is negative, positive, or in-line
  • Know which news releases to avoid trading

On the other hand, forex traders who have a non-directional bias do not necessarily need to familiarise themselves with these conditions. Such traders only need to know two things.

  • The scheduled release of economic indicators, speeches by influential people, and significant geopolitical events
  • Whether the upcoming event is of a high or low impact

Traders with a non-directional bias only concern themselves with the magnitude of the price movement after an event – not the direction. That is why they adopt the straddle strategy.

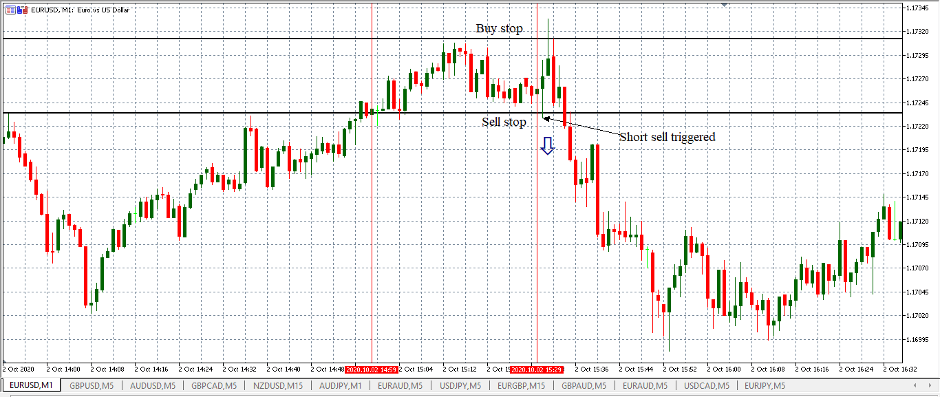
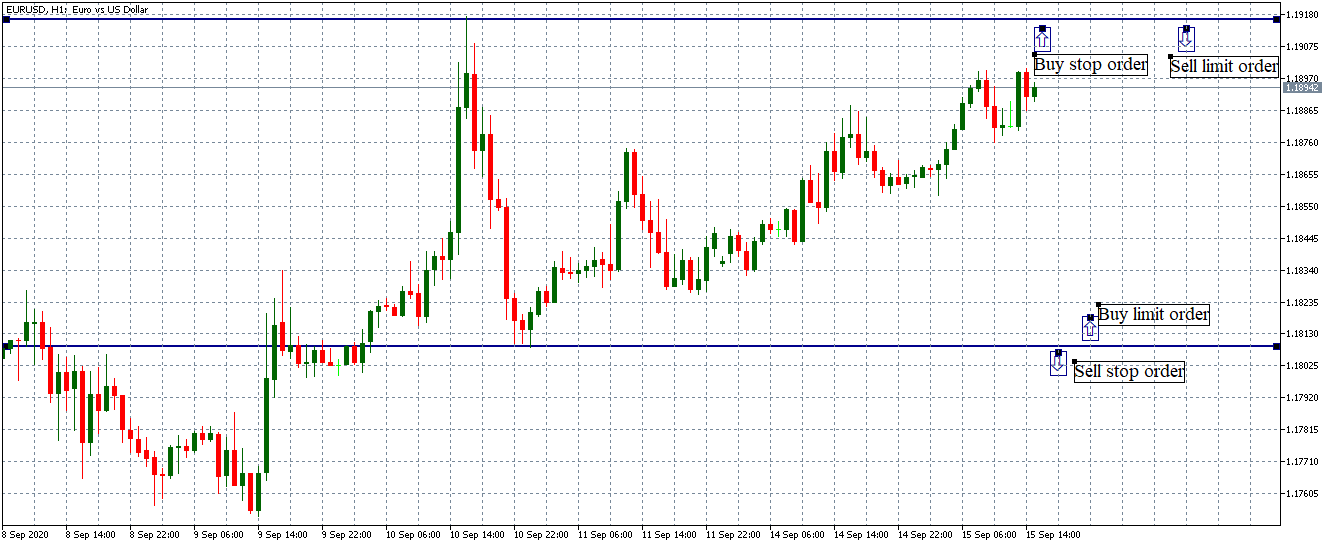
The straddle strategy uses forex stop orders, which triggers long or short positions if the market significantly moves in either direction. The buy stop order will trigger a long trade if the news release results in a bullish market. With the sell stop order, s short sell will be executed if the news release results in a bear market.

Remember to be careful when trading the news. Always keep an eye on the prevailing macroeconomic trends and geopolitical events. The overall market sentiment can sometimes amplify or dampen the impact of a news release.

If, for example, moments before the release of UK manufacturing data, the market receives news that the ongoing Brexit negotiations have hit a snag. If the manufacturing data is positive, its impact on the market will be dampened; if the release is negative, its impact will be magnified. All the best.

Categories
Forex Course

188. Straddle Trading Strategy – An Efficient Way To Trade The News

Introduction 

In the previous lesson, we covered how you can make money if you knew the direction the market was going to move. In this lesson, we will show you how you can make money if you have no idea about the direction the market is going to move.

When there is high volatility in the market, especially as a result of a news release, it is possible to achieve this. Note that this strategy is different from trading with a directional bias.

Let’s break it down!

Firstly, you have to aware of an upcoming high-impact news release. Unlike trading with a directional bias, you don’t have to familiarise yourself with the direction the news will move the market. All you have to know is that the market will significantly move.

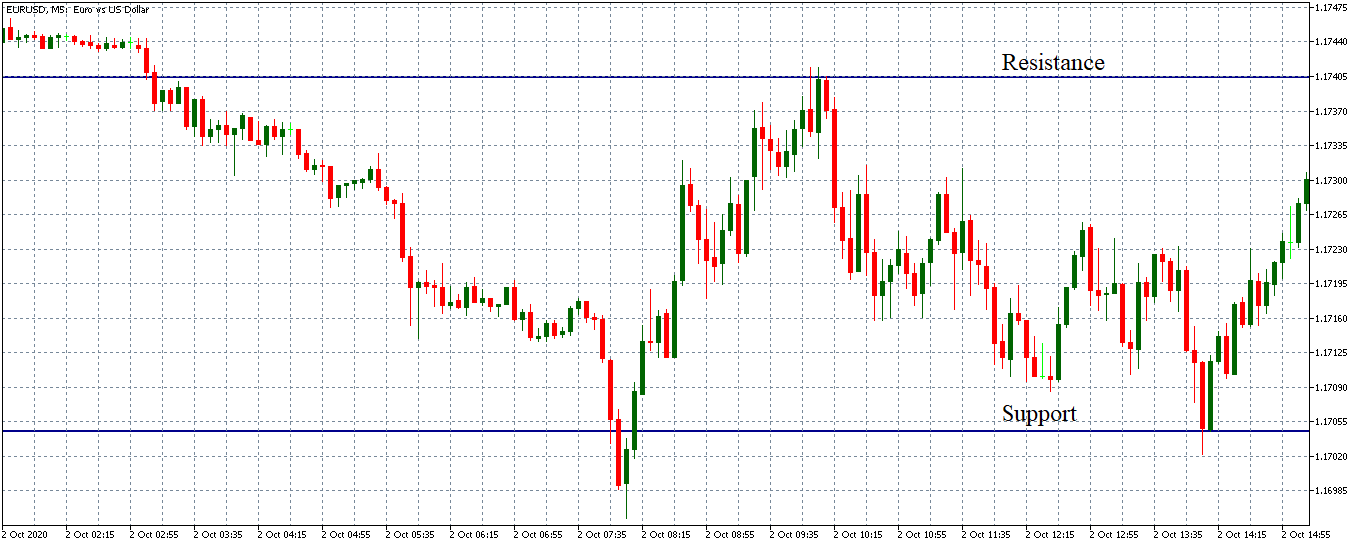
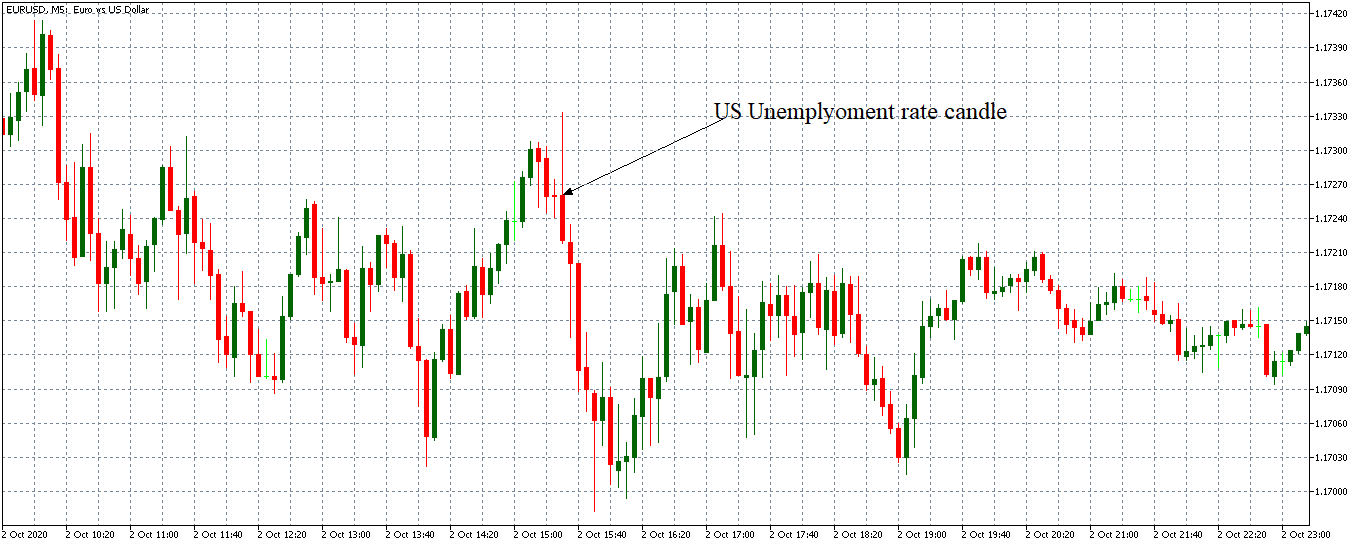
Let’s say, for example, that a news release is scheduled for 8.30 AM. Using the 5-minute timeframe, observe the trend for the past 30 minutes and establish the support and resistance levels. You will use these levels to set a buy stop and sell stop order.

With the buy stop orders, if the price breaks above the resistance level, a long order will be triggered. In the sell stop order, if the price breaks below the support level, a sell order will be triggered. Let’s use the news release of the US unemployment rate on October 2, 2020, at 8.30 AM EST.

Here’s the logic behind the straddle strategy. If the news is significant enough to break through the support level, then it is plausible for the bullish trend to continue in the short term. Conversely, if the news release is significant enough to blow the price past the support level, then the bearish trend might progress in the short-term.

Note that you can pre-set your ‘take profit’ and ‘stop-loss’ levels when using the forex pending order types. Doing this ensures that you get to determine your absolute downside in case a trend doesn’t hold. Furthermore, you can opt for only the ‘trailing stop order’ alongside the stop orders. Your ‘stop-loss’ value is not fixed with the trailing stop, which increases your exposure to the upside.

For instance, if, in the above example, we had set our take profit level at ten pips, we would have only made the ten pips. But, if we used the trailing stop order instead, we would have gained more than the ten pips. Cheers!

[wp_quiz id=”98844″]
Categories
Forex Course

187. Learning To Trade the News With Directional Bias

Introduction

In this course, we will further explain, with an example, how you can trade a news release with a directional bias. In the US, the labor market report is one of the most anticipated new releases in a month. The report has a significant impact on any pair with USD. Note that every trader has their approach to trading the news with a directional bias. Here’s our approach.

If you are a forex trader with a directional bias, you need to have in-depth knowledge of the news release you are trading. What do we mean by in-depth knowledge? Firstly, you have to know what that particular news release tells about the economy. For example, the US labor market report has the unemployment rate and nonfarm payroll data.

When both these indicators beat the analysts’ expectations, we can expect that the USD will become stronger than other currencies. The US labor market report is a leading indicator of consumer demand, contributing up to 70% of the GDP. Furthermore, in the current coronavirus pandemic, the labor market report is used to show the rate of economic recovery.

You’d also expect the USD to weaken relative to currencies it is paired with if the news of the labor market report doesn’t meet analysts’ expectations. In this case, it means that unemployment increased, and the economy didn’t add as many jobs as expected.

To make a proper directional bias trade, you need to understand how the labor market report impacts the forex price charts. You have to look into past releases and establish how much the market moved; this will help you get the average pip movement. You also need to be aware of the prevailing macroeconomic conditions and the recent unemployment rate trend.

What to do before the news release?

Go back a few hours on your chart and establish the intraday support and resistance levels. You will use these levels as your ‘take profit,’ and ‘stop-loss’ levels after the news is released.

Let’s check out the news release of the US unemployment rate on October 2, 2020, at 8.30 AM EST.

EUR/USD: Before US Unemployment Rate Release on October 2, 2020, 
just before 8.00 AM EST

Since the unemployment rate was lower than the previous release and also beat analysts’ expectations, our directional bias is to be bearish on the EUR/USD pair. In this case, we will use our previously established Support Level as the ‘take profit.’

EUR/USD: After US Unemployment Rate Release on October 2, 2020, 8.00 AM EST

[wp_quiz id=”94037″]
Categories
Forex Course

186. What Are Directional & Non-Directional Bias While Trading The News?

Introduction

By now, you have a clear idea of how to make a news trading plan and schedule. The next thing you need to understand is that there are two primary ways of trading the news in the forex market. These ways involve whether or not you have a directional bias towards the news being released.

Having a Directional Bias

Among the first lessons you learn about the release of economic indicators is how they impact different currency pairs. For example, let’s say that you are interested in the GBP/USD pair, and there is an upcoming news release of the UK GDP.

We would expect that if the GDP shows that the UK economy has expanded, then then the GBP will appreciate relative to the dollar the pair will rise. Conversely, if the GDP shows that the UK economy contracted, you will expect the GBP to depreciate against the USD, and the pair will fall. This is what having a directional bias means.

We’re sure you have noticed the ‘consensus’ aspect from the economic calendar. This number is usually what the majority of financial analysts and economists agree on, as the forecast for a particular economic indicator. It is commonly referred to as “Analysts’ expectations.” In most cases, the market reaction to a news release is determined by whether the news was better than the analysts’ expectations, worse than the expectations, or in line with the expectations.

Let’s say that the analysts’ expectation for the upcoming UK GDP is a growth of 2% and when the actual GDP data released turns out to be 2.3%. If you have a directional bias, you will buy the GBP/USD pair as you expect the GBP to appreciate against the USD.

In another scenario, assume that the news release did not meet the analysts’ expectations and the actual GDP growth is 1.6%. For a forex trader with directional bias, they would sell the GBP/USD pair since they expect the GBP to depreciate relative to the USD. The analysts’ expectation is vital to a trader with a directional bias.

Non-Directional Bias

A news trader with non-directional bias ignores the analysts’ expectations. Such traders are aware that high-impact news will result in a significant movement in price action. For them, it doesn’t matter the direction of the market movement; they only follow the trend. They don’t bother whether the news release beat expectations or not.

We hope you got an understanding of what Directional and Non-Directional bias are while trading the news. Don’t forget to take the below quiz. Cheers!

[wp_quiz id=”94041″]
Categories
Forex Course

185. Knowing Which News Release To Trade Is Crucial!

Introduction

Before you develop your trading strategy around the news releases, you first need to decide which news you will use for trading. As we mentioned in our previous course, different economic releases have a varying impact on the forex market. Since the aim of any trade is to gain as many pips as possible, it is only natural that you trade news releases that create high impact – those which can significantly move the forex market in the short-term; or even the longer-term.

The primary way to identify high-impact news releases is by establishing which economic indicator gives a relevant, most current, and comprehensive overview of the economy. The high-impact news releases usually cover these aspects;

Central banks’ monetary policies: These policies can impact future economic growth – both in the short and long term.

Labour market reports: Such reports tend to be of the changes in the previous month. They are a leading indicator of changes in household demand, which is a major contributor to economic growth.

Manufacturing and industrial activities: These sectors are usually among the largest employers in the labor market. Monitoring their growth can be a leading indicator of GDP growth and changes in the unemployment levels.

The services industry: This industry is the first to be impacted by changes in consumer demand.

You don’t have to stress about determining which specific economic indicators are high-impact. The economic calendars take care of this for you. Furthermore, there are several economic calendars out there, so you can compare multiple calendars and check put the consensus about the impact magnitude of the various news releases.

Note that these calendars have a legend to indicate the magnitude of the news release. They show whether the news will have high, medium, or low volatility.

Here’s our recommended list of high-impact economic indicators.

  • GDP releases
  • Inflation indicators like CPI, PPI, and PCE
  • Interest rate decision
  • Unemployment rate and wages data
  • Industrial production, factory orders, or manufacturing production
  • Retail sales
  • Surveys on the manufacturing sector and services industry
  • Sentiment surveys on consumers and businesses

It is important to note that geopolitical developments can be happenstance. These events could include upcoming elections in major economies, natural disasters like tsunamis, pandemics, and geopolitical conflicts. When these events happen, the impact of the release of the economic indicators may change.

For example, towards the end of Q2 in 2020, the impact of these economic indicators was heightened. The reason is that they signaled the rate of economic recoveries after the coronavirus-induced recessions. Furthermore, they showed whether or not the expansionary policies adopted impacted the economy as expected.

[wp_quiz id=”94066″]
Categories
Forex Course

184. Why Is It Important To Be Careful While Trading the News?

Introduction

Now that you know about scheduled news releases in the forex market, you must be excited. You probably think that you have the most foolproof way of trading in the forex market. You might have even gone to the extent of planning your trades to coincide with the high-impact indicators; because they significantly affect price action, you can collect a lot of pips.

Well, if you have thought and planned all that, forget it! To successfully trade the news in the forex market, you have to be deliberately methodical and calculative. If not, you may end up wiping out your trading account.

We’re not saying that you shouldn’t trade the news. Quite the opposite, you should, but only, and only when you understand the implications of the news release. Let’s, for example, take the release of a high-impact economic indicator.

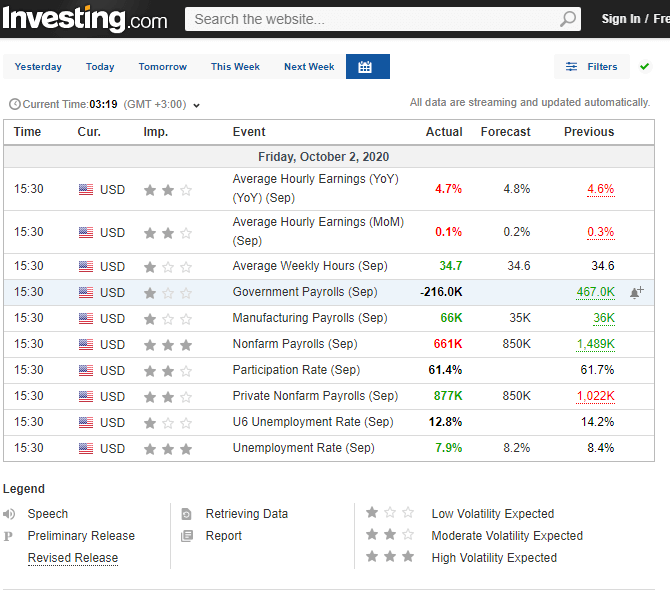
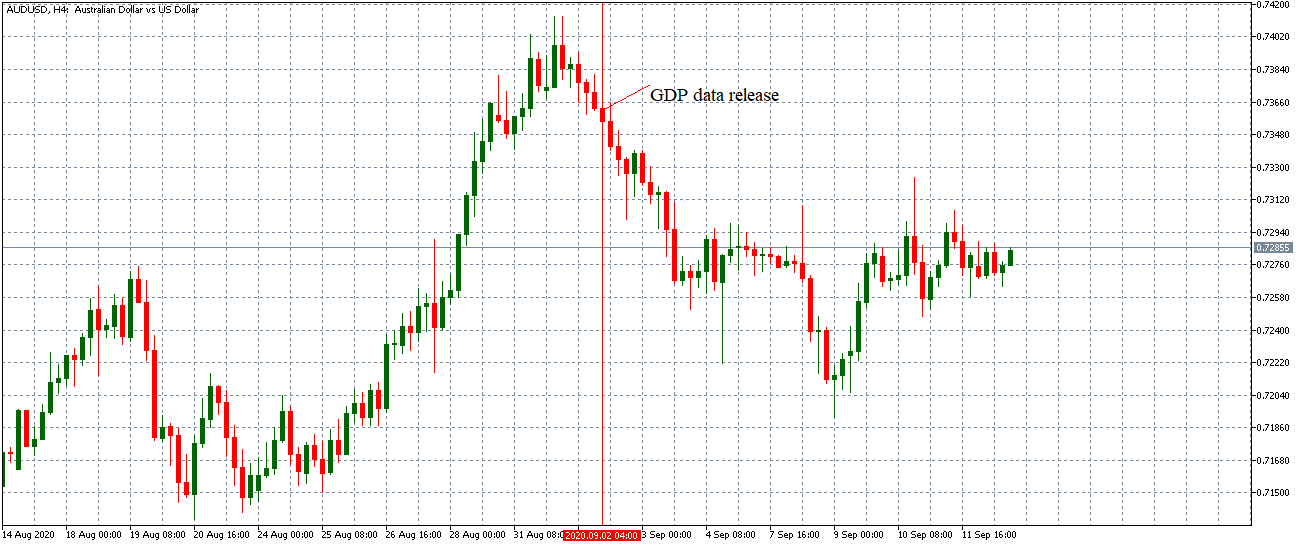
Usually, when high-impact economic indicators are released, they are followed by extreme market volatility. The US unemployment rate is a high-impact indicator. Its latest release on October 2, 2020, at 8.30 AM EST came in positive at 7.9% lower than the expected 8.2%.

In this case, you’d expect the USD to be stronger than the EUR. But immediately after the news was released, there was some volatility that made the pair gain 11 pips before adopting a bearish trend.

Eleven pips may not sound like a lot. But if you have a small trading account and using high leverage, the chances are that 11 pips in the wrong direction can wipe you out.

Watch out for geopolitics

When trading the news as scheduled in the economic calendar, it pays to monitor geopolitical developments that are not scheduled, especially in the current climate of trade wars. Declarations by influential political figures may influence trends in the forex market. In such cases, if the news release of economic indicators coincides with such events, their impact may be watered down or exacerbated.

Another reason why trading the news may not go as planned is because the outcome of a news release could already be priced into the market. Forex traders are skillful at anticipating – especially when it comes to interest rate releases. If they anticipate that central banks are going to cut interest rates, they will adjust their trades weeks or months in advance. In this case, when the actual rates are released, their impact will not be as pronounced.

Bottom Line

We’re not saying you shouldn’t trade the news. Just take your time and familiarize yourself with the different types of economic indicators. Do thorough backtesting and have a trading plan on how you will incorporate news releases into your trading.

[wp_quiz id=”94056″]
Categories
Forex Course

183. Introduction To Trading The ‘News’

Introduction

The forex market, or any other financial market, is always driven by sentiment. And by sentiment, we mean; investors will only pay what they believe an asset is worth. More so, their investment decisions are primarily ‘future-looking,’ meaning that the types of trades they make will reflect their expectations about the value of the asset they trade.

So, what drives the price of currency pairs in the forex market?

The simplest answer is the fundamentals of a country. Let’s revisit the forex basics here for a bit. The price of a currency pair is the exchange rate between two currencies. This price doesn’t just move up and down arbitrarily. It is determined by the economic value of either country – what is called fundamentals. You might be tempted to think that technical indicators drive price action in forex. Quite the opposite – almost all the time, the technical indicator follows the news.

So, when one country’s fundamentals improve or are believed to improve, the value of its currency will increase relative to other currencies. Similarly, when the country’s fundamentals deteriorate or are expected to worsen, the currency will depreciate.

Remember the laws of demand and supply. When the demand is high, prices tend to go up, and when demand falls, prices fall along with it. The same applies to the forex market. When fundamentals improve or are expected to improve, the currency is in high demand making its value increase. When fundamentals worsen or are expected to, traders dump the currency as its value drops.

So, how do forex traders know if the fundamentals of the country have improved or worsened? News! News, as always, is the carrier of everything.

Where to find News in the Forex Market?

In the forex market, news can be delivered in various ways. There are hundreds, if not thousands, of organizations and government agencies that publish various economic indicators. But don’t worry, you won’t have to go through thousands of webpages just to find relevant news regarding the currency pairs you are trading. Things are a bit neat in the forex market when it comes to news releases. The economic calendar simplifies things for you. Here, you will find virtually every scheduled publication of economic indicators from every country! This way, you get to know what’s happening and when it is happening.

Here’s a screengrab of an economic calendar.

Furthermore, these scheduled releases have been categorized depending on the magnitude of their impact. Of course, not all economic indicators impact a currency the same way. Some have negligible effects.

[wp_quiz id=”94071″]
Categories
Forex Course

182. Summary – Market Sentiment

Introduction

If you have gone through the previous courses, you already have a solid knowledge of what market sentiment is. You should also be able to create your COT index indicator to spot market trends and points of potential reversals.

To recap, here are a few things you should have in mind by now.

  • The Commitment of Traders (COT) report is the best gauge of the forex market sentiment in
  • The COT report tracks the trading activities by commercial, non-commercial, and retail traders in the futures market.
  • In the futures market positioning, the commercial and non-commercial traders are usually on opposite sides. i.e., when non-commercial traders are long, commercial traders are short.
  • A market reversal can be anticipated when the spread between commercial and non-commercial traders is the widest.
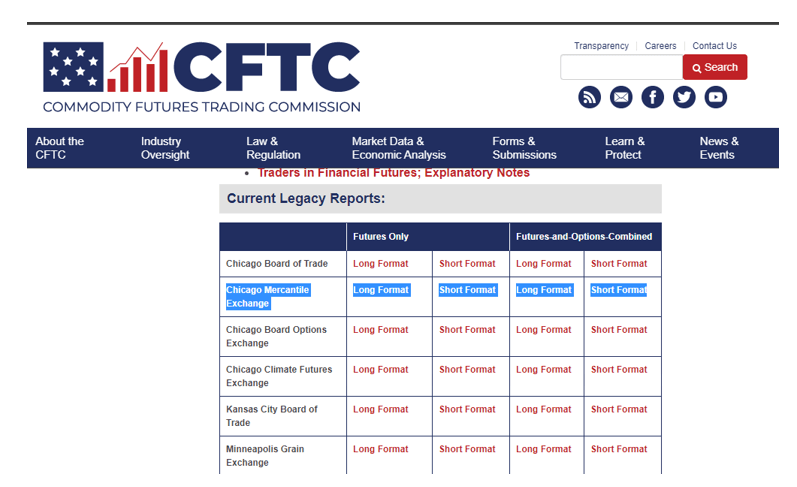
  • The ‘Chicago Mercantile Exchange’ section of ‘Current Legacy Reports’ in the COT report is best suitable for forex traders.

Let’s now conclude this segment with a few things you MUST always keep in mind.

If you haven’t noticed by now, the COT report is best suited for long term trading. If you are a shorter-term trader, you might be inconvenienced if you solely rely on the COT report for a trading signal. You see, the trends established by the COT report index take time to form. But this shouldn’t discourage you; it’s always good to know how the market is trending.

For traders who opt to use the COT report to generate trading signals, the COT report trading indicator is not foolproof. Like thousands of other indicators in the forex market, it is bound to fail at some point. So, you should conduct thorough backtesting with different timeframes to get a proper feel of how the indicator works. Note that with backtesting, you can be able to spot instances where using the COT report can generate false signals, which will help you avoid such conditions in live trading.

Well, even after you have conducted your thorough backtest, you must know that the forex market trends are not solely driven by market sentiment. Several other factors could lead to reversals in the forex market other than the COT report. In any given month, hundreds of high-impact economic indicators and geopolitical developments can significantly influence trends in the forex market. So, be sure to double-check with your economic calendar to know what else is going on in the economy.

[wp_quiz id=”94030″]
Categories
Forex Course

181. Accurately Interpreting The COT Report

Introduction

To this point, you know how to establish market extremes using the COT report. Since you can create your COT report trading indicator, let’s learn how you can effectively interpret the COT report. While spotting the overbought and the oversold regions using the COT report seems arbitrary, a more accurate way of interpreting the COT report would be using percentages of the long and short positions.

We have already established that the best way to identify tops and bottoms using the COT report is by following the trend of the non-commercial traders. Just like the formula for creating the COT trading indicator, calculating the percentages of the long and short positions helps filter out the biases of the raw data.

Calculating the percentage of long positions

For a given currency pair, we first identify the number of long and short contracts. We then use this formula to determine the percentage of long contracts:

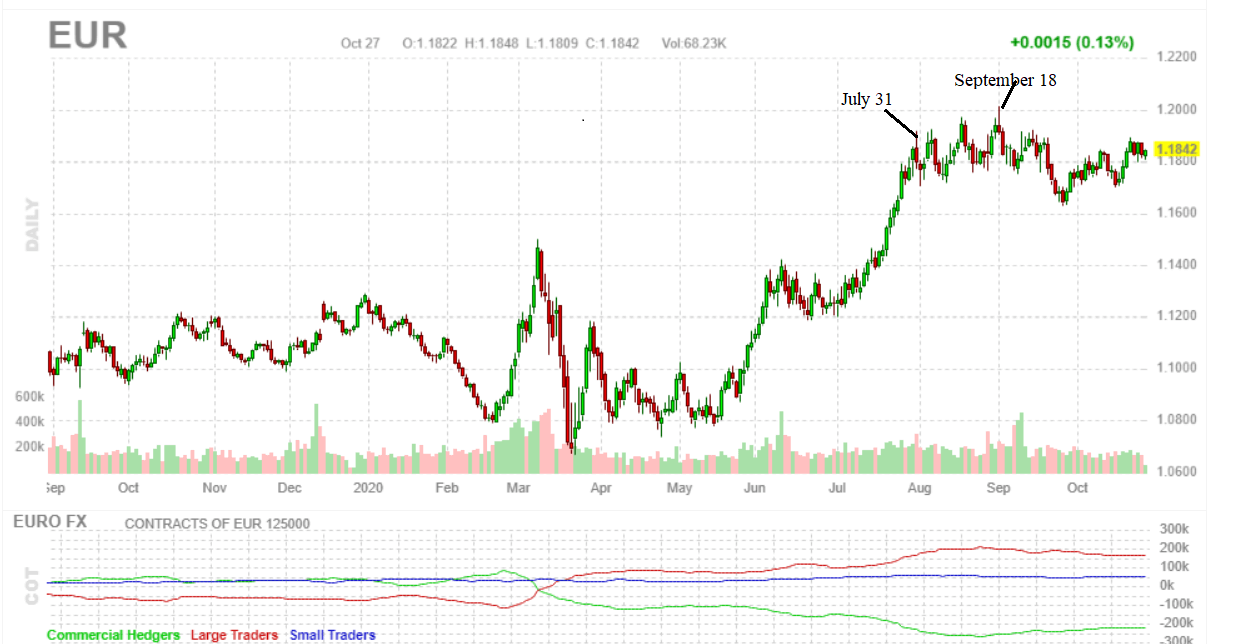
For the week of July 31, 2020, the EUR had a net long speculative futures position of 180,648 contracts. The percentage of the long contracts was

For the week of September 18, 2020, the EUR had a net long speculative futures position of 178,576 contracts. The percentage of the long contracts was

Now, assume that you are asked to pick the market top using the raw data for both the above dates. You would have selected the week of July 31, 2020, as your market top. The reason is that the raw data showed that the net long positions for speculative traders have 180648 contracts, while for the week ended September 18, 2020, they had 178576 net long contracts. Clearly, with the raw data, July 31, 2020, would have been the market top.

However, by calculating the percentage of the long contracts for both periods, we see that the week ended September 18, 2020, had the highest percentage at 63.1% compared to 52.6% for the week ended July 31, 2020.

Looking at the futures chart for the EUR, we can confirm that, indeed, the week ended September 18, 2020, was the actual market top.

[wp_quiz id=”94024″]
Categories
Forex Course Forex Daily Topic

180. Picking Accurate Tops & Bottoms Using the COT Report

Introduction

Our previous lesson covered how you can use the Commitment of Traders report to trade in the forex market. In this lesson, we will learn how you can use the COT report to identify the tops and bottoms, i.e., the levels where a currency is overbought or oversold.

Any forex trader would know that the best timing for a reversal trade is when the market is at extreme levels. The COT report helps us understand the trades’ volume and how the different types of traders are positioned. In the previous lesson, we learned that non-commercial traders’ positioning could be used to determine the market trend. On the other hand, commercial traders accumulate their trades around extreme levels where they believe a market reversal could occur. Thus, the positioning of hedgers can be used to determine the market tops and bottoms.

Now, let’s see how you can identify these extreme levels in forex using the COT report.

How to identify Tops (Overbought Levels) Using the COT Report

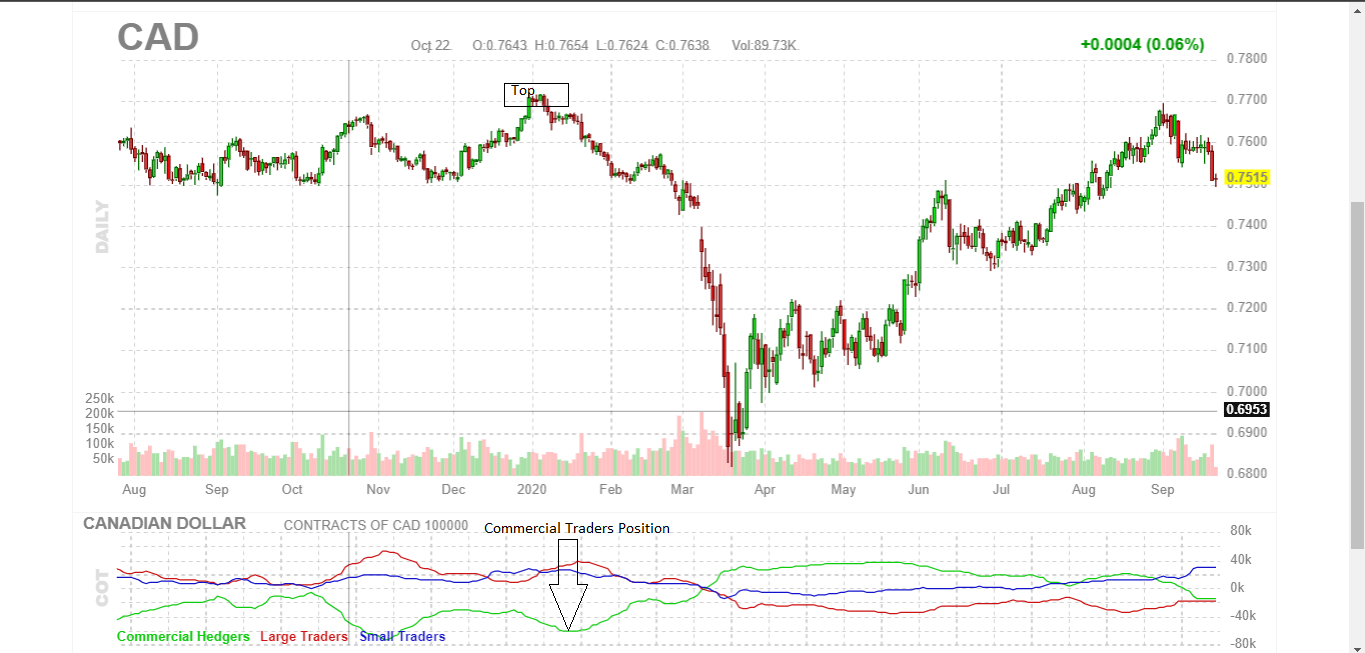
It is worth noting that when the markets are rising, the non-commercial traders are buying, i.e., they are bullish. Conversely, the commercial traders (hedgers) are bearish when the markets are rising, meaning they are actively shorting the futures contracts in a bullish market. Therefore, in a bullish market, when speculators continually go long as the hedgers keep shorting, a market top will form.

However, it is almost impossible to predetermine a market top. The best way to spot a market top is to notice a reversal beginning to occur in the market when the spread between the commercial traders and non-commercial traders has widened.

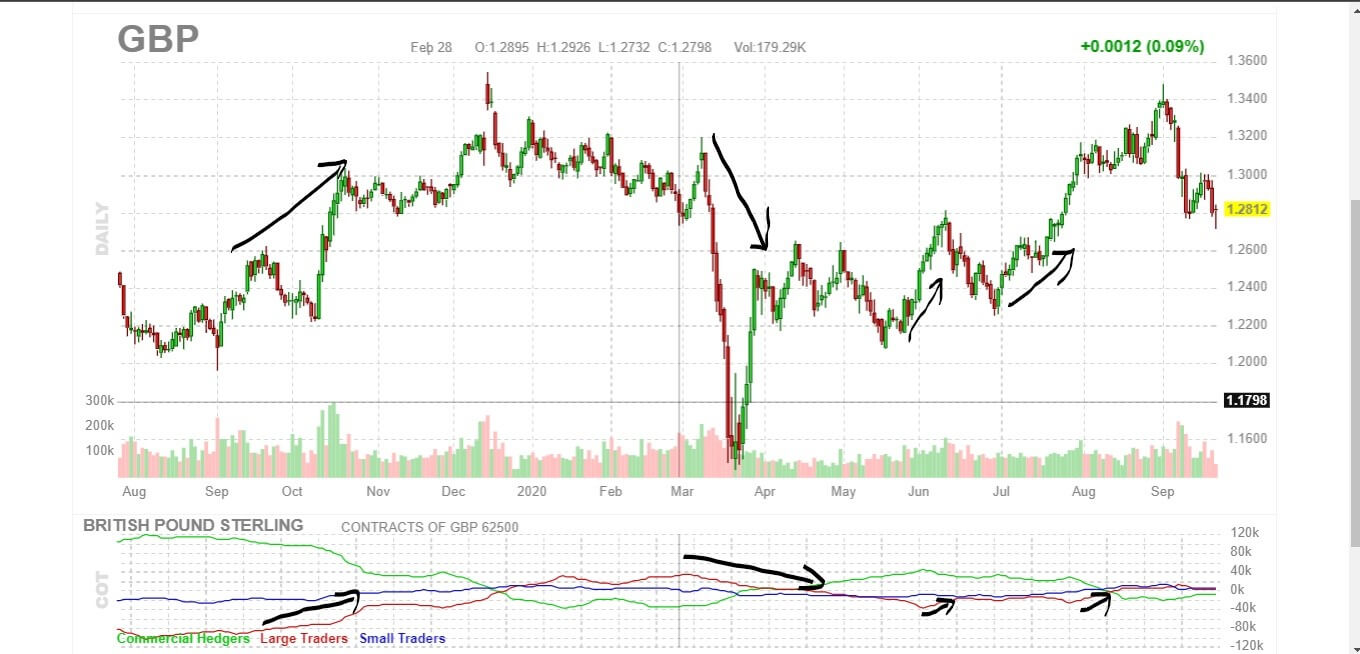
The screengrab above shows a market top formed when the short positions by commercial traders were at maximum. Also, notice that the spread between the commercial and non-commercial traders was wider.

How to identify Bottoms (Oversold Levels) Using the COT Report

When the market prices are falling, non-commercial traders are bearish while the commercial traders are bullish. Therefore, a bearish market will reach the bottom when the non-commercial traders keep selling, and the commercial traders maximize their futures bullish positions.

The best way to spot a market bottom is to notice a bear market trend reversing while the spread between the commercial traders and non-commercial traders has widened.

The screengrab above shows a market bottom forming when the long futures position by the commercial traders was at the maximum. Also, note that the spread between the commercial and non-commercial traders was widest at this point.

[wp_quiz id=”89702″]
Categories
Forex Course

179. Using the COT Report for Trading & Analysis

Introduction

Our previous lessons have covered where you can access the Commitment of Traders Report and the components contained within the report. In this lesson, we discuss how you can use the Commitment of Traders Report in forex trading.

Since the COT report gives the market sentiment in forex, this report’s publication should affect the price action in forex. Most forex traders pay attention to the non-commercial traders’ category of the COT report. The interest with the non-commercial traders is because these traders are considered speculative participants.

The nonreportable positions held by small-scale retail traders are not significant enough to move the markets. Similarly, since commercial traders are not considered speculative traders, the impact of their positions on price action tends to be subdued.

How the COT Report Affects Price Action?

When the non-commercial traders are accumulating their positions, it affirms a particular trend. Let’s take the AUD/USD, for example. When non-commercial traders, over time, are accumulating futures short position on the AUD as the AUD/USD pair falls, is a confirmation that this downtrend will persist. Conversely, when the non-commercial traders are accumulating future long positions of the AUD as the AUD/USD keeps rising, it is a confirmation that the uptrend will continue. This way, you can use the COT report as a trend confirmation indicator.

The COT report can also be used to indicate the overbought and oversold regions. The non-commercial traders, i.e., speculators, have a limit on how much they can buy or sell. These traders will reach a point where they would want to close their positions and take profits. Furthermore, when in a persistent uptrend, speculators might feel it’s no longer profitable to keep buying futures contracts at higher prices. Similarly, in a downtrend, these traders might not consider it profitable to keep selling at lower prices.

When the speculators have reached their critical limits in the forex futures, they begin reversing their trends. For day traders, the impact of the COT is diminished since its effects are long-term.

How the COT Report Publication Affects Forex Charts?

The screengrab below is GBP futures. At the bottom, if the COT indicator is showing the trend of commercial traders, non-commercial traders, and retail traders. In this case, we are interested in the non-commercial traders (i.e., large traders) since their positions influence the trend.

As you can see, the market moves at pace with the changes in the positioning of the large traders.

[wp_quiz id=”89690″]
Categories
Forex Course

178. Decoding The COT Report

In the previous lesson, we learned how, where, and when you can access the Commitment of Traders report. In this lesson, we will discuss the elements contained in the COT report. The CFTC prepares four COT report types: the Legacy Report, the Supplemental Report, the Disaggregated Report, and the Traders in Financial Futures report. For forex traders, the Legacy and the Traders in Financial Futures reports are of most importance.

The Legacy Report
The Legacy report is categorized by different exchanges. Forex traders pay attention to the reports from the Chicago Mercantile Exchange. The Legacy reports have categories for only futures report and a combination of both futures’ and options report. The open interest positions that are reportable are categorized into two: non-commercial and commercial traders.
The Traders in Financial Futures (TFF) Report

This report contains financial contracts, including the US Treasuries, currencies, the VIX, and Eurodollars. Like the Legacy report, it has two categories; only futures report and a combination of both futures’ and options report. The open interest positions in the TFF report are categorized into four: leveraged funds; dealer/intermediary; asset manager/institutional; and other reportable.

Understanding Terms used in the COT Report

Open Interest: The totality of all futures and options contracts that have not yet been executed but are yet to be offset by exercise, delivery, or transaction.

Reportable Positions: these are open interests that are equal to or exceed the reporting level set by the CFTC. These positions are reported to the CFTC by foreign exchange brokers, futures commission merchants, and clearing members. The reportable positions account for about 70% to 90% of all open interests in a given market.

Nonreportable positions: are calculated by subtracting the reportable positions from the total open interests in a given market. The traders involved in nonreportable positions are unknown, as is their classification on whether they are commercial or non-commercial. These are mainly small-scale retail traders.

Commercial Traders: are traders who participate in the futures and options market to hedge their core business activities. In forex futures, commercial traders seek to offset the risks of the spot market. The CFTC has set the definition that qualifies a commercial trader under Regulation 1.3 (z). Commercial traders do not seek to take possession of the assets underlying a futures contract.

Non-commercial Traders: are also known as large speculators. These traders participate in the futures market primarily as an investment by speculating on price movements. They have no intentions of taking ownership of the underlying asset to profit from the price difference.

Changes in commitments from previous reports: shows the difference between the data in the current and the immediate previous publication of the report.

Number of Traders: show the reportable traders in each category. For each category, a trader is counted if they have an open position. The number of traders in each category can exceed the total number of traders because a single trader can have open positions in different categories.

[wp_quiz id=”89679″]
Categories
Forex Course

177. Simple Guide To Find the ‘Commitment of Traders’ Report

Introduction

The previous lesson covered what the Commitment of Traders report is. In this lesson, we will focus on how and where you can retrieve the COT report. The COT report is prepared and published every Friday at 3.30 PM ET by the US Commodity Futures Trading Commission. However, you can access the latest report and those from previous issues at the CFTC website.

The CFTC publishes beforehand the release schedule for the COT report. This schedule can be accessed here. The commission also keeps an archive of all past reports. The historical Commitment of Traders reports can be accessed here.

For forex traders, reading through the COT report might seem cumbersome. If you are interested in trading the forex market using the COT report, some economic calendars make available relevant snippets of select speculative net positions from the report. Below is a screenshot from Investing.com showing the latest release of the COT report on September 18, 2020, at 3.30 PM ET.

If you are interested in an in-depth review of the latest Commitment of Traders report, below is a step by step procedure of how to access it.

Step 1: to view the latest COT report, go to the CFTC website.

Step 2: After accessing the CFTC website, the next step is to find the right report for the forex market. The CFTC published multiple Commitment of Traders reports. These reports include markets other than the Chicago Mercantile Exchange that also contain other non-futures derivative contracts.

The COT report that has data on the forex market is the ‘Current Legacy Reports.’ Under the ‘Current Legacy Reports,’ select the formats belonging to the Chicago Mercantile Exchange.  Below is a screengrab of the from the CFTC website.

To access the COT report, select ‘Short Format’ under the ‘Futures Only’ tab.

Alternatively, if you want a more comprehensive report on the future positioning of traders in the financial sector, you should look at the ‘Current Traders in Financial Futures Report.’ Below is a screengrab from the CFTC website showing this section.

Step 3: After opening the ‘ Short Format’ of Chicago Mercantile Exchange section of the COT, the next step is to identify which currency you are interested in.

Although it looks disorganized, searching through the report is relatively easy. Use the ‘search function’ of your browser to bring up the ‘search box.’ Type the currency you want to analyze. In this case, we searched for the CAD. The search results will appear, as shown in the screengrab below.

I hope you found this guide informative. Please let us know if you have any questions in the comments below. Don’t forget to take the below quiz before you go. Cheers!

[wp_quiz id=”89672″]
Categories
Forex Course Forex Daily Topic

176. Introduction To The Commitment of Traders Report (CoT)

Introduction

In the previous lesson, we discussed market sentiment in Forex. Since you already know how the sentiment comes along, in this lesson, we will discuss how the forex market sentiment is measured.

What is the Commitment of Traders Report?

The commitment of traders (COT) report is how you measure forex market sentiment. One of the primary determinants of market sentiment in forex is the demand for a currency. The COT report tracks how commercial and non-commercial traders are positioned in the forex market.

As the name suggests, the COT report gives data about commitments made by big players in the forex market to conduct future trades. The report shows the totality of futures and options contacts in the forex market, which have not yet been settled. Thus, these future transactions can impact the price movement of the currency pairs in the spot market where most retail traders participate.

How does the Commitment of Traders Report work?

The COT report is published by the US Commodity Futures Trading Commission (CFTC). The publication is released every Friday at 3.30 PM ET. This report shows the total outstanding open positions in the forex futures market as of Tuesday of that week. The data in the COT report includes futures of the major currencies and most of the minor currencies.

According to the CFTC, the COT report is a breakdown of the futures and options market positioning of at least 20 traders. These are traders whose futures and options positions in the forex market are above or equal to the reporting levels set by the CFTC. In our subsequent lessons, we will further explain the type of traders included in the COT reports and the reporting levels.

It is worth noting that the majority of the transactions in the interbank forex market are private and are not made public. For this reason, the retail traders do not have a lot of knowledge about the significant transactions that occur daily in the forex market. Therefore, the COT reports play a significant role in publicizing the futures positioning in the forex market.

Conclusion

The forex market portion of the COT report shows the totality of the long and short futures position adopted by traders. These are speculative traders; whose primary objective is to anticipate future price changes and place their bets regarding a currency. Therefore, monitoring how these market players have positioned their future trades might increase your analysis of future trends in the forex market.

[wp_quiz id=”89646″]
Categories
Forex Course

175. Understanding ‘Market Sentiment’ In The Forex Market

Introduction

By now, you have come across terms like bear markets, bull markets, and neutral markets. At their core, these terms represent market sentiment. In this lesson, we will learn about market sentiment in forex and what brings it about.

What Is Market Sentiment?

Forex traders execute their trades based on how they think the market will move. If you are a forex trader, for whatever your reasons, you must have thought at some point, “…I think the price for the GBP/USD will rise, let me go long on the pair.” This decision was your sentiment about that particular currency pair. By making that trade, you have expressed your sentiment about the currency pair.

However, not every other forex trader would have agreed with you that the price for the GBP/USD would rise. Some forex traders thought the pair would fall and go short. Hence, at any given moment, some traders will hold the assertion that a given currency pair will rise while others claim that the pair will drop. Therefore, at any given moment, there will always be traders favoring going either long or short. Those who are in the majority form the market sentiment.

Therefore, market sentiment is the overall belief of the majority of traders. In the forex market, the market sentiment is the dominant consensus by active traders about a particular currency.

Types of Forex Market Sentiment

Bullish market sentiment occurs when most traders believe that the price for a particular currency pair will rise, and they go long.

Bearish market sentiment occurs when more forex traders short a currency pair because they believe that the price will fall.

Neutral market sentiment occurs when an equal number of traders are going long and short on the same currency pair.

What brings about market sentiment in forex?

In the forex market, sentiments express the outlook of traders about a particular currency or currency pair. Thus, the two main drivers of market sentiment in the forex markets are geopolitical developments and fundamental economic indicators.

Geopolitics

Unexpected political events may impact the future of a country’s economic prospects. In the current climate, some of the significant geopolitical developments that affect market sentiment in forex include; Brexit, the Sino-American trade war, and the 2020 US presidential elections.

Let’s look at Brexit, for instance. In September 2020, there has been increased pessimism about Brexit negotiations with the UK threatening not to honor an earlier agreement with the EU. To forex traders, this increases the chance that the UK will not secure favorable trade deals and also ruin its reputation globally. Since this poses a risk for the UK economy, market sentiment was bearish on the GBP.

Fundamental Economic Indicators

These indicators show how the economy has fared. They show if the economic condition of a country has been growing, stagnating, or worsening. Forex traders base their market sentiments by making their judgments about the economy’s future, depending on how they interpret the publication of these indicators.

If an economic indicator, say unemployment rate, is better than what analysts predicted, it shows that the economy is expanding hence better prospects. When the fundamental indicators are positive, forex traders will adopt a bullish stance on that country’s currency. Conversely, negative fundamental data leads to a bearish sentiment on the currency.

[wp_quiz id=”89638″]
Categories
Forex Course

174. Summary – Multiple Timeframe Analysis

Introduction  

This lesson is basically an overview of what we have covered so far in the Multiple Timeframe series. Multiple timeframe analysis in forex is observing the price action of a selected currency pair under different timeframes. Most forex brokers will provide you with several timeframes. These timeframes are categorized in minutes from 1-minute timeframe to 30-minute timeframe, hourly timeframes from 1-hour timeframe to 12-hour timeframe, the daily timeframe, weekly timeframe, and the 1-month timeframe.

Everything we learned so far!

As we discussed in our first lesson, multiple timeframe analysis involves using at least three timeframes to make a trade. A longer timeframe is used to establish the dominant market trend. Depending on your forex trading style, this dominant trend is used as the prevailing primary trend to anchor your trades. The rationale behind using the longer timeframe to establish the primary trend is because longer timeframes take long to be formed and are not susceptible to the micro fluctuations in price.

The dominant trend is broken down using a medium timeframe to establish the magnitude of the trend. Finally, a shorter timeframe is used as a trigger timeframe by finding the best points to enter and exit a trade. The most common technique of trading multiple timeframes in the forex market is trading three timeframes.

Trading multiple timeframes in forex, therefore, means using multiple timeframe analysis to inform your trading decision. The choice of timeframes used in your analysis entirely depends on the type of forex trader you are.

The table below summarises the type of forex trader and the preferred timeframes.

Note that the above table is merely a guideline. We recommend selecting your desired timeframes for analysis based on your trading style and comfort of analysis. Therefore, the best timeframes to trade in forex will depend on factors such as market volatility and your trading style.

Some of the importance of multiple timeframe analysis in forex include:

  • The ability to determine the magnitude and significance of economic indicators;
  • Identifying support and resistance levels which aid to execute various forex orders and in setting ‘take profit’ and ‘stop-loss’ levels;
  • Helps to identify market trends and their magnitude at a glance quickly; and
  • Helps in forex forecasting by eliminating the lagging effects of most technical forex indicators.
[wp_quiz id=”89204″]
Categories
Forex Course

173. How To Trade Using Three Different Trading Timeframes?

Introduction

Our previous lesson covered how to use multiple timeframe analysis to find better entry and exit points. Timeframes in forex trading can be categorised into three: long timeframe, intermediate timeframe, and short timeframe. This lesson will illustrate how you can trade with three timeframes depending on the type of forex trader you are.

Depending on your forex trading style, the long timeframe is used to determine the prevailing market trend; the intermediate timeframe used to show the consistency of the observed trend, while the short timeframe used to determine the best entry and exit points for a trade.

Long Timeframes in Forex

The long timeframes are used to establish the prevailing primary trend of a currency pair. Depending on the trading style, the long timeframes in forex ranges from a 30-minute timeframe to a 1-month timeframe.

Day trader long timeframe: 1-hour GBP/USD chart

For a forex day trader, a 1-hour timeframe shows the prevailing and dominant downtrend in the GBP/USD pair. Using this timeframe, you can establish support and resistance levels.

Intermediate timeframes in Forex

These timeframes are used to establish the current market trend. The intermediate timeframe in forex helps you to determine the magnitude of the trend observed with the long timeframe. It is expected to see more price fluctuations when using this timeframe, but the general trend should align with the long timeframe.

Day trader intermediate timeframe: 30-minute GBP/USD chart

As can be seen, the price pullbacks are more visible using the intermediate timeframe. The price fluctuations are more pronounced as you can see how the primary trend observed with the long timeframe is broken down.

Shorter timeframes in Forex

Depending on your forex trading style, the shorter timeframes show the most current and shorter changes in the price movements.

The shorter timeframes are used to determine the best entry and exit points of a trade. With shorter timeframes, you can quickly establish whether the price has reached the support and resistance levels.

Day trader shorter timeframe: 15-minute GBP/USD chart

Using the 15-minute timeframe, the day trader can quickly establish the entry positions for shorting the EUR/USD when the price bounces from the resistance levels.

Trading three timeframes helps you establish the dominant trend, narrow this trend down while determining its magnitude, and finally establish the best entry and exit points.

[wp_quiz id=”89198″]
Categories
Forex Course

172. Using Multiple Timeframe Analysis To Identify Accurate Entries & Exits

Introduction 

At this stage, you are now familiar with how to conduct multiple timeframe analysis for the different type of forex trades. In the previous lesson, we covered why you should look at multiple timeframes when trading forex. Now, let’s narrow down to how you can use multiple timeframe analysis to determine which price levels make the best entry and exit points to match your trading style.

Why is it important? 

Using longer timeframes helps get the bigger picture while the shorter timeframes show you how the dominant trend is constituted. Support and resistance levels are used to determine the best entry and points of a trade. To properly illustrate this, we will use the example of a forex swing trader.

For a forex swing trader, positions are left open from overnight up to a few weeks. Daily timeframes are used to establish the dominant market trend for a currency pair. This timeframe will help you establish long-term support and resistance levels.

Forex Swing Trader Daily Timeframe for EUR/USD Primary Trend

The daily forex timeframe for the EUR/USD shows that the pair is on a downtrend, as evidenced by the lower lows and lower highs. The lowest low from the daily timeframe will enable the forex swing trader to establish the support level. Lower highs are formed when the price of the pair attempts a ‘pull-back.’ These lower highs will be used to set the resistance levels.

Since the dominant trend is downward, the resistance levels will be used as the ‘high swings, ’ which will be the best entry point for a short position. The resistance levels are used since the currency pair’s price is unlikely to break above this level.

Forex Swing Trader EUR/USD 4-hour Trigger Timeframe

To determine the best entry and exit points, as a forex swing trader, you use the 4-hour timeframe. When the 4-hour candles don’t breach the resistance level, you open a short trade and exit when the 4-hour candle touches the support level at the low swing.

This strategy can be adopted for the other type of forex trades.

Using multiple timeframe analysis for different forex orders

With a top-down analysis approach, different types of traders can use multiple timeframe analysis for executing different types of forex orders. Take a forex day trader, for example.

Forex Day Trader 1-hour Primary Trend Timeframe for EUR/USD

After establishing the support and resistance level, the forex day trader can use the resistance level to set the sell limit or the buy stop order. The support level is ideal to set the buy limit or the sell stop orders. The ‘stop-loss’ and ‘take profit’ levels can then be set to exit these trades depending on your risk management measures.

[wp_quiz id=”89182″]
Categories
Forex Course

171. The Best Timeframe for Forex Markets

Introduction

In our previous lesson, we looked at which timeframes you should trade in the forex market. We established that the timeframes you trade depend on the type of forex trader that you are. This lesson will cover the best timeframes to trade using illustrations depending on the type of forex trader you are.

Best Timeframe for Forex Position Trading

1-Month EUR/USD Primary Trend Timeframe

The monthly timeframe shows a downtrend in the pair.

1-Week EUR/USD Trigger Timeframe

For a forex position trader, the 1-week timeframe can be used to establish the support level. This level will make the best entry point when the price trends below it.

Best Timeframe for Forex Swing Trading

Daily EUR/USD Primary Trend Timeframe

Forex swing traders trade in the direction of the preceding trend, which in this example, is a downtrend.

4-hour EUR/USD Trigger Timeframe

For a forex swing trader, using the 4-hour timeframe is the best to identify the ideal entry and exit points.

Best Timeframe for Forex Day Trading

1-hour GBP/USD Primary Trend Timeframe

For a forex day trader, the dominant market trend is a downtrend. With this chart, the day trader can establish multiple support and resistance levels. The 15-minute timeframe is used to establish the best market entry positions.

15-minute GBP/USD Trigger Timeframe

With the 15-minute timeframe, multiple entries and exit points can be established.

Best Timeframe for Forex Scalping

15-minute EUR/USD Primary Trend Timeframe

For a forex scalper, the 15-minute timeframe shows an uptrend. The 5-minute timeframe will be used to establish the best points of entry into the market.

5-minute Trigger Timeframe

The 5-minute timeframe presents the forex scalper with the best points for entry into the uptrend market.

Best Timeframe for Fundamental Forex Traders

Fundamental forex traders can also use timeframe analysis to establish the magnitude and volatility resulting from the release of an economic indicator. Therefore, depending on whether the indicator is high- or low-impact, you can determine which timeframe is best to trade.

With high-impact indicators, you can trade from the 30-minute timeframe.

30-minute timeframe for Australia’s GDP data release. September 2, 2020, 1.30 AM GMT

Furthermore, the price action from the release of a high-impact economic indicator can persist in the market for the long-term.

30-minute timeframe for Australia’s GDP data release. September 2, 2020, 1.30 AM GMT

The 4-hour chart shows that the AUD/USD pair continued trending downwards due to the less than expected GDP growth data.

For low- to medium-impact economic indicators, it is best to trade shorter timeframes from 1-minute to 15-minutes.

5-minute timeframe for Australia’s retail sales data release. August 21, 2020, 1.30 AM GMT

At longer timeframes, the effects of these indicators on the price action dissipates.

1-hour timeframe for Australia’s retail sales data release. August 21, 2020, 1.30 AM GMT

[wp_quiz id=”89173″]
Categories
Forex Course

170. Why Consider Analysing Multiple Timeframes When Trading Forex?

Introduction 

Our previous lessons have covered trading multiple timeframes in forex and which timeframes are suitable for your trading style. To some forex traders, trading multiple forex timeframes can seem tedious and time-consuming. Here are some of the most important reasons why you should look at multiple timeframes when trading forex.

1. To easily identify trends and their momentum 

Depending on the type of forex trader you are, multiple timeframes will enable you to see the prevailing market trends at a glance by filtering out periodic price spikes. It is easier to identify the direction of the market trends and consolidations, whether in the short- or long-term.

For the long-term market trend, you can use the weekly and the monthly timeframes, while the intermediate market trend can best be identified by the 4-hour to daily timeframes. Timeframes of between five minutes and one hour can be used to determine the short-term market position.

The longer timeframes filter out the short-term price fluctuations, which might otherwise result in trend inconsistencies when viewed alone. The periodic fluctuations in the short-term add up in the long-term. With multiple timeframe analysis, the strength and consistency of the short-term trend can be compared to that in the long-term. This comparison is made by observing whether the prevailing long-term trend was dominant in the short-term as well.

2. To establish the significance of fundamental indicators

Using multiple trend analysis, you can easily establish the magnitude that news release of economic indicators has on a given currency pair. To determine the significance of the economic indicators, you can use different timeframes to establish how long the news release affected price action. The effects of high-impact fundamental indicators can be traced from the shorter timeframe to the longer timeframes. Low-impact indicators only affect price action on the shorter timeframe.

3. Identifying the support and resistance levels

Based on the forex trading style you choose, you can use the more extended timeframe within your category to establish the support and resistance levels in the market trend. Shorter timeframes can then be used to trigger entry and exit points for a trade.

These support and resistance levels are crucial in deciding the forex order type you want to execute. Say, for example, you want to use a buy limit order. You will use the support level as your trigger price. Similarly, the support level can be used as the trigger price for a sell stop order. You can use the resistance level as the trigger price for the sell limit and buy stop orders.

4. To avoid the lagging effects of technical indicators

Technical forex indicators are lagging since they derive their properties from the price action of a forex pair. Therefore, the forecasting significance of multiple timeframe analysis in the forex market can be said to be leading that of the technical indicators. Furthermore, some technical forex indicators can produce conflicting signals. Thus, trading with multiple timeframes improves your forex analysis.

We hope you understood why it is crucial to consider analyzing various timeframes while analyzing the Forex market. Please take the below quiz to know if you got the concepts correctly. Cheers!

[wp_quiz id=”89156″]
Categories
Forex Course

This Forex Trading Plan May Actually Shock You

In the forex market where every activity and movement happens rather quickly, traders need to be particularly prepared to take on unexpected challenges. This form of readiness requires preparedness and understanding of various steps that would secure one’s position regardless of external influences or triggers. Naturally, traders may find a specific activity to be of greater difficulty, such as journaling is for many, yet these tasks need to be incorporated and accepted as habits. It is in the acknowledgment of the purpose and effectiveness of having a fixed routine where traders can finally learn how to exercise control and minimize the risks in which this market is so profoundly abundant. As this article focuses on risk as a concept and as an inherent part of the forex market, traders are invited to think through and analyze what their understanding of this term is and assess how much risk they are generally ready to take. Today’s topic is also a path to a discovery of one’s own perception and risk tolerance, supported by constructive advice on how to actively control and limit any risk-related issue, towards learning how to use this knowledge to create a functioning trading plan. 

We know that the forex market is, unlike others, almost always open and this characteristic often draws traders into assuming that they are in a position to take action just because there seems to be movement. This compulsive and uncontrolled drive is frequently emphasized by a desire to increase one’s capital, but they, unfortunately, lack the insight into the market’s nature and the skills to plan their actions. As the market typically moves quite randomly and unexpectedly, traders usually fail to grasp the fact that they can only trade when there is an actual trend or a move taking place that is worth the risk they are about to take on. Due to these reasons, it is crucial that traders learn how to plan their trades, weigh their options, and construct a plan based on the charts.

What traders are summoned to do is strive to understand why their results do not match their initial expectations and become introspective to reach invaluable conclusions. The ability to ponder actively and check in on oneself is key because the realization of what has caused all the losses one has had to take renders the trader free. When people get into thinking of why they made a certain move and what kind of behavior enabled a certain string of events, they may come to understand how their personality is linked to the outcome they have never seen coming. Once they start unfolding layers and opening up to an internalized assessment, traders have a real opportunity to see how their traits and characteristics affect and create their trading styles. What is more, this process also allows traders to discover areas where they are likely to struggle as well as parts of their personality which can be particularly useful for their trading careers.  

Since many of us, including traders with years of experience in this market, lack this deep understanding of why we keep making the same mistakes over and over again, it is high time that we asked ourselves why this keeps happening. Why is it that we repeat the same actions that continually impact our trading in a negative way? Unfortunately, even when traders make a promise to themselves that they would be more disciplined and that would strive to control hazardous behaviors, their actions often fail to follow their thinking. If we had the power to do everything ourselves, we would have corrected our flaws by now. As this is not the case and we are unable to effectively alter the behaviors that proved to be detrimental to our finances and accounts long ago, we need to acknowledge the fact that there is a deeper underlying problem.

Learning the basics of this market may take a few months, after which you will be fairly versatile in charts, currencies, crosses, and rates although, needless to say, the amount of time needed to study yourself is much longer. With the development of a trading plan, you are rounding off your trading career, thus setting yourself off on a good path to prosperity. We know by now how the market is going to oscillate freely and regardless of what you chose to do at a particular moment and, as such, it is still not the least uncontrollable factor – you are. Each trader is the variable that can put effort and work on himself/herself to become a constant in whichever context. And, again, in spite of what market situation you find yourself in, you need to find the beliefs, skills, and steps that will put you in the group of winners because this market is always going to bread both winners and losers under all circumstances.

To be able to create an effective trading plan, traders need to set realistic goals and returns, so once they complete their education on forex basics, they need to move on to its practical applications. It is unfortunate that after years of trading, many individuals still show no knowledge of some elementary terms such as currency swap. What is more, even when they do complete the initial learning stage, traders are faced with the cold reality where many theoretical items of knowledge go against what they are required to do in actuality. As in real life, theory always differs from practice and this is the concept shared across various businesses, asking people to always come up with new and innovative ideas to adjust to real-life situations. 

This article will be divided into several sections – we will firstly assess and explain the forex market, show how it operates, and reveal some interesting facts that traders may use in the future. Then, we will move on to currencies and learn about the major currencies and different monetary systems across the globe. Afterward, we will highlight the differences between going short and going long, which are considered essential for trading, and see how we can use pairs trading. We will also learn how traders actually get their orders filled and how we can reach the market. In addition, we will cover the differences between amateurs and professionals, where you can go through a checklist and assess yourself. Last, we are going to analyze different constituents of a trading plan, giving you a definitive list of the parts you need to incorporate when creating your own trading plan. 

The Forex Market 

The Foreign Exchange market, otherwise known as the FX, Spot, Cash, Currency, or Interbank market is the largest one in the world so far. With an incredible turnover of people and finances, this market is entirely different from any other marketplace or trading experience. As such, forex required all interested parties to exude a special interest in these topics and show a true passion for trading. For example, many expert traders who first started off in some other markets quickly learned that trading currencies differs greatly from experience accumulated while trading equities or futures. With equities, in particular, the stock market opens at 9.30 AM EST and closes at 4 PM EST each and every day. This schedule allows stock traders to go home at the end of the day and relax without thinking about trading or needing to make a move outside their working hours. Trading currencies is, however, vastly dissimilar because of the market uniqueness and the fact that it does not close the way others do. Many professional trades explain how they see forex both as a blessing and as a curse, having experienced the greatest wins and the biggest stress trading in this market. Experts also point out how the FX market rendered their lives less traditional than before owing to the intricate characteristics and a distinctive schedule each currency trader comes to develop over time.

It is interesting to note how traders within the United States of America typically trade currencies on the side, while they primarily engage in trading stocks, options, and/or futures. Traders in some other countries, however, appear to be strictly focused on the forex market because the local markets are quite underdeveloped in comparison to the currency market. Canada could serve as a great example of a country whose stock exchange includes solely a few hundred stocks out of which only approximately 100 have a volume decent enough to start trading in the first place. As the market is simply not big enough in terms of depth and liquidity, Canadian traders are understandably more specific with regard to the markets they choose to trade. Similarly, Indian local markets severely lack structure and are highly affected by corruption, which directly propels locals to turn to currency trading. 

With $4 trillion transactions a day, the forex market is undeniably immense and diverse. As such an immense marketplace, its scope encompasses the US stocks, futures, commodities, and the Treasury markets combined and multiplied by three. Interestingly enough, despite its wide applications from the perspective of geography and the fact that it is so widely dispersed and lucrative, forex actually has no physical marketplace. Stocks, for example, are traded at the New York Stock Exchange and, even though technology has changed the way everything is processed, orders are still sent to the nearest exchange where they are filed electronically whenever a trader clicks to buy shares. Another American stock exchange, the NASDAQ, however, does not have an actual building although it ranks second after the New York Stock Exchange. The advertisements created for this exchange even seem to suggest that traders can actually walk freely into its offices when, in fact, one could only find empty desks and computers in their database located in New Jersey.  

The forex market resembles the NASDAQ, as traders cannot find an actual exchange that they could visit. In actuality, the forex market is comprised of various banks, corporations, and traders that weave this intricate network together. All rates are put on the interbank rate list with thousands of participants giving their bids and ask, thus creating the market in question. Forex is also known for its high liquidity that surpasses any other market along with the unique speed of trade and transaction costs. In addition, when compared with the stock market, forex traders need not worry about the low volume and large spreads between the bid and the ask (or between what you buy it for and what you sell it for). In the currency market that numbers such so many participants, the number of transactions is incredibly high, which entails that traders need not worry about the same challenges that are present in other markets. Aside from its tight spreads, the FX market is also praised for the best possible rates for spreads and commissions. 

Trading styles can be truly diverse and they may vary from one market to the other. As forex is a trending market, most traders are solely interested in directional trading, i.e. traders buy and you sell or they sell and then they buy, although they have a plethora of other options at their disposal. For example, in options and futures, it is possible to try spread trading; in trading stocks, participants can learn about pair trading and, in trading currencies, everyone is mostly governed by the notion of making a profit based on the difference between buying and selling, which is what directional trading essentially means. Despite the many trading variations that traders can test and use, forex is an exceptionally good market for directional trading because of its depth, the lowest prices, and the best trends.

In the stock market, a particular stock can move in a specific direction for a few days or a few hours before it finally pulls back. In the currency market, the price has been known to keep moving one way for five or more days without any substantial pullback. Prices in forex can even keep going down without a bounce for over a month too, which leaves much room for successful directional trading due to the trending nature of this market.

As explained before, it is the nature of this market to be constantly open. In fact, the forex market offers 24-hour access over 5 days a week. It opens at roughly 5 PM EST on Sunday and closes at about the same time each Friday. Due to its availability and ease of access, traders often feel compelled to trade and they often do it excessively, falling into the trap of overtrading. Many professional traders explain how they have struggled with this issue in the past, feeling grateful that they started in some other market first. We have seen above with some other markets how traders are unable to click any more buttons or make additional trades once these markets close at the end of each day. As forex does not have this ability, it is important to remember that we can only enter trades when the market is there or when there is sufficient energy to do so. As in the forex market, we do not need to wait for the following morning to start trading again, we truly need to learn when we can and cannot trade because trading whenever we feel like it is unproductive and quite hazardous as well. 

Most currency trading is done through the banks, which are major market participants that are always in the act of buying and selling, as well as through the interbank rates. The reason why the forex market is always open lies in the fact that one can always find banks to be open sometime, somewhere in the world. The first bank that opens on Sunday with respect to the daylight savings time is located in New Zealand, immediately followed by the banks of Australia and Japan. As the chart below shows, both the Australian and the Japanese banks close just after European banks open, which only points to the nature of the currency markets to always be open and running somewhere on the planet. We can also see how when the US market closes, the New Zealand banks open up, so trading happens continuously. This chart below is clearly very inviting for anyone who wishes to start trading, and with so many options and availability in terms of time, it is easy to fall for the illusion that you can trade anytime, whenever you please. 

High leverage, which is an inherent part of trading currencies, can be either good or bad, depending on how it is used. Many traders struggle with overleveraging, which is one of the fastest proven ways to lose an account. Traders have confessed to having lost 25% of their accounts in the past, and some have even gone beyond 50%. Even with a loss of smaller proportions and of a lower percentage, after two losses in a row, all of a sudden, this person is down by nearly half of their account, which means that they need to double that return to get that back. Even if they do get wins, the losses in between can be so heavy that they enter a downwards spiral causing their account to gradually fall down in value. 

While it is increasingly wise not to start with a lot of leverage, it is also incredibly important to get used to adding leverage to the winning trades. The Forex market is truly exceptional because it proved the traders with the highest leverage power among all markets; however, it is at the same time one of the greatest challenges for forex beginners. It is because of these hidden dangers that traders need to use a strategy and determine where to put a limit. For example, you can limit your leverage to 5%, but there is no need to go all in all at once. You can start slow and buy one lot, and if this turns out to be a good trade, you can then buy another lot and repeat the process again and again. Most importantly, if this trade keeps going your way, you may end up buying five lots in the end, but you do not need to hit your limit right at the start. This is extremely significant advice, as you will be much better off if you gradually build up your position. That way, even if you do take a loss, it is minimal, whereas you leave room for your wins to get really big.

Some additional benefits of the FX market include low transactional costs, low accounts minimums, and above-average profit potential. The amount of cost to execute trades has dropped considerably in recent years. Nowadays, there are no exchange fees and clearing fees since forex is an over-the-counter market. Additionally, individuals today can get started with a minimum account for as little as $500 and there is no doubt that forex trading has massive potential regardless of where you are on this planet.

Currencies

Today, there are more than 80 currencies in the world and, understandably, we cannot possibly trade them all. Despite this diversity and abundance, we only want to trade the most liquid currencies. We have no desire to trade some obscure currencies such as the Indonesian rupiah because there is a lack of volume, the spreads are wide, and there is a lot of slippage involved. Traders are advised to focus on the major eight currencies – the EUR, the USD, the JPY, the CHF, the GBP, the AUD, the NZD, and the CAD. Some people also like to add currencies such as the Swedish krona to this list, which may not make a lot of sense because this currency is highly correlated to the EUR. This essentially means that if the EUR goes up, the krona will do too. Therefore, if either one of them goes down, the other one will follow as well, so experts would typically recommend traders to just trade the EUR in this case. Similarly, a person wishing to trade the Hong Kong dollar might want to know that this currency is pegged to the USD, so trading the latter would simply be more sensible.

As traders should always focus on the major currencies, they should also strive to learn as much as possible about them, including their nicknames. The alternative name for the GBP, for example, is cable, which is completely understandable considering the currency’s history. Back in the 1920s, the very first telecommunications line was laid across the ocean from London to New York City in order to get quotes in real-time. Therefore, whenever someone wanted to get a quote on the exchange rate of the GBP, they had to go through that cable stretched across the Atlantic Ocean. Soon enough they started asking “What’s the quote on the cable?” and the rest is history. It became common knowledge that whenever someone would refer to the cable, this person was referring to the GBP in fact. Additional names for the GBP also include the sterling or the pound sterling, while some other currencies such as the EUR do not have any nicknames. Nicknames can get quite creative, such as the greenback for the USD, and we may see how certain alternative names are often derived from the actual name of the country (e.g. swissy). 

Some traders even shared that when they heard some currencies’ nicknames (e.g. loonie for the CAD), they assumed that they referred to an unstable person due to the meaning of the word. The loonie, clearly, is not a name for someone who is challenged in any way, but the name of the C$1 coin, which originates from the name of the bird (loon) engraved on the front of the coin, which is why the Canadian $2 coin is called the toonie. Each one of these currencies will also have a symbol, and most of them are acronyms or first letter abbreviations that are used frequently in writing and in speech. 
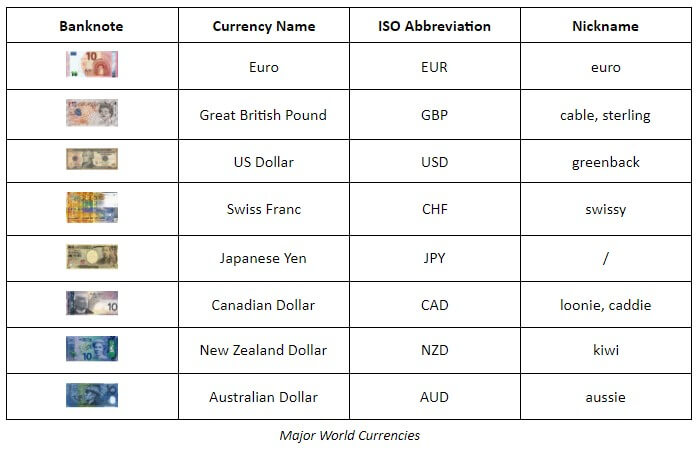
Pairs Trading

Pairs trading is a strategy that consists of going long on one thing and short on something else, which means that traders will always enter two trades at the same time. For example, a trader can show interest in Ford and GM stocks (the two companies’ charts are shown below) and decide to go long on Ford and short on GM. This concept entails that the undervalued stock is bought while the overvalued one is sold short because of the premise that one is a better stock than the other. By doing so, the profit does not depend on market activity any longer because both of these stocks are going to go down if the stock market starts to sink. Should the market go up, however, both of them will also rise in value. In addition, if money starts pouring into the Automobile sector, it will reach both of these stocks too. This is called a market-neutral strategy which entails the effort to reduce the impact of all the things that make stocks move up and down in value. If you do a pairs trade with Ford and GM stocks, you are taking all the components affecting these stocks out of the equation. That way you will inevitably make money if your premise is right. Even if both of these stocks crash, which is what happened in 2009 when GM almost reached zero and Ford went down by 42%, your short position made a profit of 60%.
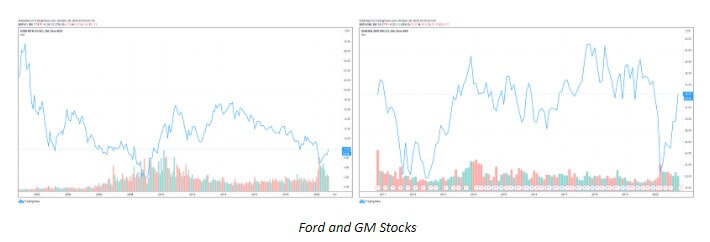
To further clarify the previous strategy and provide additional information, it is also vital that we practically explain what going long and going short entail. The two are found among the most important concepts to remember because trading will always involve one of the two if not both at the same time. Whenever a trader goes long, he/she actually buys something first only to sell it after. Traders always look for a discrepancy in price, so they may buy something for $50 and sell it after for $5 more. This concept is something that most beginners in the forex market seem to comprehend effortlessly. However, early on, traders seem to have difficulty with understanding the other concept because it seemingly differs from what most people are accustomed to. When we go short, what we actually do is sell first and buy second. This is what traders do when they, for example, believe that a stock is going to go down, so they may sell it for $50 (which is allowed), which then makes them short. If the stock goes down to $45 and the trader buys it at that price, he/she makes a $5 profit. Unfortunately, if its value goes up, this person will find himself/herself at a loss. This is the essence of going long and short in trading.

Forex Brokers

Any trader who is ready to make use of his/her system and buy a specific cross must do so through FCM which handles all such transactions. FCM is in fact a name for a broker in the stock market which acts as an intermediary between the two sides. As traders cannot possibly visit the nearest stock exchange and buy 100 shares of a company, they actually have to go through an individual, a broker, having a seat on the New York Stock Exchange. The same applies to the forex market where all traders pass through an FCM because the entire process is regulated in the same manner. Hence, any trader wishing to get to the market must do so through a broker.

In the world of currency trading, there are several brokers traders may already know of. The largest currency trading firm in the world is FXCM, which is also known for its infamous moment when they almost went out of business due to the Swiss national bank decision to pull their peg to the EUR in 2015. The company ended up losing more money than what they had in their accounts, thus threatening all clients’ finances. Luckily for everyone involved, FXCM managed to emerge from the potential catastrophe unharmed as they were bailed out. The company is no longer operating within the United States after it was banned by the Commodity Futures Trading Commission (CFTC) which revealed some fraudulent behavior on behalf of the company. The entire turmoil over the event and disclosure of the information was settled in 2017 when FXCM agreed to pay a $7 million fine and never seek to register with the CFTC again.

Another well-known brokerage firm is IB (Interactive Brokers), which is a huge multinational company often praised for their professionalism. The benefit of collaborating with such a company lies in the fact that it is used to dealing with currency traders and currencies. Besides, Interactive Brokers always wins all the awards for the fastest execution and the lowest cost alongside having been rated first by Baron’s, a US weekly magazine/newspaper published by Dow Jones & Company. Along with that, since all brokers, or FCMs, always publish the percentage of their profitable currency traders, IB usually displays between 15% and 20% of such winning traders although this percentage is at about 50% almost every single month. The company is also preferred by expert traders owing to its professional and fast execution as well as the greatest spreads and fees.
Apart from choosing a broker you wish to collaborate with, it is also necessary to create a demo account after you have worked on your simulator and perfected some of your strategies. Different people will always use different systems, so some traders might opt for MetaTrader for example. MetaTrader operates similarly to IB and traders should expect to become conformable using the platform after a week’s time. Traders are simply required to get used to having and using a demo account; besides, it is typically the place where professionals go too. 

Interactive Brokers also offers multiple trading platforms and they have the best mobile trading platforms (e.g. TWS or Trader Workstation) for which they have already been awarded in the past. These platforms are truly applauded by many forex trading experts who used to have difficulty making a work-life balance in the past due to technological limitations of the time. Most professionals nowadays actually first started to trade in the 1990s, when it was impossible to use phones to check or manage trades unless they were physically behind a system. The internet was a luxury at the time and it was mostly available in the offices only, which meant that traders would have to leave their homes or other social engagements to be able to know where the market was and what was happening, get quotes, or close out a position. 

Mobile trading alleviated most of these problems, so traders are not obliged any longer to go into their offices at night and close their positions which they did not want to keep overnight. These platforms also give traders the freedom to do business wherever they please, and some experts even say how they have had the experience of trading in some unusual places such as a cave or an island. As mobile trading allows you to trade regardless of your current location, it does bear a negative side to it as well. Similarly to the nature of the forex market, which is always open, mobile trading platforms may put extra pressure on traders who are prone to making rash decisions and overtrading. Traders need to have discipline and set up strict rules to prevent making mistakes when they feel bored or compelled to enter a trade, which understandably never leads to success in most cases.

While MetaTrader is undeniably the most popular platform, it typically does not function as an FCM although it can be attached as software to one. Aside from FXCM and IB, traders can also have an account with TDM or ETrade, which equally allow you to make money because they are going to the same place or the same market. Regardless of which platform or broker you chose to use, the rules are always the same. If a trader is unable to trade well and keeps making mistakes taking many losses, he/she will not be able to earn a profit through either of them and vice versa.   

Professionals vs. Amateurs

In order for any trader to make it in this market, every single participant needs to treat the entire process as a professional and set the ground for the next steps. Naturally, in order for anyone to be able to see trading from a different perspective, he/she also needs to grasp the difference between the professional and the amateur approach to trading shown in the table below. Professional traders always have clear trading plans with set goals which may vary between daily, weekly, monthly, and even yearly ones. They also know how to make money in the market and manage their risk through the use of stops/hedges. To ensure consistent and continual growth, experts always keep their records making it a habit despite the difficulty. Moreover, professional traders rely on strategies, which is the biggest difference between the professionals and the amateurs, who are likely to jump on any opportunity. As amateurs are likely to be drawn to any movement they notice without a previously devised plan, they are highly exposed to failure because this approach rarely works since traders need to have specific entry and exit points. Furthermore, amateurs are prone to taking advice and tips from any individuals, while professionals in the market strive to consult with other professionals seeking expert opinion. The more advanced traders have also already made their selection of tools and they insist on using the best suitable ones which have emerged top after thorough testing. Furthermore, they have invested in getting informed and educated on topics that may relate to forex. The essence of prosperity in this market lies in having a plan and as you can see, the moves that amateurs make are not only fewer in terms of numbers but are completely opposite from what professionals do to remain on the top of the game. As a professional, everything is clearly designed and set up, which further entails that traders cannot just click buttons whenever they feel like it.
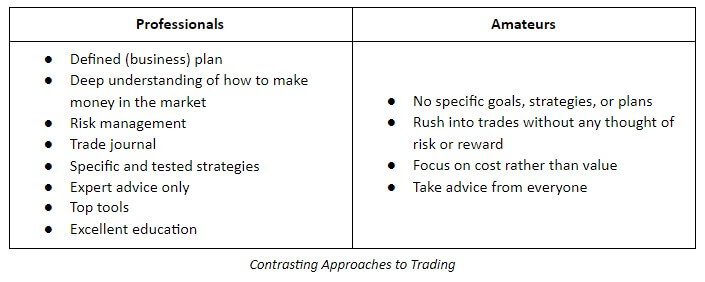
Trading Plan

Before any decision is made, it is crucial to design a trading plan which lies in the basis of any and every activity a trader wishes to take. Simply put, a trading plan translates as the steps you are going to take in every possible situation. It also includes decisions on specific moves you may take on a particular day when an important news announcement is supposed to come out. These choices are never made randomly because they all comprise your trading plan. Every trading plan consists of a number of such decisions that have been drawn and written before any event takes place as a result of your own action or occurring independently in the market. Professional traders predetermine everything and if you do the same, you will know that the market is aligning with your intentions rather than going against you. With a plan and discipline, every trader can achieve success in the forex market.

To better explain what a trading plan is, we need to precisely separate its consistent parts and discuss each one separately. Firstly, the initial part of the trading plan always boils down to several questions: why am I am going to do something; how am I going to achieve this; and, what my hours are going to be? The beginning stages always involve the type of questions that concern the trader alone, while the following parts will mostly have to do with your strategies. Naturally, as there are numerous ways to earn a profit, you may need to ask yourself if you are willing to trade breakouts, cup and handles, hammer candles. It is vital that you assess and predetermine what you are going to trade, letting go of all other options. Traders who fail usually assume that it is enough to just sit down and trade without giving it any thought before, but as you can see, the planning stage is essential for achieving success and each part of the picture is equally relevant. 
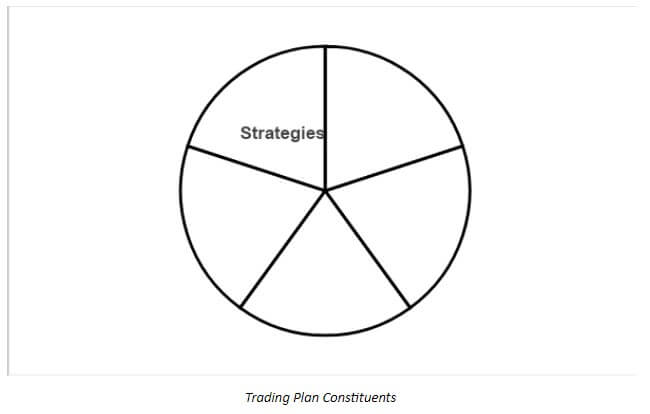
Goals

Before proceeding to read the importance of having clear goals, you can use a pen and paper and create an outline based on these instructions. The first step in your trading plan should be to write about you and determine when you want to complete each stage of the process. For example, when are you going to start demo trading or live trading? When are you going to leave time for education? Is it going to be a span of a few hours on a specific day or will you divide this time frame into several days? You can make use of the list of questions below and fill it with your own answers. Of course, allocating time to clearing up what you want and how you are going to achieve your goals may not be a particularly fun activity but it is the only way to properly build a foundation for your future trading. 
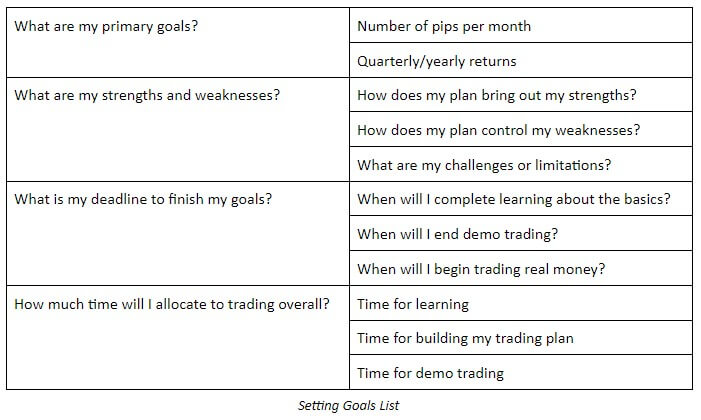
Education

Whenever we discuss education, it is necessary that we first accept that we do not know everything and remain open to being molded and shaped by the information we absorb. Many people turn to professionals for help, but all they are truly looking for is not education but money, wishing to amass a fortune quickly and effortlessly. In trading, however, there are no quick fixes, so if someone already claims to know everything, we may naturally wonder why this person does not already enjoy the abundance that should naturally spring from this richness of information they supposedly possess. When you are open to learning, you reveal that you are a humble individual and that you understand how there are areas you may need to clean up to make room for prosperity. 

While being open to learning is important, it is also vital that you create your own style of trading because no one can trade exactly like someone else. Everyone is different, thus having different psychology, triggers, and personality. Therefore, adopting someone else’s choices and positions might be an unnerving experience, which is why it is important to realize what you can accept, apply, and control. Nonetheless, it is a must for any trader to build his/her foundation slowly and thoroughly. Understand that, as with anything else, there are layers to knowledge on trading, and you can come up with ideas with time how and when you want to learn different things. You should strive to explore classes and lessons that are available and seek professional advice. Expand the tactics and techniques you can apply, and also get educated on other markets where you can trade such as options or futures for example. Last but not least, keep building on your risk management, tools, and skills.

Go through this process and see how the information you take in corresponds to your own personality and traits. Some people may like trading the hourly chart, but you are free to choose any other time frame instead if you feel like that is too slow for you. Most importantly, learn how to use all the knowledge in a practical manner and test it via a demo account. Soak in as much as you can because the more you know, the greater the protection from your own self-sabotaging mechanisms is and, hence, the healthier your trading plan will be.
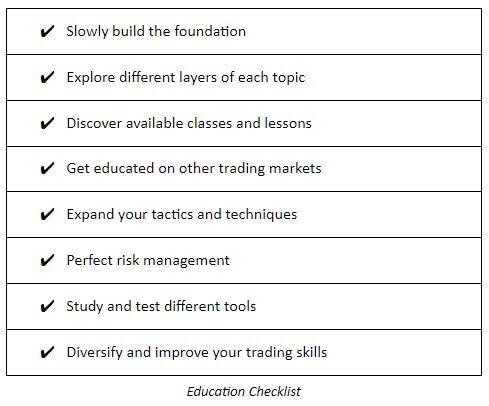
Risk Management

As we all understand by now, every trader is unique, which is why some people are going to want to enter the daily chart, while some others will prefer different time frames. Although these questions are open to interpretation and depend on personal preferences, time management is an area where such variations must not exist. Especially when you start working as a prop trader and you are given someone else’s money, you are expected to treat that money with respect. Nevertheless, one cannot build this kind of attitude unless it is initiated from the very beginning. 

You need to know your rules and as things can quickly turn against you in trading. How can you control the situation and yourself? If you see that a trade is turning sour, when will you draw the line and decide to exit? Also, when you want to enter a trade, how much are you willing to risk if it turns out to be a winning or a losing one? When a particular pair you are trading breaks up above or goes below a certain price, when are you getting out? How much in terms of percentages does it need to pull back for you to exit the trade? All of these points are incredibly important and you need to be aware of them and know the answers in advance. 

Many amateurs start trading immediately, without any preparation, only to realize how they should have learned and figured out everything before they started investing their capital. What this means is that the majority approaches trading as gamblers, not knowing what they want to achieve, how much is at stake, and how much they are willing to risk. As the first rule of trading is to protect your capital, consider the following questions:
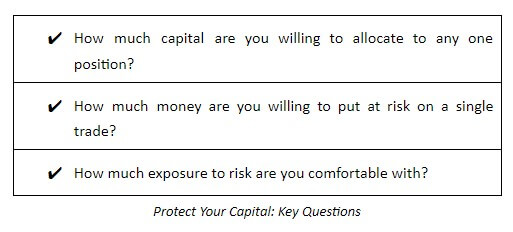
Strategies

Strategies may vary from person to person and they can, in fact, turn out to be vastly different from what other participants chose to use in trading. When creating your own array of strategies, always think of the question of when you want to enter and exit the market. It is vital that you be as specific as possible and explain to yourself every step you may take at some point. For example, some traders only trade specific circumstances such as high breakouts during some events. While this may seem like a narrow option, it is still an excellent approach because these traders clearly defined the circumstances, their goals, and their actions both for a winning and for a losing trade. Even if you wish to try something new, always make sure that you test it before you incorporate it into trading. It is all these points that your strategy list should consist of and, as long as you test everything out with your system and through your demo account, you and your finances are safe. You can also consider the checklist added below to serve you as a reminder when creating your own strategic plan.
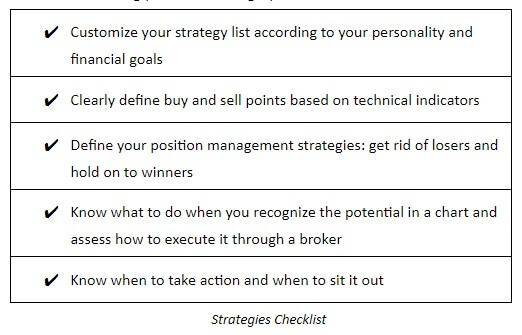
Analysis

With so much room for making mistakes, trading must be kept under close control. To achieve that level of scrutiny, each trader must keep a trading journal. Trading journals are the most effective way in which a trader can keep track of past actions and develop himself/herself. It also allows traders to learn from their mistakes and not repeat them while revealing which behaviors turned out to be beneficial in the past and should be used in the future as well. 

During this process, while you are learning from different materials, taking tests, using a simulator, developing a trading plan, and testing it all through a demo account, you still need to know what your results are. All traders need this form of analysis to know that they are going to make money before real trading begins. Keeping a journal may be the most difficult part of the process for some people, but at the same time, it is difficult to understand why anyone would want to invest real money without any preparation, backtesting, forward testing, and without realizing whether those actions can lead up to any profit. Being detailed and meticulous is a must if you desire to become a professional trader.

Trading journals are essentially Excel sheets where you enter your trades, your win/loss ratio, risk and rewards, percentage of gain, pip gain, and profit/loss ratio. These pieces of information help you know how many pips you earned this month and what your growth percentage is. Journals may differ based on what you want to keep track of – for example, you may keep different journals for a simulator and for your demo trades. 

If you happen to lack this kind of information and do not keep track of these numbers, you are not trading but gambling. However, if you know that after 100 trades, you win 55 and lose 45 of them; if you are aware of the averages you are making on both winning and losing trades and you can compare them effectively, this no longer falls under gambling. Even if your results have not reached the level of satisfaction or success you want to have while trading, by possessing this information, you are already ahead of the majority of traders who go into this business blindly. Keeping your records and tracking your progress is an immensely important topic and one of the major stepping stones to becoming a professional trader where you can independently follow your rules and system.
While we discussed a number of different aspects that make the essence of a trading profile and portfolio, understand that this is also the very foundation. You should, therefore, view today’s lessons both as one of many facets that constitute any professional trader as well as an approach to trading that makes it possible for anyone to keep trading. In order to complete our trading plans, we also need to educate ourselves on forex basics, currency pairs, and margins, and pips, thus helping ourselves understand the forex market. After we take in all the information and absorb whatever knowledge we had the chance of learning, the time for practice comes. Practice is not only about trading with a demo account but space where you have room to test yourself and see if you are ready to take on the next level. Practice is also where you should stress your tracking skills and use the time for deep analysis that will prepare the ground for the real game. The matter of fact is that, while all these processes may seem dull and too detailed, all effort will pay off the moment you start trading real money. If you desire to be on top and bear the fruit of the market, you must devote time and prepare to get out of the comfort zone. Use today’s tips and advice as practical steps you can take and as an outline on which you can base your trading plan.

Finally, remember that if you could get over your weaknesses on your own, without seeking expert advice, you would have already managed to do so by now. Understand that some faults and flaws cannot be fixed and that we go into detailed planning so as to create a trading plan that could go around those negative aspects of our personalities. See this process as the most useful way in which you can use your personality, knowledge, and skills to evade your weaknesses, stop repeating the same negative patterns, and get the most from trading in the forex market.

Categories
Forex Course

169. Which Trading Timeframe Should I Choose?

Introduction 

In the previous lesson, we covered how to trade multiple timeframes in the forex market. So, what timeframe should you choose to trade?

The timeframe you chose to trade will be entirely determined by the type of forex trader you are. Therefore, in this lesson, we will cover the timeframe to trade depending on the type of forex trader you are, i.e., position trader, swing trader, day trader, or a forex scalper. It is worth noting that you should consider trading three timeframes in Forex.

Timeframes for a Forex Position Trader

If you are a forex position trader, it means you intend to have your trading position open for several months to years. Therefore, you should trade the monthly and weekly timeframes. These frames give you a long-term perspective of the market trend while filtering out the hourly and daily “noises” of the price spikes.

Timeframes for Forex Swing Trader

For a forex swing trader, your goal is to have your positions open overnight to just a few weeks. With such a strategy, while performing your multiple timeframe analysis, you should start with the daily timeframe to establish your selected currency pair’s dominant trend.

On the chart, the daily timeframe will cover several weeks, which will help you establish the support and resistance levels over this period. With this perspective, you will quickly identify the high and low extremes. Narrow down to a 12-hour timeframe to see if this timeframe lines up with the observed trend, then finally use the 4-hour timeframe to find the entry point for your trade.

Timeframes for Forex Day Traders

If you are a forex day trader, that means you enter and exit all your trades within 24 hours. In this case, you should trade the 4-hour, 1-hour, and 15-minute timeframes. With the 4-hour timeframe, you will be able to establish the support and resistance levels for the past few days for your selected currency pair. The 1-hour timeframe will help you identify if the intra-day price trend aligns with the observed dominant trend. Finally, the 15-minute timeframe will enable you to narrow down the best entry and exit points for your trades, depending on the current price trend.

Timeframes for Forex Scalpers

For the forex scalpers, the smallest minute-by-minute price spikes count. Therefore, you should trade the 30-minute, 15-minute, and 5-minute timeframes. With the 30-minute timeframe, you get to identify the prevailing short-term trend with the selected currency pair. The 5-minute timeframe narrows down the tend to show how the most current price spikes build-up to the short-term trend. This timeframe also serves as your trigger timeframe for entry and exit.

[wp_quiz id=”89150″]
Categories
Forex Course

168. Learning To Trade Multiple Timeframes In The Forex Market

Introduction 

In our previous lesson, we discussed multiple timeframe analysis in forex means. Now, let’s find out what forex trading with multiple timeframes means. In case you are wondering, trading multiple timeframes in forex does not mean that a trader is opening several positions using different timeframes. We are not saying you can’t do this, you if you have the money; but that is not what trading with multiple timeframes in forex means.

Trading multiple timeframes in Forex means using different timeframes to establish the trend and support and resistance levels of a currency pair to determine the best point of entry and exit of a trade. Let’s use a few examples to show how trading with multiple timeframes in forex occurs.

As we had mentioned in our previous lesson, the timeframes you use for your analysis depends on which type of forex trader you are. The best way of trading multiple timeframes in the forex market is by using the top-down technique. With this approach, you first observe the longer timeframes for the general market trend, then use the smaller timeframes to establish more current trends.

Let’s take the example of a forex day trader. You will start by using the 1-hour timeframe to establish the primary market trend. Say, a day trader wants to open a position on September 9, 2020, at 11.00 AM GMT, using the 4-hour timeframe, the market shows an uptrend.

4-hour timeframe for EUR/USD

1-hour timeframe for EUR/USD

The 1-hour timeframe confirms that the pair’s intermediate trend is consistent with the uptrend observed in the 4-hour timeframe.

15-minute timeframe for EUR/USD

The 15-minute timeframe can then be used to select the best entry point.

Determining the market limits: the longer timeframes will enable you to determine the support and resistance levels of a currency pair. The resistance levels help you set your exit points while the support levels will help you timing your market entry.

Establish the trend momentum: While the larger timeframe gives you the overall market trend, the smaller timeframes will help you establish the spikes in the price of the currency pair. These spikes will help you to establish the short-term strength of the trend compared to the longer-term trend.

Helps avoid the lagging effect of some technical forex indicators: Most technical Forex indicators are lagging, meaning trend changes signaled by the indicators lags the real change in the price of the currency pair. Therefore, price-action can be said to be leading the technical indicators in the forex market.

We will cover these three reasons in detail in our subsequent lessons.

[wp_quiz id=”89146″]
Categories
Forex Course

167. Multiple Timeframe Analysis – Key to your Success

Before defining what multiple timeframe analysis is, we first need to understand what timeframe in forex means.

What is Timeframe in Forex?

In the forex market, the timeframe shows the change in a currency pair’s price over a given period. For example, a 1-minute timeframe shows how the price of a given currency pair changes minute by minute, while a 1-month timeframe shows monthly changes in the pair’s price.

No matter which trading platform you use when trading forex, there are several timeframes provided. For example, the screengrab below of an MT5 platform shows the different timeframes provided to forex traders.

Therefore, in the forex market, multiple timeframe analysis is a chart analysis technique that involves observing a currency pair’s trend under different timeframes.

Importance of Multiple Timeframe Analysis in Forex

Another type of forex trader would employ a different timeframe analysis to determine their trade entry and exit positions. Any forex trader knows that the price of a currency fluctuates continuously. Thus, the trend observed in a 1-minute timeframe will be different from the 5-minute timeframe and so forth. The table below shows different timeframes for different types of forex traders.

In timeframe analysis for forex markets, it is advisable to adopt a top-down technique. This technique involves beginning your analysis with a larger timeframe, depending on your trading style, to establish the overall price trend. Subsequent smaller timeframes then follow to show how the observed trend can be broken down to find preferable entry points.

Let’s take a forex day trader, for example. Such traders do not hold an open position overnight. Thus, for their timeframe analysis, they would start with the 8-hour timeframe, then to 4-hour the 1-hour timeframe.

With multiple timeframe analysis in forex, the larger timeframes, like the 1-month timeframes, are used to show a longer-term trend of a currency pair. In a single glance, you can see how the pair has been trading for years.

GBP/USD 1-Month Timeframe Analysis

From the above 1-month chart of the GBP/USD, you can notice the pair’s longer-term downtrend from August 2014 to August 2020. Short timeframes are ideal for showing the more recent changes in the price of a pair. Most forex traders use shorter timeframes to find opportunities to enter a trade and identify ideal exit points.

[wp_quiz id=”89128″]
Categories
Forex Course

166. Introduction To Obscure Currency Crosses & Why It Is Very Risky To Trade Them?

Introduction

Trading currency crosses an excellent way to make money from forex trading when major currency pairs do not make a good move due to the US economy’s corrective momentum. However, the US dollar is a global reserve currency of every country. Therefore, it can provide enough liquidity to make money where the obscure currency crosses have some risks due to insufficient liquidity.

What is Obscure Currency Cross?

We can find currency crosses when we eliminate the US dollar from major and commodity currencies. However, among the cross currencies, the Euro and the Japanese Yen are mostly traded. Therefore, if you trade any Euro and Yen related cross pair, you might see the price to have adequate liquidity. But, what happens if the currency cross does not have Yen or Euro?

Any cross currency pairs that do not have Japanese Yen or Euro as a first or second currency is called an Obscure currency cross. Examples of obscure currency crosses are GBPCHF, NZDCAD, AUDCHF, CADCHF, NZDCHF, NZDCAD, etc.

Why are Trading Obscure Currency Crosses Risky?

The forex market is run through a decentralized network where no one can dominate any market. Therefore, the movement of a currency pair depends on the supply and demand of that currency pair. When the supply or demand increases, the currency pair starts to move. On the other hand, when there is less volume, the currency pair may move within a correction.

The liquidity remains lower in the obscure currency pair than major, commodity, and EUR/YEN related currency pairs. Therefore, there is a risk of market volatility and correction. In some cases, obscure currency pairs consolidate for a long time, and if we take any trade on that pair, we might have to hold the trade for a considerable time.

Conclusion

In conclusion, we can say that trading obscure currency pairs have some reason to worry due to not having enough liquidity to provide a decent movement. However, it is a great way to make money from obscure currency pairs if we can read the price action well and identify the price is moving within a trend. Overall, maintaining a profitable and robust trading strategy is the key to make a consistent profit from the forex market.

[wp_quiz id=”86520″]
Categories
Forex Course

165. Knowing More About Trading The Euro & Yen Crosses

Introduction

In cross-currency trading, the Euro and Japanese Yen are the most traded currency. Therefore, after major currencies, EUR and JPY has the highest liquidity in the forex market. Overall, trading in the Euro and Yen crosses are secure compared to the other cross currencies.

Understand the European Economy

When trying to trade in any Euro cross pairs, we should understand the European economy even if we only follow technical analysis. In technical analysis, traders can make decisions based on previous price movements. Therefore, many traders think that there is no need for fundamental analysis.

However, in trading, we aim to increase the probability of our analysis. Therefore, when we add Europe’s economic condition, we will have a better outlook of trading Euro crosses like- EURCHF, EURAUD, EURNZD, etc.

The European economy consists of several countries, including France, Italy, Germany, etc. Therefore, trading in the Euro cross requires to know interest rate decisions, retail sales, employment export-import, GDP, and other economic releases of these countries.

Moreover, in Euro cross trading, we should focus on other currencies that combine with the Euro. For example, if we want to trade in the EURCHF pair, we should focus on Switzerland’s economic condition.

Understand the Japanese Economy

In Yen cross trading, we should have extensive knowledge of the Japanese economy. Japan is an export-oriented country. Therefore, it tries to depreciate its value against other major currencies by keeping the interest rate lower.

Overall, any increase in interest rate, retail sales, employment, and GDP are suitable for the Japanese economy.

Besides the Japanese economy, we need to understand the economic condition of the Japanese Yen combination. For example, trading in the CADJPY pair requires a fundamental analysis of both the Japanese and Canadian economies.

Conclusion

Overall, the Euro and Japanese Yen cross are mostly traded currency in currency crosses. Therefore, to trade Euro and Yen crosses, we should know these two countries’ economic conditions. Even if we don’t trade based on fundamental analysis, having good knowledge is essential to have an overall outlook of the economy. Cheers.

[wp_quiz id=”86515″]
Categories
Forex Course

164. Do You Know What A Synthetic Currency Pair Is?

Introduction

In institutional trading, traders usually take trades with a more significant volume, which often makes trading impossible in some currency pairs due to not having enough liquidity. Therefore, institutional traders create synthetic currency pairs to take trades on those pairs.

What is a Synthetic Currency Pair?

If an institutional trader finds a possibility of a decent upward movement of AUDJPY pair, but due to not having enough liquidity, they might be unable to take a buy trade. However, the alternative option to take the trade is to buy both AUDUSD and USDJPY as there is enough liquidity in these pairs. As a retail forex trader, we can take similar action as institutional traders. If we perform AUDUSD and USDJPY trades at the same time, we are trading in synthetic currency pairs.

In our current world, Internet connectivity makes trading easy; therefore, many brokers offer to trade currency pairs like CHFJPY or GBPNZD. However, these pairs have some issues regarding the spread and overnight fee. In some cases, cross-currency pairs like AUDCHF, GBPNZD, and CHFJPY move within a consolidation for a specified period. Therefore, trading in these pairs is costly, even if the broker allows.

How to Create Synthetic Currency Pairs?

Creating synthetic currency pairs need to open two trading entries with its margin. In synthetic currency trading, there is a common currency bought in one currency pair and sold in another currency pair. Overall, we will eliminate the common currency by buying and selling; therefore, the ultimate currency pair will remain that we are expecting to buy.

Is Synthetic Currency Pair Trading Profitable?

Trading in synthetic currency pair requires an additional margin, which is not wise to use. Moreover, in the present world, most brokers allow maximum currency pairs that reduce the hassle of trading two currency pairs at a time. Therefore, it is not recommended that traders trade in synthetic currency pairs if the broker has an option to take trades on the main currency pair.

Conclusion

Synthetic currency pair is a combination of the currency pairs where a single currency is bought in one pair and sold in another pair. In the present world, most Forex brokers allow trading cross and exotic currency pairs that eliminate the need for synthetic currency pairs. However, if any broker does not allow trading in a specific pair, we can use this method.

[wp_quiz id=”86510″]
Categories
Forex Course

163. Trading Currency Crosses Using Fundamentals

Introduction

In fundamental analysis, we can interpret two countries’ economic data of a cross-currency to predict the upcoming price movement. On the other hand, even if we ignore the US dollar, it has some shadow effect on a currency cross.

How to Trade Fundamentals with Currency Crosses

Let’s say Australia’s economic condition is good, and the Reserve Bank of Australia increased the interest rate. As a result, the primary expectation is that the AUD will be stronger against other currencies. On the other hand, we can find other currencies that are facing economic difficulties. Let’s say Eurozone is struggling, and ECB provided some dovish tone to provide an outlook of the current economic condition.

In this situation, we can evaluate the Eurozone’s economic condition and Australia to determine which country is doing well. If Australia shows a better than expected employment report, our first aim would be to buy AUDUSD. However, what happens if the USA showed a strong employment report?

Yes, AUDUSD might consolidate, and the difference between supply and demand would not change. In this situation, it is better to find other currencies that are weaker than in Australia.

Is Fundamental Trading Profitable for Currency Crosses?

In Forex trading, we predict a currency pair’s upcoming movement based on the technical and fundamental analysis. When we see that one currency has reason to become stronger than other currencies, we anticipate the price towards the stronger currency. The fundamental analysis is a process to find a stronger or weaker currency in a currency pair.

Due to having a lot of equity and market participants’ involvement, any fundamental news works well in USD related currency pairs. However, it does not mean trading currency crosses with fundamental analysis is not profitable.

We can quickly evaluate the UK and Japan’s economic conditions to identify the price direction of GBPJPY. Therefore, we can apply the same theory to every currency cross, like AUDJPY, AUDCHF, NZDCAD, or AUDNZD.

Concussion

Fundamental analysis is a process to anticipate the movement of a currency pair based on the two countries’ economic conditions. However, making an analysis ideally is the primary tool to make a profit from the forex market. Therefore, we should focus on money management, risk management, and trade management to get the ultimate trading result.
[wp_quiz id=”86506″]
Categories
Forex Course

162. Currency Crosses Are Trendier Than You Think

Introduction

Currency crosses are a combination of major and commodity currencies without the US Dollar. Therefore, it is an exciting source of earning money when the US dollar moves within a correction. However, the global economic activity has been increasing day by day, and many business activities are happening without the intervention of the US dollar that might make the cross-currency trading trendy.

Is Cross Currency Trading Profitable?

In every international transaction, the US dollar plays a vital role as it is the reserve currency of every country. Moreover, the valuation of commodities and agricultural products are made through the US dollar. Therefore, most of the trading volume in the forex market comes through the US dollar only. As a result, many traders think it is often hard to profit in trading currency pairs where there is no US dollar.

However, the real scenario is not the same. Currency crosses are an extensive way of earning money from the forex market. If the US dollar remains corrective, most US dollar-related pairs will make less movement, which would be difficult to anticipate the price for traders.
On the other hand, if the Eurozone and Australia’s economic activity moves well, the EURAUD pair will provide a decent movement without the intervention of the US dollar. Nowadays, as the businesses are expanding, cross-currency trading became profitable day by day.

Cross Currencies are Trendy

In financial market trading, portfolio diversification is an essential way to ensure maximum safety of the investment. If one trading instrument does not perform well, there are other instruments to make a profit from. It is the best way to keep the investment active even if some trading instrument is moving within a correction. Therefore, it is best to trade in cross currency pairs when the US dollar is moving within the correction.
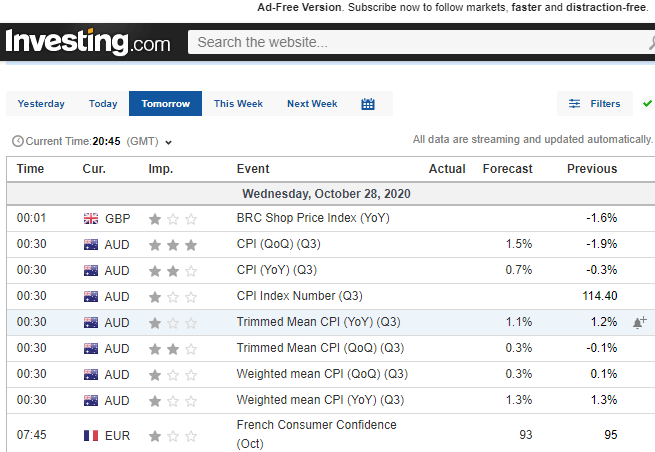
On the other hand, cross pairs do not require the US trading session every time. If our technical and fundamental analysis allows, we can profit from London and Asian trading session by any cross pairs like GBPJPY, EURAUD, etc.

Summary

In the above section, we have seen how trading in a cross pair can be profitable. Moreover, every currency pair has some unique characteristics that a trader should understand. A trading strategy’s profitability depends on how a trader is implementing the strategy with strong money management.

[wp_quiz id=”86502″]