Categories
Forex Basics

Forex Books Recommended by Professional Swing Traders

Everyone who ever desired to become successful trading in the forex market understood how relevant getting proper education is. At times, we may watch videos or listen to podcasts, while some other times we might prefer blog posts or switch to some other media outlet. What we all understand is that forms of education are numerous and that in this day and age we can enjoy the luxury of being able to find the material that suits our needs, preferences, and most importantly our personality.

The choice of books can possibly best reflect these fine differences that exist among forex traders since everyone will eventually have their personal favorite according to the degree of the storyline or the message resonates with their own intentions, experiences, and goals. Many traders put extra effort into consuming as many facts as possible, which is understandably one way to go if you want to succeed. However, if you were to recommend a book to a complete newbie, which one would it be? Also, what would you base that choice on – technical aspect, indicators, success stories, or something entirely different? Today, we are diving into the pool of forex books in an attempt to offer a different perspective as opposed to what we commonly come across in terms of education in the general forex community.

One of the first factors we need to include in the book selection process is the existence of a wide variety of trading styles. Some may be more popular, whereas some others might not be as widely advertised thus creating a minority in the forex market. If you happen to feel passionate about support and resistance lines, price action, supply and demand, or fundamental analysis, among others, then the first book we are offering as a suggestion today is possibly the best material you can find on this approach to trading. The book’s author, Greg Michalowski, defines what makes a successful trader, defining some vital steps everyone should take to become a professional in detail. You may learn about the best techniques to enter and stay in trends as well as the manner in which you can manage your position or exit any trade.

This book is the most suitable choice for individuals who are keen on trying out different time frames, as the writer claims to use even the five-minute chart. One of the most unusual strategies he recommends is to move from the five-minute chart to the hour chart only to switch to the daily chart afterward. This, however, is not always possible from all locations because in some areas, such as Vegas, for example, it would require traders to stay awake from midnight until 10 a.m. Again, if you are keen on trying out this method and if you accept to include resistance lines, moving averages, and smaller time frames in your trading, this may be an interesting experience. 

The book above is, unfortunately (or fortunately), not a good fit for those who prefer a less popular approach to trading, avoiding the majority-like decision-making and the big banks. Due to the existence of so many high-quality forex-related materials online and the general lack of materials on psychology and mindset, the following recommendation of topics will chiefly boil down to the latter. Having a trading mindset and the right attitude can profoundly alter a trader’s experience. The right book choice can move a person from suffering from a scarcity mindset to seeing abundance in every step in and out of trading experiences. Everyone is different in so many ways – from trading to living, but we can all find some common grounds where the search for materials that can help us grow and further explore our options come in place. Many people are happy with what they have got at the moment, but nobody can tell you that you cannot do better.

Books can be such eye-openers even, or especially when, they do not concern some of the most discussed topics. The problem is that many traders, and particularly those who failed countless times, assume that technical knowledge or facts about strategies and methods of trading are the only items of knowledge that one needs to possess. Such an assumption is, however, entirely faulty, as trading, especially in this market, is a very unique package that, in addition to forex-specific technical knowledge, needs to consist of money management skills and trading psychology as well. Some experts even claim to owe their levels of success to the right choice of mindset books, which is why you can at least try reading one of the books below and see the impact it may have on your personal and professional lives.

Dubbed the predecessor of all motivational books, this 1937 masterpiece is the place to start growing your mindset. Naturally, all forex traders dream of becoming wealthy, affluent individuals, who wish to stop spending long hours working behind the desk. Luckily, the book is focusing on an extensive study of people who have accumulated a lot of wealth, based on which it provides a list of key principles to live by. If you are a career-driven professional and you feel passionate about expanding your opportunities, Think and Grow rich may just open a new window in your mind. Media all around the world praises the book to the extent that it even provided scientific evidence of how some of the suggestions from the book can truly and tangibly alter your everyday life.

As a uniquely philosophical, verging on the spiritual piece, you may find it to be a light material even if you have previously never had experiences with mindset work. If you are willing to test this book out, make sure that you apply the advice consistently as some of these pieces of advice are timeless but they do require some effort on your behalf. Even if you are not really interested in psychology, you may still want to give this road a try, at least just to be sure that this is not something you truly want to be doing in your life. Even though it is an entry-level read, you will find that Think and Grow Rich can proudly enjoy its nickname.

This is such a profoundly unique piece that many different people of various backgrounds still praise it. Written in the 90s, the book was such a revelation and is still one of the most captivating reads you will ever get to experience. Some traders vigorously claim that their entire lives completely changed purely after reading Rich Dad, Poor Dad as it covers topics very few people can see at this depth and level of understanding. The book discusses a road less traveled, or a path that we are typically not taught in our households or school systems, and helps its readers to see live from an entirely different standpoint.

The mindset Robert Kiyosaki describes is exactly what a forex trader should aim to incorporate in his/her trading toolbox. If you are a beginner or an experienced trader, this book can help you feel like the potential to be the most successful trader in the world. After finishing the book, many people started seeing the world in a different light because they finally found a way to get rid of the weight of constant self-doubt and anxiety, which traders are quite prone to. Naturally, we do not always need the same advice or strategies, but you owe it to yourself to at least read the book and see whether and to what degree it affects you. Unlike anything you have ever read before, Rich Dad, Poor Dad will surely leave a mark in your lives and your trading as a result.

A natural successor of Rich Dad, Poor Dad, this book is a logical continuation for anyone who has given work hours and schedules a thought. If you are keen on changing your daily routine and ready to take on new challenges, be prepared to be astounded by some amazing facts. While the title of this piece may invoke feelings of disbelief or doubt, it does not fall short of its name. You can learn from the author’s personal experience of growing his finances from $40,000 per year and 80 hours per week to $40,000 per month and 4 hours per week. This approach is particularly important for forex traders since we, as people, tend to try to copy the same type of mindset (e.g., belief that you need to work hard to earn more money) onto trading currencies, which need not be the case.

Moreover, if you are trading long hours and cannot seem to see any difference from the previous 40+-hour week, this book will provide invaluable advice in the form of creative solutions that you can start applying today. The book’s review points to its excellent use even in times of an unpredictable economy, which is another reason why forex traders should consider this book as a creative and practical assistant. Last, as you can find some prominent forex traders who feel passionate about this book because of the changes they witnessed upon reading it, the time you will put into reading this should be viewed as a smart investment.

Another more recent mindset masterpiece, Choose Yourself, combines the lessons you could learn from the previous two books we mentioned above. The book is often described as a source of refreshment and motivation, which everyone in this market needs – be it at the beginning of a forex trading career, after a major loss, or upon spending many years trading the same way. The book is particularly good in describing how in this world full of changes the only thing we can control is ourselves. The economies, retirement plans, governments, and even our age can change, but it is the perspective we adopt that will determine the quality of experience we get to have.

Are we putting available tools to good use in the times we live in? Are we exploring any creative solutions to alter reality and generate more happiness and health? Is our internal world in accordance with the external one? Are we getting the financial rewards we believe are rightfully ours? These and many other questions are discussed in detail in Choose Yourself along with numerous practical advice which stems from a plethora of real-life case studies and interviews. If you want to learn how to let go and properly enjoy your life, James Altucher has the remedy you need.

As the name suggests, Jocko Willink’s book discusses the topics of discipline and preparedness to be patient. The author’s immeasurable quality and variety of experience have been cleverly focused in such a way that you will never feel like you are reading a mindset book alone. If you are the type of person who is not a big fan of so-called self-help books, this one will teach you something you may not learn anywhere else. We can at last read about how a well-organized and orderly style of living can bring about the positive changes we aspire to see. No longer are people told to only visualize positive outcomes or a windfall of money because now we have a clear and straightforward instruction based on what constitutes a successful person. Human beings are heavily prone to procrastination, fear, and weakness regardless of their chosen profession.

Forex traders have had the opportunity to witness the same in their lives as well. Nonetheless, the same vortexes of turning off the alarm (whether figuratively or literally) can now stop with the help of this down-to-the-point yet light read. Traders do need to adopt some healthy everyday habits and routines because it will not only help them manage their trades more peacefully and successfully but will also improve their ability to discern when they are acting upon their impulses and weaknesses instead of using skills and tools. Furthermore, if you are someone who is currently working two jobs, with forex trading being your second endeavor, this book will teach you how to achieve the level of organization that such lifestyle and level of responsibility required.

The concept of stoicism implies the endurance of any hardship and acceptance that both good and bad with all the in-between shades that exist in this world. This Greek school of thought originates from the third century BC and the book cleverly and practically covers the thought patterns that many great minds have incorporated in their daily lives to this day. Traders are often compelled to do exactly what the majority does, without feeling the right to make any changes due to the fear of being different and experiencing losses as a consequence. This book, however, will show you how it is not what is happening on the outside that you should be worried about, but your own reflection of it. This crucial idea is key for surviving and being on top of situations, such as negative news or other external events that traders inevitably face quite a few times in their careers.

In addition, through this read, Ryan Holiday will teach us to look within and discover what motivates us to take a certain action. If you are ready to really let go of some unhealthy patterns that you have been clinging to, this book will shake you to the core not leaving any stone unturned. Traders in the spot forex market can finally enjoy a book that can teach them about principles of motivation, shed light on some personality traits they may not be aware of, and, most importantly, provide a long-term strategy that will prevent compulsive reactions which are both reckless and dangerous for this type of business. Last but not least, if you decide to go on this 365-day-long journey, you will learn how to stop being concerned with the things you cannot control (e.g. elections, news, big banks, etc.) which is one of the most important lessons a forex trader should constantly bear in mind. 

One of the richest men on this planet wrote a book about the importance of understanding the relationship between cause and effect in analyzing some existing patterns in life. The book so skillfully elaborates on the topic of life principles, covering many different points that traders may at times disregard as irrelevant. Concepts such as humility and open-mindedness are dexterously combined with practical tips on how to reach the level of success you desire. Traders who mostly sit at their computers may find some ingenious lessons on people in this book as it points to the belief that all industries inevitably fall on individuals. Although the forex market appears to be made of people making individual decisions, the chart often shows how the majority acts in the same way with everyone losing their money at the same time.

The book can also help you give meaning to your every day steps and discover a new sense of peace upon making a mistake. Through this unbelievably human and humane rhetoric, Ray Dalio can inspire traders to maintain control over the progress while constantly investing in growth. Principles will easily motivate you to think of the ways in which you can adapt to some circumstances or changes. What is more, if you are an experienced trader, this book will effortlessly encourage you to keep searching for ways to improve your trading. This is another important lesson for beginners who have yet to learn how forex is an ever-changing market that requires the preparedness to keep exploring both as a routine and as a way to salvage your account. Open yourself to the potential of learning from this successful individual who managed to evolve from an everyday medium-class family to a wealth exceeding 150 billion USD and enjoy the changes you experience in your trading as a result.

As we could see from the selection above, many self-made people do not fear delving into the depths of their personalities because they understand that technical and theoretical knowledge can get them only that far. Numerous excellent books can provide these other types of information, and if you feel inclined, do take time to do additional research on the aspects of trading you personally feel passionate about. Today’s choice of materials was inspired by a story of a trader who decided to leave his well-paid job and a 70-hour week upon reading one of the books we discussed today. This individual never looked back, and as Greg Michalowski shared in one of his interviews, neither should you. The choice and the determination to trade in this market do not shield you from making (many) losses, but your attitude and your readiness to keep fighting will help you wait for the success that will result from learning.

If you are in the middle of the process of completely tuning to forex trading, rest assured that the patience of postponing your vacation times, car purchases, and other enjoyable activities other people are having at the moment to a later time will double your chances to succeed and grow your finances. The lessons that come from withstanding hardship and investing in psychology will get you to the point where you wake up feeling elevated and ready to take on the world all on your own. You will feel confident and at peace with your decisions and your daily life and proper education can only make this path quicker.

Many of the books we discussed today are seen as the reason behind some traders’ success. The knowledge and wisdom contained in these pieces are the very constituent parts of these professionals’ approaches to trading. Whatever you resonate with and incorporate in your trading, whether it is a tool or some belief, will have an impact on your trading. The more you allow yourself to accumulate, the greater your vision will be. With a comprehensive and deep overview of oneself and the market, any trader can enjoy the perks that come from trading currencies. While many materials share the same pieces of information and go into too much detail, it is your task to cover as many sources as possible and continuously employ your critical thinking and analytical skills.

Even though you will often come across some overused words and phrases, try to not limit yourself to only what is popular. In addition, you may find that even though some people do not support your choice of literature, they can still share the same values and viewpoints concerning life and work. Having written that, we do insist that learning can come in many shapes and forms. An individual who is more of an audio learning type may prefer podcasts and videos, while someone else might choose written content over anything else. Some of the main hubs for learning about the forex market nowadays are YouTube and Twitter although many websites offer coaching materials as well. Whichever path you choose, aspire to grow as an independent trader capable of making impartial decisions. Whether you choose to read books only or you make a selection of various materials and advice, this choice will reflect on your career, as it will mold you into a forex trader. The knowledge you accumulate will always interact with your personality, and together they will make your personal system or approach to trading.

If you desire to be successful, go deep in exploration of what this word means to you and how you can make daily changes to get to that place. The work you put in education and mindset will always reflect you alone and besides being an inherent task attached to one’s desire to become a forex trader, it is also an art of choosing the right puzzle pieces to create a final masterpiece. 

Categories
Forex Basic Strategies

Three Trade Duration-Based Forex Strategies

In this article, we will analyze the types of existing automated systems according to the duration of the trade. I’ll show you some interesting ideas and teach you how to apply a variety of duration-based Forex strategies. 

Scalping

Perhaps the most famous method is the so-called scalping, which many of you have already tried. These are really short-term operations. Then the second group is called swing trading, mainly using higher time frames. This is my favorite approach and trading style, I use swing strategies, automated trading systems that make transactions in longer time frames. And the third group, which I also enjoyed working with very much recently, consists of long-term strategies, mainly in daily time frames. We will also consider this group because it has its own advantages that we must not forget.

Scalping is a type of specialized trade taking profits on small price changes, usually shortly after a transaction has been entered and has become profitable. Automated scalping strategies can do dozens of operations during a day and most such trades last only a few minutes. These are very short trades and, therefore, that trading style has its own advantages and disadvantages. Let’s talk about them.

Scalping is a type of trade specializing in taking profits on small price changes, usually shortly after a transaction has been entered and has become profitable As a general rule, scalping strategies are marketed in short time frames using 1-minute candles. So the main advantage is the opportunity to make big profits in a very short time. These automated strategies can be very profitable, but at the same time very risky. Where there is great profit potential, there is also high-risk potential. And, as we said before, scalping has some huge disadvantages.

In general, automated scalping systems are potentially very risky and very sensitive to market conditions. This is because it is almost impossible to perform transactions in a one-minute time frame to simulate with historical accuracy. Then, it is not possible to elaborate an exact subsequent test. We can only backtest a strategy, how it should work in ideal conditions. However, there are situations in the market, when there may be a publication of some important macroeconomic news, for example, that the unemployment rate increased. As a result, the market makes a very strong price movement in a very short time and we may suffer a large slide, something that has not been taken into account in subsequent tests, and that will definitely worsen the results of our strategy.

Where there is great profit potential, there is also high-risk potential. So, in the world of scalping strategies, only one of those unfavorable circumstances can mean that one loss takes ten of our earnings, and this is what we can’t see in our subsequent tests. Therefore, it is very difficult to develop robust scalping strategies, and I personally do not even use them. In the past, I’ve worked with scalping strategies and gotten really good results, but at times, these were due to luck and being in the market at the right time.

The potential benefits can be really huge. However, scalping is so risky and so sensitive that it makes no sense to use it at all. I would not care too much about the complexity of developing such strategies if they are so risky. Here we see big risks that can’t be determined in advance, so if you’re just starting to operate, I don’t recommend scalping.

Swing Strategies

I recommend directing your attention to swing strategies. This is my favorite type of strategy, which is usually marketed in the H1 time frame. In 90% of cases, they will be within one hour, in exceptional cases in M15. If we want to talk about whether to use a time frame of one hour or fifteen minutes, we need to consider the type of strategy. In 90% of cases we will use a time frame of one hour, which has its own advantages, but of course some disadvantages as well.

Therefore, I have chosen it. The main advantage is that it allows you to perform longer operations. Usually, an average trade lasts about 24 hours, it can also take several days, but usually around 24 hours, and it is also one of the factors with which I am satisfied. Such trades are not as sensitive. The number of trades in a month is a maximum of 10, so such a trading style is not as expensive.

Usually, an average trade lasts about 24 hours, it may also take several days. When someone is scalping, they pay a lot of money just for commissions or for spreads. This is not the case with swing strategies, with which you only need to pay commissions for approximately 10 transactions per month. Such a fee is less important and does not have a significant impact on your account.

Of course, swing strategies are not as profitable due to the smaller number of operations that are performed in longer time frames. Therefore, a trader earns less, but with more stability. Because these strategies are not so sensitive, they are not so influenced by the unexpected news of strong market movements. For example, when publishing macroeconomic news, such as the decision of a central bank on rates, unemployment rate, GDP growth, etc. In those moments, we only risk an operation and we are not so afraid of a negative result because it is not a big problem for us. It will not result in a great loss.

Swing strategies help us deal with some difficult situations in the market, and we can also perform backtesting with more accuracy and reliability. This is the main advantage of swing strategies compared to scalping: it is easier to simulate real market conditions for backtests. These strategies, in my opinion, are the perfect combination of the number of trades and stability, and if you’re a beginner, the one-hour window is definitely a good choice.

Position Trading

The third type of strategy is position trading. In general, these are strategies for long-term positions which, in some cases, can be maintained even for a few years. Basically, they are negotiated in daily or even higher time frames. I personally operate all position strategies in the daily time frame, and sometimes very interesting situations and transactions can occur.

The main advantage is that these positioning strategies are very stable, as they are usually used to take long-term trends. To take one example, in the past, we witnessed a crash in the oil market with a price that fell steadily for more than a year, so we could be in this position for a long time.

So position trading can be very stable because we are working with strong trends. I am satisfied with the positioning strategies in the daily time frames. Another advantage is that they can be tested very accurately because economic news has an absolutely minimal impact on their overall results. In many cases, it is only in the short term impact, and from the perspective of the daily time frame, this impact is not something we should fear.

Therefore, we can perform subsequent tests with a very high level of accuracy; however, these positioning strategies generally have lower yields. This third type of strategy has the lowest gains of all these types of strategies. It is necessary to note that position trading gives gains of ten to twenty percent. However, this can be achieved with great stability and can be re-tested with precision.

In addition, these positioning strategies generally work in a wide range of markets, so they can be used to trade indices, commodities, different currency pairs, as well as some exotic currencies such as the Polish Zloty, the Swedish Krona, or the South African Rand. We can do this because it operates on long-term trends, and you can even afford to operate in exotic markets.

This would not be possible when operating in lower time frames and with a greater number of operations; however, positioning strategies are connected with a low frequency of operations and therefore the costs are lower and Therefore, even the high entry costs in trades (usually very high spreads) are secondary due to the duration of our trades.

Categories
Forex Course

171. The Best Timeframe for Forex Markets

Introduction

In our previous lesson, we looked at which timeframes you should trade in the forex market. We established that the timeframes you trade depend on the type of forex trader that you are. This lesson will cover the best timeframes to trade using illustrations depending on the type of forex trader you are.

Best Timeframe for Forex Position Trading

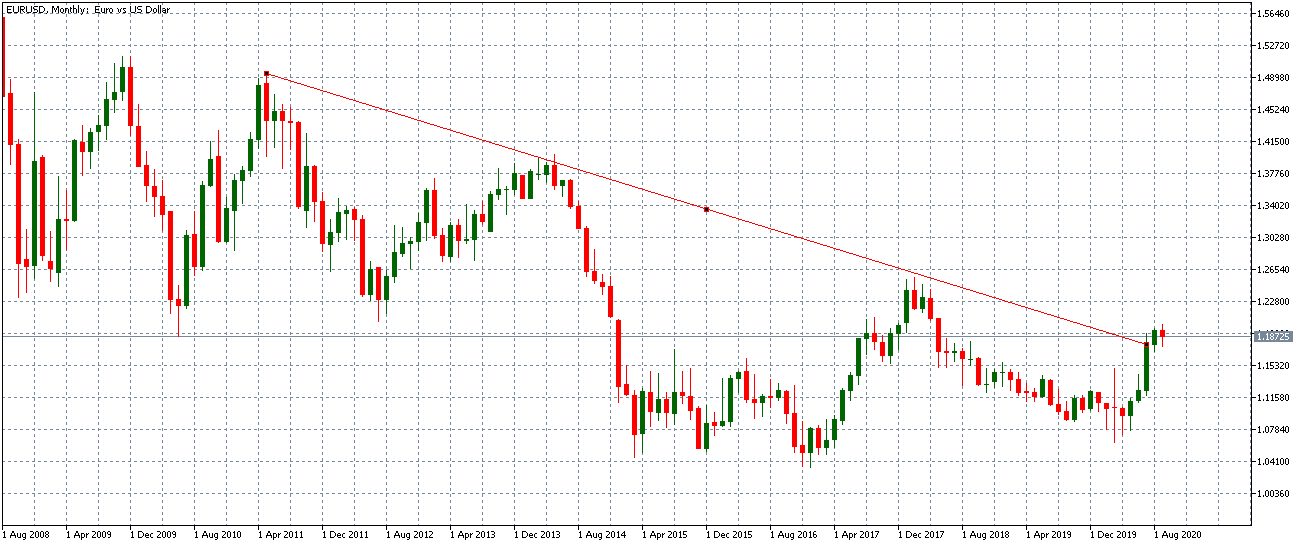
1-Month EUR/USD Primary Trend Timeframe

The monthly timeframe shows a downtrend in the pair.

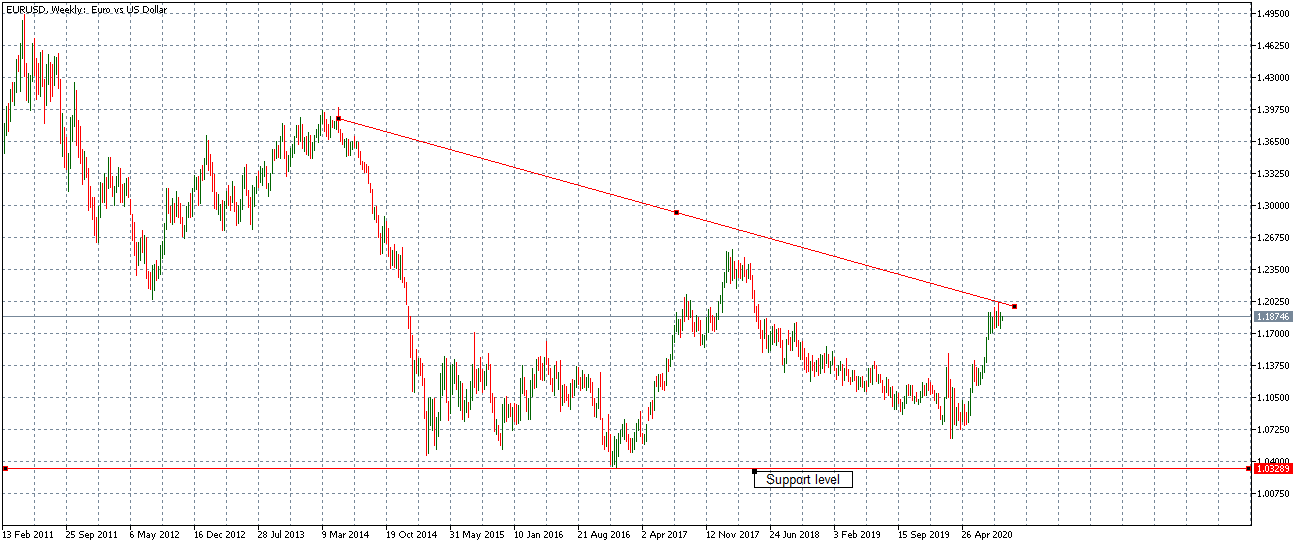
1-Week EUR/USD Trigger Timeframe

For a forex position trader, the 1-week timeframe can be used to establish the support level. This level will make the best entry point when the price trends below it.

Best Timeframe for Forex Swing Trading

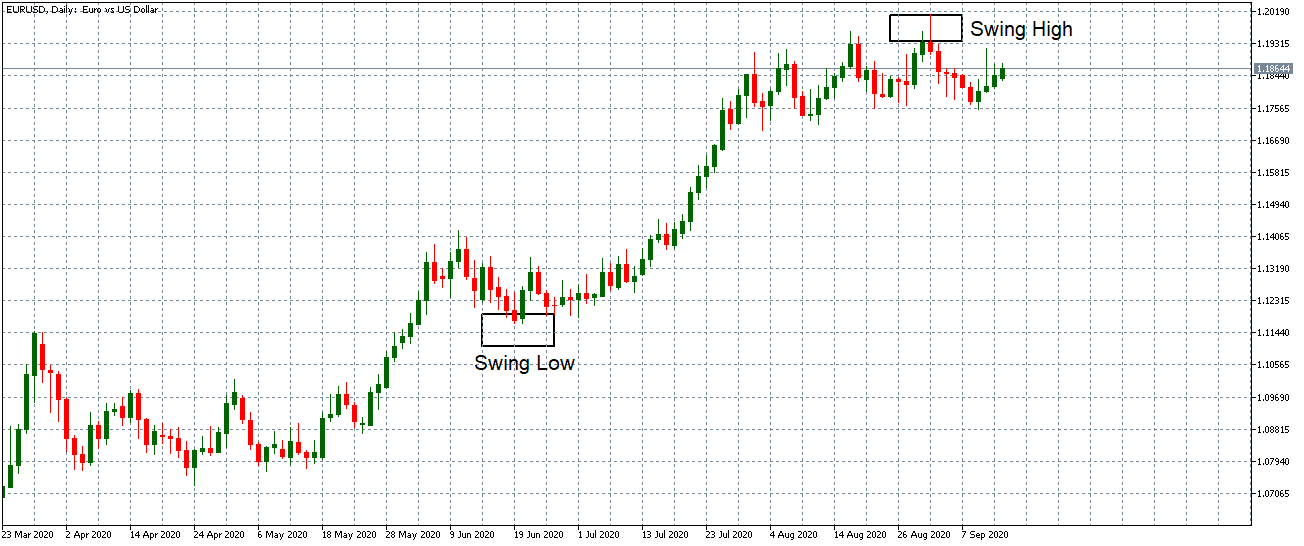
Daily EUR/USD Primary Trend Timeframe

Forex swing traders trade in the direction of the preceding trend, which in this example, is a downtrend.

4-hour EUR/USD Trigger Timeframe

For a forex swing trader, using the 4-hour timeframe is the best to identify the ideal entry and exit points.

Best Timeframe for Forex Day Trading

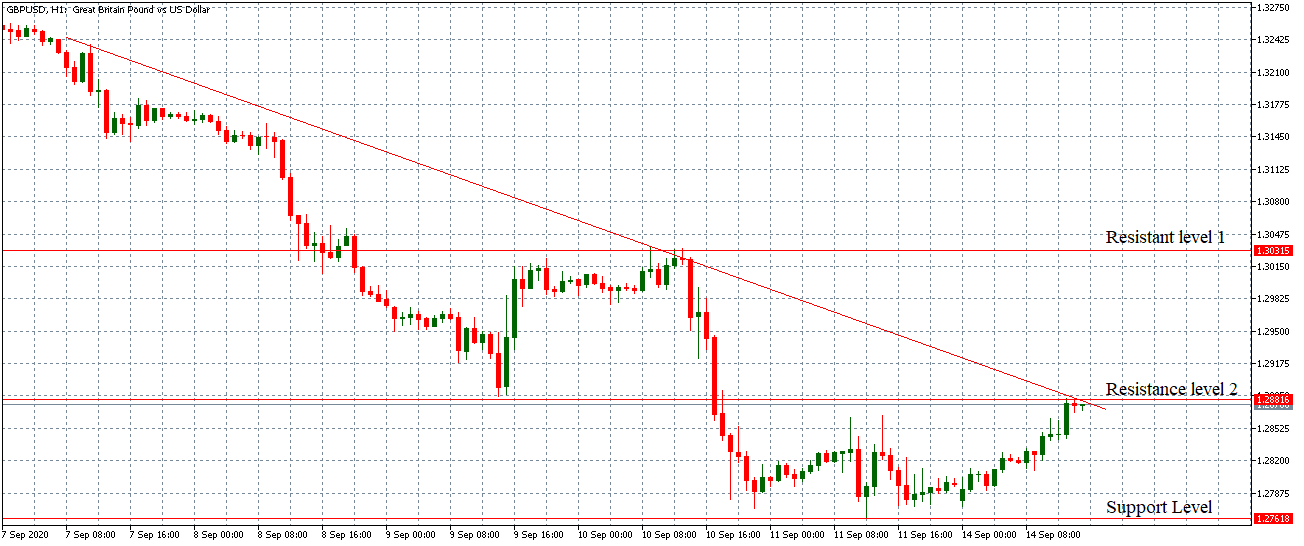
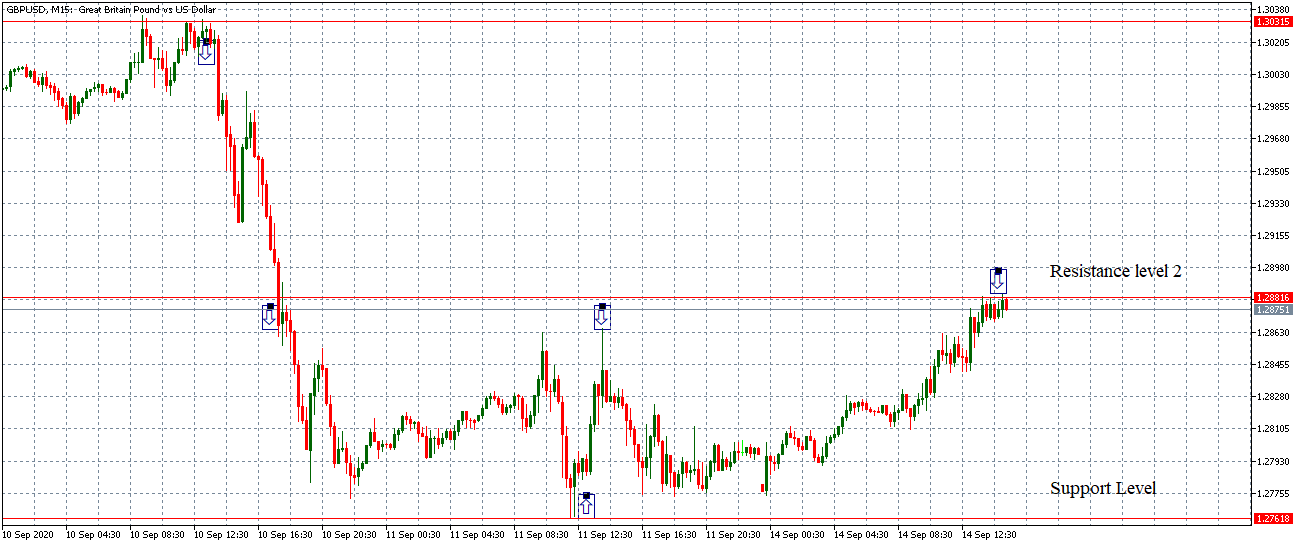
1-hour GBP/USD Primary Trend Timeframe

For a forex day trader, the dominant market trend is a downtrend. With this chart, the day trader can establish multiple support and resistance levels. The 15-minute timeframe is used to establish the best market entry positions.

15-minute GBP/USD Trigger Timeframe

With the 15-minute timeframe, multiple entries and exit points can be established.

Best Timeframe for Forex Scalping

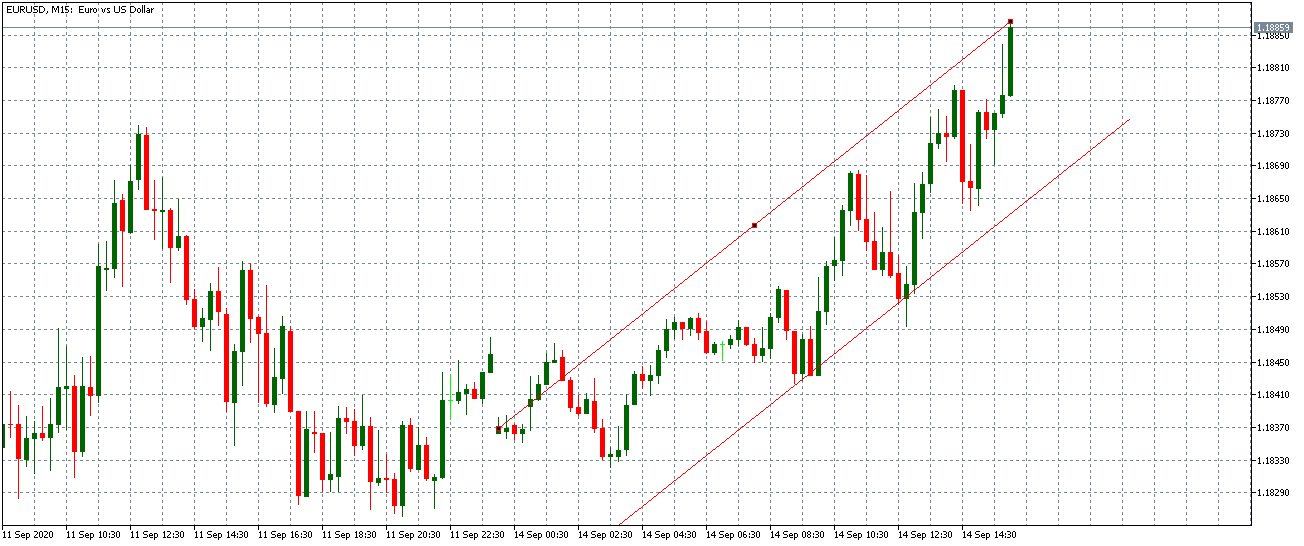
15-minute EUR/USD Primary Trend Timeframe

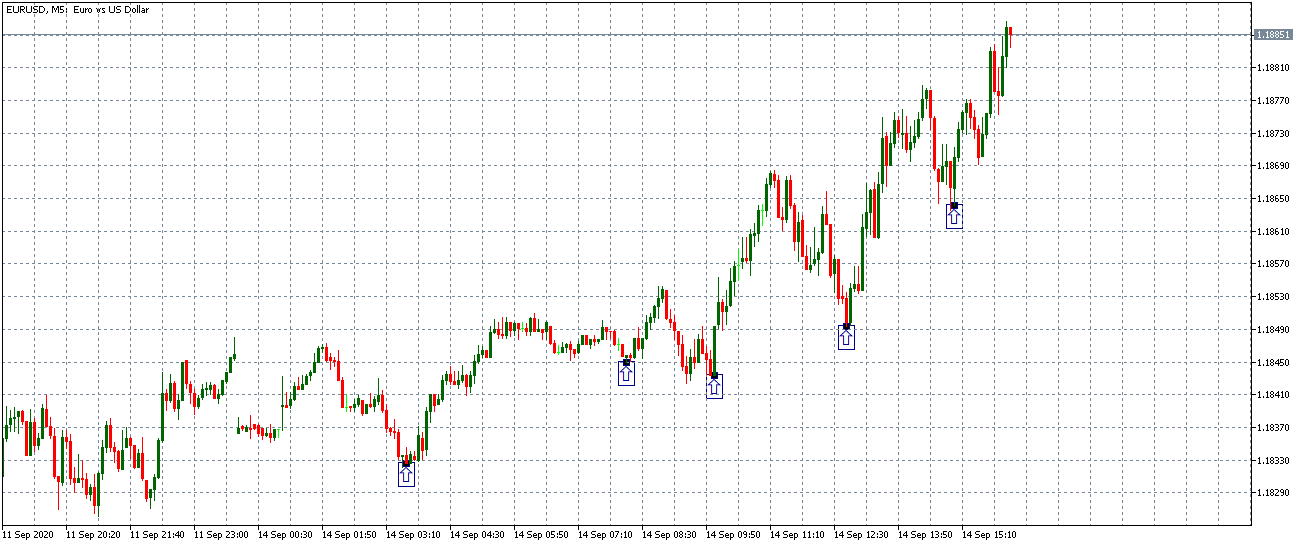
For a forex scalper, the 15-minute timeframe shows an uptrend. The 5-minute timeframe will be used to establish the best points of entry into the market.

5-minute Trigger Timeframe

The 5-minute timeframe presents the forex scalper with the best points for entry into the uptrend market.

Best Timeframe for Fundamental Forex Traders

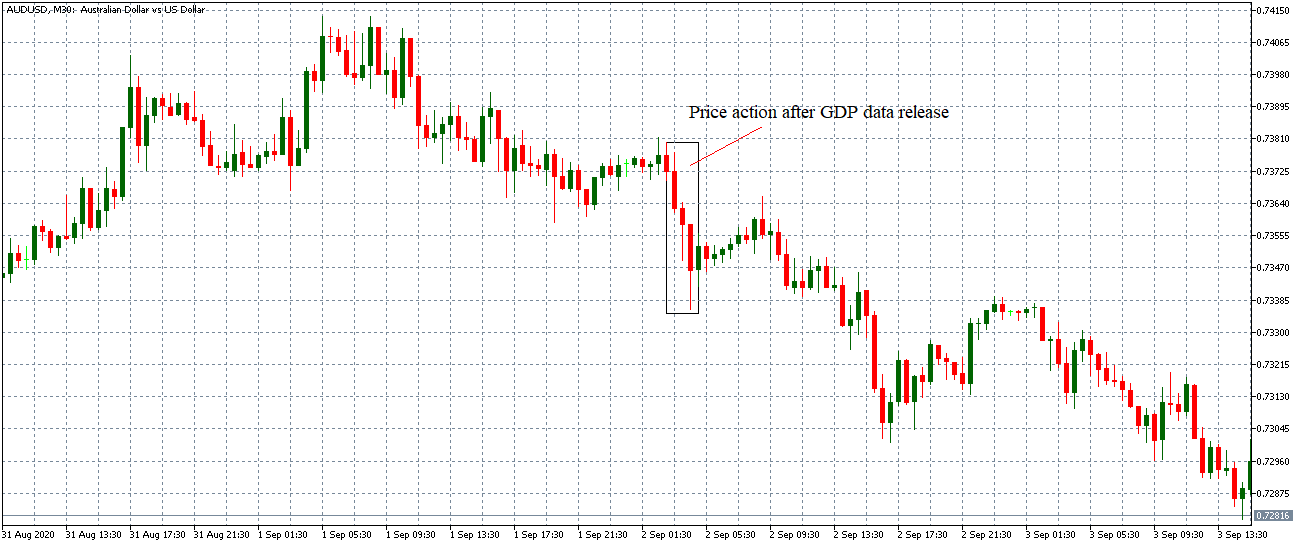
Fundamental forex traders can also use timeframe analysis to establish the magnitude and volatility resulting from the release of an economic indicator. Therefore, depending on whether the indicator is high- or low-impact, you can determine which timeframe is best to trade.

With high-impact indicators, you can trade from the 30-minute timeframe.

30-minute timeframe for Australia’s GDP data release. September 2, 2020, 1.30 AM GMT

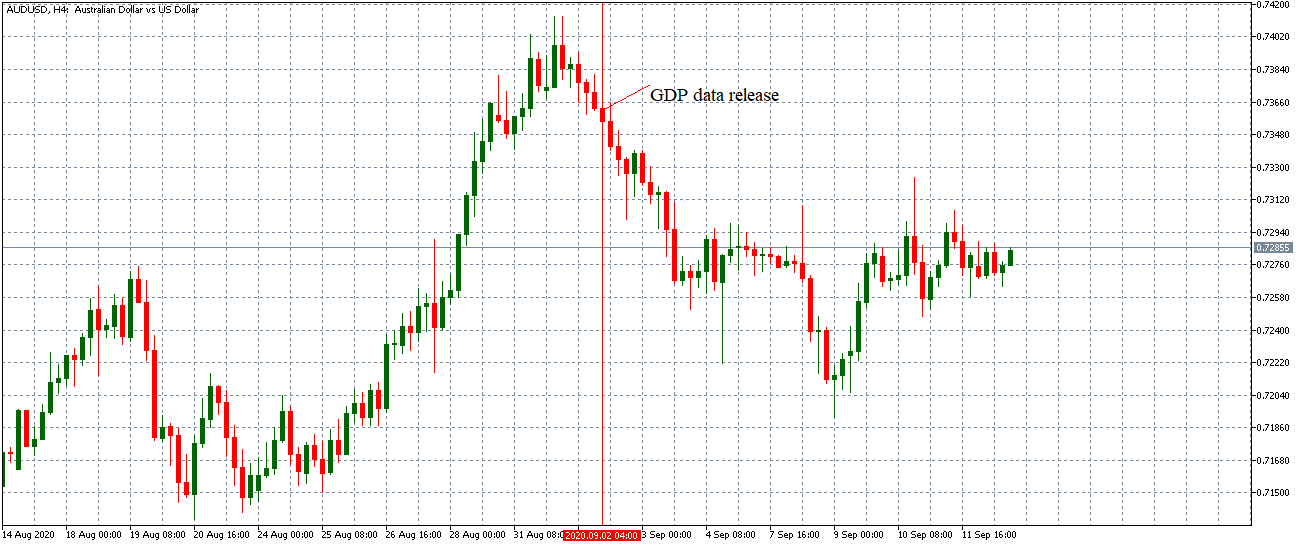
Furthermore, the price action from the release of a high-impact economic indicator can persist in the market for the long-term.

30-minute timeframe for Australia’s GDP data release. September 2, 2020, 1.30 AM GMT

The 4-hour chart shows that the AUD/USD pair continued trending downwards due to the less than expected GDP growth data.

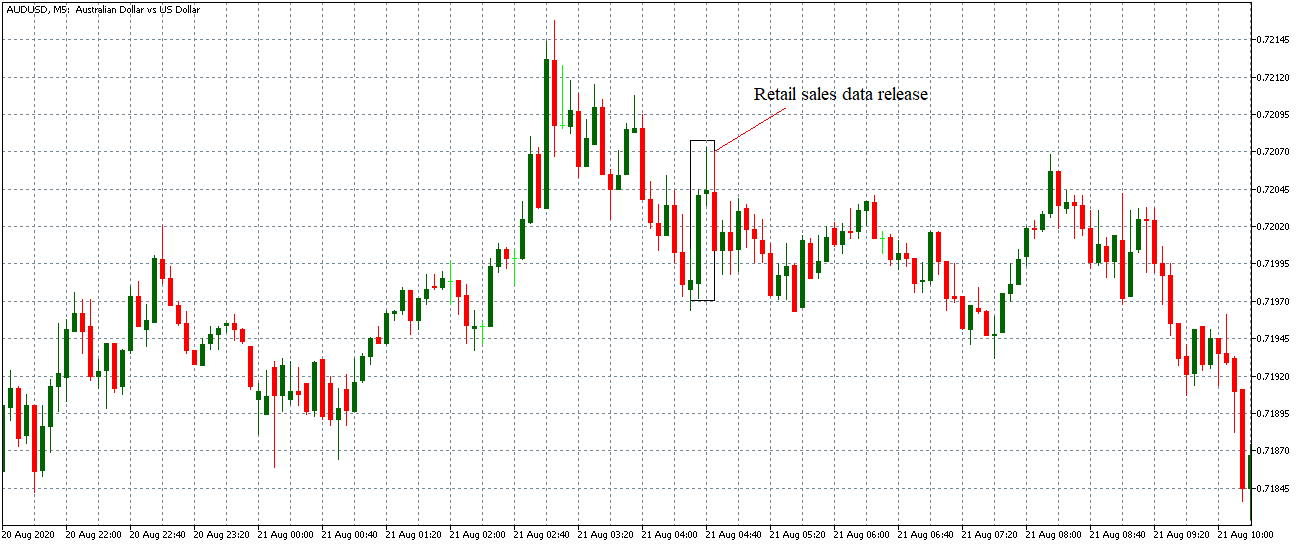
For low- to medium-impact economic indicators, it is best to trade shorter timeframes from 1-minute to 15-minutes.

5-minute timeframe for Australia’s retail sales data release. August 21, 2020, 1.30 AM GMT

At longer timeframes, the effects of these indicators on the price action dissipates.

1-hour timeframe for Australia’s retail sales data release. August 21, 2020, 1.30 AM GMT

[wp_quiz id=”89173″]
Categories
Forex Course

169. Which Trading Timeframe Should I Choose?

Introduction 

In the previous lesson, we covered how to trade multiple timeframes in the forex market. So, what timeframe should you choose to trade?

The timeframe you chose to trade will be entirely determined by the type of forex trader you are. Therefore, in this lesson, we will cover the timeframe to trade depending on the type of forex trader you are, i.e., position trader, swing trader, day trader, or a forex scalper. It is worth noting that you should consider trading three timeframes in Forex.

Timeframes for a Forex Position Trader

If you are a forex position trader, it means you intend to have your trading position open for several months to years. Therefore, you should trade the monthly and weekly timeframes. These frames give you a long-term perspective of the market trend while filtering out the hourly and daily “noises” of the price spikes.

Timeframes for Forex Swing Trader

For a forex swing trader, your goal is to have your positions open overnight to just a few weeks. With such a strategy, while performing your multiple timeframe analysis, you should start with the daily timeframe to establish your selected currency pair’s dominant trend.

On the chart, the daily timeframe will cover several weeks, which will help you establish the support and resistance levels over this period. With this perspective, you will quickly identify the high and low extremes. Narrow down to a 12-hour timeframe to see if this timeframe lines up with the observed trend, then finally use the 4-hour timeframe to find the entry point for your trade.

Timeframes for Forex Day Traders

If you are a forex day trader, that means you enter and exit all your trades within 24 hours. In this case, you should trade the 4-hour, 1-hour, and 15-minute timeframes. With the 4-hour timeframe, you will be able to establish the support and resistance levels for the past few days for your selected currency pair. The 1-hour timeframe will help you identify if the intra-day price trend aligns with the observed dominant trend. Finally, the 15-minute timeframe will enable you to narrow down the best entry and exit points for your trades, depending on the current price trend.

Timeframes for Forex Scalpers

For the forex scalpers, the smallest minute-by-minute price spikes count. Therefore, you should trade the 30-minute, 15-minute, and 5-minute timeframes. With the 30-minute timeframe, you get to identify the prevailing short-term trend with the selected currency pair. The 5-minute timeframe narrows down the tend to show how the most current price spikes build-up to the short-term trend. This timeframe also serves as your trigger timeframe for entry and exit.

[wp_quiz id=”89150″]
Categories
Forex Basic Strategies

Trading the USD/CAD Pair with Your Swing System

Forex currency movements may look random but when we take a pair, we can notice statistical characteristics. Your trading system is certainly going to have favorites, simply it will be more successful on some than with other currency pairs. Sometimes if you tweak your system based on narrow pair set backtesting, you may find other pairs are not as good. But you should aim to have a universal trading system.

We have presented a few pairs, how and why they might be great for technical swing trading systems as they have peculiarities, unlike some currency pairs that are harder to analyze due to their “ordinary” nature. USD/CAD is one such pair. The USD is the most used currency and has a lot of action moving the trends, traders commonly say it is the currency that drives the bus. This means trends on USD pairs may be suddenly interrupted, false breakouts are often and even president tweets create havoc you simply cannot predict regardless of how good your system is.

Whatsmore, big banks’ attention is on the most traded pairs, and these are, again, the USD pairs. When we mix in the CAD, the United States and Canada are neighboring economies, they have extreme similarities and some professional prop traders even dare to say CAD pairs have made more losing trades than any other major crosses. Still, your system should be profitable here too and you will make a lot of trades on this pair throughout your trading career. So, we go a bit deeper to understand this tricky pair.

In the fundamental articles, you can understand the drivers of the USD and CAD currencies separately. Economies, countries, or currencies that are close, like the AUD/NZD, EUR/GBP, and USD/CAD can be characterized as in positive correlation. Using the basket trading methods, when comparing the currency baskets, traders seek to trade negatively correlated currencies, or when they diverge in value and prioritize them for trading. If history has shown AUD and NZD are mostly positively correlated, some traders will just avoid AUD/NZD pair just based on this analysis. Yet, according to contrarian swing traders, AUD/NZD is the best performing playground for their systems.

USD/CAD pair belongs to this category. When you have economies that run together, you do not have to worry about two event sets for each economy (currency) that may break down your analysis. Also, the news and economic reports are almost copied to Canada from the US. They come out at the exact time and formulated the same way. Non-farm payrolls and employment reports almost always come out on the same day. The importance and effects of these events are widely familiar with traders.

Now, if you are trading on the daily timeframe, the USD/CAD has a “double” event for each currency in the pair on the same day. This means that one candle can be packed with activity. It is suggested that your system should have a 48 hours decision buffer before this event. This means if your system has a signal to enter a trade 2 days before the NFP report or other major event, you should just ignore it. Typically major news events effect is unpredictable, regardless if it is positive or negative for the currency. It is up to the big banks, how and when they will react to this report.

Consequently, this is uncertainty you want to avoid 24 hours before. The USD/CAD pair typically has one candle (day) of calm activity before these reports. So your system or trade will not even have a move to gain from for that day if you have a signal. This is why you should implement a 48 hours rule to avoid trading before the major event for the USD/CAD. It is unlikely your Take Profit target will be reached in one day (Wednesday) before the event. 

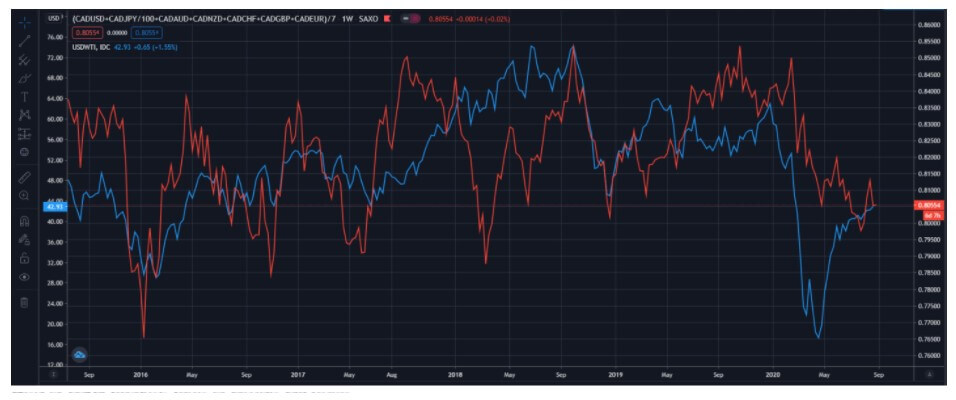
One popular research and method that attracts traders is the comparison of the Canadian Oil price with the USD/CAD. The correlation of the Oil price to the CAD can be spotted as positive. When this analysis is carried over to the USD/CAD one could see periods where it holds and other periods there is no correlation at all, be it positive or negative. 

This is easy to test, take a look at the comparison charts. If we compare years, some correlation can be found, but this is not particularly useful to traders. On lower timeframes, months, weeks, daily, correlation is nonexistent. Still, a lot of traders have read some news or articles claiming this correlation, but all you have to do is open two charts. Do this to other CAD pairs or baskets, you will find this analysis does not provide any information you can confidently use for trading.

Similar is for the AUD and Gold, correlation analysis is just not precise enough and not consistent to be useful. As technical swing traders say, you can even ignore every correlation analysis since your system should show proper signals regardless if the correlation truly exists. 

Traders that use higher timeframes than the daily can be classified as investors. They do not trade often, their trades are held for months and are just not what you would define as a forex trader. The investor analysis is heavily fundamental. Does it mean investors’ analysis cannot be applied to day traders? If you are a technical trader, you may ignore long term fundamental analysis right away, if you are open-minded, there are a few tricks some day traders use from the fundamental analysis of the CAD.

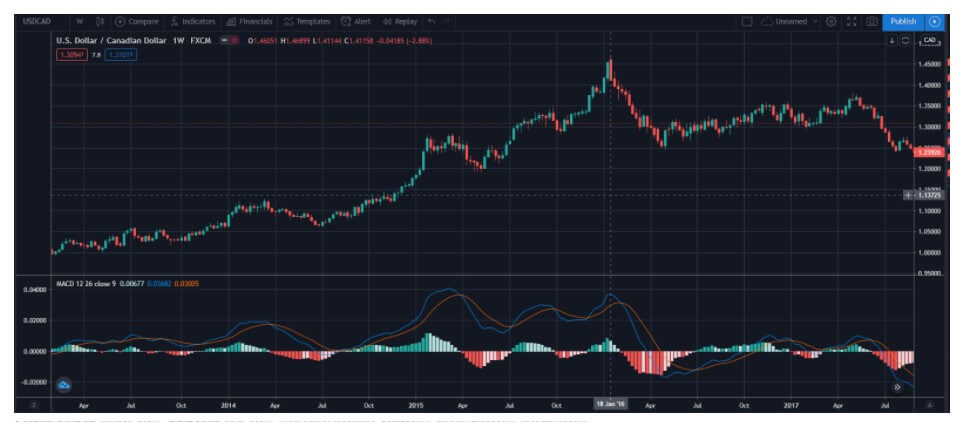
From time to time, political events on a smaller impact scale have a critical effect on a currency that just goes unnoticed. In the long term, this can cause a major trend. This trend can be seen on higher timeframes, but your system is probably not accounting for these long periods. According to some traders, movements in the direction of this major trend on the USD/CAD are sudden, extreme in volume, and are very consistent. If you remember the importance of the continuation trades or major trend resume trades, your system should ignore small corrections and take just one direction signals. These signals can be the most frequent type of swing strategy. The weekly chart is the best choice in this case for the USD/CAD, even though it is too high for usual trading. 

Take any of the trend continuation indicators from your system and plug it on weekly. Trade only aligned directions with your system on the daily timeframe and you will notice consistent good trades. After the CAD minister elections in 2015, the USD/CAD took the opposite direction, long direction. Now, regardless of your political affection, trading should not be based on your opinions, ever. If we take economic management knowledge of this particular Canada minister elected in 2015, many would agree he is not the “money guy”. Interestingly, Trump’s election pushed this trend even harder. Trump would want a weaker dollar so this idea is not very logical. However, it was not until the beginning of 2016 the USD/CAD started to correct. 

These continuation trades remained consistent as winners even today in 2020 according to professional prop traders. You can take this tip even if you are a purely technical trader and use the advantage of long term fundamentals that seem to reveal some of the best trades on a not so great currency pair to trade. 

Keep your eyes open for any fundamental analysis or events that are affecting forex in a hidden way. The combination of these and your system will be long term cooperation you will enjoy. If we take the Euro or the EU, for example, many analysts think the union is on fragile legs, any new country to join is a bad idea to them. Well, try to use this information and test it in a similar way using a higher timeframe continuation indicator. Fundamental events or opinions by the investors is not always beneficial, so you will have to test as always. Note that you should not try this right away.

First, you need to master trading the way you like, using a swing trading system or some other strategy. Only once you have consistency year after year you can seek out new markets and new exploits like this one for USD/CAD. Whatsmore, thinking outside your typical trading way could lead to a life-changing discovery. Traders do not have to just follow other experienced traders, more often than not your original research will be more effective. 

To conclude, the USD/CAD, as well as other currency pairs have hidden fundamental gems, but similarly to the popular indicator, popular analysis like the Oil/CAD correlations are not useful. There are better things not in plain sight. If everybody can see the correlations and trade the same way, know the big banks will be hunting for the majority. The example above is just one way how your trading can evolve and should evolve throughout your trading career.

Categories
Forex Trade Types

Day Trading Vs. Swing Trading: Which is Better?

Every trader might have individual goals – but we all have the same major goal at the end of the day: making a profit. There are a lot of different strategies and methods that traders use to try to accomplish this goal. Some prefer scalping, naked trading, breakout trading, using pivot points, and so on. Two of the most popular trading methods are day trading and swing trading. While traders using these methods have the shared goal of making profits, they go about this in very different ways. If you’re going to become a trader yourself, you’ll need to know about these popular strategies. 

Day Trading

Day traders make multiple trades per day, and almost always close out every single trade before the end of the day. In order to be considered a day trader, you’d need to make at least four trades per every five days. This trading style requires more attention than some other methods, with many traders becoming professional day traders in lieu of working a regular 9-5 job. This is because you need to actively monitor the market so that you can open and close your trades during the day. Day traders tend to make decisions based off of some of these factors:

  • Price discrepancies
  • Fundamentals
  • Quantitative reasons

As you can see, day traders often consider hard numbers when making decisions. If you want to be a day trader, you’re going to need an impressive account balance. In order to follow the “pattern day trader rule”, you’ll need to maintain a minimum account equity of at least $25,000 each day that you plan to trade. This is probably one of the main disadvantages of day trading, as many traders won’t be able to meet that requirement. You could always trade with less, but it may be difficult to open and close enough trades to truly be considered a day trader, or to make enough profit for a substantial living. 

Swing Trading

Swing trading is essentially the opposite of day trading. It involves buying securities and holding them for longer than a day, oftentimes for days or even weeks before selling. Many swing traders make decisions based off of:

  • Graph patterns 
  • Technical analysis (this involves looking at a price’s past history on charts)
  • Macroeconomics 

Swing traders often look to graphs and technical analysis, although some numbers and other factors can be considered as well. This type of trading doesn’t require as much time and attention as day trading, making it a better option for those that don’t have the time to monitor their trades as often. Swing trading also doesn’t require a large starting deposit, unlike with day trading. One of the downsides to choosing this method is that is can lead to overtrading and it produces less in returns than long-term buy-and-hold investors make. You’re also apt to pay more fees and commissions for holding your trades overnight. 

The Bottom Line

Should you become a day trader or swing trader? Here’s a quick summary to help pinpoint which style is right for you:

  • If you want to be a day trader, you’ll need an account balance of around $25,000. If you can’t possibly come up with this or don’t want to, swing trading is the way to go.
  • Swing traders will wind up paying more fees to their brokerage. 
  • Many day traders trade full time instead of working a regular job, as it requires your attention multiple days a week and trades must be actively monitored. Swing trading is better for those that might work a regular job or whom just don’t have that much time to spend trading in a given day.
  • Day traders typically make decisions based on numbers and fundamentals, while swing traders focus more on graphs and technical analysis. You might already have experience with one of these types of research. 

You might feel drawn to one of these methods, but if you don’t, then that’s okay too. There are a variety of other trading strategies out there and the best thing to do is to familiarize yourself with as many of them as possible. If you do decide to become a day trader or swing trader, we’d highly recommend performing a lot more online research to be sure that you completely understand how to perform the strategy successfully.

Categories
Beginners Forex Education Forex Basics

Forex Beginners: The Right Approach for a Technical Swing Trader

If you are a complete beginner considering a forex trading career, a skilled individual experienced in trading stocks, commodities, or other equities, or a dissatisfied forex trader wishing to start all over again, you are probably wondering how to embark on this journey of exploring the abundant forex market with the best possible tools and advice. Naturally, any developed market, such as the one you desire to enter, has its own set of rules and needs, and it is your task to absorb whatever available material you can get by. As you may have already noticed, forex has been extensively researched and the age of technology has made this topic only more susceptible to misinterpretation, often causing confusion and concern among the interested parties. 

Sometimes any such misperception originates from inexperienced authors sharing their faulty thinking while, in other cases, the level of clarity and precision is jeopardized because of traders trying to copy the same practices they used in some other market. As the number of individuals wondering how to set off or jump-start their forex trading careers keeps growing, this article will clearly and directly provide the basics for you to start assessing the prospects of having and growing a career as a forex trader. Most importantly, you will learn about how to choose the approach to trading currencies that have not only proven to be successful in real trading but vouched for by professional traders around the globe as well.

Some experienced traders state that they required a minimum of five years to reach the professional level of trading in this market, during which they invested not only in learning but also in testing their strategies and tools of choice. Although trading at a high level, the trading elite still made mistakes and endured periods of tough learning of how to avoid some common mistakes. These learning stages sometimes involved completely destroying traders’ accounts, endangering their finances, but also the determination to differentiate between the good and bad approach, understanding that devoting time and effort will gradually give results. 

Testing thousands of indicators and applying various pieces of advice allowed them to discover fine nuances that eventually pushed them right to the top. On this path of discovery, these traders made numerous adjustments to indicators’ settings and learned how to make necessary calculations to keep their trading in line. What is more, they also learned how not to get involved too deeply in their trades and take emotions out of the equation. Owing to the variety of these steps and the extent of their willingness and eagerness to learn and grow, professional traders managed to develop their own trading systems and commit to following their plan religiously. 

With the increased number of free and unrestricted material nowadays, you can rest assured that the odds of becoming a successful trader of currencies are higher than ever before. Nonetheless, to reach this stage and to really give yourself the chance to prosper, you will ultimately need to incorporate mindset, plan, and strategy as the key concepts which inevitably determine the level of any trader’s future success. The quantity of material you have come across so far may seem to be truly overwhelming, and not knowing how to integrate the vastness of data may hinder your development as well as increase the risk of failure. Moreover, the inability to discriminate between accurate and incorrect resources can additionally hamper your attempts to be good at trading. And, last but not least, the degree of willingness and openness to being further molded by the market will either facilitate or impede your psychological growth on your path to adopting the right mindset that trading requires. So as to help you take in and absorb as much relevant information as possible, without compromising quality, each relevant piece of information in this article is going to be disclosed in a simple and linear fashion. 

Firstly, the approach that this article advocates for is inclined towards the use of indicators, as opposed to price action or naked chart trading. People’s choice of indicators will undoubtedly determine the quality of their trading experience, and the financial reward as well, which is why a portion of traders who did not choose well in the past vehemently objects to the use of these tools. Some of the most prosperous participants in this market developed highly successful systems based on the use of indicators, which further proves the point that your selection of indicators requires special attention due to which it will lead to lucrative outcomes. Any good approach to trading in this market should heavily address the topic of trading psychology that should embody the essence of every endeavor to trade in this market. 

It is so vitally important that traders grasp which traits and abilities constitute a good forex trader because the more recognition you give to this matter, the healthier and more sustainable your trading will be. By relying on the right approach to trading, you will additionally discover how, together with a suitable mindset, proper money management also forms the foundation for lasting success and is one of the crucial elements each trader needs every step of the way. Although these topics are not discussed by many, the failure to adopt the right mindset and the lack of money management skills are certainly the most common reasons why traders get disappointed and are pushed to stop trading, which is why these topics must be part of any desirable type of approach. 

Approaches to trading may differ significantly and this does not reflect the belief that necessarily only one method is good. You should always feel encouraged to keep searching for tools and tactics to fulfill their own needs and goals, but different people can have varying degrees of acceptability. Moreover, we cannot expect to assign equal significance to the same factors as other traders do. While on the surface you may find different sources to support seemingly identical values, once you dig deeper you will see how any existing differences also entail the difference in what they prioritize or hold as relevant. With the help of the general guidance provided in this article, you should be on the lookout for the system which will help you to manage your time and enjoy your day without having to sacrifice your freedom for money. You will thus increase your effectiveness without having to work long hours by default or put excessive amounts of energy into trading. 

Such an approach will also help you reduce the number of mistakes you are making, which are often caused by highly conflicting or even downright inapplicable advice. Even if you are using the best indicators that are specifically developed for trading currencies, although this is quite often fertile ground for improvement in this regard, making the same mistakes repetitively will keep pulling you back. Unless you differentiate right from wrong, you may never achieve the level of expertise even after investing great amounts of time and energy, and the approach you choose to use should be able to provide you with such assistance. What such an approach does, in comparison to the majority of others, is to offer you a self-sustaining system where you will need to put in very little effort to see tangible results. 

As you can see, by implementing the tips we reveal here, you will reap numerous benefits and the only precondition is that you invest in learning before you really start trading. Having to trade for approximately a quarter an hour a day from the moment you acquire knowledge onwards probably seems like a fair deal and, what is more, you are always advised to run demo trades to confirm the efficacy and efficiency of the tips you come across. After you discover a system like this one, you will feel confident enough to put your emotions aside, knowing that you no longer depend on the hours you invest, but precisely on this system that you have previously developed through learning. Besides learning beforehand, you should also bear in mind that an approach like this is not intended to serve as a quick solution for impatient individuals wanting to amass a fortune overnight. Such an approach, in fact, does not rely on luck and, therefore, does not advise traders to follow sources that disclose signals. 

People who are ready to take time to learn and are eager to explore whatever advice is offered to them are the ones who will benefit the most from this article. Compared to the time when forex was an entirely new market and there were no available materials and resources to turn to, traders had to learn how to develop such a system the hard way. As a result of the tips provided here, you will be able to come by a genuinely amazing functioning set of rules and tools you can use to build up your own algorithm and strategy, which are compulsory for growing your forex trading account

The first step for every beginner in this market is learning how to trade. Some of the best websites, blogs, podcasts, and YouTube channels will not assist you in understanding the key trading/financial/investment terminology, so you will have to devote some time before to study what terms such as pip or trend line stand for. Understanding how this market functions is equally essential, if not even more so, for the traders who are coming from other markets, such as the crypto market, because they often wrongly assume that the same strategies and tools are applied just because both markets revolve around the topic of trading. This assumption is often the reason why the rate of failure is so staggeringly high among these cross-overs, causing them to give up almost at the very beginning. 

Learning is hence the number one step in even attempting to take up trading in the forex market not only because of its specific mechanics but also because knowing the basics will help you construct a system you will then be able to use forever. After learning about core concepts, some of the most important topics you should also focus on include money management, trading psychology, and technical analysis. However, whatever you read, watch, or listen, always strive to fully understand why forex trading requires a unique approach and this will shorten the time your learning will require, help you opt for the right tools, and prepare you for the challenges that trading in the forex market imposes.

While the number of tips offered here may still be very high, you are advised to use a notebook/laptop and start documenting all pieces of information that you find useful. Remember to always think of forex trading from the perspective of indicators and, most importantly, trends because such an approach will lead to sustainable results. In order to maintain success and prosperity, you will also need to set up and keep improving your own toolbox as it will make the algorithm you will use in your trading. While searching for advice on how to develop your own approach to trading, make sure that you understand what this system should comprise. 

Always test whatever information you come across and, once you feel like you have found the right indicator or strategy, strive to use it consistently until something better comes along. Maintain a level of curiosity because it will keep you active and prevent you from failing to see some innovative and creative solutions to existing problems. In addition, give yourself the freedom to adjust and accommodate anything you use in trading if you feel that you could gain more success after some improvement. Last but not least, practice being patient because this characteristic will allow you to stay positive, preserve your mental health, and prevent you from endangering some long trade just because you cannot wait to see the end results. All in all, you now know that successful forex traders worldwide always invest in knowledge and tools to design the best possible strategy and algorithm, and you are thus ready to set sail and continue exploring this market to reach mastery.

Categories
Forex Trade Types

Daily Time Frame Swing Trading Specifics

According to one theory and testing results done by professional traders, the daily chart is the best time frame to trade forex. We intend to try to make as much money as we can for the shortest period of time. Some like to trade not more than 20 minutes a day because they believe in prosperity and freedom. We are choosing to have a well-balanced life and trading carrier alongside other segments of life. You should not strive to be like other people, don’t believe in progress that is supported by any kind of chemical stimulants or long over-caffeinating marathon trade sessions. A group of traders’ long experience and testing out different time frames has concluded that everything works better and much more accurate on the daily time frame. The news events matter a lot less to us and the daily frame allows us to have a bigger perspective of the market. We are choosing not to be slaves to the market. Most importantly, trading forex like this we’re simply making the highest returns possible.

How valuable is our own time? According to the daily timeframe method, we trade the daily chart at 1:40 PM Pacific standard time which is 20 minutes before the close of the daily candle. Making trades at this time is surely not feasible for everyone. For most people in the US who have access to a computer and don’t have jobs that run over this time could be easy to do trades. It is easy typically for people in Europe because it’s right about when people usually go to bed. In places like Australia and Japan, it’s pretty bright and early in the morning so it could be a certain routine to do. In India, people would be sleeping at this time far more often. For those people, it might be very difficult to trade at that time. Depends on the part of the globe, it could be irritating if somebody already has a promising system that works but he can’t endure trading because he can’t really find the best time frame for him. We shouldn’t despair.

We all have the option to approach however we want. There is just going to be times when somebody cannot trade at this 1:40 PM Pacific time. What some of you could try is to be as closest as you can to this Pacific time. The goal should be to gather as much as we possibly can data on that daily candle if we want to reach our indicators properly. After 1:40 PM Pacific, we should have enough data to do trades because we will have almost completed the daily candle to work with. We strongly advise aiming for this strategy. Just to remember that the hour that follows the close of the daily candle is a terrible hour to trade because spreads shoot way up, so we should avoid that hour. But as soon as the Asian session opens right around 3 PM Pacific time the spreads typically go back down to normal. We don’t want to pay attention to that little tinny candle that is just starting and if we are reading our indicators we need to go back to the previous candle. We want to see a candle closed because that’s the way to collect all the data we need. What should we do is read all of our indicators one candle back.

Going further, there is going to be times whereby the time we get a chance to start our trading that price is going to have gotten better or worse than it was back when that daily candle had closed. For example, if we are aiming a long set up in GBP/USD and the candle has closed. It’s two hours later and we’re getting ready to make trades. If the price has gone any down, that is good for us. We could be into the discount and we might get in that trade with confidence. This part is easy. However, let’s say that the GBP/USD since the close of the daily candle has gone 20 pips to the long side. Now we’ll be getting it at 20 pips worse than we would off if we were able to trade a couple of hours earlier when that candle was closing. Here we might be stuck with a bad and a good decision.

Back when the daily candle had closed and triggered all of our indicators and say: ‘OK, we need to go long’. That was our system telling us that we have the ideal price for us to be going long. It is there to tell us the best possible moment to go long or short on any given currency pair. If our system is telling us to go long and the price has already gone 20 pips, we are practically no longer getting the best of it. Best of it was 20 pips ago. The value we once had, has now gone. And so just simply moving straight away and taking one of these trades anyway we might call the fear of missing the trade. Here is important to develop a discipline of not take trades like that anymore. We have one more example, let’s say that the ATR of GBP/USD is 80 pips and is also our take profit point if we would have taken that trade right where the candle was closed, our profit would be 80 pips away. But now technically it is 100 pips away. The price might get to the 80 but it might not get to the 100.

So what happened? We turned a winning trade into a possible non-winning trade. In the end, math could not be in our favor so we might lose more than we win. Turning winning trades into non-winning trades can be a big disadvantage that we need to learn to avoid. But if we understand the concept of a long game and if we are disciplined, we might understand the value we are losing every time we act adventurous. One more approach that we might consider should be to use market orders, it means when we like some price where it stands we are going to tell our market broker to put us in. We recommend market orders as an option to trade if you are not into price levels methods, you have nothing to wait for, just pull the trigger and wait for tomorrow. One more thing that we shouldn’t forget is to set our limit order back to where the price was when that candle closed, in the hopes that price will come back to that level and trigger the order and get us in at the price we were supposed to get in the first place.

If we trade this way we could potentially get all our value back. If the price does not hit our limit order by the same time the next day we should get rid of it or we can set it to cancel by itself on some platforms using the GTD order. This might be a little advanced way around for some people but it’s worth trying. What we want to develop here is the discipline of not taking some trades that are 20,30 or more pips worse than it should have been. We need to build our systems thoroughly and we need to let them work for us. According to professional traders, other people who are in the position to trade 5 or 6 hours before 1:40 Pacific time just don’t have enough data to work with and make decisions. Because of this you guys should make an effort and try to trade in a more friendly time frame. Whichever route you chose to take we wish you all the best. Good things are bound to happen.

Categories
Beginners Forex Education Forex Trade Types

Trader’s Guide to MACD Swing Trading

It is common knowledge that traders rely on indicators to trade in the fiat market and the fact that they are so widely used nowadays also goes along with the number of types and varieties of indicators traders have at their disposal. Among thousands of available options, some seem to have caught the attention of quite a few traders, and today we are going to dive into the topic of Moving Average Convergence/Divergence indicator, or MACD in short, which is a very common tool that forex traders use to follow trends, and learn the secret to earning a secure profit.

Generally praised for its diverse functions, this indicator may easily enchant you with what it offers. Nonetheless, as the existence of MACD’s different versions is often concealed, further obscured by the craze for its alleged abilities documented by various sources, we need to be careful not to get confused. This may, in fact, as well serve as good grounds for finally differentiating between quality and quantity, despite the indicator’s worldwide popularity. If we compare it to another tool we all know of, such as the Swiss army knife, we can immediately come to the conclusion that the bigger is not always the better. The parts that make this multi-tool simply do not reflect any fine quality and, what is more, they frequently fail to achieve their intended purpose, which in this case is to cut, open bottles, and file nails, among others. Compared to other single-purpose tools that efficiently and effectively fulfill these intentions, we cannot but recognize the correlations with the MACD indicator.

If you are wondering whether there is anything positive about this indicator, the answer is yes. As a matter of fact, although not all of its functions appear to serve a greater cause in this line of business, one of them is said to have rendered such a vast number of pips and provided many lucrative trades to various professional traders. However, before determining its most valuable sides, let us first propose a definition and classify it in terms of indicator types: MACD is essentially a two-line indicator based on the principle that once one line crosses the other, traders get the information to go either short or long. This tool is also known for its zero line, which sends out an important signal when the other lines cross over. Most people tend to use it because they can do reversals, which is unfortunately a major stumbling block in building one’s account as well as the opposite of using this indicator’s full potential. On the bright side, MACD also lets its users follow trends, helping traders to see which direction a trend will take. Regardless of this unique trait where both trend trading and reversal trading are made possible, there are still a few more questions requiring additional analysis.

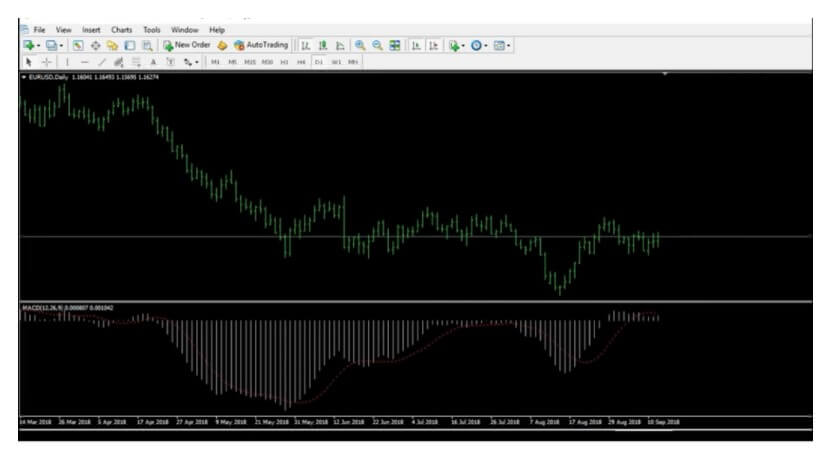
One of the gray areas when it comes to using MACD certainly involves the question of whether this indicator uses a simple moving average (SMA) or an exponential moving average (EMA) for determining lines. Aside from the fact is that both of the two variations exist, traders can also use MT4’s MACD version presented in the image below, which a number of traders criticize for its impractical appearance. Again, traders across the world may have very distinct ideas of how this indicator looks like precisely because there are so many different variations out there. Considering the fact that MACD was initially developed in the 1970s for the purpose of trading stocks, this indicator’s original version cannot fully support the needs of the forex market. Nevertheless, some of the more recent variations were developed specifically for trading currencies, and, in the end, it is the traders’ choice which version they are going to use, be it is an SMA or an EMA one.

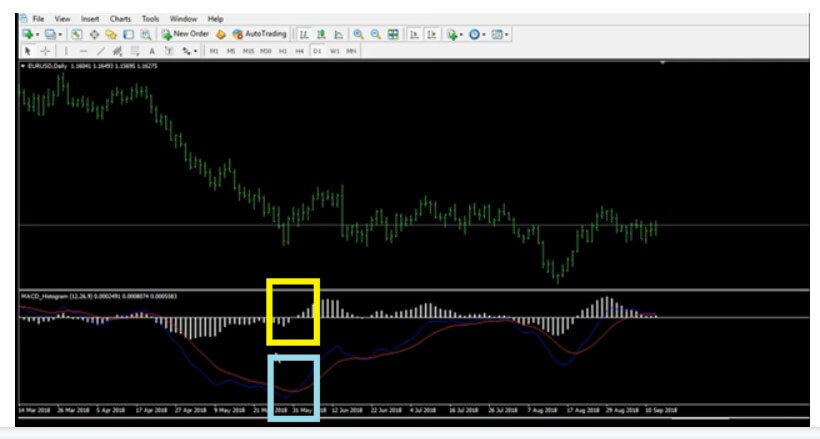
Another of the commonly asked questions revolves around histogram (the white vertical lines in the image below) that some professional traders consider as not very functional and useful. Although some traders may certainly make good use of it, histogram actually serves to indicate that the zero line has been crossed when it moves from the positive to the negative, something anyone can see by focusing on the place where the blue line crosses the red one (compare the yellow and the light blue rectangle in the following image). With the ability to remove histograms in some versions, it still does not seem to be the main reason why most traders use this indicator.

As we mentioned before, the preference of those using this indicator is to trade reversals rather than trends, which should not be your goal in trading currencies at all. Despite MACD’s ability to signal some very good trends when the zero line is crossed, we are safe to say that there may be some other apt indicators with the ability to provide equally, if not more, useful information. It is precisely the option to display both the two-line cross and the zero-line cross at the same time that traders should be interested in while searching for the right indicator. Bearing in mind the fact that there are quite a few of such tools similar to MACD, you should strive to find the one you would like to use because it will offer highly accurate signals and thus help you achieve substantial results.

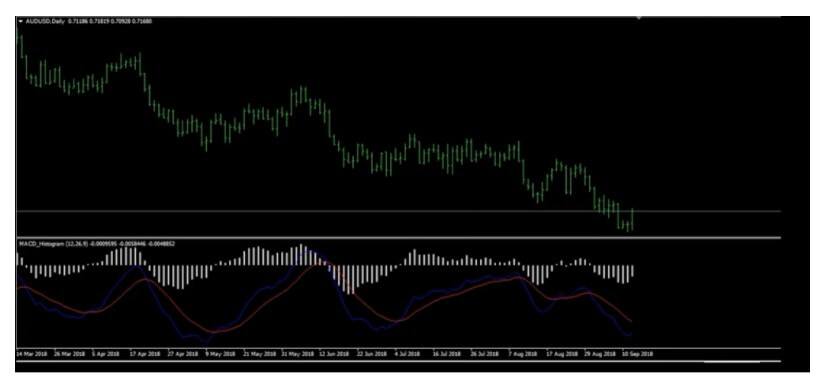
If you look at the image below, you will see the AUD/USD daily chart using the same indicator. However, instead of focusing on the several spots where the red and blue lines cross each other as many traders do, you should actually focus on all the places where the two lines are either above or below the zero line, closely watching that both lines ore on the same side. This is important because, to get the maximum result, you will want to look for some specific information: as, for example, the two lines below the zero line indicate a downtrend, you will be looking for the place where the two lines cross again going downward. If the two lines are above the zero line, you will be naturally looking for the up signals. This approach implies that traders are not calling reversals, but following trends, and what your next step should be is to assess at which point in the chart you can earn the greatest number of pips (with the 100-pip range as your goal), making sure that you pay attention to all the places where the two lines are found on the opposite sides of the zero line.

While MACD can certainly offer this information where you can open continuation trades following the existing trend, you may be better off with some other indicator that can provide the same information. The main rule to follow with any such indicator is to have both lines above zero to be able to go long, ensuring that they have not crossed down at any point, with the opposite being true if you desire to go short. What this does is grants traders the luxury of actually following the existing trending, without the hustle of calling reversals and hoping to get a win somewhere down the line. This tool along with this piece of advice is what helped a number of professional traders become successful because this way you have a real chance to earn a profit. Finally, if you discover an indicator that comes close to your needs and preferences, you can always adjust the settings, rather than use the MACD indicator, and start making some of your biggest trades.

Categories
Beginners Forex Education Forex Trade Types

Swing Trading: Pros and Cons

Swing trading is a type of trading style that involves opening a position and leaving it open for days or weeks so that profits can accumulate. This style is essentially the opposite of day trading, where traders open multiple positions per day and close them before the end of the trading day. Swing trading is seen as one of the most popular trading styles and has unique benefits and a few disadvantages that traders should consider. We’ll start with the positives:

PROS

Swing trading does not require your constant attention and allows traders to have a lot more free time than day trading. Once you’ve opened your position, you won’t have to constantly monitor the market. It’s even possible to work a full-time job if you choose this strategy and you aren’t as likely to suffer from burnout as you are with a more time-consuming trading style.

The holding period for trades is longer, meaning that less time is spent searching for trades to enter.

Returns for this type of trading style are usually around 5% – 10%, as long as you are using a good strategy and are fairly knowledgeable about trading.

CONS

Swing trading is risky and can lead to large losses if the market goes against you. If your trade is made in the opposite direction and the market opens with gaps up or gaps down, it can lead you to lose a lot, and even stop losses don’t protect against this problem.

Most brokers charge fees for holding positions overnight and this can really get expensive if you have multiple positions open for days or weeks. Triple swaps are another problem, as they are often charged on Wednesdays to account for the upcoming weekend.

You need to invest a lot of time into learning about the market, especially surrounding technical analysis. You’ll need to be able to read charts, use technical indicators, and so on. Of course, you need a good knowledge of the market in general, but this is still worth pointing out.

The Bottom Line

The pros and cons of swing trading seem to even out, although there’s a lot to consider before you take up this trading style. You need to spend a lot of time learning about the market for starters, and you’ll need a good understanding of technical analysis and need to know how to read charts and use indicators. The bright side is that this style can provide good returns and it doesn’t require you to be glued to your computer screen all hours of the day, so burnout from boredom is less likely. On the downside, losses will occur and can be large if the market goes against you. You’ll also need to pay attention to how much your broker charges for holding positions overnight and when/if triple swaps are charged.

Categories
Forex Forex Risk Management

Swing Trading ATR Risk Management Guide

Risk is essentially one of the crucial factors which have the power to endanger your entire forex trading career. Understanding how poor judgment and unsafe decision-making can impact individual accounts is key for all traders, be they at the beginning of their trading experience, or be they professionals. Because of the topic’s profound importance, this article will also discuss how each trader should address limits or at what point they should stop investing more money. Besides stressing the need for developing a wise and safe approach, we are going to provide practical advice on how to use the ATR indicator in order to assess risk levels in your trading and help you analyze how much pip value you should use in every trade. In addition, you will find out how many trades should be open at the same time as well as discover a comprehensive list of instructions that will save you from overlooking any high-risk aspects of swing type trading in the fiat market.

Processional traders often point out the importance of creating a detailed plan which naturally includes thorough risk assessment. A great number of traders nowadays appear to be focused on trade entries alone, which repeatedly leads to one of the three outcomes – a severe money loss, a break-even, or a barely significant gain. Such an approach neither allows these traders to grow their trading skills and reach the expert level nor does it help them build their finances as they imagined at first. Therefore, to prevent yourself from making the very same mistake as the majority of traders who experienced the above-mentioned scenarios, you need to take an entirely different approach to swing trading and invest in learning about the steps successful traders take to maintain their trading expertise and financial abundance.

Before proceeding to what makes a successful trader, let us first examine the choices that can hinder a forex trading career. Primarily, most of those who fail at forex either do not have a set risk or they opted for a random number without any prior logical analysis. The risk involved in trading is, in this case, a rather loose category as it depends on how traders feel, whether the previous trade was successful, upcoming news events, and other transient factors. To make matters even worse, this group of traders frequently does not stop after a loss, but they continue on to chase another win, thus entering a vicious circle of illogical thinking, occasional wins, and great losses.

When a trader does not include risk in trading, this individual inevitably imperils his/her account. We often see how a trader loses 20% of their account and believes that immediate return to the initial break-even point is possible. This, however, is highly unlikely considering the fact that such percentage equals some of the most successful traders’ average annual return. Bearing in mind the factors that led them to this stage, the probability of these traders suddenly becoming that good is very low. Unfortunately, despite it being a very common scenario, this challenge is one of the most difficult to surpass. Therefore, if your value dropped by half, from 50 to 25 thousand USD for example, you would actually need a 100% return just to get to your break-even, which is very much impossible at this point.

In case you are facing a similar problem, the best step you can take is to withdraw from trading, start all over again, and learn more about this market. This is such a specific situation and such an important signal that some traders should consider moving on to some other markets or businesses. Having this outcome directly indicates that a trader has not developed the necessary mindset which this particular market requires. Both reckless trading and the timid one may equally endanger your account because the risk can never be too high or too low in the forex market. Even if you managed to increase your account by 4% in a single year, it would still not be good enough if you had to go at great lengths to achieve this. Traders need to find that right balance and also think of some other factors, such as time, effort, and profitability, because there may be a safe but much easier, faster, and more lucrative way to seeing your finances grow.
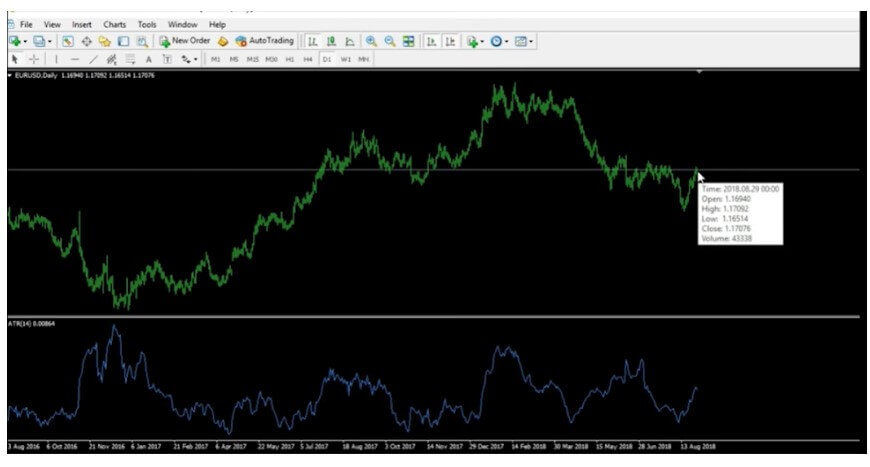
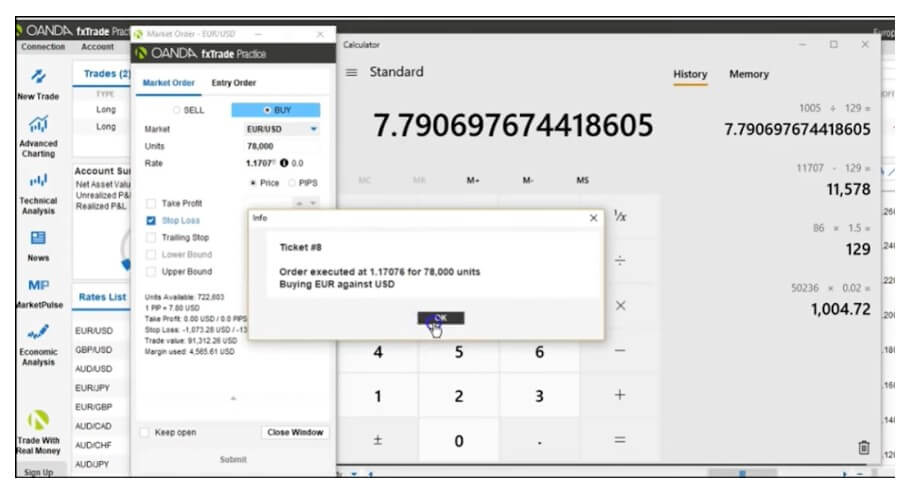
This market is not risk-free, so it all boils down to the question of whether doing trading has a point. If you see that your finances are not developing accordingly, you may consider doing demo trading to learn how to set risk sensibly. If you have yet to do demo trading, you should bear in mind that this will help you build your system, psychology, money management, and trade management skills so that your account reflects these in a positive way and that you can transfer and exhibit the same level of skillfulness in real trading. Both demo and real trading, however, should not be void of risk since the most prosperous traders take many risks, but they know how to manage them properly, successfully minimizing the chance to fail. Consequently, the word risk does not imply that you are acting carelessly, but that you are intelligently assessing where you can invest to have financial benefits.

As risk is a necessary part of this line of business, but also the one that we need to control, we have to consider which percentage of the account any individual should be trading. Most of the available sources advise traders not to go above 2% of their entire trading accounts on each trade. Nevertheless, what this means is that the suggested percentage is the maximum limit, not the average one. While your stop loss should always reflect this, you can feel at ease knowing that most losses rarely exceed this amount. So, if you have 50 thousand USD, the 2% value would equal 1000. Although this may seem like a large quantity of money, and thus a large amount to risk, we need to understand that timid trading will not get you far and that you will not lose the entire thousand even if you happen to fail. Therefore, what understanding risk means is that every trader should allow themselves the opportunity to take risks, but also apply a strategy to minimize those risks.

To successfully track and control the risk level, you can always rely on the ATR, an indicator that tells traders how many pips on average a currency pair moves from the top to the bottom of the candle. While this tool cannot exactly predict the future, it can assist traders with money management, seeing how a currency pair is moving at present and what direction it may take later. Some of the best traders in this market suggest that the stop loss should be set at 1.5 times the ATR (default MT4 settings) value at the moment of position opening to see the greatest benefits, on the daily timeframe. Therefore, if a currency pair’s average true range (ATR) is 80 pips, the stop loss should be 120 pips away from the current price. With the help of this tool, you will always be able to set your stop loss and secure your trading, although once your profit starts to accrue, this limit is going to change.

How can we find out what the pip value is going to be? Even though we cannot expect to have the same pip value across the chart, what you can do is see how much the 2% of your account actually is. As the account will keep increasing and decreasing in value, the risk limit is naturally going to follow these oscillations. Afterward, we will need to count the 1.5 ATR of the currency pair and put the stop loss there. The last step to take here is to divide the risk (a dollar amount) by the 1.5 ATR (pips amount) to learn how much money you should put per pip on each trade. You can rely on this simple calculation for each trade you enter and apply it in your daily chart to get specific insight and information.

Most trades do not involve exact numbers, so let us say that your net account value is 50,263 USD. To estimate the risk, you will multiply this number by 0.02. Upon calculating the 2% of the account (roughly amounting to 1005 USD), we will seek the currency pair we want to trade and find the ATR only to multiply it by 1.5. If your ATR is 86 as in the example below, you should get a pip stop loss of 129.

If you focus on the tip of the pointer, you will see that the price is at 1.1707. We can, in this case, decide to go long, which is why we are going to use this number and deduct 129 (we would do addition if we were going short) to learn where we should enter the stop loss order. Finally, we are going to calculate the pip value by dividing 1005 by 129, which approximately equals 7.7 USD. After acquiring the necessary information, we know that one pip equals $7.7, so we can estimate that the trade unit value should be 78,000 for the EUR/USD currency pair, or 0.78 lots. We will insert the stop loss afterward and enter the trade, as shown in the image below. Note that in the MT4 platform you can use different tools published on the MQL 5 market for this purpose to automate the whole process. There are even some EAs. If you want to really get this easy, try to use Tipu Stops and IceFX Trade Info panel so everything is precalculated for each asset. Just use the drag option to the Stop Loss line on the chart.

While this is a secure way to assess risk, you should always look for the right indicator which will signal you to exit bad trades on time. What is more, you should previously make use of an indicator that can tell you that you are on the right path and inform you that you should stop trading before your price hits your stop loss. By researching and creating your own indicator algorithm, and combining these confirmation and exit indicators as well, you will successfully trade in this market and mitigate the amount of incurring risk.

In terms of how many trades we can do at the same time, the information provided by professional traders suggests that any individual can enter as many trades as they want under the condition that the 2% rule is applied. However, we should also be mindful of the fact that the same currency is not to be traded more than once at the 2% risk. Even if your chart is signaling that you should be investing in a particular currency, you should not by any means be investing in several pairs involving this particular currency (e.g. EUR/USD, USD/JPY, and AUD/USD) long or short at the same time. Should you fail to abide by this rule, you will suddenly have 6% of your account on this one currency (USD) and, having done this, you have actually taken on too much risk all at once. In case this currency goes the opposite direction, you may be damaging your account to an irreversible extent.

Therefore, despite the fact that this approach has been used by various professional traders, you may want to pay close attention not to fall for the trap of over-leveraging. To avoid making this mistake, you should always follow the first signal for that particular currency. Should you, then, receive a long signal on the EUR/JPY pair and another long signal on the EUR/AUD one, you should opt for the one you saw first and follow through. Although we may see the opportunity and potential financial rewards, sometimes less is more in this world. Having said this, you can also apply the half-and-half approach and put 1% on each pair, which can almost function as a hedge saving you from loss should one on the pairs fail to bring you profit. You may also decide to take half the risk and wait for another trade as you can see some favorable progressions coming your way soon, which is not something professionals would advise you to do very frequently because you may be stopping yourself from earning sufficiently by trading timidly.

Risks have often been disregarded as inherently bad, but in the world of forex trading, we know that they are unavoidable and necessary to make a profit. By adopting these practical steps in your everyday trading, even if you are doing demo trading now, you will learn how to set the risk level properly, without protecting you too hard from failure or playing recklessly. A smart trader is thus not the one who fears risk or casts it away as an unimportant factor, but the one who deals with it effectively, applying the strategies discussed in this article intelligently and consistently.

Categories
Forex Indicators

Using Volume and Volume Indicators for Swing Trading

Volume is the lifeblood of forex trading but is often misunderstood and many traders don’t know how to use it to their advantage. If you imagine the market as an organism, then volume is the life force pumping through its veins and, without it, everything would gradually grind to a halt and the market would die. And yet, in spite of its importance, it still gets viewed as a somewhat unattractive part of a trader’s toolkit and is often misunderstood, misused or misrepresented. Sometimes all three. But the fact of the matter is that every consistent and successful trader will have a volume indicator that they know and love firmly integrated into their system and will check it religiously before even thinking about entering a trade.

Volume Confusion

Put simply, volume is the measure of how much of something is being traded. So far, so good. But there’s the rub. People still manage to confuse volume with liquidity, volatility, and momentum. This confusion is perfectly understandable actually. These things are all closely interrelated but they are not ultimately the same thing. A good and easy-to-remember way to think about it is that volume creates liquidity and, to a certain extent, volatility. And it certainly influences momentum.

But while you need volume to be able to trade (more on that later), this isn’t the same thing as needing volatility to trade. Just because you need a certain amount of volume coursing through the veins of the market, does not mean to say that you should be looking for the most volatile or liquid pairs and trading those. It’s important to remember this because the close interconnections between these phenomena mean that many people confuse them in their mind.

The thing to take away from all of this is that a higher level of volume shows that there is some gas in the tank and the market is more running better. This is important because the level of volume can show how robust a particular market move is, which can (along with your other indicators) give you a green light on a trade entry. To keep things uber-simple, the more volume during a price movement, the more legs that movement has got. If there is less volume, the movement is likely to lack conviction.

Why Use a Volume Indicator?

Since volume is what makes markets trend, it is crucial for technical traders and trend traders. This is not news to most people but somehow some traders try to trade even when volume is low and then come away scratching their heads when their roster of losses starts overtaking their wins. A volume indicator is just a mathematical tool that visually represents in your platform whether volume is high or low. Be careful because different indicators use different formulas, which changes how useful they are and how they are used.

A good volume indicator can cut down on the losses you will make if you enter trades when the market is running low on gas. Sure, eliminating losses is nowhere near as exciting as finding an indicator that will help you to find wins but a smart trader will be able to see the benefit immediately. The fact is if the market conditions aren’t right and your well-constructed, thoroughly tested system tells you to not trade – you’re already kind of winning because you’re not taking the hit of an unnecessary loss. You win if you don’t lose and you can’t lose if you chose not to play. That’s why you need a good volume indicator. It is key money management and risk management tool and, if you use it right, you will see how it impacts your bottom line.

So, what should a good volume indicator do?

In short, it needs to tell you whether there is enough volume to trade. Think of it as a stoplight. If it’s green (and all your other trade signals align), go ahead and enter the trade. If it’s red, however, that’s your cue to pull out of the trade. A good volume indicator will do both of these things. Another thing to keep an eye on is indicator lag. Some lag is inevitable – all indicators lag to a greater or lesser extent – but you don’t want your volume indicator to lag too much so watch out for that when searching for and testing volume indicators.
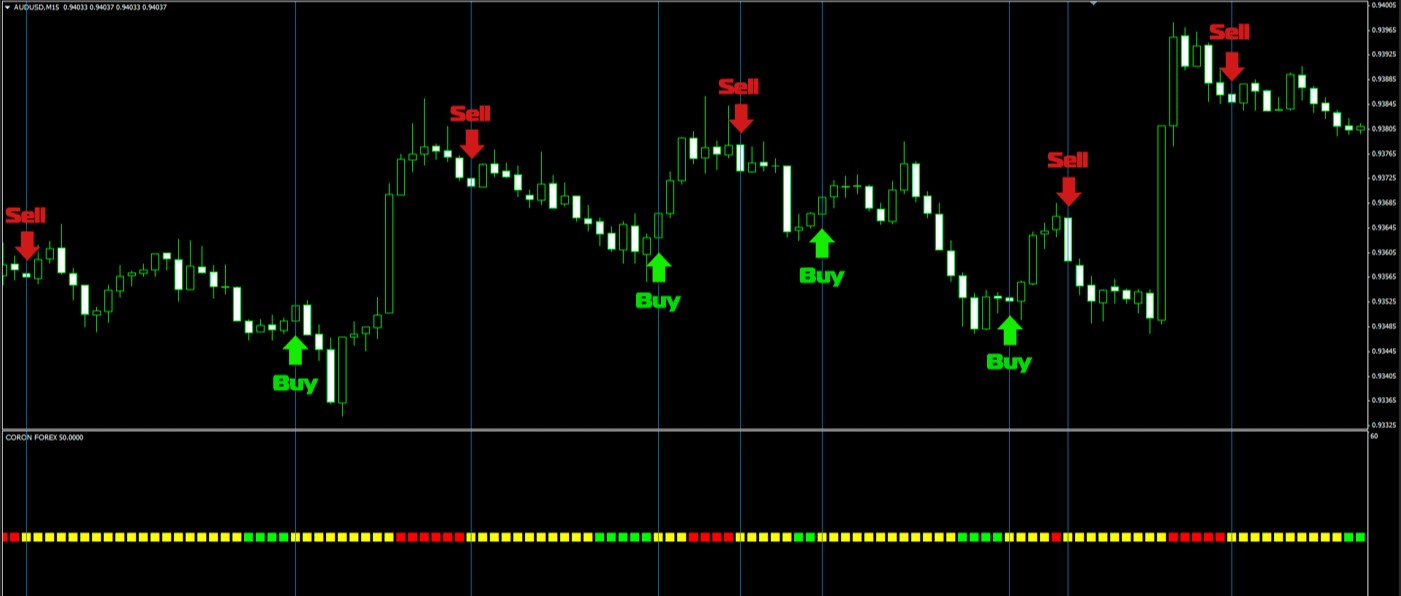
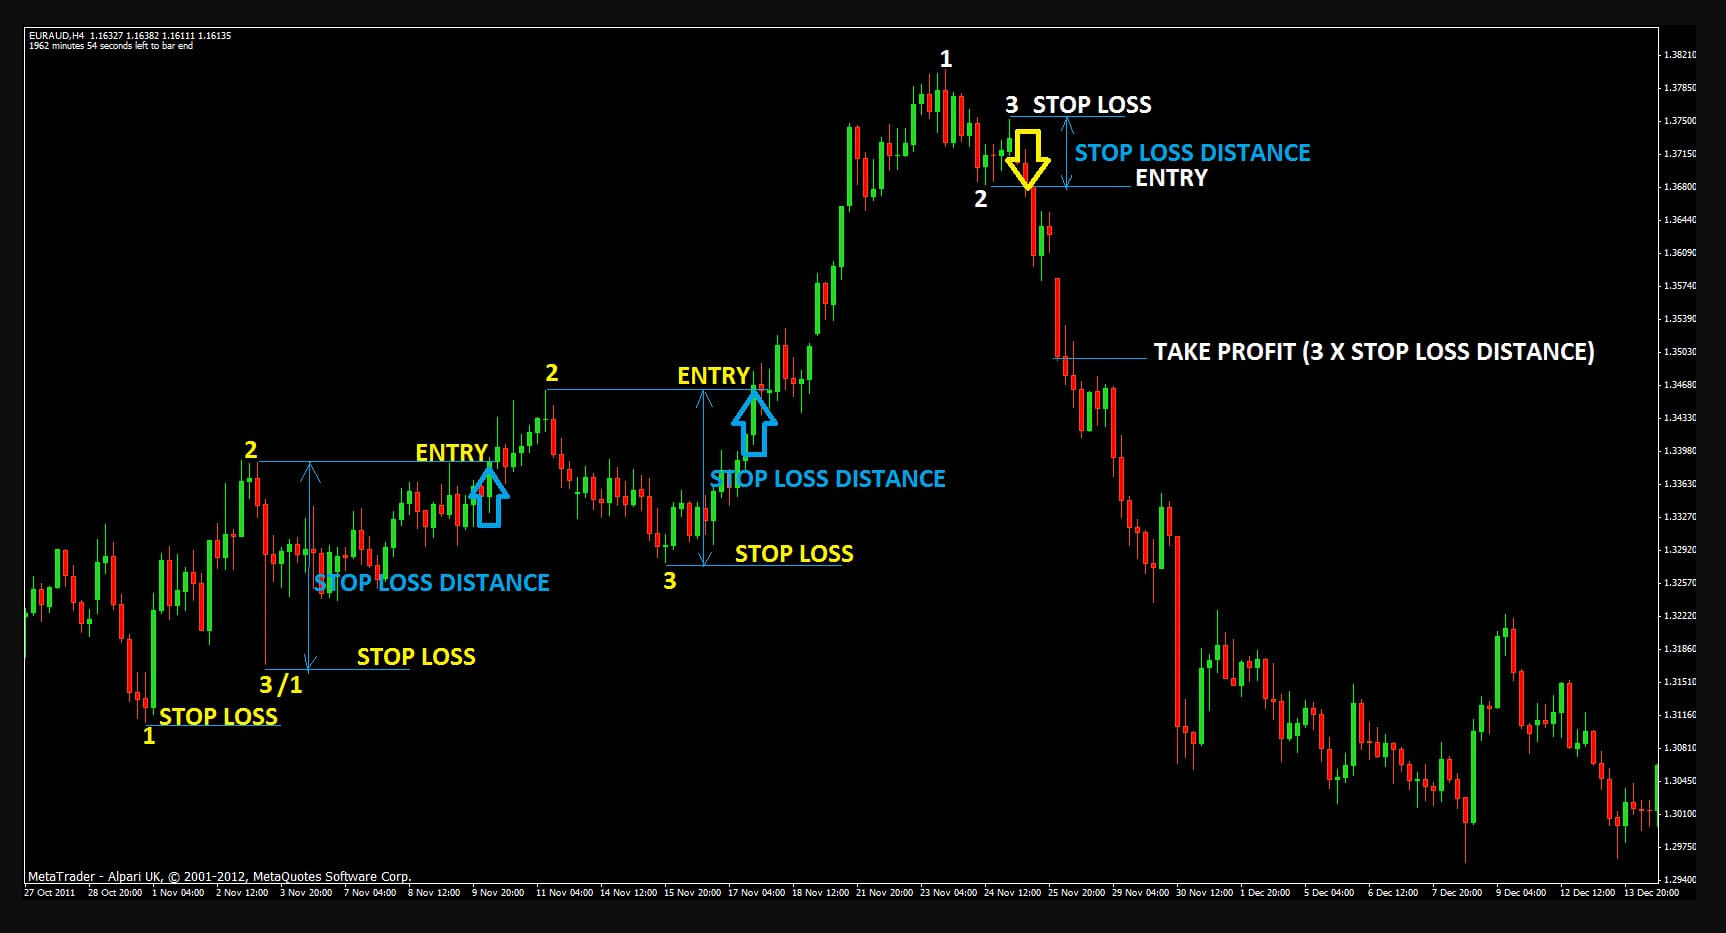
It’s just not possible to overemphasize this: if your volume indicator says there isn’t enough volume in the market at the moment, do not trade. Just like when you’re driving, you don’t hit the gas when the light is red, you don’t trade when there isn’t sufficient volume. There are a lot of factors going against you in forex trading – you can’t predict the future, you can’t control the odds of a trade going your way, you can’t influence the big players in the market … the list is endless. But one factor you can control is when you trade. If you feel – or better yet, if you calculate in a rational and systemic fashion – that the odds of a trade are not in your favor, the only smart option is to not enter that trade. It’s not that different from seeing the cards in front of you in a game of poker, figuring out that another player is likely to have a stronger hand, and choosing to fold. We could take the analogy further and figure out what a volume indicator would be in poker but that isn’t necessary – the thing to take away from this is that a good volume indicator will tell you to avoid the trades that you should be avoiding anyway.

Loss Aversion

An indicator that eliminates losses is every bit as important – if not more important – than one that increases wins. A good volume indicator is one such indicator and it is worth as long as it takes to find a good one. Combine it with a good exit indicator and you’re not just eliminating bad trades, you’re also reducing your losses. That is a force multiplier for your wins.

Ultimately, even a bad volume indicator can, in many cases, save you from making losing trades. The trick is to balance that with making the trades you can win. That’s because a bad volume indicator – while it will certainly cut down your losses – will also prevent you from entering potentially lucrative winning trades. Nobody can tell you which indicator is going to work best with your system and you should immediately ignore anyone who tries. The only thing that will tell you which volume indicator to integrate into your process is to test, test, and then test some more. You have to put in the legwork.

You also have to remember that no indicator is perfect. You have to balance the losses it saves you from and the wins it prevents. A volume indicator that tells you to avoid ten trades that would have been losses and stops you from entering three trades that would have been winning is, on balance, going to save you a lot of money. Of course, it is on you to work out how big the losses would have been in comparison to the wins and to factor that in when choosing the right indicator. In the same way, as it is your job to figure out whether you can find a volume indicator that can save you ten losses and only stop you from entering one winning trade.

But, with volume indicators (and with your approach to trading in general), eliminating losses is the path to success. Put the work in to find a good volume indicator, test it to the max and make sure it works how you need it to. Trade with confidence when it gives you a green light and, when it doesn’t, put your cards down on the table like a boss and stay out of the trade.

Which Indicator?

As we said, nobody can tell you which indicator is going to work best with your system. You will have to put the work in and figure that out on your own. However, here are some indicators to take a look at and one to avoid.

Average Volume: This is the most basic, run-of-the-mill indicator that’s already integrated into your platform. It’s a moving day average set to a specific number of days and if you’re tracking a moving price average, it makes sense to set the average volume indicator to the same number of days. Bear in mind that anything less than 50 days is going to throw up a lot of unnecessary noise.

Force Index: This measures how bearish or bullish the market is at a given moment. You can use this in conjunction with a moving price average to measure how significant changes are in the power of bullish or bearish sentiment. It won’t do the job of telling you when to avoid a trade so much as it will tell you how robust a price trend is.

Volume Oscillator: This is a combination of two moving averages, one fast and one slow (with the fast one subtracted from the slow one). It can show you how strong a prevailing price trend is by tracking when a price movement is followed by an increase in volume. When the indicator is above the zero line, this may be a sign that the prevailing trend has some wind in its sails. Conversely, a change in price followed by a slump in volume is a good sign that the trend is lacking strength.

On-Balance Volume: Just like the Volume Oscillator, this indicator is trying to show you whether a price movement is backed by an increase in volume. It does this by combining price and volume. On an up day, the volume is added to the previous day’s score and on a down day, it is subtracted. Again, this will give you an indication of the strength of conviction behind a given price movement.

Accumulation/Distribution: The A/D line seeks to confirm price trends or highlight weak movements. Volume is accumulated when the day’s close is higher than the previous days close and distributed when the day’s close is lower than that of the previous day. The main way you use this indicator is to detect whether there is a divergence between price movement and volume movement.

Average True Range: Volatility is, as you now know, very closely related to volume and, as a result, you might be able to use some volatility indicators in place of a volume indicator. One advantage of doing this is that volatility indicators can be easier to read and some people chose to use the Average True Range (ATR) as a stand-in for a volume indicator. There are several problems with doing this, however, and here are just a couple of them. For one thing, it can be nearly impossible to figure out where to place the cut-off line – the line below which you will listen to your indicator and pull out of a trade.

Firstly, that line will have change and adapt as markets change, which means you will constantly be lowering or raising it. Secondly, you will also need to have a separate cut-off for each currency pair you trade. Thirdly, you will have to raise or lower the line for each currency pair as market conditions change over time. And, as if all of that weren’t enough, you will have a hard time backtesting it because of this inconsistency over time and across currencies. A good volume indicator should be consistent over time and reflect the market in most, if not all, conditions.

Categories
Forex Trade Types

Guide to FX Swing Trading Scaling Management

Regardless of what they trade, be it gold, corn, stocks, or forex, all winning traders share one key skill that sets them apart from all the other people testing their luck in their respective markets – the most successful individuals always take a portion of their profit off at some point in each winning trade. Termed scaling out, such a maneuver is a distinctive feature of all major players who have figured out their priorities, unlike the majority of participants in the market. As a strategy that each forex trader needs to adopt if they desire success and profit, scaling out can truly be perceived as the crossroads that separates two very different futures for each trader entering the market.

Naturally, if you are a beginner, you should first learn about several other topics which will help you understand forex trading better, notably ATR (which is one of the best indicators that can help traders with money management), risk management (which is a prerequisite for scaling out), and ratios (which will prevent you from falling for the same trap as everyone else). What is more, as a beginner, you should strive to look for real examples of people trading, where they explicitly describe each step of the way and test all methods and strategies yourself in a demo trade. Learning how to scale out is therefore a natural next step after learning how to calculate your risk and it is a level-up topic that requires a certain amount of effort on your behalf to adopt knowledge and information about forex beforehand. Due to the fact that scaling out is such a crucial step in developing one’s account and trader portfolio, we are going to discuss why and how you should incorporate this strategy in your trading. Note this guide is specific to technical swing trading strategies applied to the daily timeframe, but it can be applied to similar trading concepts.

The number one reason why anyone should consciously decide to scale out concerns the psychology of trading, which is distinctly different from betting or casino mindset. In fact, you can read quite a few stories about successful traders who had to learn the hard way what they should and should not do. One story even talks about a trader who experienced a lot of luck in the first trade to the extent that this led to some unrealistic expectations and, almost immediately, failure. Deciding not to learn how to scale out is what a blackjack player does when investing $100 to get $1000 only to lose it all at the end of the night. A similar phenomenon was noticeable in the crypto market not long ago, when a great number of traders were so captivated by the market’s tendency to grow that they did not take any profit off, believing that they can earn more profit this may. They failed to grasp the fact that they would still earn quite a big amount of money, pay off their mortgages, buy cars, and have a really great life even if they had reduced the initial amount they had invested. This story exemplifies the mindset of the majority where individuals always exhibit a hunger for more wealth without taking anything off the table.

These people do not understand that any system, regardless of how successful and functioning it may seem at a particular moment, can collapse in no time. Greediness is emotional and the forex trading market leaves no room for emotions and reckless reactions. The trader from the above-mentioned story believed that buying and holding forever is the best strategy, which is, however, a lesson that such traders have to pay a high price for sooner or later. Forex trading requires a calculated and precise approach that is not governed by emotions, and never getting satisfied by the level of your achievement is the exact opposite of the attitude this market can support. If a trader just keeps expecting more, they are inevitably waiting for the price to go down and one’s unwillingness to accept the state of the matter is no different from losing all your money at a poker table.

Withdrawing a certain amount of profit is the safest approach which entails that you have previously set your stop loss. What many traders fail to include here is the necessity to define their win limits as well. Every trader should know when and how to take a portion of their profit and knowing your limits can help you do this effectively. Therefore, you should consistently decide to take half of your profit at a particular point in your trade and run until your exit indicator or your trailing stop tells you otherwise. Any different approach would just make you a statistic or one of many who thought they could outsmart the system. Moreover, if you expect a price to jump from $0,02 to $25, you should know that this an unrealistic expectation and, as some traders have been waiting for this dream to come true for several decades, you may want to give yourself the freedom to learn faster. Funnily enough, even if such a scenario played out, you would probably have to lose so much down the road that no win could ever compensate for the extent of the financial disaster you put yourself through. While the rose-colored glasses cannot get you far, professional traders around the world can.

Since no expert trader enters or exits a trade without scaling out, we should really focus on what has proved to be successful in forex trading and start applying these first in a demo and then in real trades too. To make use of most tips and tools pertaining to scaling out, you are going to need to get acquainted with the ATR indicator, which has become an essential part of most expert’s algorithms. In addition to its multifaceted nature, this indicator helps traders achieve the same results as with the complex method when the ATR is used as the point of taking off half of the trade for each and every currency pair. Nevertheless, to get to this point, each trader needs to already be aware of several other key concepts and strategies.

If you are wondering how to enter a trade, you must know that you should first determine your risk or how much profit are you willing to lose before deciding to exit. This step also includes the question of how much money per pip you are actually putting at risk and ATR can be of great assistance here. Unfortunately, not all brokers automatically scale out at a certain point, so you should know how to use the numbers and information you came by without missing the price hitting your specific mark just because you are sleeping. If ATR is 80 pips, you may want half of your trade off the table at this point, but despite how successful a trade is, if you are away for any reason, any winning trade can go right back down. Since professional trading implies getting most of the winning trades, how can we bypass this annoying step? The key to resolving this issue is (for MT4 platform) in entering two half trades with one closing automatically owing to the take-profit point and the other still running. Therefore, after you enter the two trades, you will immediately insert your stop losses and put in your ATR value as your take profit, on one of them. This strategy will help you preserve half of your trade regardless of the circumstances, while the other one can run as long as necessary.

To see how this approach functions in real trading, you can look at the NZD/CHF dally chart below, which shows the ATR of 60 pips. Based on this value, we can immediately know that the stop-loss point is going to be at 90 pips (1.5xATR) whereas the take-profit point is going to be at 60. The next step would be to calculate the amount of risk, which is generally advised not to exceed 2% of traders’ entire trading accounts on each trade, and to see how much per pip we are in fact risking. The amount per pip, in this case, would be $11.60, which would equal $5.80 once split into two trades. At this point, you should insert all of the necessary information (please see the second image below) and ether your two trades. The only thing a trader should do now is to wait and avoid checking up the trades so as not to make any unnecessary move based on some emotion, e.g. impulsively exiting a trade too soon. By following these steps, you will secure yourself so that some minor losses do not impact you in the long run.

While the beginning of every trade is of vital importance, you should take several other actions the moment the price hits your take-profit level. Primarily, you should move your stop loss (90 in the example) to your break-even or, in other words, to the level you entered in the currency pair in the first place. Once the price has hit the take profit, you can rest assured that the trade in question is a winner and you cannot lose it any longer. The only question here is how much you can benefit from that particular trade. At this point, you should make use of some other tools, such as Heiken Ashi, exit indicators, and trailing stops, among others, to assist with your trade. These tools can be of great help with your second trade for as long as it runs, especially since knowing when to exit is one of the crucial elements of professional trading. No matter how well we use any tool, the time is the sole factor you should consider at this point and the only one which can grant you whether your trade will be a big win or a minor one.

In the stock market, for example, a 10—11% return is considered to be a really good result because it mirrors the stock market average. Should you be able to increase this percentage in time, you will become one of the few elite traders who are able to successfully manage hundreds of thousands to get such returns. If you are considering a specific benchmark to hit, this may as well be a great reference because these trading skills are not only ever-lasting but also in high demand. Warren Buffett for example, one of the most prominent figures on the investment scene in America, makes a 20% return per year and he surely has not achieved such success without continuously using an elaborate approach to trading and knowing how to allocate his funds effectively.

Scaling out, as we can see, is no longer optional once you decide to be good at forex trading or trading in general. You do, however, need to commit yourself to follow this system religiously, without feeling compelled to constantly micromanage your trades. Even if you encounter an unfavorable period or take a loss at some point in your trade, be patient and refrain from reacting impulsively because your stable and consistent approach to trading will even out any transient imbalance in the end. Accompanied by money management skills, scaling out is the one way you can avoid the blackjack scenario and be smart about your finances. The ability to take in all these pieces of information and apply them in a diligent and disciplined manner will only further support the development of a healthy trading mindset.

Learn how to estimate risk and make sure that all your trades are winning in a certain capacity. Rely on ATR in every step of the way and incorporate some additional tools to improve your trading skills whenever possible. If you have already taken the advice, done all necessary calculations, and enter the two trades, it is time to let go, relax, and allow time to run its course. Although this may seem like a great quantity of data, understand that after a while you will be able to make all assessments and enter a trade in as little as 15 minutes. However, whatever you do, never forget to scale out and persistently envision what your final goal in this entire endeavor is.

Categories
Forex Course

65. Combining Fibonacci Levels With Candlestick Patterns

Introduction

In the previous lessons, we understood how Fibonacci levels could be combined with trendlines to generate confirmation signals. After discussing many applications of the Fibonacci indicator, we are now ready to explore some complex strategies using these levels. In this lesson, we will be discussing how the Fibonacci levels can be used with Japanese candlestick patterns.

The candlestick patterns are an intrinsic part of trading, and we cannot ignore them. We have learned many candlestick patterns in the previous lessons, and you can find them starting from here. We have also learned that these patterns can not be used stand-alone, and we should be using any reliable indicators to confirm the signals generated by these patterns. So we will be using Fibonacci retracements to confirm the opportunities generated by the chart patterns.

For the explanation purpose, let’s discuss one of the most reliable candlestick patterns – Dark Cloud Cover. To know more about this pattern, you can refer to the second part of this article. We will be trading the market today by combining both Fibonacci levels and the Dark Cloud Cover pattern.

Strategy – Dark Cloud Cover Pattern + Fibonacci Levels 

For explaining the strategy, we considered a downtrend, on which we will be plotting our Fibonacci indicator and later evaluate its retracement. The below chart shows the same with a trading region in which we will be identifying our swing high and swing low. We will also see if the retracement shown in the chart is going to react at the important Fib levels.

In the below chart, we can see the market has moved down quite swiftly from the swing high to swing low. This shows the strength of the underlying downtrend. Trading a retracement of a strong and big move on any side is always preferable. The next step is to plot the Fibonacci levels on the chart.

After the Fibonacci indicator is rightly plotted as shown in the below chart, let’s see what happens at the important Fibonacci levels, such as 50% or 61.8% level. In the chart below, we see that the last Red candle of the retracement exactly touches the 50% level and closes midway of the previous Green candle.

These two candles together remind us of one of the very well known candlestick patterns – The Dark Cloud Cover. More importantly, this pattern is formed exactly at the 50% Fib level. So if we get a confirmation to the downside, it could result in a perfect setup to go short on this pair.

In the above picture, we can clearly see the formation of a bearish confirmation candle. So we can confidently take short positions in the market by placing a stop-loss near the 61.8% level with a target below the recent low.

The above chart shows how the trade works in our favor by hitting our pre-determined ‘take profit.’ We can see that, right after the entry was made, the market moves so fast in the direction of the trend producing continuous red candles. This shows the accuracy of candlestick patterns when combined with indicators like Fibonacci. Since the market is still in a strong downtrend, aggressive traders can take profit at the second or third swing low of the trend, after crossing the initial ‘take-profit.

Conclusion

From the previous articles, we have seen how the Fibonacci tool can be used with support resistance levels, trendlines, and now even candlestick patterns. By this, we can be assured that the Fibonacci tool is potent and should never be underestimated. Instead, we recommend you to widen its usage in technical analysis to identify more accurate trading opportunities.

[wp_quiz id=”64541″]
Categories
Forex Educational Library

Forex.Academy 2018-2019 Outlook – CAD Group


Summary


Forex Daily News: In this post, we analyse the Canadian Dollar group against their main currencies. As a summary, the second half of the year and 2019, we foresee a corrective movement in the Canadian currency, which could come supported for a correction in oil prices to, then, give way to a new rally. After this correction, our central vision for the Canadian Dollar is a new appreciation scenario.

Additionally, we observe that it is likely that GBP and EUR would show the best performance against the CAD; on the opposite side, the Japanese currency and the Swiss Franc could have the worst performance against the Canadian Dollar.


USDCAD

The USDCAD is developing a complex corrective structure of a second bullish impulsive wave. The corrective structure has a bearish bias, which could find support in the area between 1.29607 to 1.28371. The key level to watch out is 1.2884, this level should convert on a critical pivot level (HHL).


EURCAD

EURCAD cross in the short-term has a bearish bias, probably could see new lows in 1.50 zone. In the mid-term, the cross moves sideways as a complex corrective. In the long-term, we foresee that the EURCAD could find fresh lows in the area between 1.47822 to 1.45662, from where the cross could start a new rally as a fifth bullish wave. Invalidation level is at 1.4442.


GBPCAD

Probably the GBPCAD cross shows the clearest movement of the CAD Group. The price is moving in a bearish A-B-C sequence, which could find support at 1.6410 level, from where the price could create a new connector and then initiate a rally. The new bullish sequence has a target the area between 1.8533 and 1.9266. Invalidation level is at 1.5837.


CADJPY

The CADJPY cross has been commented in a previous analysis, and we maintain the main idea which consists in to seek only long positions with a long-term profit target in the area between 94.69 and 95.30. Is probably that the cross makes a retrace to the area between 85.45 to 83.73 from where we could find new opportunities to incorporate us into the trend. Invalidation level is located at 82.17.


CADCHF

In the CADCHF cross, the lemma is “Buy the Dips” or “Watch the Breakout.” CADCHF is running sideways in an upper degree consolidation structure. The key level to control is 0.7636, after the breakout of this level, we expect more upsides to the zone between 0.7992 and 0.8245. In case that the price makes a false breakdown to the area between 0.7394 and 0.7289, it could be an attractive opportunity to look for the long side. Invalidation level is at 0.7124.


NZDCAD

In the long-term, NZDCAD is running sideways and making lower highs. The long-term pivot level is at 0.8640. For this cross, we expect only short positions; if the price makes a bullish move, the potential movement is limited to the area between 0.9253 to 0.9461. The long-term target area is between 0.8401 to 0.8098.


AUDCAD

Probably the AUDCAD cross is the less attractive to trade. As we can see in the weekly chart, it is running sideways since the second half of 2013. The price is moving inside a bearish cycle, which could find support in the “long-term pivot level” at 0.8919, from where AUDCAD could start to bounce. The invalidation level for the bearish cycle is at 1.0397.


Forex Daily News: Finally, as a technical note, considering that the AUDCAD is mostly bearish, by correlation, the CAD should perform better than the AUD for the period foreseen.

Categories
Forex Market Analysis

LONG-TERM PICKS – Watching the PRZ in AUD-NZD


Instrument: AUD-NZD

Main Outlook: Bullish.

Forecast Timeframe: 2 to 3 weeks.


Summary.

The cross is developing a bearish structure that has reached the level of Fibonacci retracement F(61.8) 1.07181, from where we turn on alerts of the possible formation of a reversal pattern that could lead to new highs. Our objective level is 1.1363 and in the longer term the levels 1.17 and finally 1.21. The invalidation level is 1.0222.


Chart


Categories
Forex Educational Library

How to Trade the Dead Cat Bounce


Background

The Dead Cat Bounce is a bearish structure that occurs mainly due to a high impact event, for example, news-related, significative report or a speech of a central bank. In this article, we will talk about how to recognise this pattern, its characteristics and how to trade it.

The Dead Cat Bounce is a small and temporary market recovery following a large fall. The first quotation was made in an article by Chris Sherwell in The Financial Times, 7th December 1985, where they wrote:

“The rise was partly technical and cautioned against concluding that the recent falls in the market were at an end. ‘This is what we call a dead-cat bounce,’ one broker said flatly.”

However, the race for the phrase authorship does not end here, recently in a Letter to the Editor in The Financial Times, 19th July 2017, Jude Kinne wrote:

“I was the ‘trader in Singapore’ to whom the Financial Times’ Chris Sherwell attributed the “dead cat bounce” quote”.

Even in the literature classic by Mark Twain “The Adventures of Tom Sawyer”, written in 1876, in chapter 6 it appears quoted the “dead cat” in a dialogue between Tom and his friend Huck:

“Say – what is dead cats good for, Huck?”

“Good for? Cure warts with.”

“No! Is that so? I know something that’s better.

Now that we know a little of its history, the question is, what are the characteristics of the Dead Cat Bounce Pattern? The main component is that the movement begins with a decline of more than 10%, breaking down the previous low, ideally leaving a price gap. Please note that on continuous markets, for example, Forex or Cryptocurrencies markets, there may not exist a gap. If the prices break down more than 20%, it is indicative of the seriousness of the plunge.

When panic is caused a news event appears. ‘Recovery’ begins, as prices start recovering and moving upward. Do not be attracted to enter on this recovery, thinking about an uptrend continuation on the left side of the screen, because the decline is still not over. After the bounce ends, another downward movement begins. This drop could still be between 5% to 25%.

Once we have detected a potential “Dead Cat Bounce” pattern, the recovery could reach the 50% to 61.8% of Fibonacci retracement (see our articles Understanding the Fibonacci Sequence and Making a Trading Plan Using Fibonacci Tools).

  • Entry: Enter in a short position when the price reaches the 50% to 61.8% Fibonacci retracement level of the first fall.
  • Stop Loss: Place a Stop Loss Order above the 76.4% Fibonacci retracement level of the first fall.
  • Profit Target: The target must be 76.4% with extension in 100% of the Fibonacci projection (see our article Trade the Harmonic AB=CD Pattern).

Now that we know the requirements to understand the Dead Cat Bounce Pattern, let’s put all together with an example. Figure 1 is the 4-hour FTSE 100 chart, on the 8th of August  2017, the FTSE makes a plunge, leaving a bearish gap, and the downfall extends to 7290.07 on August, 11.

Figure 1: FTSE 100, 4-hour chart, Potential Dead Cat Bounce Pattern.

Source: Personal Collection.

In the August 14 session (see figure 2), its recovery begins, reaching the 7446.57 pts. The recovery movement ends between the 50% to 61.8% of Fibonacci retracement; this area is our entry level. The Stop Loss order is placed above the 76.4% level.


Figure 2: FTSE 100, 4-hour chart, Entry Zone and Stop Loss Identification.

Source: Personal Collection.

Once that we have the entry and stop loss levels, using the Fibonacci expansion tool, we project the target profit level (see figure 3).

Figure 3: FTSE 100, 4-hour chart, Profit Target Identification.

Source: Personal Collection.

Another example is in figure 4, Bitcoin daily chart, this is a possible scenario in development. The movement begins with a sharp fall from $19,898.12 to $10,694.22 level from where the recovery started, reaching the 61.8% Fibonacci retracement; from this level, the Bitcoin continued the downward movement. As the Bitcoin is still developing the pattern, this example will be used as a followup on its evolution.

Figure 4: Potential Dead Cat Bounce Pattern in Bitcoin, daily chart.

Source: Personal Collection using JAFX MT4 Plattform.


A final consideration to increase the learning process of the reader is to perform a backtest to evaluate the correct setups works adjust better to their trading style.


SUGGESTED READINGS:

  • Kinne, J. (July 8, 2017). I was that trader – but I’d heard the phrase before. Financial Times: https://www.ft.com/content/af4fc1b0-6b12-11e7-bfeb-33fe0c5b7eaa (Recovered on December 30, 2017).
  • Twain, M (1884). The Adventures of Tom Sawyer. Chapter 6. https://www.gutenberg.org/files/74/74-h/74-h.htm#c6 (Recovered on December 30, 2017).


Categories
Forex Educational Library Forex Trading Strategies

Trading using Trader Vic’s Patterns


Victor Sperandeo, known as Trader Vic on Wall Street, is a legendary futures trader who has over 45 years of experience in the commodities markets. In this article, we will show two trading setups when the trend is changing and how to take advantage of the markets.

2B PATTERN

In a bull market, the 2B pattern requires that the price performs a new maximum, then a significant retracement and then that price tests again the previous maximum or attaining a higher one, that is better known as false breakdown (or false breakout). When this test fails, it is a sign that the price may be developing a failure in the uptrend, thus creating a potential reversal of the trend. Some traders call this pattern “Trap” (bear trap and bull trap). An idealisation of this pattern is in figure 1.

Figure 2 is an example of a 4-hour EUR-USD chart. The Euro shows an initial bearish movement to 1.1573; when it reaches this level, the price reacts making a retracement to 1.1689. After this retracement, the Euro makes a new low as a false breakdown. When it happens, the price makes a bullish move starting a new bullish trend.

The setup of this pattern is:

  1. Entry: Buy above (or sell below) the false breakout (or breakdown) candle.
  2. Stop Loss: Below (or above) the last swing (see figure 1).
  3. Profit Target: Previous swing high (or low).


1-2-3 PATTERN

This pattern is based on the concept that the trend changes when the price breaks the trendline described by the Dow Theory. In an uptrend, the price is making higher highs and higher lows, but then, the market breaks down the trendline. Afterwards, the price makes a test of the tops, but it does not reach a new maximum. Some traders call this pattern as “Failure”. Figure 3 shows an idealisation

As in the case of 2B Pattern, the 1-2-3 Pattern looks to identify a trend reversal or the end of the current trend. Let’s consider in figure 4, the BNKG 30-minute chart, which is following an upward trend. Once it reaches a new maximum, BKNG breaks down the uptrend line (1), then it performs a test that cannot overcome the previous maximum (2) followed by a price failure to reach a new maximum and a break down of the last support (3).

The setup of this pattern is:

  1. Entry: Buy above (or sell below) the swing of the breakout (or breakdown) of the trendline.
  2. Stop Loss: Below (or above) the last swing (see figure 3).
  3. Profit Target: Previous swing high (or low).


THE BACKTEST

In a personal study that considered the frequency of recurrence of the patterns: Trap, Failure, Climax (or turn in V) and Double (Double Top, Double Bottom), the results were the following:

As can be seen in Figure 6, the possibility of detecting the Trap patterns (or 2B pattern) is 42.7%, and Failure (or 1-2-3 Pattern) is 41.3%, adding up to 84% of the changes in the trend that occurred in the market. The ability to detect these two patterns can provide an advantage over the market. Figure 6 is a USOIL hourly chart, 2B. 1-2-3 movements are commonly found when we make the backtest to these patterns, even in minutes, as on the GOLD 15-minutes chart (figure 7).

SUGGESTED READINGS:

  • Sperandeo, V. (1994). Trader Vic II – Principles of Professional Speculation. New York: John Wiley & Sons, Inc.


Categories
Forex Market Analysis

Hot Topics – December 18 to 21, 2017

Hot Topics:

  • US DOLLAR – THE BEARISH BIAS DUE TO TAX REFORM CONTINUES.
  • GBP-USD – BREXIT NEGOTIATIONS AND ECONOMIC GROWTH DRIVES STERLING.

This past week presented significant advances for the New Zealand dollar with a 2.25% advance, due mainly to the weak inflation data (YoY) shown by the American economy (1.7% vs. 1.8% expected). The increase of the interest rate by the FOMC was not enough to reverse the advance of the Kiwi.

The worst performance of the week was exhibited by the British Pound with a -0.41% loss. The BoE decided to keep the interest rate at 0.5% in the context of an increase in unemployment for a second consecutive month, reaching 4.3%. On the other hand, inflation (YoY) scored a 3.1% advance, the highest level for almost six years; specialists believe that CPI is reaching a peak and that it could mainly impact the cost of the services sector.


 US DOLLAR – THE BEARISH BIAS DUE TO TAX REFORM CONTINUES

Dollar begins a bearish week in the context of uncertainty over the approval of tax revision legislation with the aim of making American companies more competitive.

The Republican Senator Bob Corker has expressed concern about the fiscal deficit that can result from the tax cuts. Despite having a position in favour of the tax review, doubts remain in the approval of the reform, in the same way that the Senate rejected the Trump Administration’s proposal to suppress Obamacare last July.

The Greenback has broken the bullish guidance that has reached S3; there is a possibility that it will develop a bullish reversal movement up to the weekly pivot level. You can find more information in our article Finding Trade Opportunities Using Pivot Points.


GBP-USD – BREXIT NEGOTIATIONS AND ECONOMIC GROWTH DRIVES STERLING.

Economic growth and negotiations for Brexit continue to be the primary drivers of the Sterling. On Wednesday, the governor of the BoE will address the Parliament in the context of the hearing of the Select Committee of the Treasury on the November Financial Stability Report.

The British Prime Minister, Theresa May, has assured the Parliament that she is looking for the Brexit transition to be completed within two years. The first phase of the Brexit negotiations has been on the rights of EU citizens in Britain. EU members have agreed to move to the second stage, which focuses on the transition and future commercial relations. The British Parliament has urged May to stand firm in the interests of the United Kingdom, such as a previous Prime Minister, Margaret Thatcher.

Technically, the Pound is developing a corrective structure, with a bias for bullish continuation. The RSI shows a bullish divergence; however, we expect a retracement towards the weekly pivot zone and then continue with the bullish movement in the medium-long term.

 EUR-USD – CORRECTIVE STRUCTURE IN DEVELOPMENT

The single currency is developing a corrective structure; the RSI has not yet shown evidence of rupture. We expect the price to make a bearish movement in five; that means, the euro could move up to R1 and then fall to S2, thus completing a five-wave sequence.


 USD-CAD – LOONIE CONTINUES IN A SIDEWAYS RANGE MOVEMENT.

The Loonie continues in a sideways range formation, waiting for data to act as a catalyst. Most probably, the previous movement will continue to R2 (1.30 level). The RSI is forming a triangular structure that is finding resistance at level 60. The bullish bias still prevails, with the average of 9 periods under the RSI.


 NZD-USD – A PENNANT THAT COULD BE A PAUSE OF A NEW RALLY.

Last week, the Kiwi was the best currency performer with a 2.25% increase against the USD. This week it is developing a pennant pattern, manifesting a pause with further continuity of the bullish movement. The RSI, on the other hand, is forming a corrective structure. We expect a false move towards the weekly pivot, and then, continuing the upward cycle to the zone of R2 (0.715).


Categories
Forex Educational Library

How to Trade the Harmonic AB=CD Pattern

Introduction

Harmonic Trading is a method based on the specific structures recognition to determine highly probable reversal points. These structures possess specific Fibonacci levels that validate the harmonic pattern. In this article, we will show how to recognise and detect potential trades opportunities with the AB=CD pattern. We don’t need to cover all harmonic patterns because, according to Carney (see suggested readings below), the AB=CD structure is the initial point to all harmonic patterns.

The AB=CD Pattern

The AB=CD pattern was described by H.M. Gartley in his book Profits in the Stock Markets, published in 1935. Figure 1 represents the AB=CD pattern. In Fig 1, (i) is the ideal AB=CD bullish and (ii) is the normal AB=CD. The A-B-C section of the AB=CD structure also is called  “1-2-3 Pattern” or “ABC Wave.” The objective is to trade the AB section continuation.


AB=CD Harmonic Pattern

ABCD Harmonic Pattern


 Figure 1: AB=CD Pattern.  (i) Ideal case. (ii) Common case.
Source: Personal Collection.


To increase the probability in the BC projection and the PRZ (Potential Reversal Zone) forecast, Carney (2010) exposes the reciprocal ratio levels; these relations help to define the best PRZ complement for the AB=CD structure (see table 1).

AB=CD structure

Table 1: Reciprocal ratios for AB=CD completion structure.
Source: Carney, S. (2010)


The Potential Reversal Zone (PRZ) is a convergence area, where Fibonacci levels are concentrated to such extent that the confidence of this region rises. As we’ve exposed in our article Understanding the Fibonacci sequence, (https://www.forex.academy/understanding-the-fibonacci-sequence) no law forces a price to pull back to a Fibonacci level, and then turn again to its previous trend. It is essential to pay attention to price action and remember that the PRZ must be confirmed before pulling the trigger.

Ways to trade the AB=CD Pattern.

  1. The first way is looking at the AB=CD completion for the reversal movement.
  • Step 1: Identify the start of the movement and trace the AB retracement, see figure 2:

AB retracement

Figure 2: Copper 4-hour Chart.
Source: Personal Collection.
  • Step 2: Trace the BC projection and make the Potential Reversal Zone (PRZ) identification.

Potential Reversal Zone (PRZ) identification

Figure 3: BC Projection and PRZ identification.
Source: Personal Collection.
  • Step 3: Define an Invalidation Level and Profit Target zone identification. Profit target levels are PT 1 at 38.2% % and PT 2 at 61.8% of the CD segment.
  • Stop Loss could be placed below D level.

Targets identification

Figure 4: Targets identification.
Source: Personal Collection.
  • Step 4: Set all together in your Trading Plan. (For further information see our article Making a Trading Plan Using Fibonacci Tools).
  • The second way is to trade the CD segment. For this scenario, we will look for the completion of the CD movement:
  • Step 1: Identify the AB segment and measure BC with Fibonacci retracement (see figure 5).
  • Step 2: Make the BC projection to CD segment completion (see figure 5).
  • Step 3: Identify invalidation level, PRZ for entry and take profit levels. Entry could take place at a Fibonacci level of AB retracement; Stop-Loss could be above A level and Profit Target at a BC complement level (see table 1). In figure 5 example, we use F(127.2) as a conservative TP for the trade proposed.
  • Step 4: Make the Trading Plan.

Trading the CD segment

Figure 5: Trading the CD segment.
Source: Personal Collection.


SUGGESTED READINGS:


KEYWORDS:

Harmonic Trading; Fibonacci; ABCD Pattern.

©Forex.Academy