Categories
Forex Market Analysis

Forex.Academy 2018-2019 Outlook

DXY – One more climb is pending.

During the first half of 2018, Dollar Index found support at 88.25, from where the price made a first bullish impulsive move surpassing the previous high at 90.57; after this movement, DXY made a simple corrective structure as an A-B-C pattern, carrying to a new bullish impulsive move as a “three of three” pattern. For the second half of 2018 and the first half of 2019, we expect the development of a complex corrective structure which could fall between 92.35 to 93.33, from where the Greenback could start to bounce starting a new rally completing an upper degree bullish cycle. The target of the last bullish move is between 96.24 to 97.43. From this area, DXY could start to fall developing a bearish extension of the downward move started on January 2017.


EURUSD – Expecting for a new rally.

Probably the common currency will be the trade for the next year. Since 2017, the pair made a first impulsive wave in upper degree; in the first half of 2018, the euro has been moving bearish correcting as an “A” wave, and now is consolidating as a “B” wave which could find resistance in the area between 1.1859 and 1.1965. For the rest of the 2018 and 2019, we foresee for the EURUSD pair, the completion of the A-B-C pattern, which could end in the zone between 1.1147 and 1.0893. From this area the price could give way to the start of a new bullish wave, or said in other words; we expect a wave three of upper degree, which could drive to the euro to see the 1.40 area.


Categories
Forex Educational Library

AUDUSD – Cycle Analysis and Forecast

AUDUSD – Cycle Analysis and Forecast

The AUDUSD pair in daily chart is moving bearish as an A-B-C pattern, from the highest level reached on January 25 (0.81358 level). The segment BC developed a bullish divergence, which alerts us to the exhaustion of the bearish movement, this divergence is not a reversal signal. On the last sequence of the wave C, the price tested two times the 0.73179 level (FE 141.4 level).


In the 4-hour chart, the wave between B and C has fallen in five waves from 0.79163 to 0.73105 on July 02. From this level, the Aussie started an internal bullish move which reached the 0.74838 level, surpassing the previous high 0.74438 in time and shape. Currently, the price is moving in a range which could be the start of a new bullish cycle.


For the coming sessions, we foresee new upsides which could be activated as long as the price bounce from the area between 0.73562 and 0.73265, with a potential profit target area between 0.75382 and 0.75956. The invalidation level of this scenario is 0.73105.


Categories
Forex Educational Library

Forex.Academy 2018-2019 Outlook – CAD Group


Summary


Forex Daily News: In this post, we analyse the Canadian Dollar group against their main currencies. As a summary, the second half of the year and 2019, we foresee a corrective movement in the Canadian currency, which could come supported for a correction in oil prices to, then, give way to a new rally. After this correction, our central vision for the Canadian Dollar is a new appreciation scenario.

Additionally, we observe that it is likely that GBP and EUR would show the best performance against the CAD; on the opposite side, the Japanese currency and the Swiss Franc could have the worst performance against the Canadian Dollar.


USDCAD

The USDCAD is developing a complex corrective structure of a second bullish impulsive wave. The corrective structure has a bearish bias, which could find support in the area between 1.29607 to 1.28371. The key level to watch out is 1.2884, this level should convert on a critical pivot level (HHL).


EURCAD

EURCAD cross in the short-term has a bearish bias, probably could see new lows in 1.50 zone. In the mid-term, the cross moves sideways as a complex corrective. In the long-term, we foresee that the EURCAD could find fresh lows in the area between 1.47822 to 1.45662, from where the cross could start a new rally as a fifth bullish wave. Invalidation level is at 1.4442.


GBPCAD

Probably the GBPCAD cross shows the clearest movement of the CAD Group. The price is moving in a bearish A-B-C sequence, which could find support at 1.6410 level, from where the price could create a new connector and then initiate a rally. The new bullish sequence has a target the area between 1.8533 and 1.9266. Invalidation level is at 1.5837.


CADJPY

The CADJPY cross has been commented in a previous analysis, and we maintain the main idea which consists in to seek only long positions with a long-term profit target in the area between 94.69 and 95.30. Is probably that the cross makes a retrace to the area between 85.45 to 83.73 from where we could find new opportunities to incorporate us into the trend. Invalidation level is located at 82.17.


CADCHF

In the CADCHF cross, the lemma is “Buy the Dips” or “Watch the Breakout.” CADCHF is running sideways in an upper degree consolidation structure. The key level to control is 0.7636, after the breakout of this level, we expect more upsides to the zone between 0.7992 and 0.8245. In case that the price makes a false breakdown to the area between 0.7394 and 0.7289, it could be an attractive opportunity to look for the long side. Invalidation level is at 0.7124.


NZDCAD

In the long-term, NZDCAD is running sideways and making lower highs. The long-term pivot level is at 0.8640. For this cross, we expect only short positions; if the price makes a bullish move, the potential movement is limited to the area between 0.9253 to 0.9461. The long-term target area is between 0.8401 to 0.8098.


AUDCAD

Probably the AUDCAD cross is the less attractive to trade. As we can see in the weekly chart, it is running sideways since the second half of 2013. The price is moving inside a bearish cycle, which could find support in the “long-term pivot level” at 0.8919, from where AUDCAD could start to bounce. The invalidation level for the bearish cycle is at 1.0397.


Forex Daily News: Finally, as a technical note, considering that the AUDCAD is mostly bearish, by correlation, the CAD should perform better than the AUD for the period foreseen.

Categories
Forex Elliott Wave Forex Market Analysis

Divergence between Gasoline and Crude Oil

A divergence between Gasoline and Crude Oil

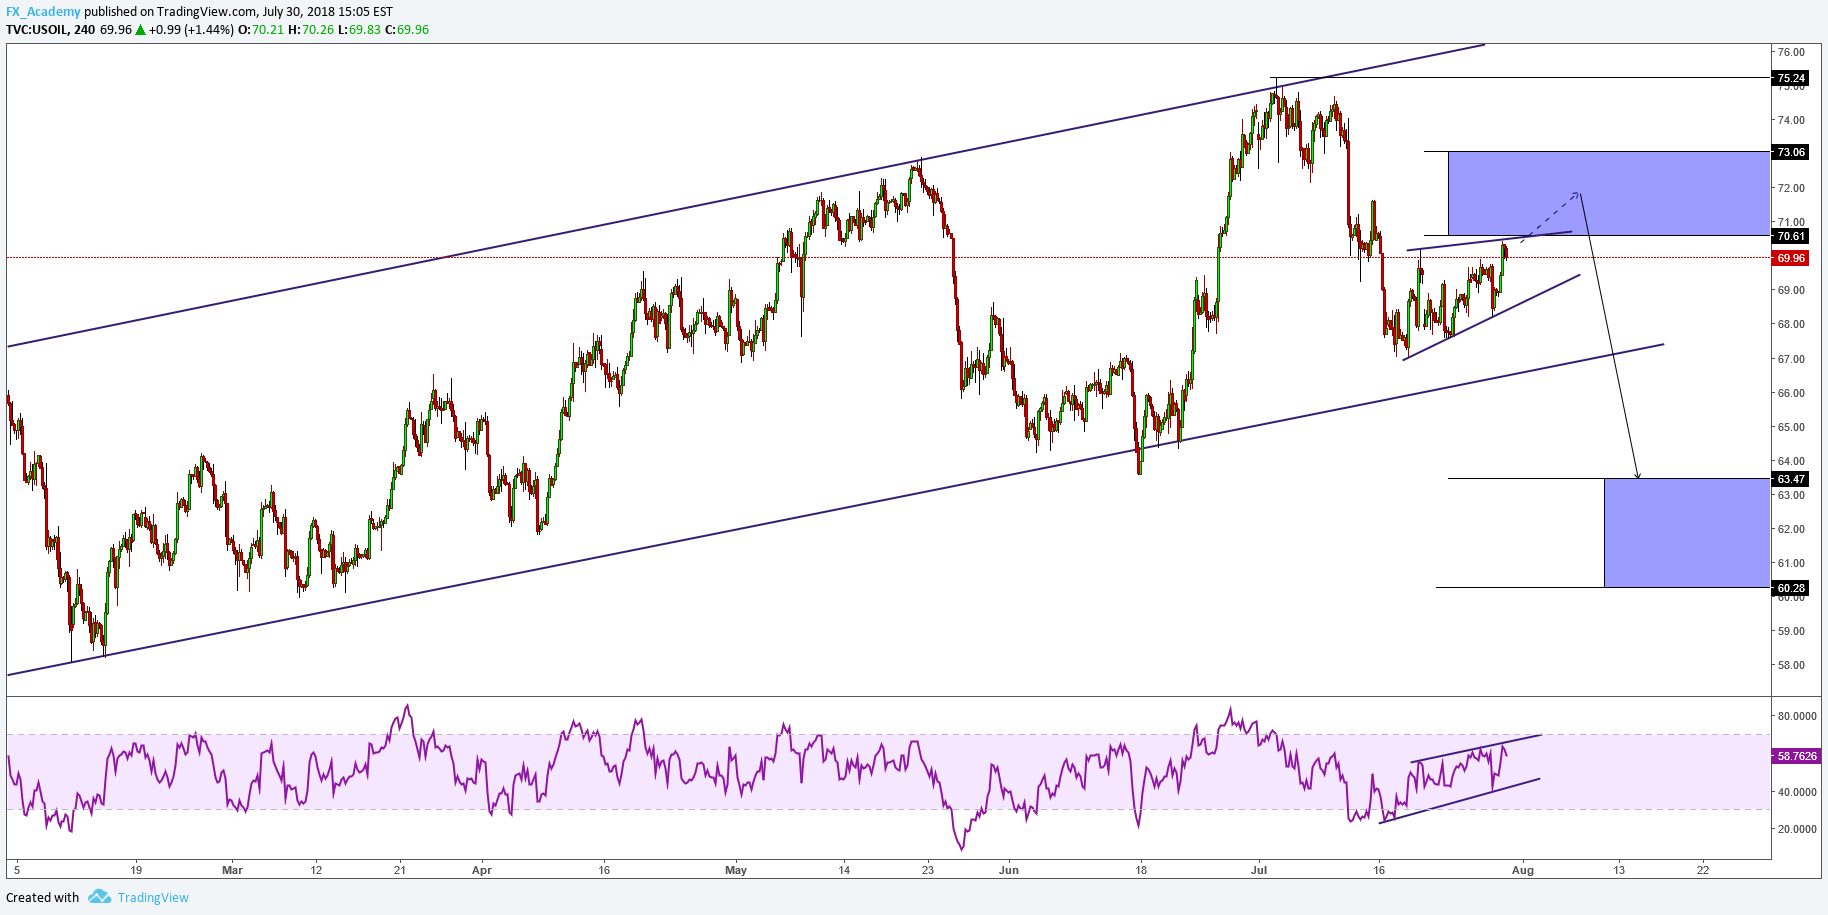
Gasoline and Crude Oil are two energy commodities highly correlated. In the current session, Gasoline is moving bearish, but Crude Oil is moving bullish. We expect that Crude Oil would make a new lower high and continue inside the area between $70.61 to $73.06 to, then, develop a new bearish leg, with a target the zone between $63.47 to $60.28. Invalidation level is $75.24.


Forex Academy

Categories
Forex Market Analysis

European Union and Japan Sign a Trade Deal – Forex and Indices – Daily Update – 17.07.18


Fundamental Overview


European Union and Japan sign a trade deal

Financial Market Updates: Japan and the European Union signed a trade deal amid uncertainty generated by the protectionist policy led by the Trump Administration. The trade deal creates the largest open economic area. The agreement promises to eliminate 99 per cent of tariffs.


Technical Analysis


EURUSD

Today the EURUSD pair failed the bullish continuation, remaining in the consolidation range, it suggests that the pair should continue with the previous bearish cycle. In consequence, we update our bias from a bullish to a bearish move. The potential sell zone (PSZ) is between 1.1760 and 1.1807 with a bearish target placed at 1.1293. Invalidation level is 1.1852.


GBPUSD

As noticed in previous Daily Updates, the GBPUSD pair in a 2-hour chart is moving sideways, the short-term pivot level at 1.3275 has failed, in consequence, GBPUSD should make a new lower low. The Pound could fall to the area between 1.3024 and 1.2885, completing a major degree bearish cycle. Invalidation level is at 1.3472.


USDCHF

The complex corrective structure that is developing the USDCHF pair in the 2-hour chart shows a signal more for a bullish continuation than a downward reversal move. In the last session, the Swiss currency tested and bounced from the potential buy zone. We foresee USDCHF making a new higher high with the target placed in the area between 1.0112 and 1.0141. Invalidation level is at 0.9857.


EURJPY

The EURJPY cross in the 2-hour chart is moving bullish in an ascending wedge; the price tested the exhaustion zone between 132.01 and 133.05, from where we expect a bearish reversal move as a bull trap. We foresee drops to the area between 129.87 to 129.28. Consider that if the price makes a bull trap after this, it is highly likely that the price will make a bullish failure pattern.


GBPJPY

The GBPJPY cross in the 2-hour chart is making a consolidation pattern after a bullish impulsive move, which could make fresh highs to the area between 150 and 150.70. Our vision for the cross is that the price could make a limited low to the 146.2 level before it continues its previous bullish trend. Invalidation level is 143.799.


FTSE 100

As commented in previous Daily Update, FTSE 100 in the 2-hour chart continues consolidating between 7,720 pts and 7,550 pts. We maintain our bias as neutral in FTSE 100 index.


DAX 30

DAX 30 in the 2-hour chart soared above the 12,600 pts and is near to reaching the exhaustion zone at 12,695 pts. The next control level is 12,807 pts which could drive to 13,020 pts, completing an internal bullish cycle. Invalidation level of the bullish cycle is 12,104 pts.


Categories
Forex Market Analysis

Forex and Indices Daily Update – 16.07.18


Forex Fundamental Analysis


New Zealand CPI (YoY) increase 1.5 per cent in June.

The yearly inflation change in New Zealand increased by 1.5 per cent, below the 1.6 per cent foreseen by analysts and advance from the 1.1 per cent reported in April. Housing and household utilities advanced 3.1 per cent, followed by rentals which were up 2.5. The climb in oil prices, almost 10 per cent, boosted the transport sector to increase the CPI (YoY) 2.0 per cent.


source: tradingeconomics.com


 Technical Market Analysis


EURUSD

In the last session, EURUSD surpassed the Short-term Pivot Level at 1.1690. Now we expect a consolidation structure as a flag pattern before it continues increasing the bullish momentum to the target area at 1.19067. Invalidation level is 1.15080.


GBPUSD

The GBPUSD pair is still moving sideways in the 2-hour chart, testing the Short-term Pivot Level at 1.3275. The breakout of this level should activate the bullish continuation with a target placed in the 1.3475 zone. Invalidation level of the new bullish cycle is 1.30494.


USDCHF

The bearish move after the bull trap looks like a first bearish impulse. From now we should expect a retrace in three waves, probably to the 1.0009 area before it continues with another decline. In the long term, the USDCHF is bullish, in consequence, we will maintain neutral for this pair expecting opportunities to go long with the main trend.


EURNZD

The EURNZD cross in the 2-hour chart has broken down the ascending short-term trendline at 1.7248 with a bearish high momentum candle. We expect more drops with a target placed at the psychological level of 1.70. Invalidation level is at 1.73782.


GBPNZD

The GBPNZD cross in the 2-hour chart has broken down the ascending trendline as the same way that the EURNZD has. This suggests that we should see more strength in the NZD group against the other currencies. The first target is at 1.92393 from where we could see an exhaustion of the bearish cycle. Invalidation level is at 1.95802.


FTSE 100

The FTSE 100 in the 2-hour chart continues to consolidate, developing a complex corrective structure. In terms of the traditional Technical Analysis, the structure could be a Diamond Pattern, if this is correct, we should see declines to the 7,400 area, if the falls extend, the next bearish target area could be 7,100 pts zone. We prefer to maintain neutral expecting for long positions.


DAX 30

DAX 30 in the 2-hour chart still is moving below the 12,600 pivot level. We can consider two scenarios: the first one is after the 12,600 level breakout to expect more climbs to the area between 12,695 to 12,742. The second one is if the price breaks down, the bearish target could be 12,040 pts. In the same way that in the FTSE, our position changes from bullish to neutral expecting long positions.


Categories
Forex Market Analysis

Forex and Indices – Daily Update – 13.07.18


Fundamental Forex Trading Overview


BoE’s Deputy Governor Cunliffe suggests a delay in a rate hike.

The Bank of England’s (BoE) Deputy Governor, Sir Jonathan Cunliffe, said on Friday that we should be cautious in an interest rate increase and that there are still arguments for a “stodginess” policy. Cunliffe suggests a delay in a rate hike due, despite the economic growth, to the wage rate is not increasing to the 3 per cent that the BoE had initially forecasted.

The BoE’s next Monetary Policy Committee meeting will be on August 2, for this meeting most economists polled expect the rate to increase.


Technical Analysis


 EURUSD

The EURUSD in the 2-hour chart is bouncing from the Potential Buy Zone as expected in our previous Daily Update on Thursday 12th when we commented that EURUSD was making higher highs and higher lows. Now when the pair is testing support in the green box, we expect new upsides to 1.19067 (orange box – maturity area) completing a major degree connector. Invalidation level is 1.15080.


GBPUSD

The GBPUSD in this 2-hour chart is completing a new bearish leg in the Potential Buy Zone. We foresee a breakout of the short-term trendline and the continuation of the previous bullish cycle with a target placed in the 1.3475 area. Also, the exhaustion area is the target area of the inverted head and shoulders pattern which will be active once time the short-term pivot level was surpassed. Invalidation level of the new bullish cycle is 1.30494.


USDCHF

As noticed in our last Forex and Indices daily update, the Swiss currency is being the weakest currency. The USDCHF in the 2-hour chart soars to the highest level since May 2017. Using the correlations in the US Dollar group with DXY, EURUSD and GBPUSD, we could suspect that this is a false breakout.


EURCAD

The EURCAD cross in the 2-hour chart has broken down the short-term pivot level at 1.53684 and made a pullback to the same level turning the support into resistance. We expect more falls with a target placed in the area between 1.5144 to 1.5061. Invalidation level is 1.55225.


GBPCAD

The GBPCAD cross in the 2-hour chart is consolidating testing the 1.73 psychological support level. It is likely that the price moves bullish making a false breakout before to continue the previous bearish impulse. Invalidation level is at 1.76907.


FTSE 100

The FTSE 100 in the 2-hour chart continues to consolidate, developing a complex corrective structure and testing around the 7,700 level. We foresee a limited upside for the British index to 7,792 pts. Invalidation level is 7,508.


DAX 30

The DAX 30 in the 2-hour chart is moving bullish, testing the 12,600 pivot level. We expect more climbs to the area between 12,695 to 12,742. The critical level to watch is the 12,807 pts, from where if the price surpasses it, DAX could rise to 13,020 pts. Invalidation level is 12,104.


Categories
Forex Market Analysis

U.S. Inflation Grows Firmly In June – Forex and Daily Update – 12.07.18


Fundamental Overview


U.S. inflation grows firmly in June.

Forex Trading Signals: The Consumer Price Index (YoY) in the United States in June reached the highest level in 6 years, climbing to 2.9% from the 2.8% reported in May. According to what was stated by the U.S. Bureau of Labor Statistics, the CPI in June increased driven by the food index, which advanced 0.2 per cent; and the gasoline index, which grew by 0.5 per cent. Despite this increase, the energy index decreased 0.3 per cent, mainly due to the Energy Services index, which fell 1.5 per cent in June.

Forex trading signals Source: Forex Trading Signals – Forex.Academy Collection


Technical Overview


EURUSD

The EURUSD 2-hour chart is showing bullish signals due to the price making higher highs and higher lows. Currently, the common currency is making a retrace to the green box, from where we expect new upsides to the 1.19067 area, completing a major degree connector. Invalidation level is 1.15080.


GBPUSD

The GBPUSD 2-hour chart is making a new bearish leg after the upward sequence in 5 moves started on June 28th. We expect a continuation of the previous bullish cycle from the zone between 1.3181 to 1.3099 with a target placed on 1.3475 area from where the pound should decide the next moves. Invalidation level of the bullish cycle is at 1.30494.


USDCHF

The USDCHF 2-hour chart is making a breakout of the consolidation range which is developing from the first half of June. The RSI oscillator shows that price has a bullish bias. In the short-term, we expect a limited retrace to incorporate to the bullish long-term trend. The invalidation area is 0.98579.


EURCHF

The EURCHF cross in the 2-hour chart is moving bullish after the breakout above 1.1565 level. We expect more upsides which could drive the cross to the targets at 1.1768 in the short-term, and 1.19475 in the long-term. Invalidation level is 1.14799.


GBPCHF

The GBPCHF cross has broken up the psychological 1.32 resistance. We expect a retrace to the area between 1.319 until 1.31057, from where the price should continue rising to 1.3312 level in the short-term and the 1.3442 level in the mid-term. Invalidation level is 1.3023.


FTSE 100

FTSE 100 in the 2-hour chart continues moving sideways in a complex corrective structure, but the main trend is bullish. We expect a limited upside to 7,792 level, from where we should wait for a new connector completion. Invalidation level is 7,508.


DAX 30

The DAX 30 is bouncing from the Potential Buy Zone (green box), from where we expect an upward movement to the area between 12,695 to 12,742. If DAX climbs above 12,807 pts, the German index could reach and test the 13,020 level resistance. Invalidation level is 12,104.


Categories
Forex Market Analysis

Forex and Indices – Daily Update – 03.07.18


Fundamental Overview


Asian Session with all eyes placed on the RBA decision.

Forex and Indices: In the Overnight session, markets will place their eyes on the Board of Reserve Bank of Australia (RBA) interest rate decision in which the analysts’ consensus expects that Governor Philip Lowe and the Board members decide to keep the interest rate at the record low 1.50% which is unchanged since August 2016.

Despite the unemployment rate drop in May to 5.4%, and the inflation rate kept unchanged in May at 1.9%, being near to the RBA inflation target; The cooling on housing market and  the increased volatility in global markets due mainly to the tariffs conflicts, could drive to the RBA  to decide to keep the interest rate unchanged again.

Forex and Indices - Daily Update

Source: Forex.Academy Collection – Forex and Indices


Technical Analysis


EURUSD

The pair still is moving in a bearish wedge pattern which, if it breaks below 1.15649, could drive the price to a new lower low ending the bearish cycle near to the 1.1450 zone coinciding with the lower trendline of the bearish wedge. In the opposite case, if EURUSD breaks above 1.16801, the common currency could drive to test the invalidation level placed at 1.1852.


GBPUSD

GBPUSD is still running in a bearish wedge and has a new lower low pending before the cable starts a new bullish cycle. This lower low could be developed as a Bullish 2B pattern (Bear Trap) as a reversal pattern. As long as the price does not make a reversal pattern, the price will continue its bearish bias. Invalidation level of the bearish cycle is at 1.34725.


USDCHF

USDCHF is developing a triangulation structure. The RSI oscillator shows that the price has a bearish bias. However, as the price doesn’t have a definite trend in the short-term, we will expect a false breakout before we define our bias for this pair. In the long-term, the Swiss currency is consolidating a rally which started on February 15th, 2018.


EURAUD

The EURAUD cross maintains a bullish bias, due to the price moving inside an ascending wedge. Additionally, RSI is running in an ascending trend and is above the 60 level. We can expect a false breakout to the 1.59 zone before it completes the bullish cycle. If the price falls below 1.5702, we could evaluate short positions.


GBPAUD

The GBPAUD 2-hour chart shows a sideways move, as long as the price moves above 1.78747. The cross will have a last bullish target pending, placed at 1.8085 with an invalidation level below 1.78080, from where we will consider short positions with a profit target in the 1.74 zone.


FTSE 100

The FTSE 100 is moving sideways as a complex corrective structure consolidating the March to May rally. In the middle of global volatility in the stocks markets, we prefer to consider long positions rather than the short positions. The short-term support to control is 7,500 pts.


DAX 30

The DAX 30 2-hour chart shows that the German index has found support at 12,100 pts. From this area, we could start to propose potential zones for entry in the long side.


Categories
Forex Market Analysis

Forex and Indices – Daily Update – 29.06.18


Fundamental Overview


“Green sprout” in New Zealand?

Forex Market Update: The increase in building consents in New Zealand which reached 3,407 permits in May, the highest level reached since June 2004, represents 7.1% after the fall of 3.6% registered in April. Will this be a green outbreak of improvement in New Zealand’s macroeconomic conditions or will it be only an isolated effect?


Forex Market UpdateSource: Forex.Academy Collection – Forex Market Update


Technical Analysis


EURUSD

The pair is moving in a bearish wedge pattern which could drive to the price to a new lower low ending the bearish cycle near to the 1.145 zone coinciding with the lower trendline of the bearish wedge. Invalidation level of the downward cycle is at 1.18523.


GBPUSD

GBPUSD is moving in a bearish wedge in the same way as the EURUSD. We expect a spike to the PRZ before it makes a reversal move, maybe in the next week. A key level to watch out for is 1.30 as a psychological level. Invalidation level of the bearish cycle is at 1.34725.


USDCHF

The Swiss currency is moving in a triangulation structure which represents a continuation of the previous bullish move. However, as an inverse correlation with EURUSD, the movement could be a false breakout as a bull trap. In this pair, we will maintain in a neutral position before taking a position in the market.


EURCHF

The EURCHF cross is turning bullish after the breakout above the 1.1565 level, a throwback to this level could drive the cross to the 1.1772 short-term targets. RSI is supporting this scenario with the upward trendline.


GBPCHF

The GBPCHF 2-hour chart shows the importance of the invalidation level of a proposed scenario and its ex-post analysis. In this cross, we expected a limited retrace to the area between 1.3124 and 1.3089 for an upward move, with the profit target in the area between 1.3323 and 1.3374. However, after the retrace to the blue box, the GBPCHF cross continued falling. Watching the AO oscillator between May 18th and June 1st, we can appreciate that the bearish move corresponds to a bearish wave 3, then the retrace analysed is a wave 4. In consequence, the final movement as a bearish wedge pattern, which should end the bearish cycle.


FTSE 100

The FTSE 100 is moving sideways with a bearish bias which is correcting the previous rally realised from March to May. Despite the bearish bias of global indices, we prefer to avoid the short positions expecting the timing for entry in the bullish side.


DAX 30

In the Thursday 28th trading session, DAX 30 fell to the control level finding support to the corrective move. Now we expect consolidation on the 12,100 pts from where the German Index could start a new bullish cycle.


Categories
Forex Market Analysis

Good News Expected for RBNZ Decision – Forex and Indices – Daily Update – 27.06.18


Fundamental Overview


Good News Expected for RBNZ Interest Rate Decision.

During the overnight session, Stats NZ released the Trade Balance data from New Zealand, which shows an improvement in the commercial situation in June. Exports of meat grew by 17% reaching $817M. While the meat exported increased by 12 per cent reported Stats NZ, the destination of the main export was China, which rose by 27 per cent reaching $1.2B in June. The European Union exports also increased rising by 17 per cent ($664M).

On the other hand, vehicles, parts, and accessories led imports by 25 per cent, climbing to $924M. Whereas, Oil imports were reduced by 30 per cent, falling to $455M in May.

rbnz interest rate decision

Source: Forex.Academy Collection.


Technical Analysis


EURUSD

EURUSD is making the retracement of the first impulsive move testing the blue box from where the euro could start the continuation of the previous movement. RSI is testing support above the 40 level, which makes us suspect that the EURUSD pair could be testing support. Our mid-term vision is that the common currency could beat 1.1853, even reaching the target placed at 1.19467. Invalidation level is at 1.1508.


GBPUSD

The GBPUSD pair is still consolidating the previous impulsive move in the descending long-term trendline. The price is moving in the Potential Reversal Zone (Blue Box) from where we expect the bullish reaction as a continuation of the previous movement. We foresee fresh highs with the target at 1.3443. Invalidation level is at 1.31020.


USDCHF

USDCHF is moving slightly bullish consolidating in the long-term ascending trendline. Our main vision for USDCHF is the formation of a flag pattern reaching the 0.99277 level before continuing with the previous bearish move with a target placed on the area between 0.97225 and 0.96495. Invalidation level of this scenario is at 0.99909.


EURNZD

EURNZD continued developing a bullish impulsive move. As we forecasted in a previous Daily Update (June 20th, 2018), the cross is moving near to the target area at 1.7064. Still, we foresee a more upside to the 1.7148 level. Invalidation level is 1.6572.


GBPNZD

GBPNZD still is moving in an ascending channel to the Potential Reversal Zone proposed in our Daily Update for June 20th. The price could reach the target between 1.944 and 1.958 area, from where the cross should complete a bullish cycle. Invalidation level is 1.8909.


FTSE 100

The FTSE 100 index bounced from the sell-off performed on the Monday 25th trading session; despite this bounce, we expect more dips. FTSE should reach at least the 7,468.3 level before it completes the short-term bearish cycle. From this zone, we could build a new bullish connector. If the index breaks down, the Control Level is likely to reach from the 7,182 level to 7,073 area. Watch out for the RSI which is moving sideways between the 40 and 60 level; this coincides with the consolidation pattern that still is running. Invalidation level of the bearish scenario is 7,793.5.


DAX 30

DAX 30 is testing support on the PRZ forecasted at 12,238 pts. The RSI level at 26 makes us foresee that the German index is developing a wave three. In consequence, more downsides are pending; likely DAX 30 plunge below 12,100 pts. Invalidation level of the bearish cycle is at 13,170 pts.


Categories
Forex Market Analysis

Forex and Indices Daily Update 25.06.18


Fundamental Overview


Understanding the Conference Board (CB) Consumer Confidence Index (CCI).

Tomorrow, the U.S. CB Consumer Confidence Index will be released. This reflects the business conditions and likely developments for the months ahead. The report is issued monthly and is a barometer of the health of the U.S. economy from the perspective of the consumer.

The current CCI level reported in May is 128 pts, and the analysts’ consensus for June is a decrease to 127.6 points. The decreasing could be attributed to the protectionist policy which the Trump Administration is boosting. Despite this decline, consumer confidence keeps having record highs. The highest level reached in the year is 130 pts, the record high since December 2000.

CCI level -forex daily chart trading strategy

Forex Daily Chart Trading Strategy


Technical Analysis


FOREX DAILY CHART TRADING STRATEGY

EURUSD

Since June 22nd, the EURUSD has made an impulsive move reaching the short-term target area between 1.17043 and 1.17617. Our vision is that the common currency could strike the 1.1853 level before it starts a brief retracement to the area between 1.1679 and 1.15892, from there, the price should make a new rally with a target placed at 1.19467. Invalidation level is at 1.1508.


GBPUSD

GBPUSD bounced on June 21st aided by the Bank of England monetary policy decision. Now the price is consolidating the previous impulsive move. We should see a limited fall in three waves to the area between 1.3237 and 1.3165, from where we foresee fresh highs with the target at 1.3443. Invalidation level is at 1.31020.


USDCHF

The USDCHF pair is testing the long-term ascending trendline. Our forecast for USDCHF is that it could make a flag pattern reaching the 0.99277 level before we see the continuation of the previous move with a target placed on the area between 0.97225 and 0.96495. Invalidation level of this scenario is at 0.99909.


EURJPY

The EURJPY cross is moving in a corrective structure as an A-B-C Pattern, which could make a new lower low. RSI Oscillator is running supported by an ascending trendline refecting the corrective structure of the principal trend. We foresee a new bearish move to 124.94 and 126.62; this area converges with the ascending long-term trendline from where EURJPY could start a new rally. Invalidation level of the bearish cycle is 130.347.


GBPJPY

The GBPJPY cross is building a consolidation pattern as a flag pattern, which could make fresh highs to the area between 149.34 and 150.70. Our vision for the cross is that the price could reach the bearish mid-term trendline before it collapses to the lower line of the ascending channel completing a bearish flag pattern of major degree. The next key support is 143.209, invalidation level of the main bearish cycle is at 152.775.


FTSE 100

The FTSE 100 index started the week by falling for the sixth consecutive week. In this session the British index broke down the key support at 7,548, the low reached on June 18th. As we forecasted, FTSE continues their selloff approaching the Potential Reversal Zone in the 7,400 area, from where FTSE could build a new bullish connector. If the index breaks down, the Control Level is likely, that reaches from 7,182 level to 7,073 area. Invalidation level of the bearish scenario is 7,793.5.


DAX 30

DAX  30 is moving bearish in the same way that FTSE 100 is developing a Dead Cat Bounce Pattern. Today, the German index has fallen to the Potential Reversal Zone forecasted, from now we are cautious because the index could start to bounce. The price action, and RSI Oscillator and Awesome Oscillator do not show divergences or reversal signals. To summarise, the short-term bias is bearish. Invalidation level of the bearish cycle is at 13,170 pts.


Categories
Forex Market Analysis

U.S. Housing Starts Soars – Forex and Indices – Daily Update 19.06.18


Fundamental Overview


U.S. Housing Starts soars to 2007 highs in May.

Daily Forex Technical Analysis: The U.S. Housing Starts surged 1.35 million in May, the highest level in near to 11-years and over the 1.31 million forecasted. Building permits fell to 1.301 million, under the 1.35 million expected by the analysts.

This buoyant data is attended by the housing market sentiment which fell to 68 points in June from the 70 points reported in June. This decrease in the homebuilder’s sentiment is produced mainly by the rising costs in lumber prices.

On the other hand, the 20-City Home Price Index in the US reported by S&P/Case-Shiller in May soared to the record high 208.62 points, the highest level previous to the 2008 financial crisis.


Daily Forex Technical Analysis


EURUSD

Tha pair EURUSD is moving sideways finding to test the May 29th level support at 1.15102, and it looks like the price is making a bottom pattern. For it to place us on the bullish side in EURUSD, we expect the short-term resistance breakout at 1.16445.


GBPUSD

The Pound broke down the low of the May 29 (1.32045 level)  losing the 1.32 psychological level. Now we expect that the price will complete the bearish cycle in the area between 1.3109 and 1.2936, from where the price should start to bounce at least to the 1.3298 level.


USDCHF

USDCHF is running bullish to the parity making a flag pattern. Our vision for the Swiss currency is that it could make a new bearish leg with a mid-term target on 0.98 level.


EURCAD

EURCAD is developing an expanding triangle inside an ascending channel; we expect that the cross makes a new high to the 1.555 area before we see more drops to the 1.49 zone.


EURAUD

EURAUD reached the mid-term target zone in the 1.57 area. We foresee that if the cross breaks down the short-term trendline, EURAUD will complete a flag pattern, which should drive to new lower lows, likely to 1.53 area.


DAX 30

DAX 30 is moving laterally in a major degree structure testing the long-term pivot level at 12,652.2. A breakdown of this level could drive the price to test the short-term support at 12,547.6, it could even fall to 12,300 area, from where we expect the start of a new rally.


FTSE 100

FTSE 100 broke down the May-29th low making a new lower low; this makes us foresee that the British index should see a new lower low, probably to the 7,400 area, from where FTSE should build a new bullish connector.


Categories
Forex Market Analysis

Forex and Indices – Daily Update – 12.06.18


Fundamental Overview


The exposure of the historic meeting and agreement reached between the U.S. President Donald Trump and the North Korean leader Kim Jong Un for the “denuclearisation” of the Korean peninsula have already been discounted. However, currently, the uncertainty is being headed by the statements of IMF’s Director Christine Lagarde, who has said that the escalation in trade tensions are affecting the global economy, commenting that clouds over global economy are ‘getting darker by the day’ after the G7 summit.

World Trade Organization General Director, Roberto Azevedo, also echoed the comments made by Lagarde adding that the increase in commercial tensions that we are witnessing involves a high economic impact, which can undermine the strength of economic growth since the last financial crisis.”


Forex Technical Analysis Signals


EURUSD

EURUSD is consolidating, developing a pennant pattern bounded by the levels 1.173 and 1.184. A breakout of this pattern could lead the price to the 1.196 level. Invalidation level keeps in 1.1616.


GBPUSD

GBPUSD moves in a corrective structure as a flag pattern testing the blue box area as a support level. The breakout of the 1.342 level should lead to the pound to 1.359 resistance. The invalidation level of this scenario is 1.3254.


USDCHF

The structure of the Swiss currency looks like an Irregular Flat Elliott Wave. If this scenario is valid, and for inverse correlation with EURUSD, the USDCHF pair could reach 0.99 level before it drops again. Invalidation level is 0.9983.


EURCAD

EURCAD moves inside a pennant pattern; we expect a breakout of this structure to lead the price to new higher highs at least to 1.5533 level where we foresee the start of a new downward move for to build a new bearish leg.


EURAUD

In the same way as EURCAD and EURUSD, the EURAUD cross is consolidating, but in this case, the price is moving inside a pennant pattern. In the short-term, if EURAUD breaks above 1.5621, we expect fresh highs that should reach the 1.5761 level. Invalidation level for this scenario is 1.5282.


DAX 30

DAX 30 continues driving sideways, in the current session it has touched the blue box reaching the 12,948 pts level, rejecting to the downside. We maintain our scenario on which a price decline below 12,652 pts should activate a bearish second leg, with a target of 12,000 pts. Invalidation level is 13,102 pts.


FTSE 100

A lateral channel of 112 pts bounds the FTSE 100; our vision is that the British index should make a false bullish breakout before continuing its previous downward movement to complete the corrective structure. The potential target is 7,390 with an extension at the 7,073 level. The invalidation level of the bearish scenario is 7,903.5.


Categories
Forex Market Analysis

Forex and Indices – Daily Update – June 07th, 2018

Forex and indices trading signals for the end of the trading session of June 07th, 2018 and short-term forecast for the coming sessions. In this issue, we make a follow-up of the price cycles of: EURUSD, GBPUSD, USDCHF, EURAUD, EURJPY, FTSE100 and DAX 30.


Hot Topics:


  • Pairs against the Greenback in key levels
  • Euro crosses close to make a second leg
  • European indices trading signals remain with bearish bias but are not activated.

Pairs Against The Greenback In Key Levels

EURUSD reached the 100% of equal waves in the 1.1831 level; this suggests is that the common currency should make a corrective move, probably to the area between 1.172 to 1.166 levels. The bullish target long-term is the area between 1.1889 to 1.194 levels. Invalidation zone is below 1.1616 level.


USDCHF reached the blue box zone from where we anticipate that the Swiss currency should start a bounce. For this pair, our position has changed from bearish to neutral.


GBPUSD, as expected in the previous daily update, is making a corrective move as a bearish connector, where we expect more rises to the pound. Short-term bullish target is between 1.3485 and 1.36 levels. Invalidation level is below 1.3254.


Euro Crosses Close To Make a Second Leg

EURJPY has reached our target area for the first cycle. By the Alternation Principle from the Elliott Wave Theory, we foresee a complex correction, probably a sideways structure. In principle, the correction could end near 128.6 level. From this zone, the price should pay its bearish divergence. As our readers could see in the chart, the corrective sequence is not tradeable (dashed line.) Invalidation level is 126.330.


For EURAUD we have two scenarios. The first scenario consists of the completion of the internal bullish cycle with the price reaching the 1.5547 level, where it could begin a corrective move. The second scenario is for the price to make a corrective sequence in three waves to the 1.5382 area, where the cross could start a rally to the 1.5547 level. If it soars above the Control Level at 1.5621, it is likely that the price would complete its internal bullish cycle in the zone between 1.57025 to 1.57612 level. Invalidation level is at 1.5282.


European Indices Remain With Bearish Bias But Are Not Activated

The FTSE closed the session in the blue box, the potential bearish move with the target in the area between 7,468 to 7,390.5 is active. If the British index breaks down and closes under the 7680, the bearish targets will be activated. The invalidation level remains above 7,803 pts.


In the same way, the DAX remains with a bearish bias short term, selling positions will activate only if the price breaks down and closes below 12,700 pts, with a profit target at 12,500 pts, and the potential extensions to deeper falls to 12,300 and 11,900 pts. Invalidation level remains above 13,102 pts.


Categories
Forex Market Analysis

Forex and Indices – Daily Update – June 06th, 2018

Hot Topics:

  • US Trade Balance Falls.
  • Euro raises supported by ending bonds debate.
  • European Indices Move Sideways.

US Trade Balance Falls

The US Trade Balance deficit falls in April to the lowest level for seven months, boosted by the shipments of industrial materials and soybeans.

GBPUSD continues moving higher, aided by the weakness in the Dollar Index. For the coming sessions, we expect that the price makes a bearish connector, probably in the 1.348 zone before it sees new higher highs. Invalidation level is at 1.3254.

Today Forex Market Analysis


The USDCHF pair still moves sideways above the bullish long-term trendline. If the price breaks down the trendline, we expect more dips. In the first instance to the target should be 0.9783; in the second instance, the next support is 0.9725. Invalidation Level is 0.9983.


Euro Raises Supported by Ending Bonds Debate

In the next week, the ECB could start to debate the end of their bonds buying said Peter Praet, the ECB chief economist. This is not the first signal of the QE ending, on May 29th, the ECB member Sabine Lautenschlaeger noted that “June might be the month to decide once and for all to gradually end net asset purchases by the end of this year.”

EURUSD continued rising after the flag breakout and supported by the macroeconomic data. The next resistance levels are 1.1889, 1.19635 and 1.2102. Invalidation level is updated to 1.1616.


EURJPY continues its rally that started on May 29th when it tested the support 124.621. The first corrective structure it developed was brief, this move makes us suspect that the rally continuation could lead to the 132 to 133 area. In the short-term, the cross could see the 130.270 level for bringing steps to a consolidation structure before it continues the bullish cycle. Invalidation level is 126.330.


EURNZD is making a bullish connector inside a bearish major degree structure. Our vision is that the price could visit the area between the 38.2% to 50% of Fibonacci Retracement before it continues its downtrend. In the short-term, the price made a breakout of the 1.6713 level; this move could lead the price to areas between 1.6866 as first resistance and 1.6947 as the second resistance. Invalidation level is below 1.66.


European Indices Move Sideways

The FTSE 100 is moving in a range between 7,680 and 7,720, expecting more volatility. The price could make a limited high completing an A-B-C pattern before it continues the bearish cycle.


The DAX 30 is running sidelong but could complete three waves move in the zone between 12,946 to 13,014 pts before it continues the bearish sequence started on May 23rd, with the bearish target in the 12,528 pts area. If the price plunges below 12,386, the DAX could complete the bearish cycle near to the 12,000 pts. Invalidation level is updated to 13,102.7 pts. In case that price breaks above this level, the next bullish target is 13,250 pts.


Categories
Forex Market Analysis

Forex and Indices – Daily Update – June 05th, 2018


FOREX MARKET NEWS AND ANALYSIS

Hot Topics: 

  • U.K. PMI Services helped the Pound Group to Show Reversal Signals.
  • Main Pairs Against the US Dollar Keeps Consolidating.
  • European Indices Close Lower.

U.K. PMI Services helped the Pound Group to Show Reversal Signals.

PMI Services in May reached 54 pts, the highest level for three months. After the data release, GBPUSD raised to 1.34 level. Now we expect a corrective move before a new bullish cycle. Invalidation level remains at 1.32544.


As we expected in our last Daily Update, GBPAUD made a bullish move from the second weekly support to the weekly pivot level direction. Now after the impulsive move, we expect that the price could make a consolidation move as a flag pattern before proceeding with its previous movement.


GBPNZD is making a potential bottom structure if the breakout of the 1.91286 level activates the figure, with the profit target at 1.93377. We are surveilling the 1.9005 level as Control Level.


Main Pairs Against the US Dollar Keep Consolidating.

The common currency still is developing a consolidation structure after the impulsive move started in the previous week. RSI has found support at the 41.69 level which makes us foresee a new clue for the bullish reversal move that could be starting.


The inversely correlated currency with the Euro and Swiss Franc is also making a sideways consolidating structure. We expect more declines for this pair; our first bearish target is 0.9815, the second target is 09783 level. Invalidation level is 0.9983.


European Indices Close Lower.

The FTSE 100 broke down the ascending flag pattern in the blue box. The invalidation level remains at 7,803 pts. In the same way, the RSI has broken down its ascending flag pattern. The British index could visit the 7,500 level, or if it moves below this level, the FTSE could make a second leg down before a new bullish cycle.


DAX 30 has made the same breakdown in the ascending wedge pattern. RSI also has broken down its ascending wedge. The first bearish target is 12,528. In case that price falls below 12,386, the next bearish targets are 12,125 and 11,990.


Categories
Forex Market Analysis

GBPUSD & EURUSD Reversal Based On Gann’s 49-Day Cycle


Most people associate Gann’s work with angles and the Square of 9. What most people are not aware of is his day counts and specific time cycles, which are arguably more important than his market geometry. One of the most important cycles he discussed was the 45-day cycle and the 49-day cycle. The number 7 is very important in Gann analysis, and 49 days is 7 days x 7 = 7 weeks. He called this the ‘Death Zone’ – a cycle which ends trends and blow-off moves. Based solely on this cycle alone, we can predict a strong corrective move.

Categories
Forex Market Analysis

Forex and Indices – Daily Update


Hot Topics: 


  • Major currencies show bullish signals against the greenback.
  • Indices recovers but more falls are expected.
  • Pound crosses could turn bullish.


Major currencies show bullish signals against the greenback.

Forex Daily Market Update

The EURUSD broke up the flag pattern testing the 1.17 level resistance. Now the price is making a throwback to the congestion area. RSI also is showing bullish signals with the breakout and test to the flag structure.


GBPUSD looks like as its turning bullish. On the one hand, the price is making higher highs and higher lows. On the other, the RSI found support above the 40 level; this signal makes us foresee that a turning movement is near for the pound.


USDCHF is in a congestion zone between 0.9845 and 0.989. We expect a new bearish move to the region between 0.9784 and 0.9815. The shape of the price sequence that started on May 9th looks like a consolidation structure and is likely that the price could see new highs.


Indices recovers but more falls are expected.

FTSE 100 is recovering from the last selloff but is moving in the Potential Reversal Zone. RSI moves in an ascending channel but it still didn’t break the key level 60 to show bullish signals. Invalidation level is above 7,803.5.


In the same way as the FTSE, the DAX is moving in a consolidation structure as an ascending wedge. RSI is moving in the 51.53 level, but it doesn’t mean that in the short-term the trend is bullish, it suggests that the bias remains bearish and the price is making a retracement. Invalidation level is above 13,040.6.


Pound crosses could turn bullish.

GBPCAD is moving sideways and tested the monthly pivot level at 1.73191 becoming a relevant resistance. We think the cross could make a new low near the first weekly support at 1.71310, where the price could start a bullish cycle with a profit target at the weekly second resistance confluence area on 1.7510. Invalidation level is placed below 1.7065.


GBPAUD  has been moving mostly bearish during this session, but we expect that the price could make a bullish reversal move in the area between 1.7360 and 1.73195, where it could bounce from, with the eyes placed on the weekly pivot at 1.76242. Invalidation level is below 1.725.


Categories
Forex Market Analysis

Indices Broke Down Their Bullish Trendlines

Hot Topics:

  • Indices Broke Down Their Bullish Trendlines.
  • Euro Group Close to Find a Short-Term Bottom.
  • US Dollar Climbs Before Minutes Release.


Indices Broke Down Their Bullish Trendlines

Trend Line Analysis: Indices in the early trading hours of the session opened lower breaking down its bullish trendlines. However, FTSE and DAX did not crumble below their invalidation levels. Likely, both indices could make a 1-2-3 pattern. Invalidation level in FTSE is at 7,753.3 points.


On the other hand, DAX has paid its bearish divergence in 12,958 points, as said in a previous Daily Update. Invalidation level of the bullish structure is at 12,918. We expect the German index to have a consolidation structure and reveal the new potential move.


Euro Group Close to Find a Short-Term Bottom

The Euro group, in general, is moving bearish. Currently it is consolidating and showing signals of a potential reversal; however, we expect a brief price recovery, to then see more downward moves long-term.

EURUSD continues its downtrend and has two new potential bearish targets in the short-term: 1.16734 and 1.15637. From this zone, the pair could create a new bullish connector. Invalidation level is moved at 1.18298.


EURAUD continues above the Control Level and is moving sideways. For the oceanic cross, we have two scenarios:

  • First scenario: the price breaks below the control level and finds new lower targets in 1.53074 or 1.52952.
  • Second scenario: the price breaks above the invalidation level at 1.56192 and sees new highs, the first resistance is 1.57233 level.


EURCAD is bouncing from the first bearish cycle target level at 1.50373. The invalidation level for this bearish cycle is 1.51385. If the price breaks above this level, the price could see the 1.5533 level again.


US Dollar Climbs Before Minutes Release

Trend Line Analysis: The US Dollar Index raises at the halfway point of the trading session while it waits for the Minutes of the FOMC. GBPUSD still moves at the potential reversal zone, where the price should make a new connector. Invalidation level of the bearish sequence is 1.34918.


In the same way, the USDCHF moves higher making a pullback to the breakdown zone. Probably, the pair will move higher as an ascending A-B-C pattern before to collapsing again, building a new leg long-term. Invalidation level of the bearish cycle is at 1.00561.


Categories
Forex Market Analysis

Negotiations Between US-China Support Indices Advances

FINANCIAL MARKET UPDATE TODAY

Hot Topics:

  • Indices continue soaring boosted by US-China negotiation progress.
  • UK Government seeks to pay its national debt.
  • The price action between EURUSD and USDCHF show divergences.
  • EURCAD and EURAUD are moving on critical zones.

Indices continue soaring boosted by U.S.-China negotiation progress

The advance in negotiations between the U.S. and China maintain the optimism in markets for the second consecutive session. The FTSE 100 consolidated in the record highs. Despite the fact that RSI shows a little bearish divergence, this does not mean a reversal sign of the trend. We keep our bullish vision for the FTSE in 8,000 pts as the next target.


DAX 30 adds to the market optimism by the progress between the U.S. and China negotiations. The index climbs near to the first target level proposed in previous updates (Daily Update – May 15th). The RSI oscillator does not show movement exhaustion signals.
– First target level 13,250.5.
– Second target level: 13,497.7.
– Invalidation level: 12,918.3


UK Government seeks to pay its national debt

The UK Government will appeal to the High Court for access to a National Fund untouched since 1928 to pay its National Debt. The “National Fund” was opened in 1928 by an anonymous donation of £500,000 with the condition that it must keep untouched until the U.K. have enough money to pay its national debt entirely. Currently, the fund ascends to £475 million, but the U.K. debt rises to £1.7 trillion.

The pound is moving sideways, in this session has tested the 1.348 resistance. RSI shows bullish divergences signals; we expect that the RSI moves above the 60 level for it to start to change the current bearish bias to bullish. Consider that the price action must confirm the new bias. For the moment we maintain neutral our position in GBPUSD.


The price action between EURUSD and USDCHF show divergences

USDCHF is moving bearish and has paid its bearish divergence falling to the 0.99203 level. It is likely that the price continues moving bearish to 0.9875 and start to bounce for it to make a new connector for a major degree bearish cycle. Invalidation level remains on 1.00561.


On the other hand, EURUSD keeps moving sideways. In the current session, the common currency has tested the resistance level at 1.18257 without success. However, RSI is showing reversal signals but it is necessary that the oscillator breaks above the 59.06 level and the price soar above the key resistance level 1.18257. Invalidation level is below 1.1717.


EURCAD and EURAUD are moving on critical zones

EURCAD has touched the first long-term bearish target level at 1.50373. The RSI oscillator shows bullish divergences as a bearish trend exhaustion signal. Now is the time to expect what the price action does, if the cross moves to the second long-term bearish target at 1.4866 or makes a reversal pattern. In this zone, our position turns from bearish to neutral.


Similarly to EURCAD, EURAUD moves below our second bearish long-term target placed in 1.5552 level. RSI shows bullish divergence as weakness in the bearish cycle. Now we are watching the control level in 1.54673, and waiting to see what will the price action will do. We have two scenarios:

– First scenario: The price breaks below the control level. In this case, it is likely that the cross continues its bearish momentum. For this scenario, the new bearish targets are placed at 1.5307 and 1.5195 levels. Invalidation level is 1.57279.

– Second scenario: The price makes a bullish reversal pattern, in this case, we have 1.5727 as the target.


Categories
Forex Market Analysis

Forex and Indices – Daily Update May 17th, 2018


Hot Topics: 


  • Main currencies consolidate levels against the Dollar.
  • Is a new strength cycle to the Euro upcoming?
  • Indexes continue rising

Main currencies consolidate levels against the dollar.

EURUSD

EURUSD continues to move laterally in a potential reversal zone. We still expect the price to visit the level 1.1737 as a cheat pattern (see 2B Pattern), before making a new bullish cycle.

Daily Forex Market Update


GBPUSD

GBPUSD continues to consolidate around the 1.35 level; we foresee that the price could create a false break down to 1.3423, from where it should make a connector and start a bullish process, probably as an ABC.


USD/CHF

USDCHF continues to move laterally in the parity zone without showing signs of change. By its correlation with EURUSD, we cancel the scenario proposed of the potential double top, and we project a last bullish movement, which could reach 1.0101.


Is the new cycle of strength for the Euro upcoming?

EURCAD

After breaking down its bullish trend line, we expect that the EURCAD can make a new lower low in the area between 1.5037 to 1.4866. In case it falls below 1.4818, which corresponds to our level of invalidation of the main upward cycle, we could see deeper declines to the 1.4519 level.

Daily Forex Market Update


EURAUD

EURAUD continues consolidating at its potential reverse zone, as in the case of EURCAD. We anticipate that the cross could make a new lower low at 1.5610 before returning to create a new bullish move. If EURAUD goes below 1.5467, the price could see more drops in the area between 1.5037 and 1.5159.


Indexes continue upwards.

FTSE

FTSE 100 continues its bullish rally for the eighth consecutive week and is approaching record highs reaching 7,788.2 points. It is likely that we will see the British index reach the psychological barrier of 8,000 points and may even reach 8,155 points.


DAX

As we mentioned yesterday, DAX broke up the consolidation structure and goes towards the 13,250 points, pending bullish objective level to reach. While the index does not complete its bullish cycle, all indices will continue with the bullish momentum.


Categories
Forex Market Analysis

Forex and Indices Daily Update – May 16th, 2018

Hot Topics:

  • Currencies against the Dollar could be completing internal cycles.
  • EURAUD – Closing partials and moving SL.
  • GBPNZD – More falls are expected.
  • Indices continue consolidating.

Currencies against the Dollar could be completing internal cycles.

Forex and Indices Market Update: EURUSD continues to move below 1.18 and bouncing within the potential reversal zone. However, it still shows no signs of changing the trend. It should be noted that the Dollar Index has completed an internal cycle which should begin to correct soon. For the pair, we maintain a neutral position.


In the same way, GBPUSD continues to move within a sideway range towards the zone of a potential reversal from where we expect it to begin to bounce.


Without significant changes, the Swiss Franc (USDCHF) continues moving sideways around the parity level; the current movement makes us speculate that there could be a limited upward move as a false breakout.


EURAUD – Closing partials and moving SL.

Forex and Indices Market Update: The EURAUD cross has reached the first level of the potential reversal zone at 1.57236, fulfilling the conditions of the completion of an internal cycle. Additionally, EURAUD has touched the long-term uptrend line and would be forming a bearish channel structure. The bearish bias persists, and the price could reach 1.5610. We still maintain our short positions and move the invalidation level to 1.5888. Now is time to make partial closes in open trades.


GBPNZD – More falls are expected.

Forex and Indices Market Update: The GBPNZD cross is moving within a consolidation structure with a bullish bias. Our outlook is that the price could make a new low in areas from 1.9388 to 1.93049, this area coincides with the long-term trend line. In case of breaking below 1.93, we could see more falls with a target at 1.905 level.


Indices continue consolidating.

Forex and Indices Market Update: The German DAX 30 index continues moving in a range between 12,918 and 13,034 points. We expect a new upward movement to complete the ascending wedge structure that could be in the form of a false breakout. The AO oscillator is showing a bearish divergence, which indicates a price exhaustion signal which could support our bullish target forecasted at 13,250 points.


The FTSE 100 shows the same situation; the British index is also consolidating in the upper part of the ascending wedge. For the moment we remain neutral in indices expecting a new trading opportunity.


Categories
Forex Market Analysis

EUR Moving Sideways, UK PMI Services Rebound, and DAX Bearish

Hot Topics:

  • UK PMI Services rebound from the lowest level for 21 months.
  • DAX is moving bearish as commented previously.
  • The Euro stagnates while waiting for employment data release of the United States.
  • EURCAD: Follow-up of the bearish cycle continuation.

UK PMI Services rebound from the lowest level for 21 months.

Business activity in the United Kingdom increased modestly in April reaching 52.8, bouncing from 51.7, the lowest level recorded 21 months ago. Chris Williamson, Chief Business Economist at IHS Markit, noted that “The economic growth rate remained decelerated moderately at the start of the second quarter.” Finally, he added that “the performance of the economy has continued to deteriorate”.

The FTSE 100 index has reacted downwards from our potential reversal zone, breaking down the rising wedge pattern, where we are already positioned short (Suggested in advance to our premium members).

The pound continues with the bearish bias consolidating below 1.36. We still expect sterling to make a new low in the area from 1.35 to 1.3481. The level of invalidation of the bearish bias is above 1.365.

DAX is moving bearish as commented previously.

The DAX 30 follows the bearish bias in a similar way the FTSE 100 did. This corrective move was also commented to our subscribers in our previous updates. We expect the German index to move down to the 12.622 pivot level, which by traditional technical analysis, should switch from resistance to support.

The Euro stagnates while waiting for employment data release of the United States.

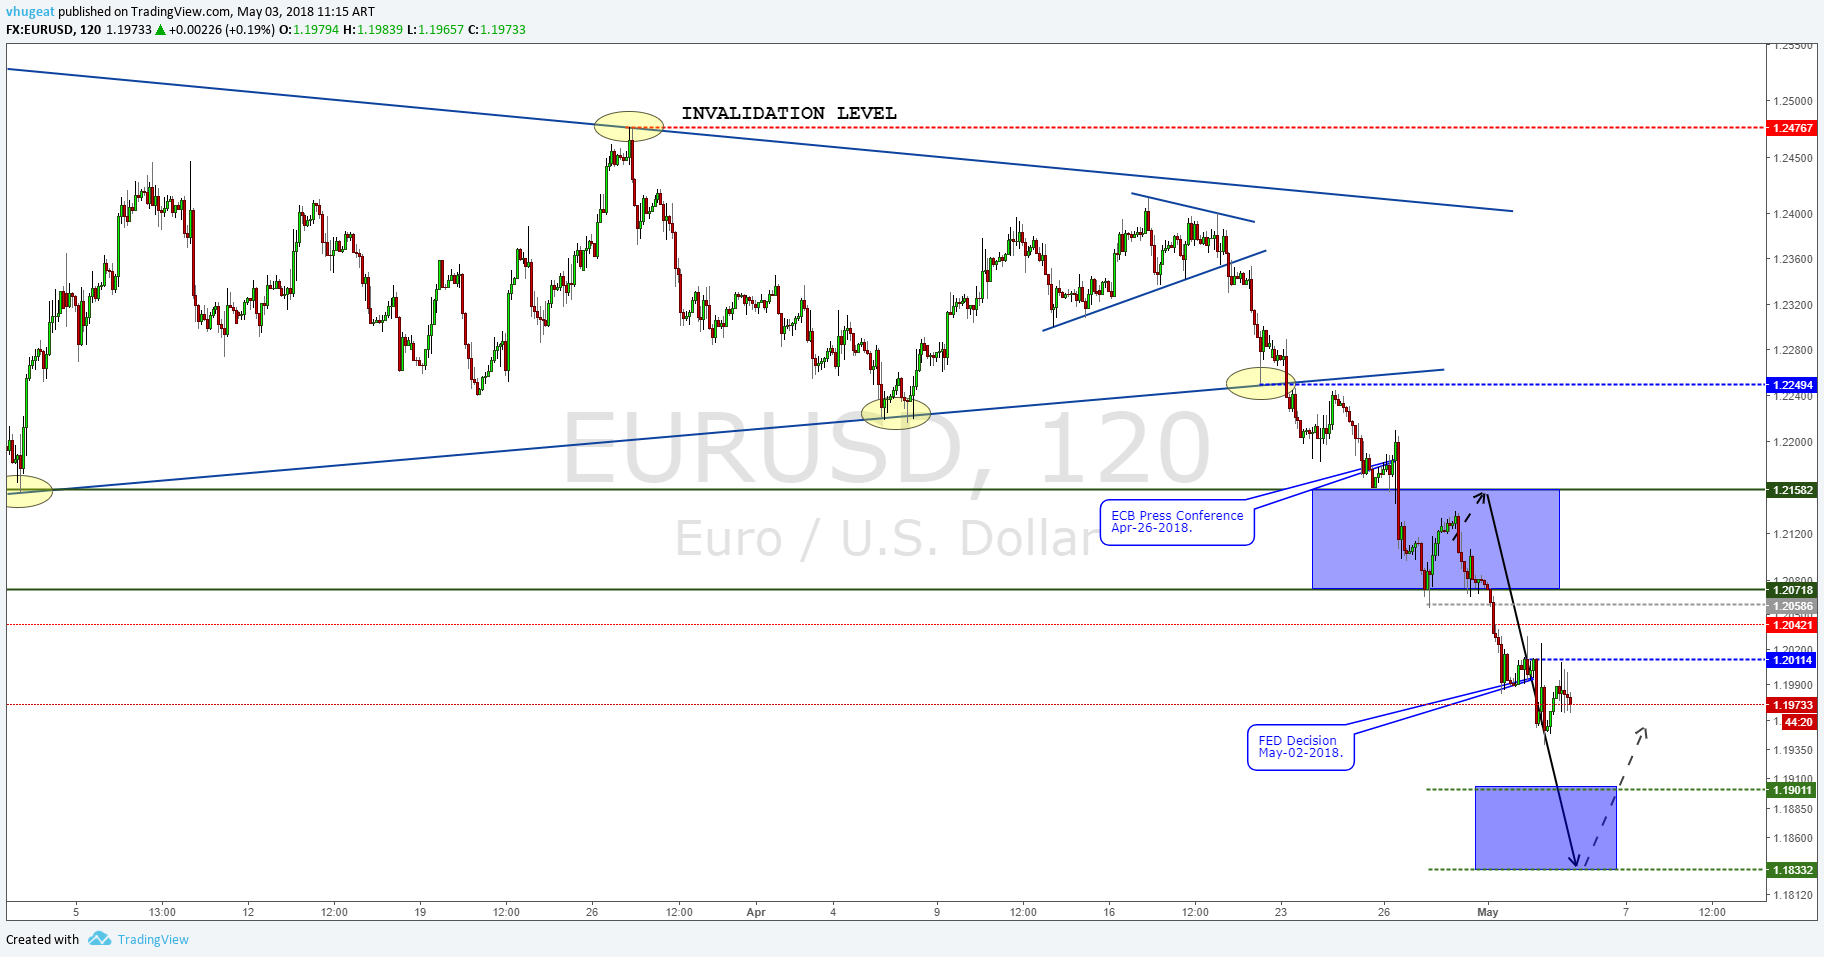
The single currency is moving in a range between 1.195 and 1.20 pending the employment data that will be published tomorrow by the U.S. Bureau of Labour Statistics. The EURUSD pair could make a new lower low, likely near to 1.190, from where it could bounce up to 1.207.

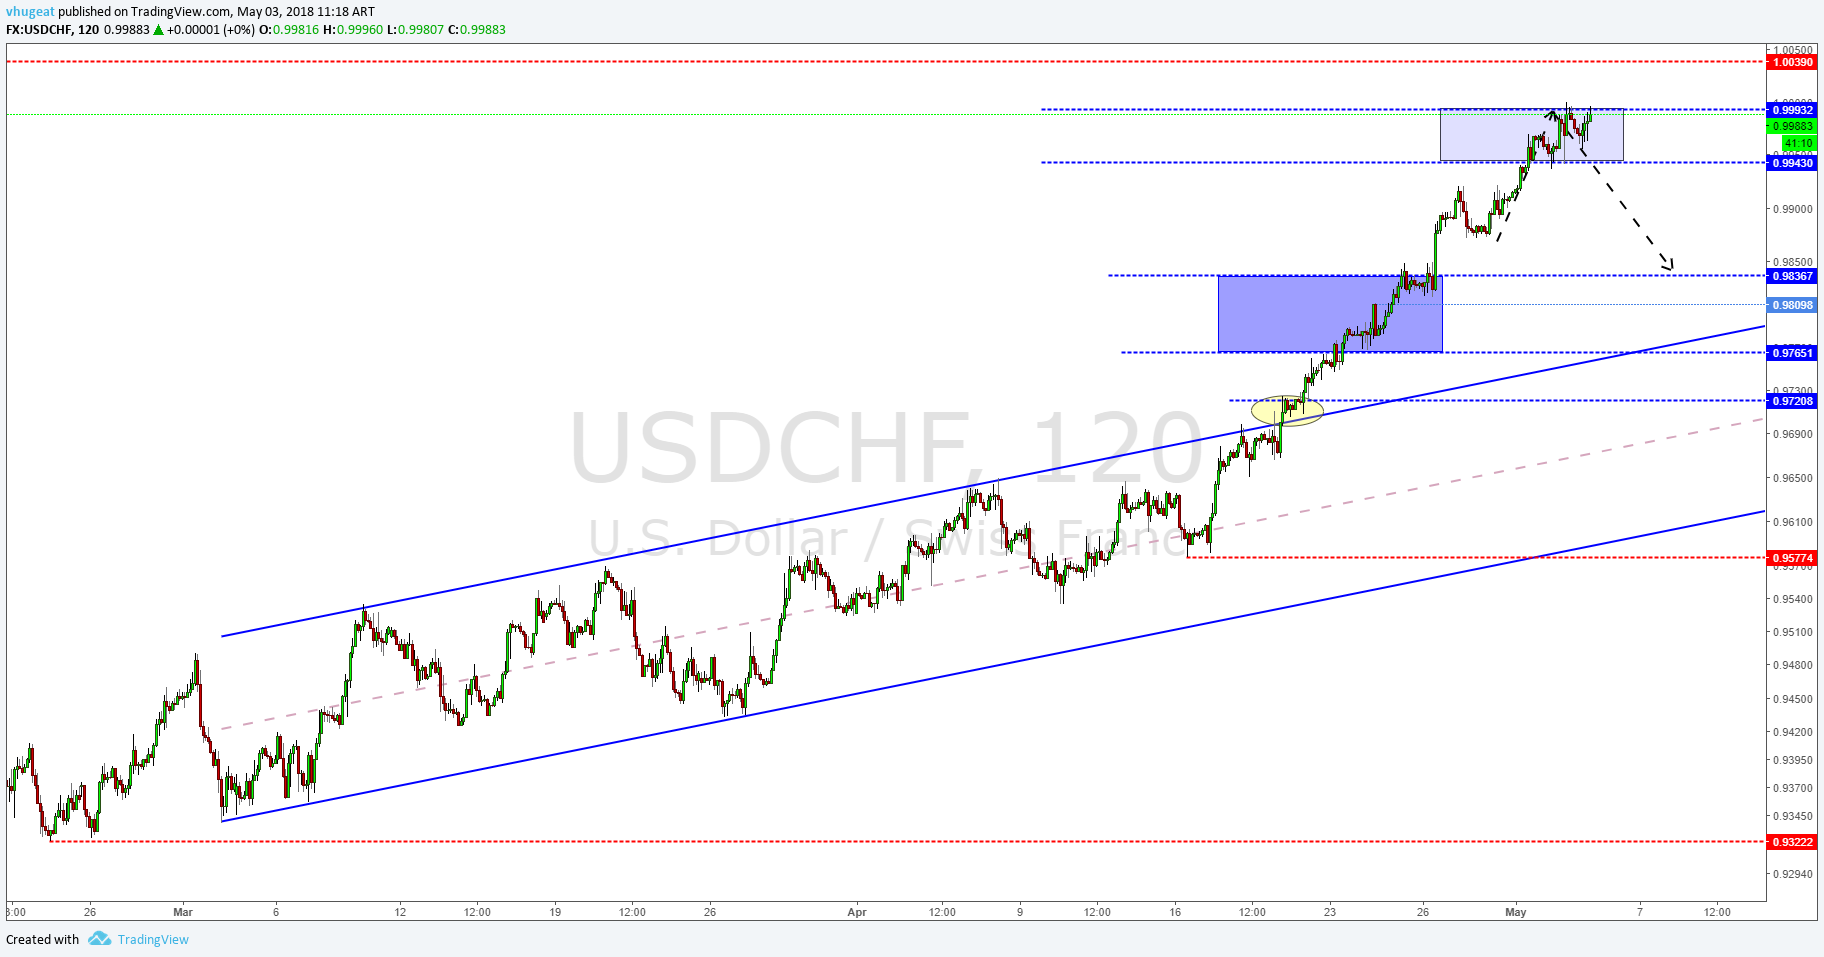
The USDCHF is forming a double top pattern, which would be activated if it breaks below 0.995. By inverse correlation with the EURUSD pair, and considering that it still has space to make a new lower low, the Swiss currency could make a higher move as a buyer trap or 2B Pattern.

EURCAD: Follow-up of the bearish cycle continuation.

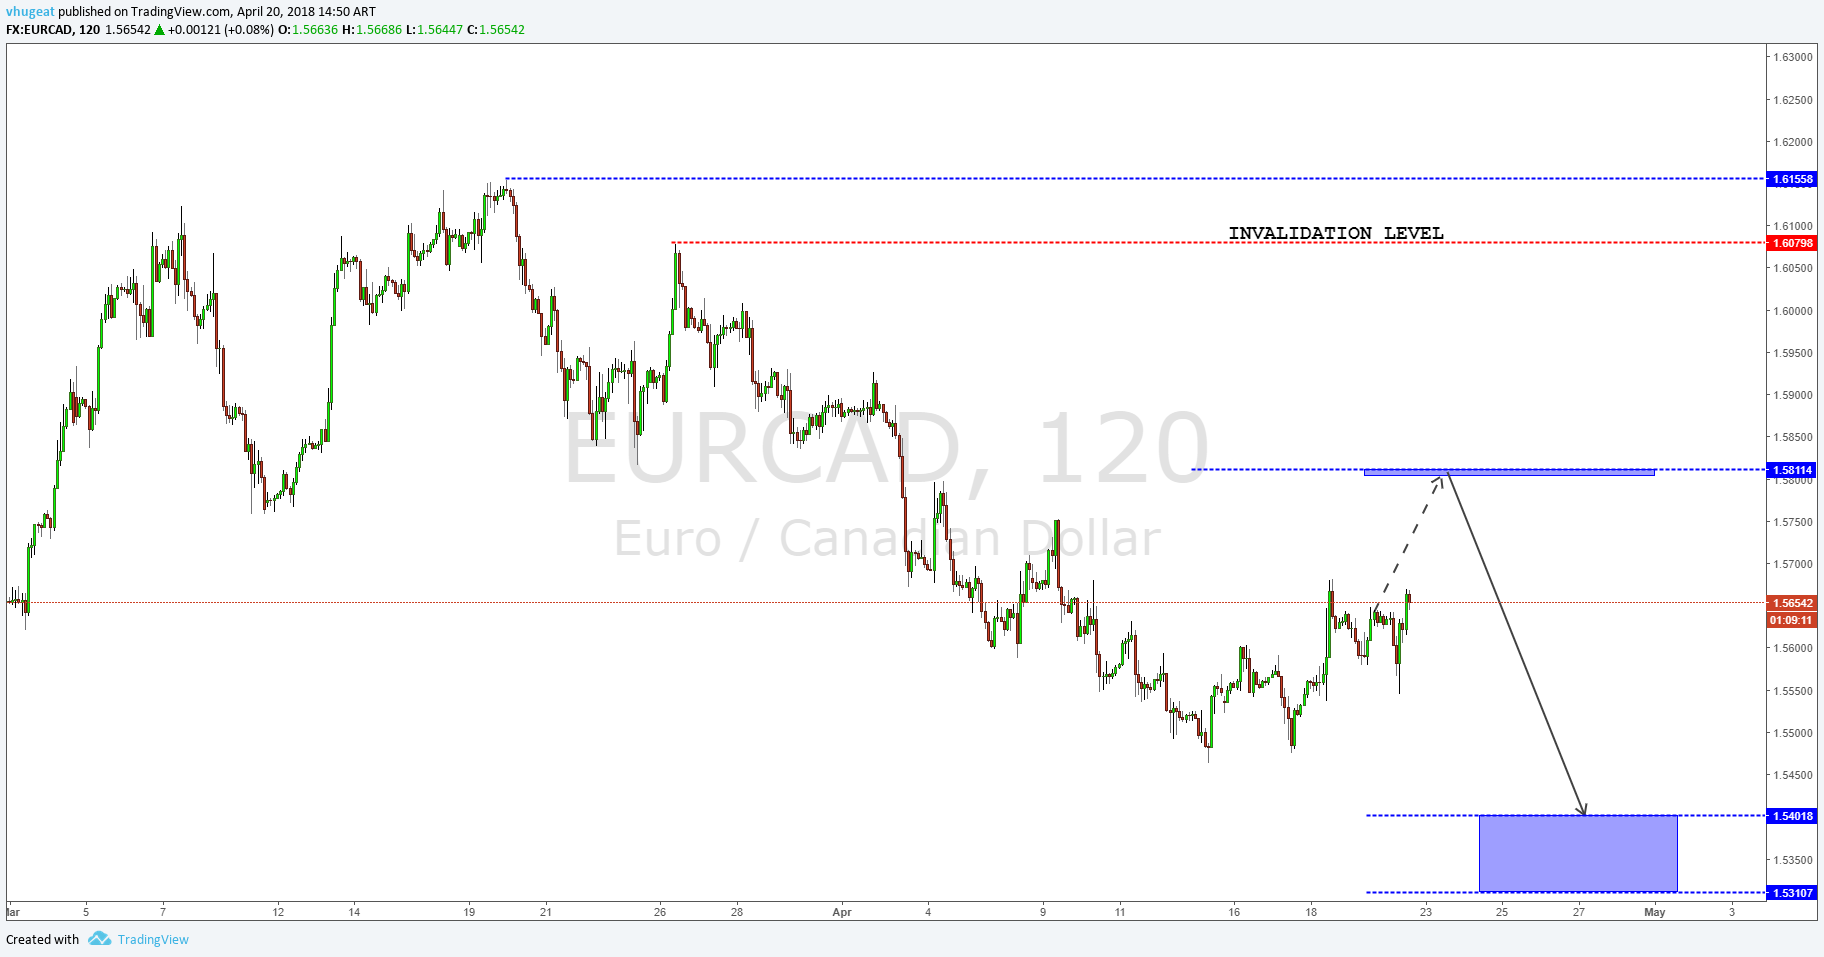
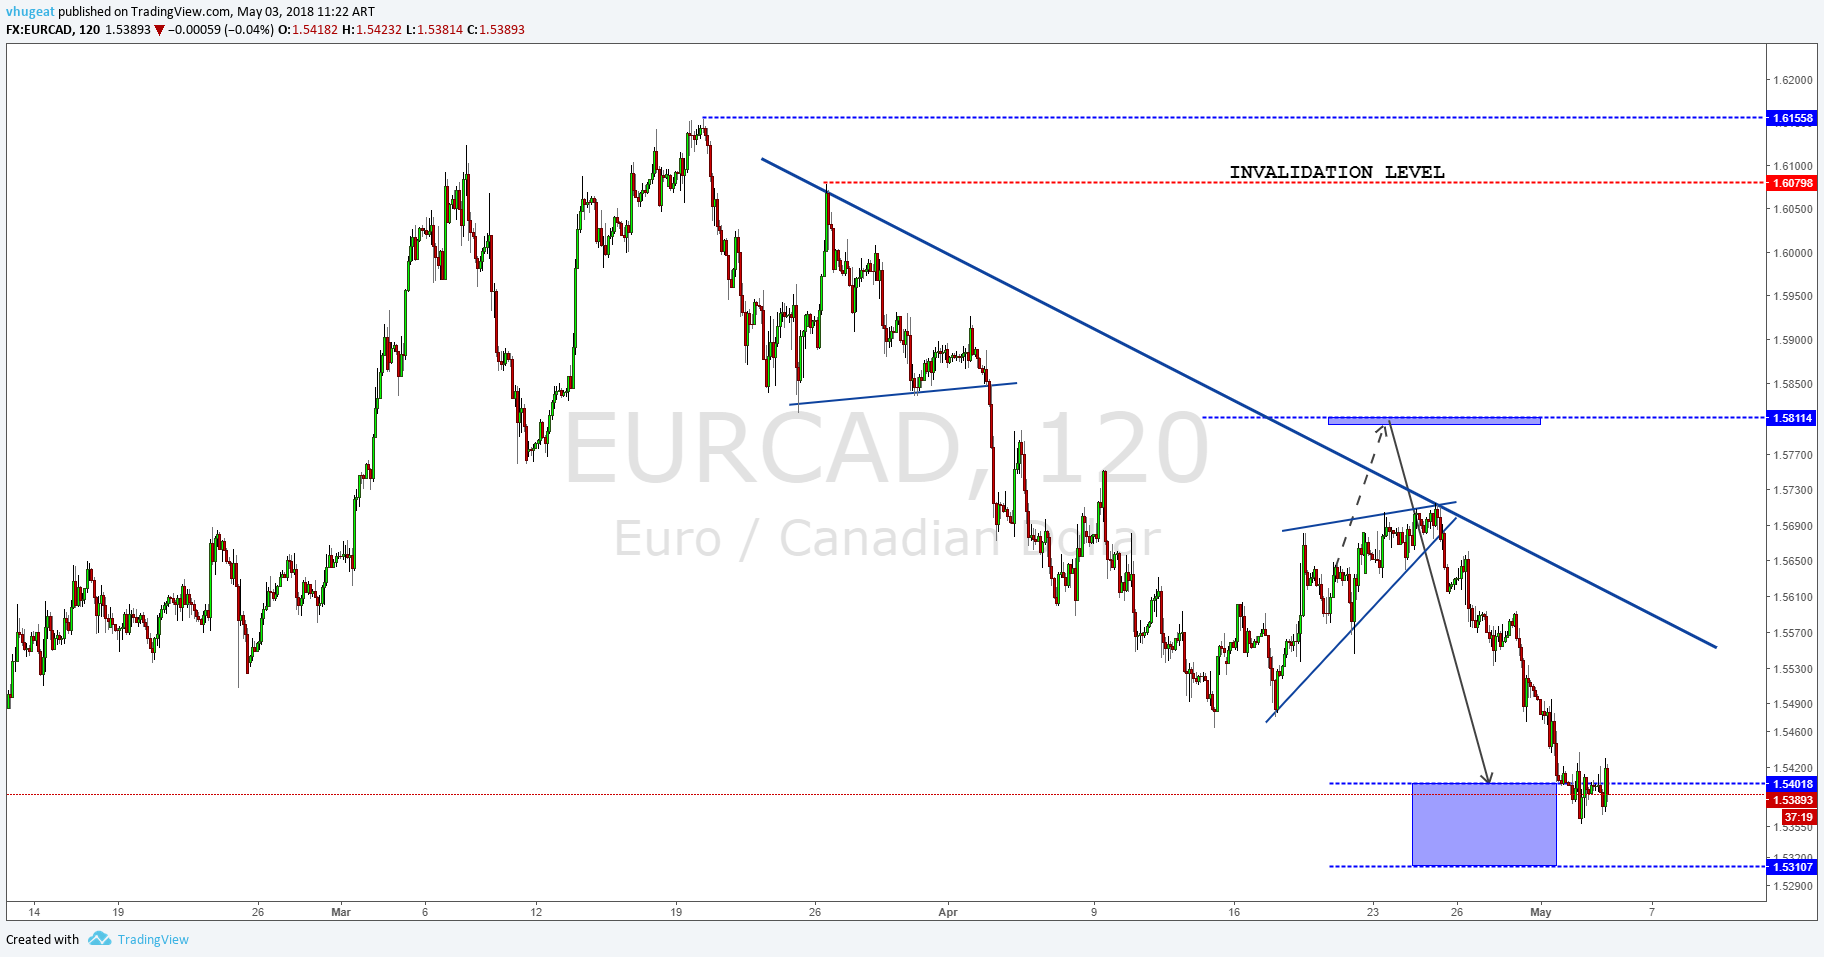
On April 20th we commented to our subscribers that the cross EURCAD had a new lower low to develop, whose target could be in the area from 1.54 to 1.5310. Today, we see that the cross has reached our forecasted area. Now we should start to take profits and wait for the price action to show a new trading opportunity.

EURCAD updated:

©Forex.Academy

Categories
Forex Market Analysis

Time for a new Correction

Hot Topics:

  • Is it time for a new Indexes’ correction?
  • US Dollar can’t continue its rally against their main pairs.

Is it time for a new Indexes’ correction?

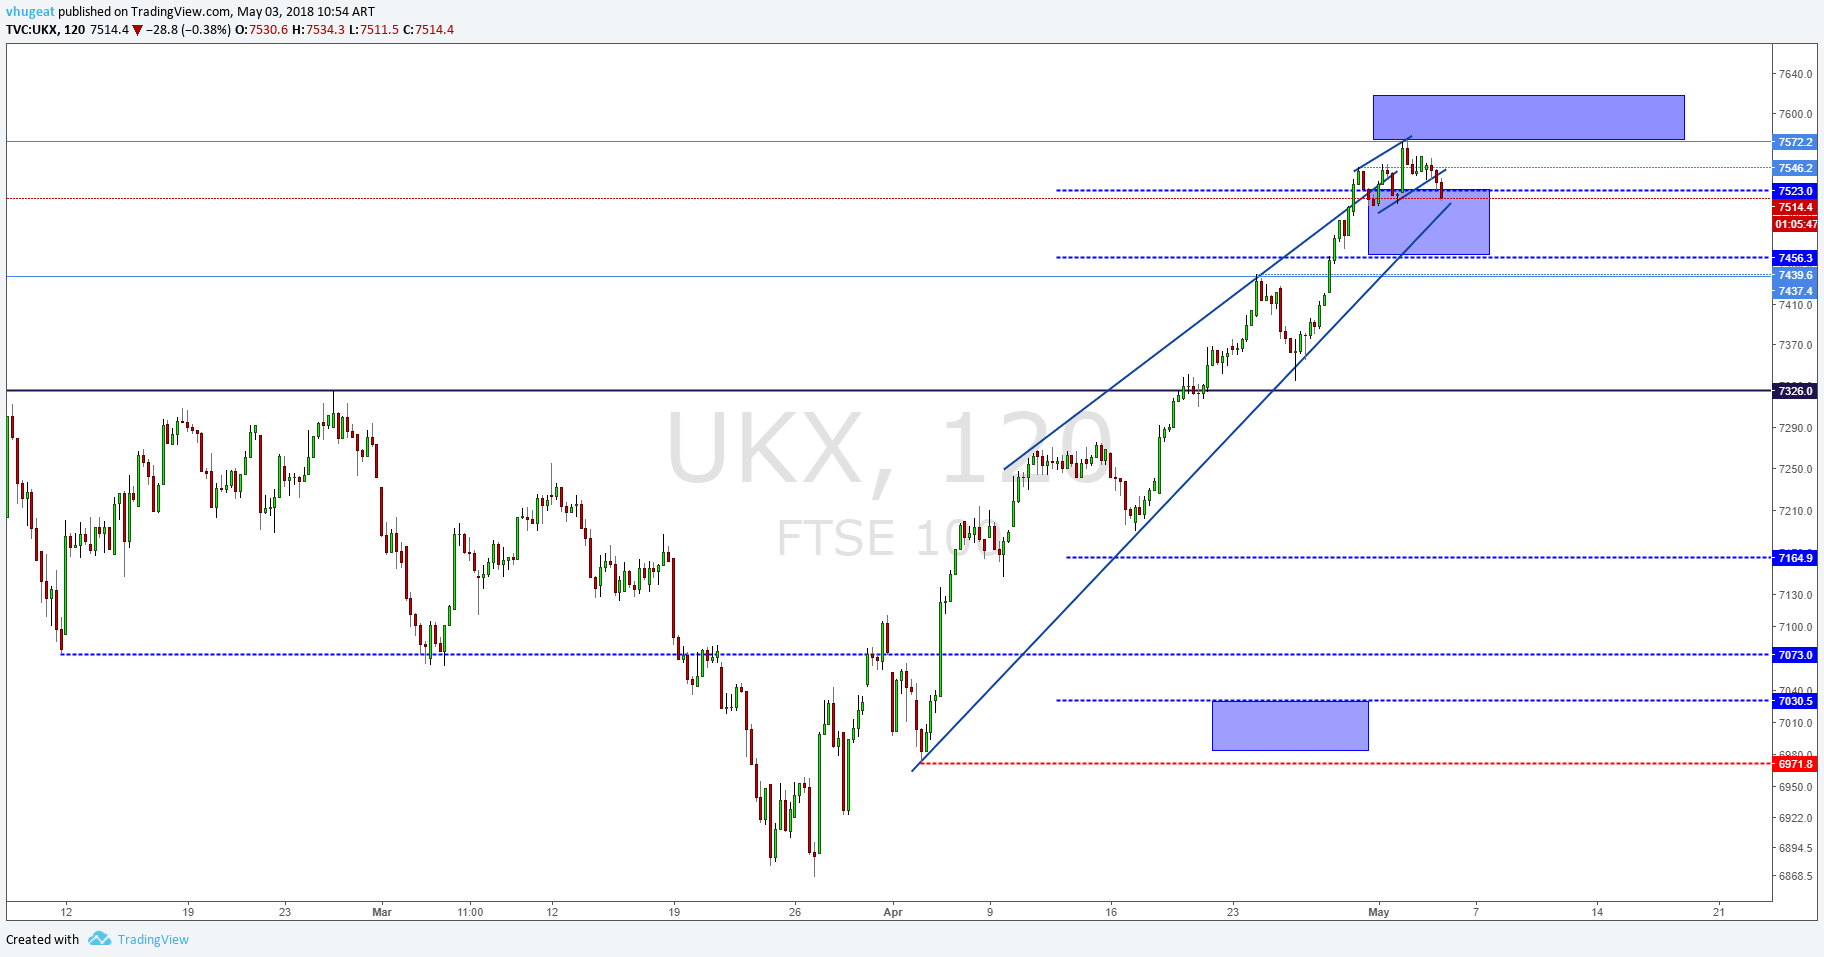
The FTSE closed the session near our blue box, the area from which we expected that the price would make a corrective movement at least down to 7,326.  It could even be down to the 7,000 pts level.


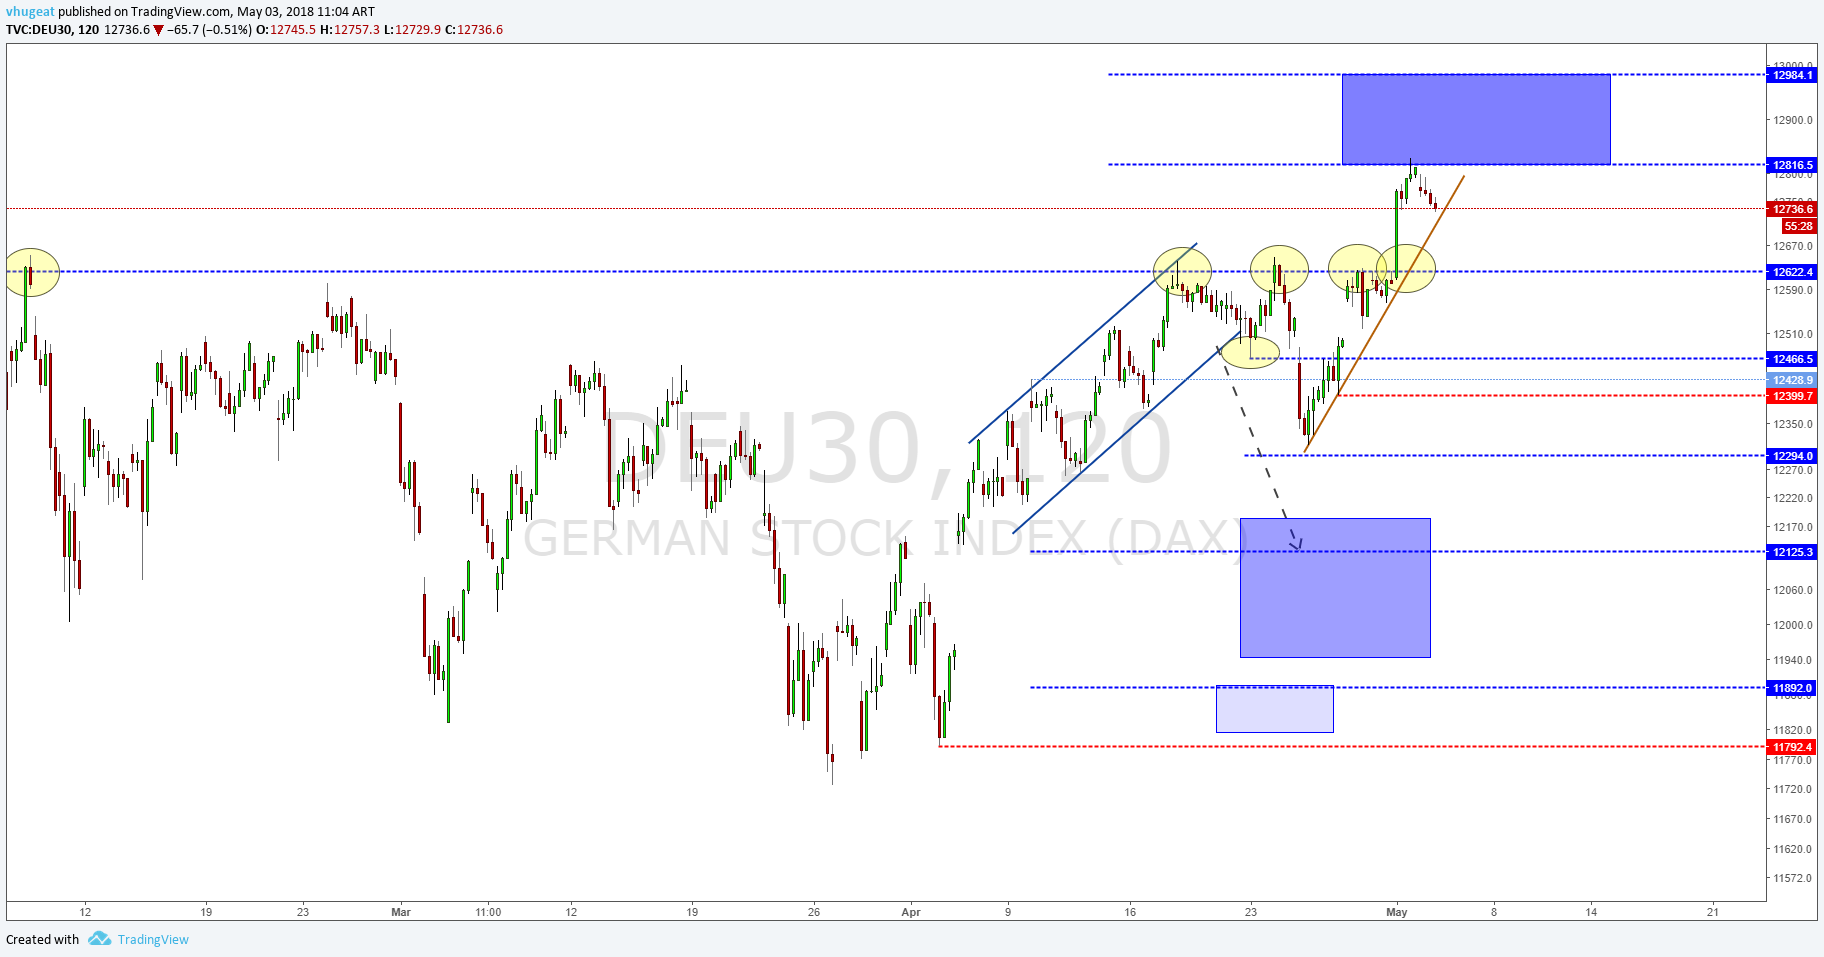
The DAX closed the session testing the 12,622 resistance, failing once again in its attempt to strike the resistance. The pattern left at the end of the session looks like a double top pattern. If the price breaks down at 12,465.5, the target level will be 12,294.

US Dollar can’t continue its rally against their main pairs.

The Euro stopped its correction despite the positive economic data in the US. Consumer confidence increased in April, at the same time, the New Homes Sales (MoM) in the US advanced 4% in March, the highest level for four months. We think the corrective move in the Euro has paused, waiting for the ECB Monetary Policy decision. As long as the price moves below 1.2476, our bias remains bearish.


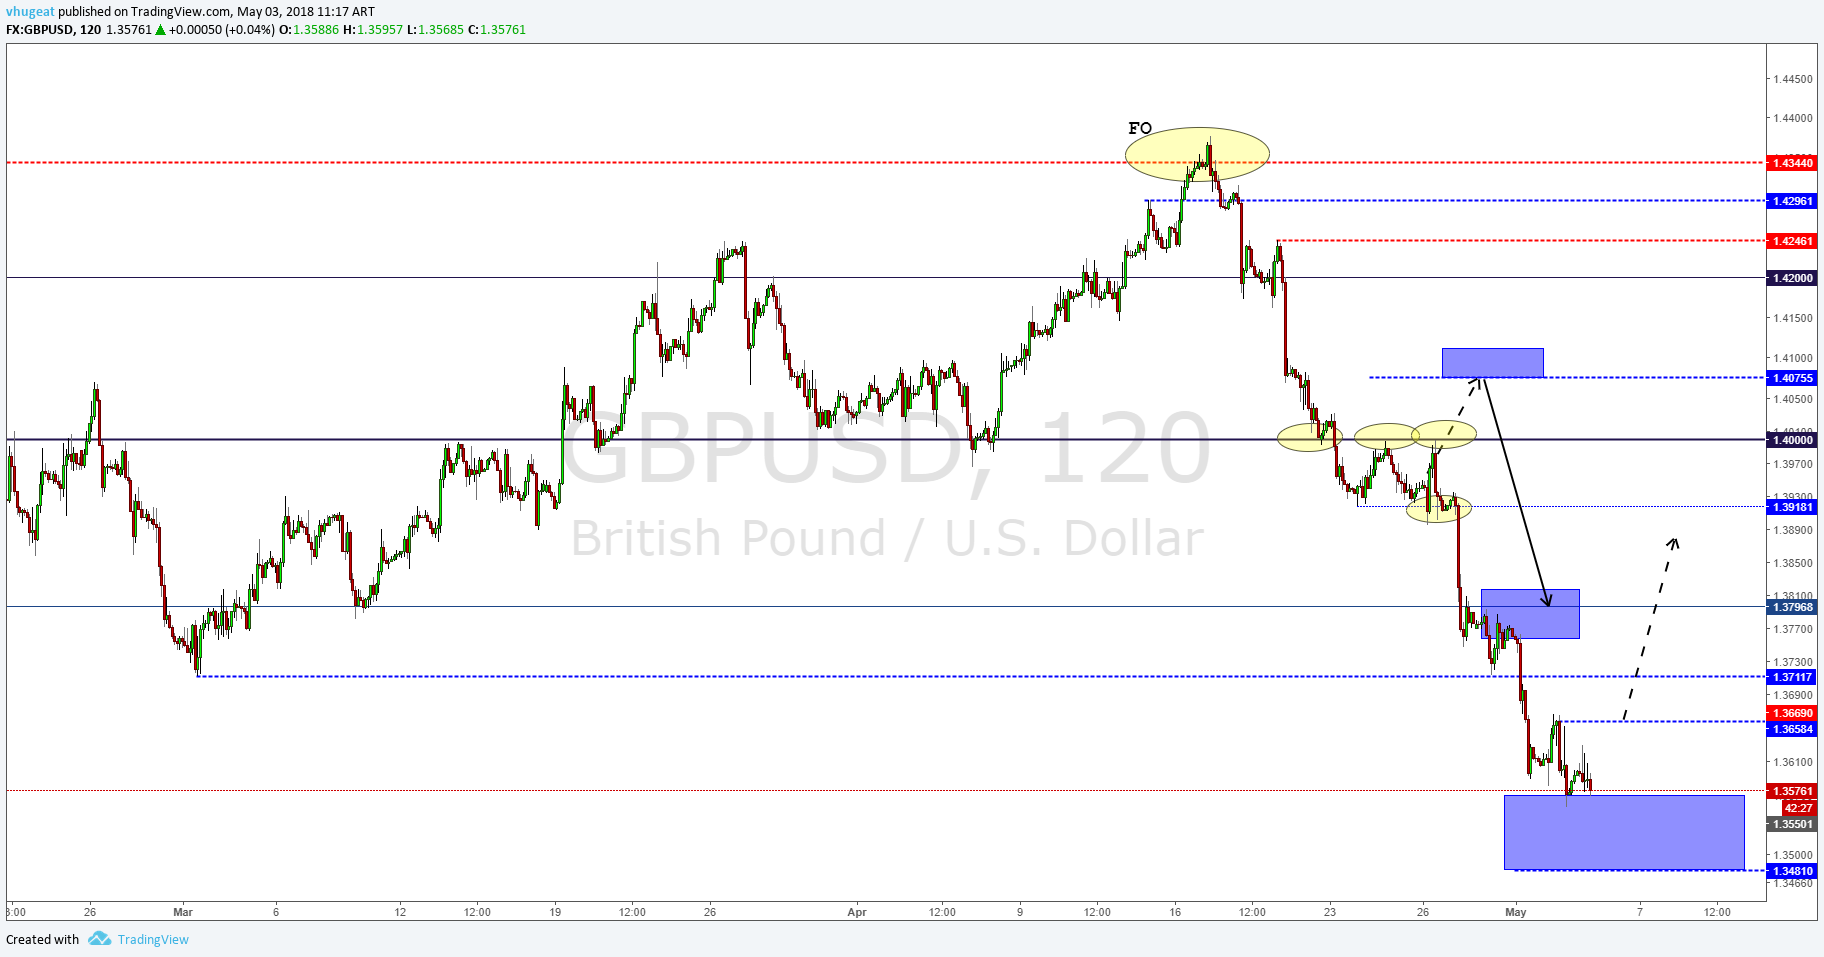
The pound has dropped below the psychological level of 1.40 and is now making a pullback looking to recover the previous zone. We will wait and expect the beginning of its next move to take a position in the GBPUSD pair. Our primary vision is that price could make new lower lows, to reach even below 1.37 level.


The CHF climbed up to the 0.98 level from where it has been rejected. It is likely that the Swiss currency makes a new high in 0.9825 before starting a bearish correction. The target is between the 0.965 and 0.9720 zone at least. The invalidation level of the current bullish cycle is 0.9577.

©Forex.Academy

Categories
Forex Educational Library

Cycles and Economic Oscillations

Abstract

The economy of any country has 4 main phases: Depression, recovery, boom, and recession. In each economic cycle, there will be industries that will perform better than others, depending on which variables are growing the most, what is the situation and what are the policies taken by the central bank and the government. For investors, it is important to know in what economic cycle the economy is to make decisions about what assets to buy. In addition to these economic phases, the economy of the most important countries such as the United States, China, and some of the Europeans, can affect the cycles of other economies that can be called emerging and underdeveloped.

The economy of the countries is not stable in any case, they always have oscillations that are called economic cycles. The economic cycles are the recurrent increases and decreases in the economic activity of each country and therefore also the economic sectors are facing these fluctuations in the economy. These oscillations do not occur in the same way or in its magnitude since in each period the factors that affect an economy are different. In some periods of time, its most important sectors will stop growing due to internal or external factors, shocks from external economies or natural disasters, causing the magnitude and effect in the economy to be different over time.

There are four recognizable phases in the economic cycles experienced by all economies:

  • Depression or crisis: The lowest point of the economic cycle. When the economy is in this phase it is common that the main indicators of the economy are at low rates such as employability, consumption, the price of goods decreases or remains stable (low inflation rates) and the gross domestic product of a country is far from its potential. Given this situation, it is normal for the profitability margins of companies and banks to decrease during this point of the economic cycle.
  • Recovery: Phase in which the behavior of the economy begins to improve, there is a phase of better economic growth, better levels of employment, more positive margins, greater expansion of the domestic product and an increase in the price index in response to a better demand for goods and services by consumers and businesses.
  • Boom: The highest point of the business cycle. When the economy is at this point, production is in its potential, or in some cases, above. Because the economy is at its best there is full employment and as production is at its highest point with the lowest possible unemployment there is no possibility of better economic growth. In addition, since there is full employment, wages are higher due to the low supply of labor and consumption is also largely due to these higher wages
  • Recession or contraction: It’s the Economic phase where growth stops or slows down.  Production, investment, trade, and employment rates, as well as the wages of people, stalls or, even, decreases. The margins of the companies drop again, and the revenues of the government diminish. If the recession or contraction occurs in a severe and prolonged way, it may lead the economy to a crisis, signaling the beginning of a depression.

Economic cycles can be calculated by analyzing some economic variables. The most used are the gross domestic product of a country, inflation, and unemployment among others. Keep in mind that some variables are pro-cyclical, and this means that they increase when the economy grows and decrease when the economy decreases such as GDP and inflation and there are other variables that are countercyclical which grow when the economy gets worse such as unemployment. There are others that are acyclic, and this indicates that they are not very correlated with the behavior of the economy.

As there was mentioned earlier, economic variables are never constant, they are always fluctuating around a trend. These fluctuations are common in all the economies of the world, but there are always facts that explain why these variables fluctuate in a different way in time. It is strange to see two periods in time that have the same economic factors developing so the recessions are not the same as the booms because they are generated by different factors.

Fluctuations lack periodicity, but they are recurrent. In addition, when growth is above the trend, the variables are correlated so that when the economy starts to grow, investment also increases, which magnifies booms or recessions because one variable affects the others. What the economists have found is that among all the variables, the most volatile is the investment over the product and the consumption due to the risk aversion of many investors and the expectations they have. When the economy begins to show signs of stagnation, investors are the first to change assets and invest in another country.

For the world economy, it is important to follow the economic cycle of countries that drive global growth, such as the United States, the countries belonging to the European Union and China. When these economies enter phases of depression or recession this affects the other economies because in a world as globalized as the current one if a country does not grow to its potential this will affect its domestic consumption and end up affecting products that are exported to these countries. This is the reason why global growth since 2007 has not been very good in general because there are countries that are not growing at what they should according to their potential. In the next part of the article, we will explain how the current economic cycle of the United States and then the countries of the European Union are.

During much of the 1990s, the United States economy recorded an expansionary phase that ended with the economic crisis of 2000 to 2001 generated by several factors including the crisis of technology companies. The boom of these years was also due to the formation of capital in the high technology sector, where such was the increase in investment that boosted the domestic product which in turn boosted consumption and employment. But such was the euphoria of the investors, that overvaluation was generated in the United States stock market of the main companies added to a great appreciation of the dollar. This appreciation of the dollar allowed increasing the purchasing power of the citizens which generated imbalances and causing a deficit in the current account of the balance of payments, increasing the indebtedness and high prices of some assets.

The exhaustion of the expansion was manifested by drastic drops in the margins of the companies that ended up affecting the stock market indexes and this frightened away the investors, which drastically reduced the investment. To respond to this crisis, the monetary authorities used fiscal policies (higher spending, lower taxes) and expansive monetary policies (nominal interest rates and low real rates to encourage consumption). These measures allowed consumption to replace investment as the engine of the economy but created the basis for the crisis of 2007.

The measures to recover from the economic cycle of depression in the United States economy raised the debt of government households while companies began to see their margins improve due to lower debt costs and higher domestic consumption. The dollar was also depreciated due to the decrease in rates, which encouraged exports, but this effect was paralyzed when in 2004 monetary policy stopped the depreciation. The crisis of 2007 was a subject exposed in the article Problems and crisis in the economy.

After the crisis of 2007 and its continued depression, the recovery phase began in 2009. Since 1949, the United States economy has had 11 expansion phases and 11 recession phases. The expansion phases have had an average of 21 consecutive quarters growing. The longest phase of expansion has been of 39 quarters that was from 1991 to the year 2000 with a growth in that period of 43% of the domestic product. The most significant growth was 53.7% between 1961 and 1969. On the other hand, the shortest economic cycle lasted 4 quarters between 1980 and 1981.

The current economic cycle of the United States is above average in its growth phase, growing close to 32 consecutive quarters since the third of 2009, but the growth has not been of the same magnitude as the most euphoric episodes of the past. Although each economic cycle is different, and patterns are not always repeated, there are indications that global economic cycles are slower in their recovery if the origin of the crisis was a financial crisis like the one in 2007 where several banks went bankrupt and others were weak in their balance sheets and this indicates why the growth has not been the same as in other periods of time. The growth rate has not been very high in the United States since domestic demand (Consumption and Investment) has been weak in several quarters showing the consequences of the crisis.

In conclusion, the United States is in a period of boom economic cycle and some analysts predict that as the period of growth is so long, it is likely that in 2018 or 2019 the economy stops growing and enters a period of recession in its economic cycle.

For many investors, economic cycles are a useful tool used to allocate their resources in booming or growing economies or know which sectors can grow if a country is in recession. Clearly all sectors are affected by crises, but there are some sectors that do better during these difficult times than others that depend more on the economic cycle as dependent sectors of consumption that is one of the most affected.

Now we will analyze which economic cycle Europe is in. The indicator of economic sentiment has increased in recent quarters in the euro area, which shows that investors’ expectations are positive on the general growth of the eurozone. As can be observed in the following graph, the indicator of economic sentiment is correlated with the behavior of the gross domestic product, so it is expected that in the following quarters the eurozone will continue to grow, showing that they are booming in their economic cycle.

Graph 36. (2017, October) European Business Cycle Indicators. Retrieved December 3, 2017. From https://ec.europa.eu/info/sites/info/files/economy-finance/tp019_en.pdf.

If the eurozone is analyzed by sectors, it can be seen in the figures that the industry and services sectors grew while construction and consumption have not shown higher growth, which indicates that these variables are stable. In the following graph, you can see the confidence that exists about the growth of the industry in the European area.

Graph 37. (2017, October) European Business Cycle Indicators. Retrieved December 3, 2017. From https://ec.europa.eu/info/sites/info/files/economy-finance/tp019_en.pdf.

During the third quarter, the highest levels were seen in all sectors for approximately six years. The country where you see the best performance of the economy, with even better expectations, is in Italy. Then comes France, Poland, Holland, and Spain. The expectations about Germany and England are not so good, and their indicators have remained stagnant.

The central bank’s forecasts were raised in one of its last meetings in the third quarter on production and prices in the eurozone. If we compare these forecasts with their expectations in the previous quarters has seen improvement in these which indicates that the expectations are positive and indicates that the countries of the eurozone are in their growth or boom phase.

The only exception with negative expectations is England, where the index of economic sentiment is negative. In other countries, there has been an increase in the utilization capacity in manufacturing for five consecutive quarters. In the services sector, there are positive expectations because positive symptoms are seen in domestic demand so in the following quarters should increase production, added to employment, investment and therefore the sectors that are related to these indicators.

In conclusion, the main economic zones of the world are in an expansive phase of their economies, such as the United States and the European zone, so other countries such as emerging countries and others have positive prospects, but some analysts predict that in next few years the US cycle may end and enter a period of recession which would affect the growth of the countries that trade more with this country. The most important thing is to understand that all economies move in these cycles and economic oscillations so entering a recession is not serious if governments take counter-cyclical measures to reactivate the economy. Another factor to consider is the change of the Chinese economic model, a fact that can also affect some countries that saw China as an importer of raw materials such as coal and oil. As the trajectory of the economies of China, the United States and the eurozone follow, they will determine world growth in the coming years.

©Forex.Academy