Categories
Forex Market Analysis

DAX 30 Unveils Exhaustion Signals

Overview

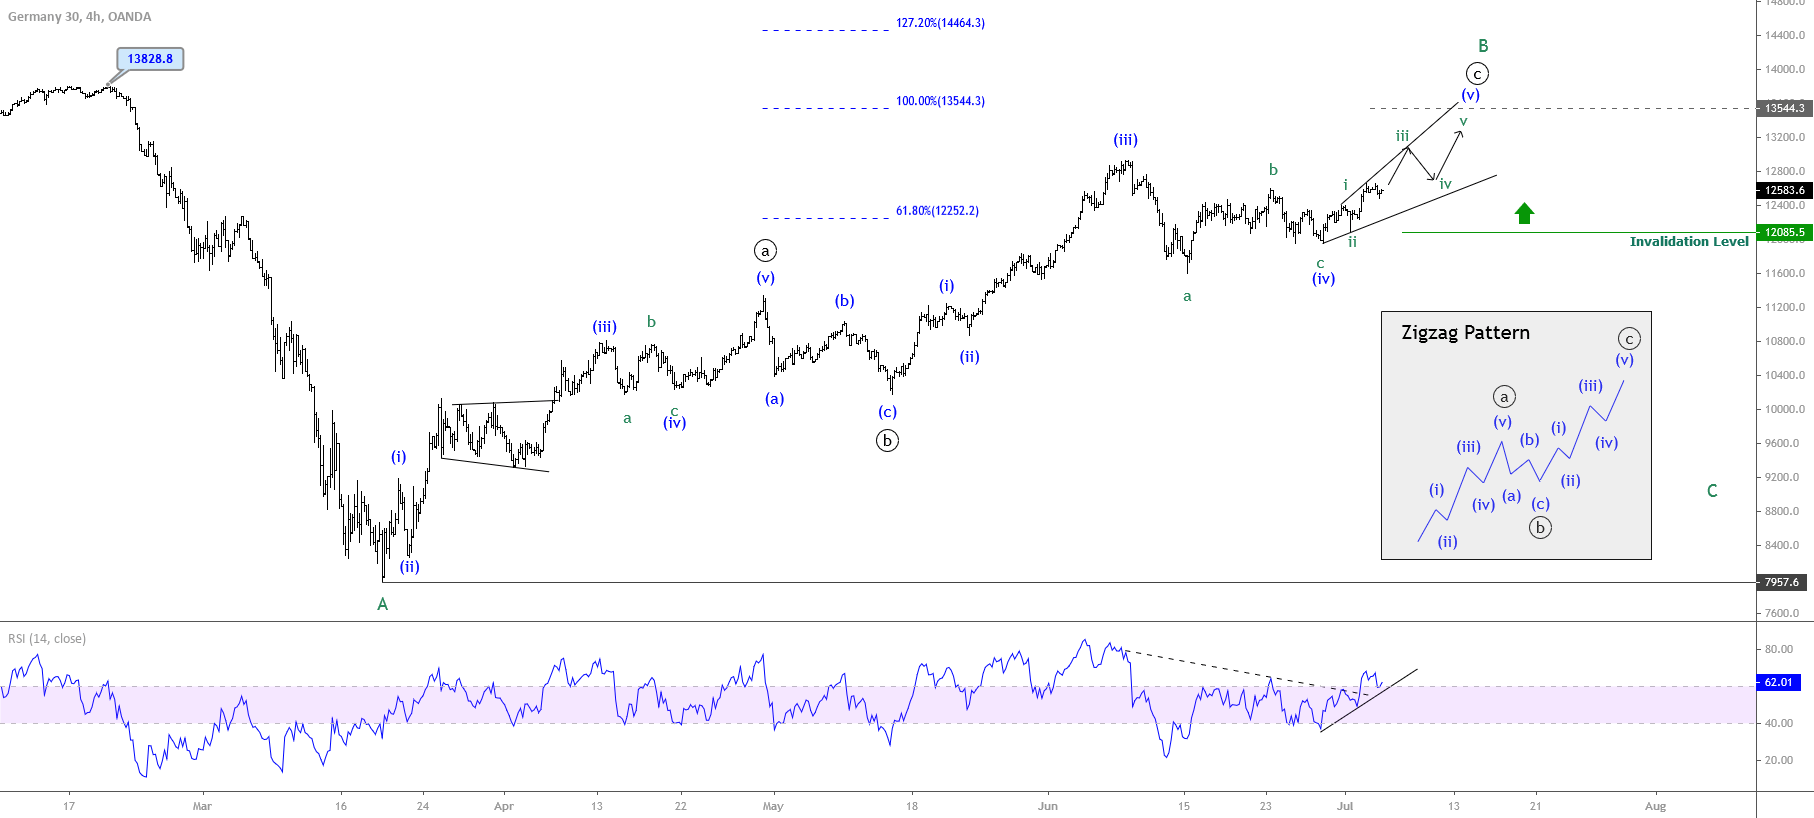
The German DAX 30 index, which groups together the 30 most capitalized companies in Germany, shows signs of exhaustion after the rally it developed since the second half of March this year. Likewise, the Elliott wave theory’s perspective reflects the exhaustion of the bullish impulsive movement, which may be advancing in the last impulsive wave of Primary degree.

Market Sentiment Overview

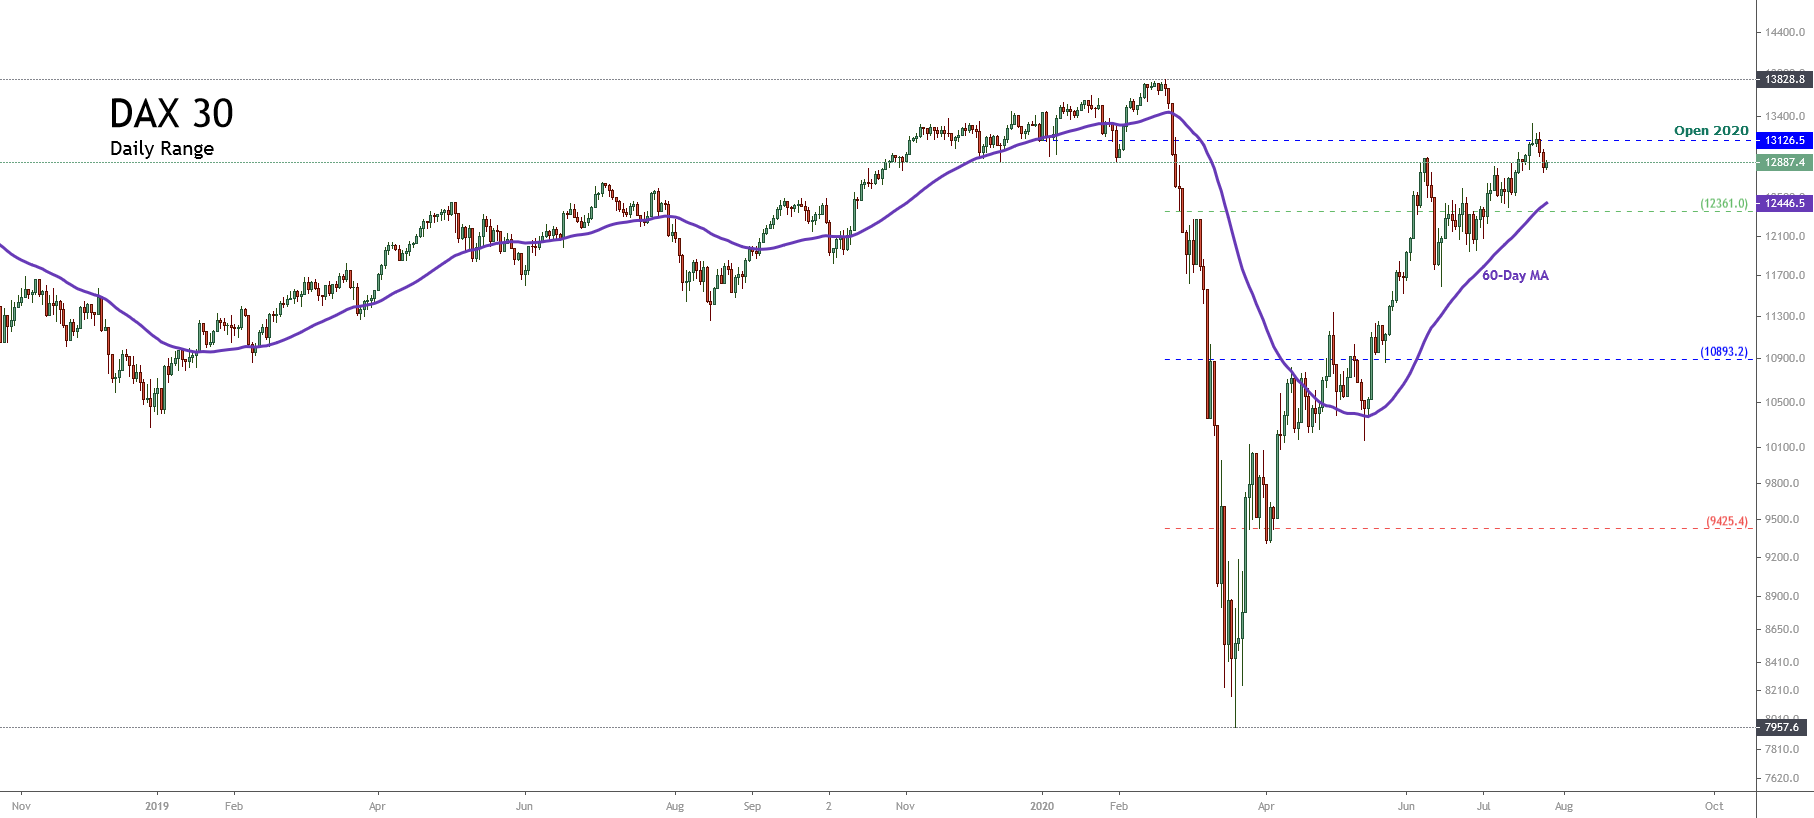
The German benchmark DAX 30 shows a pause in its upward trend, consolidating the rebound that the price has been developing since March 19th when the German index found support in the yearly low located at 7,957.6 pts. Since this bottom zone, DAX 30 has advanced over 60% to date; however, this year the benchmark eases over 2.75% (YTD).

The following daily chart of the German index shows the price action running in the zone of extreme bullish sentiment. However, the shift in price below the 60-day weighted moving average reveals that it could be starting to develop a new short-term corrective process. 

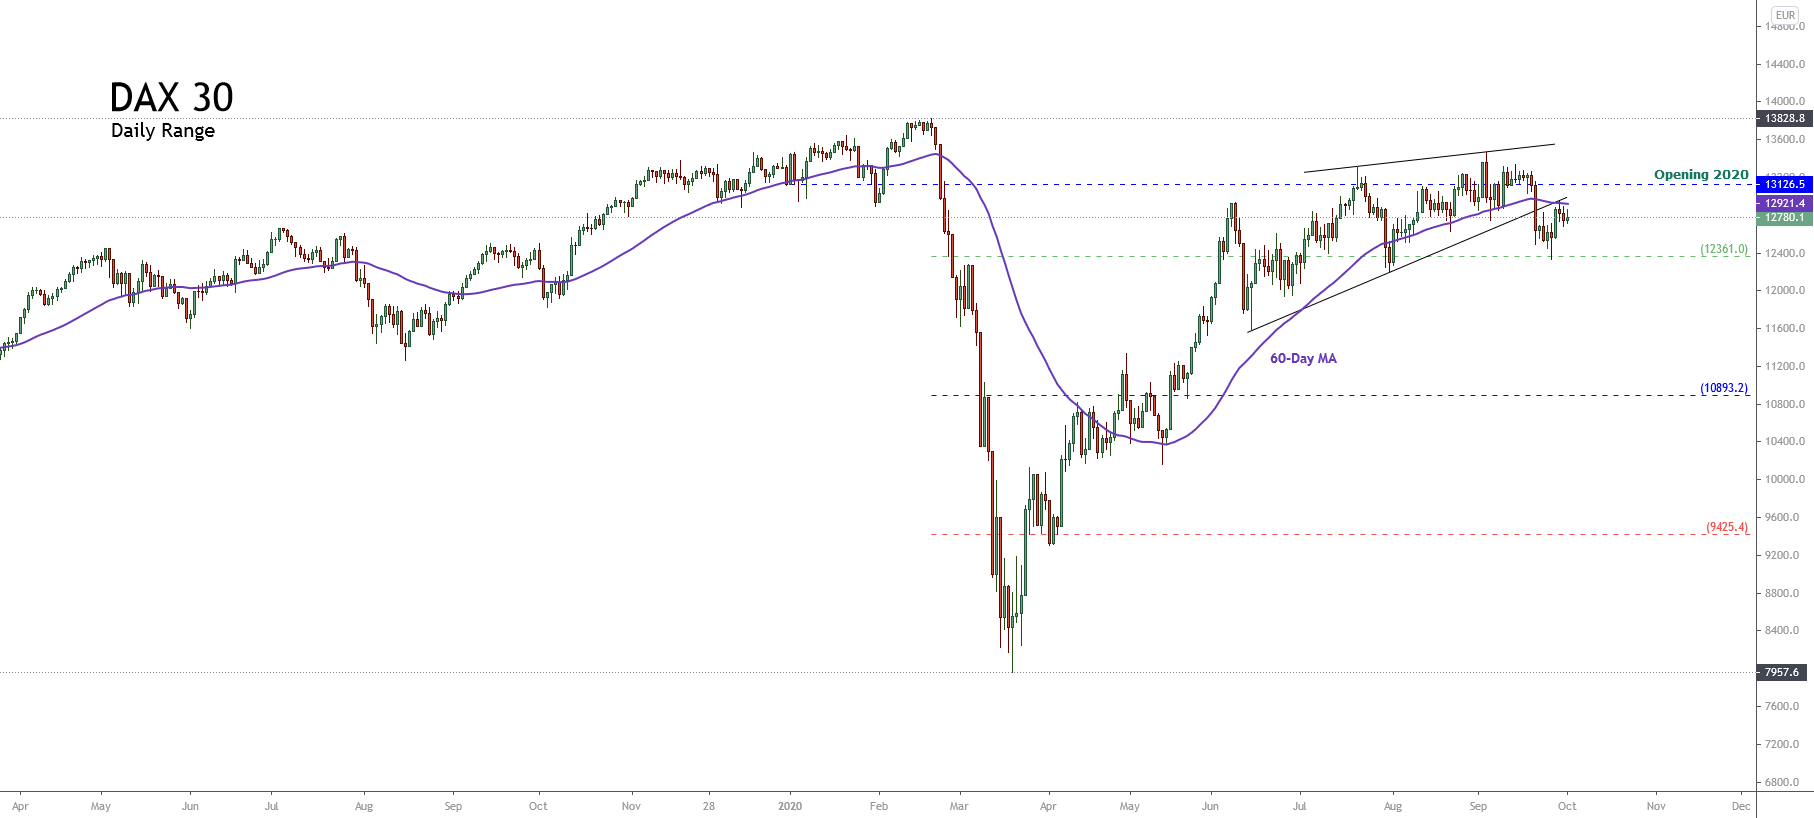
Although the DAX 30 remains in the zone of extreme bullish sentiment, our market bias continues being neutral as long as the likely corrective movement is not confirmed.

Elliott Wave Outlook

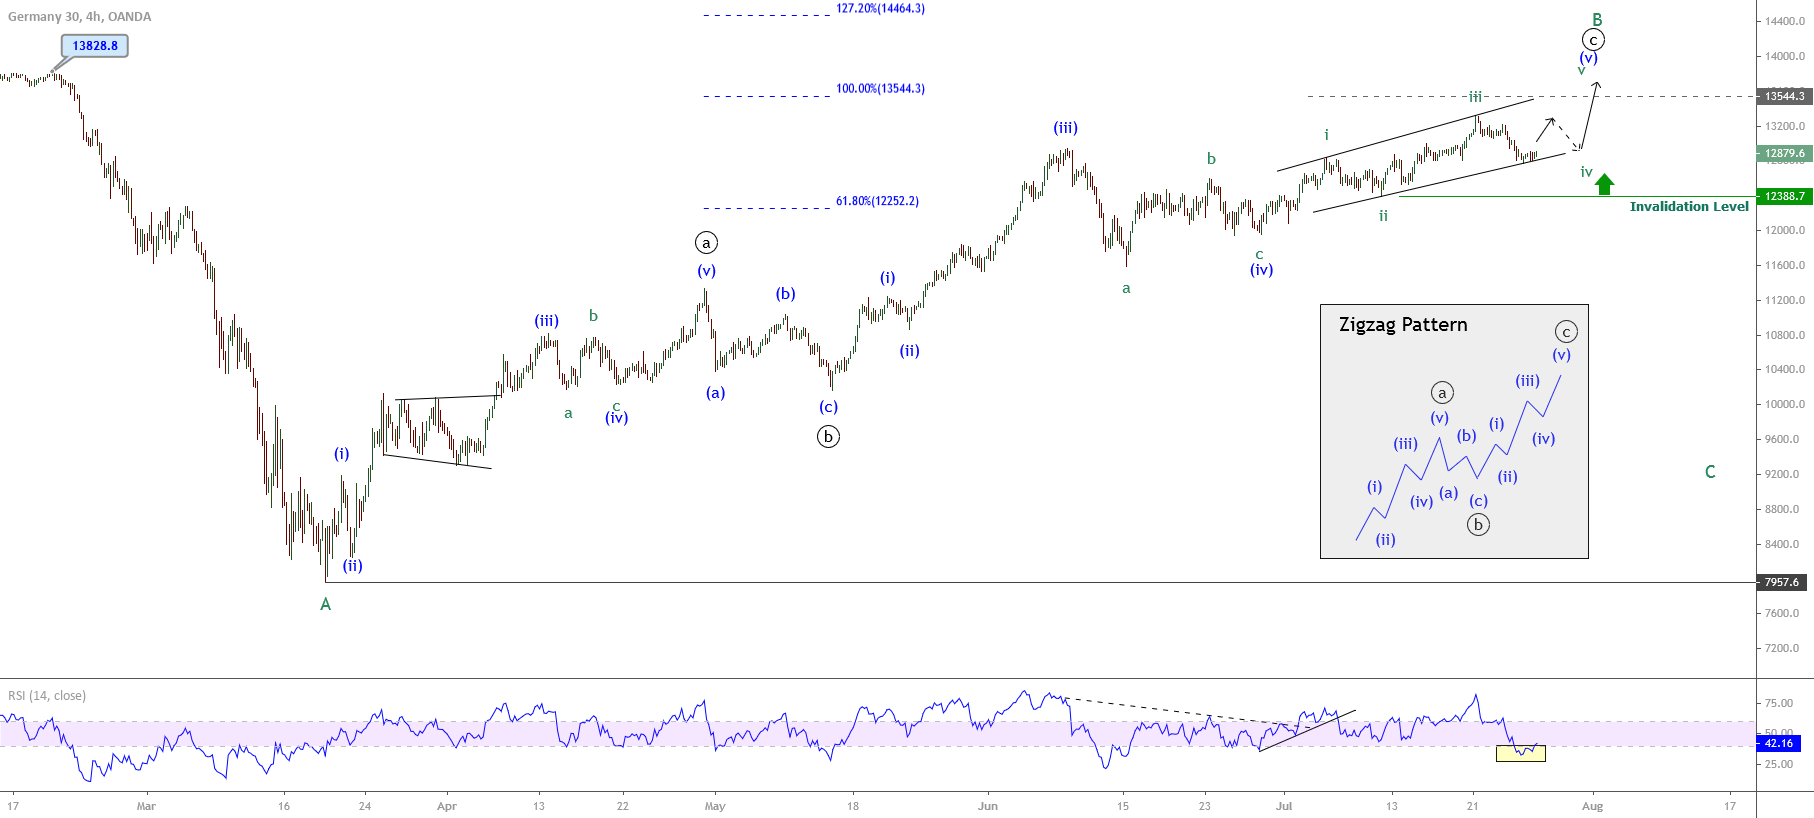
The DAX 30 index overview shows a bullish impulsive sequence that looks incomplete. This five-wave structural series that began in early March 2009 currently moves in a consolidation phase, showing exhaustion signals.

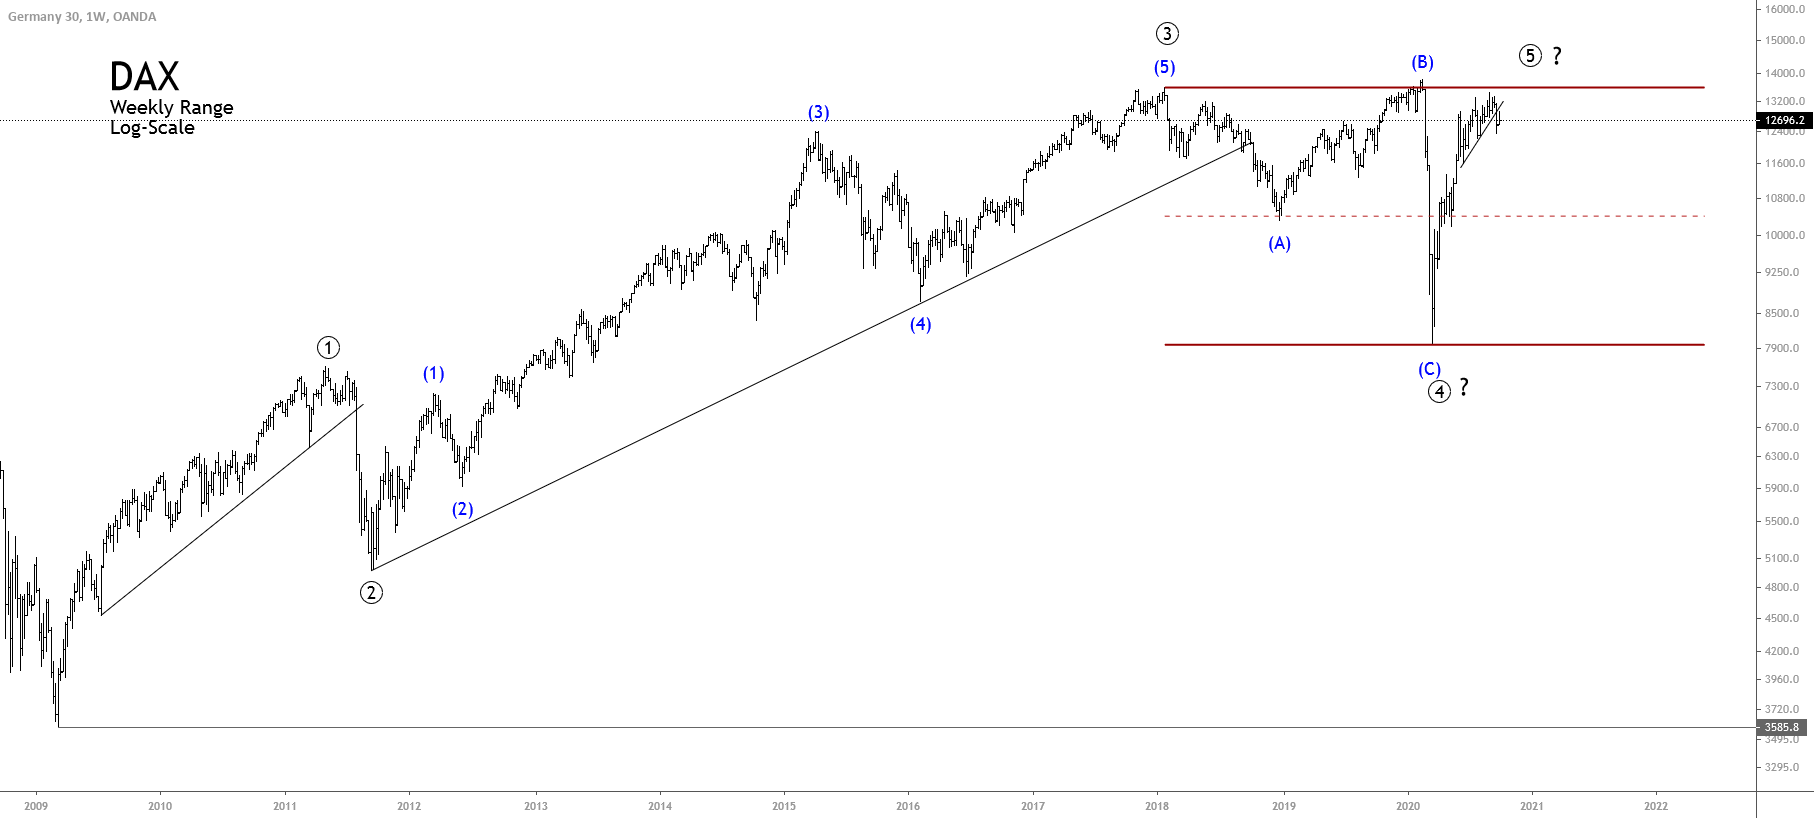
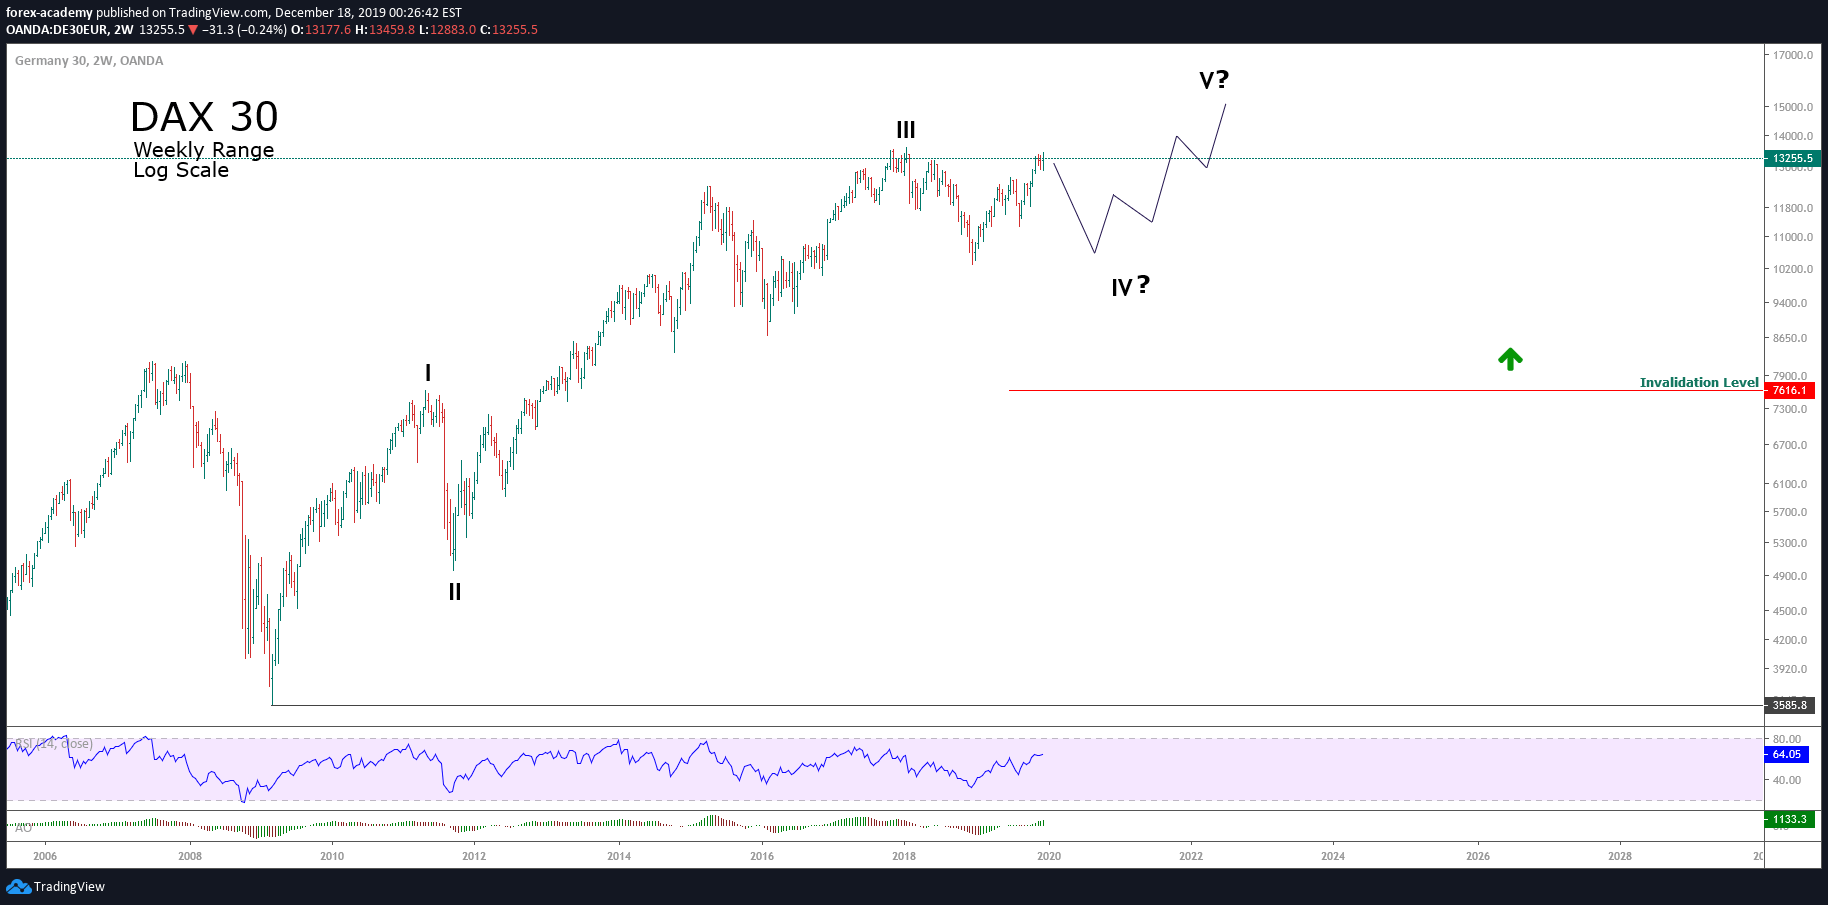
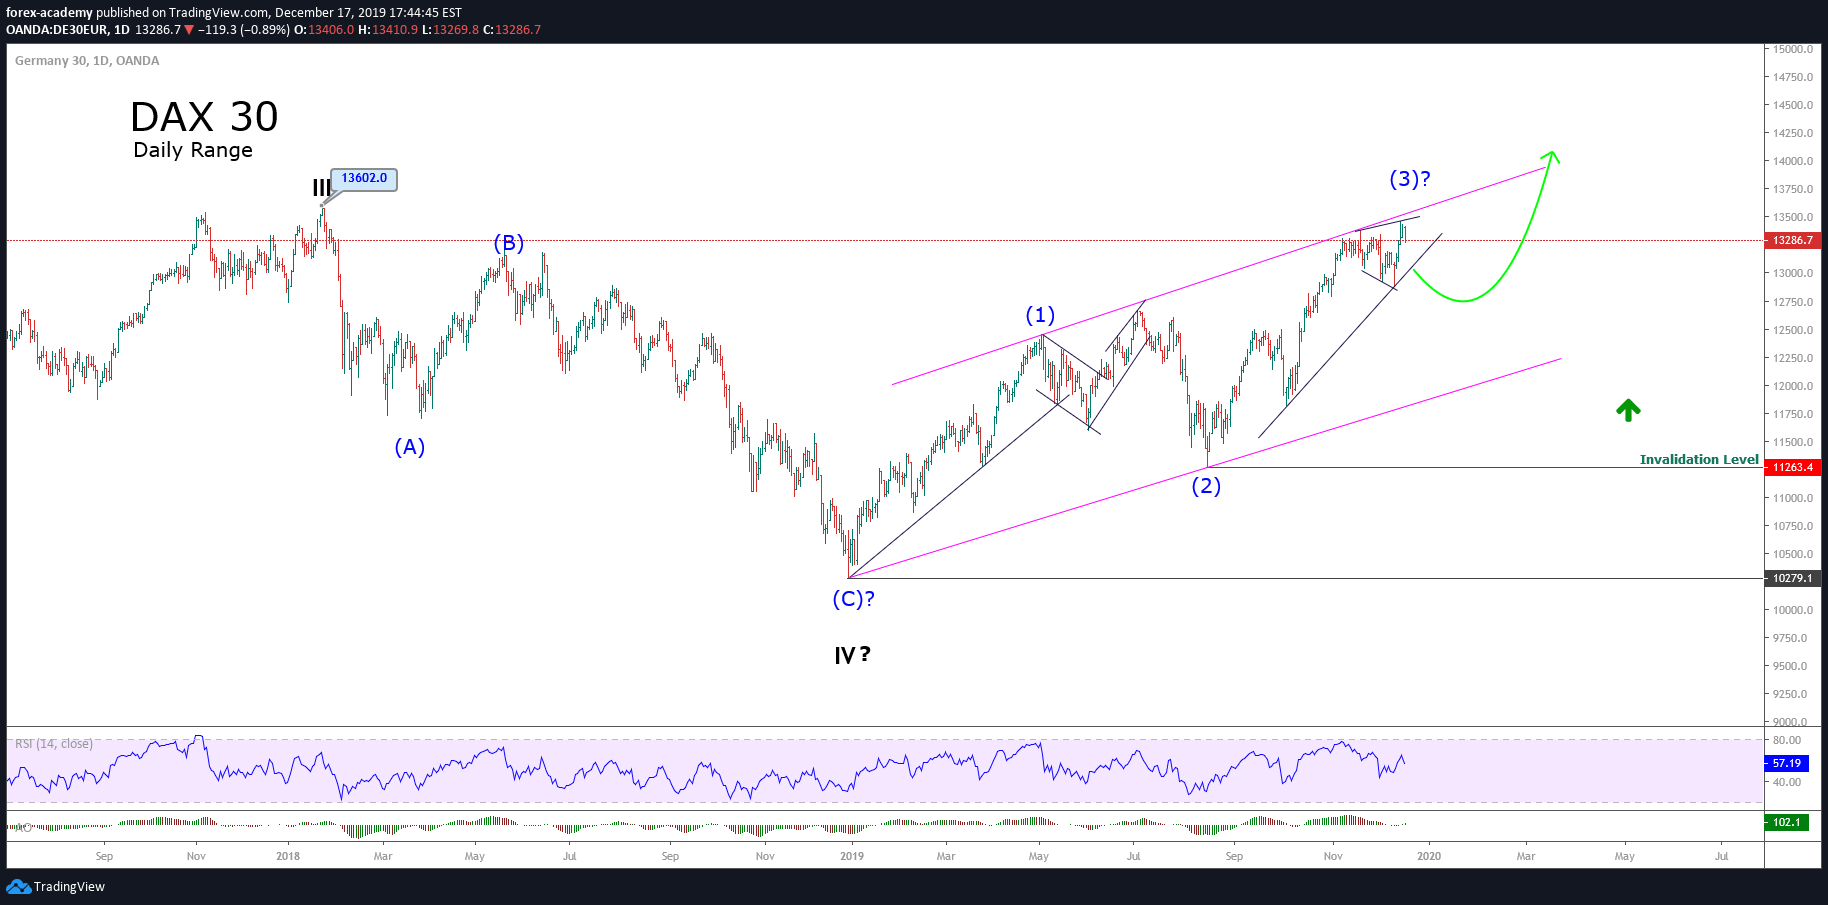
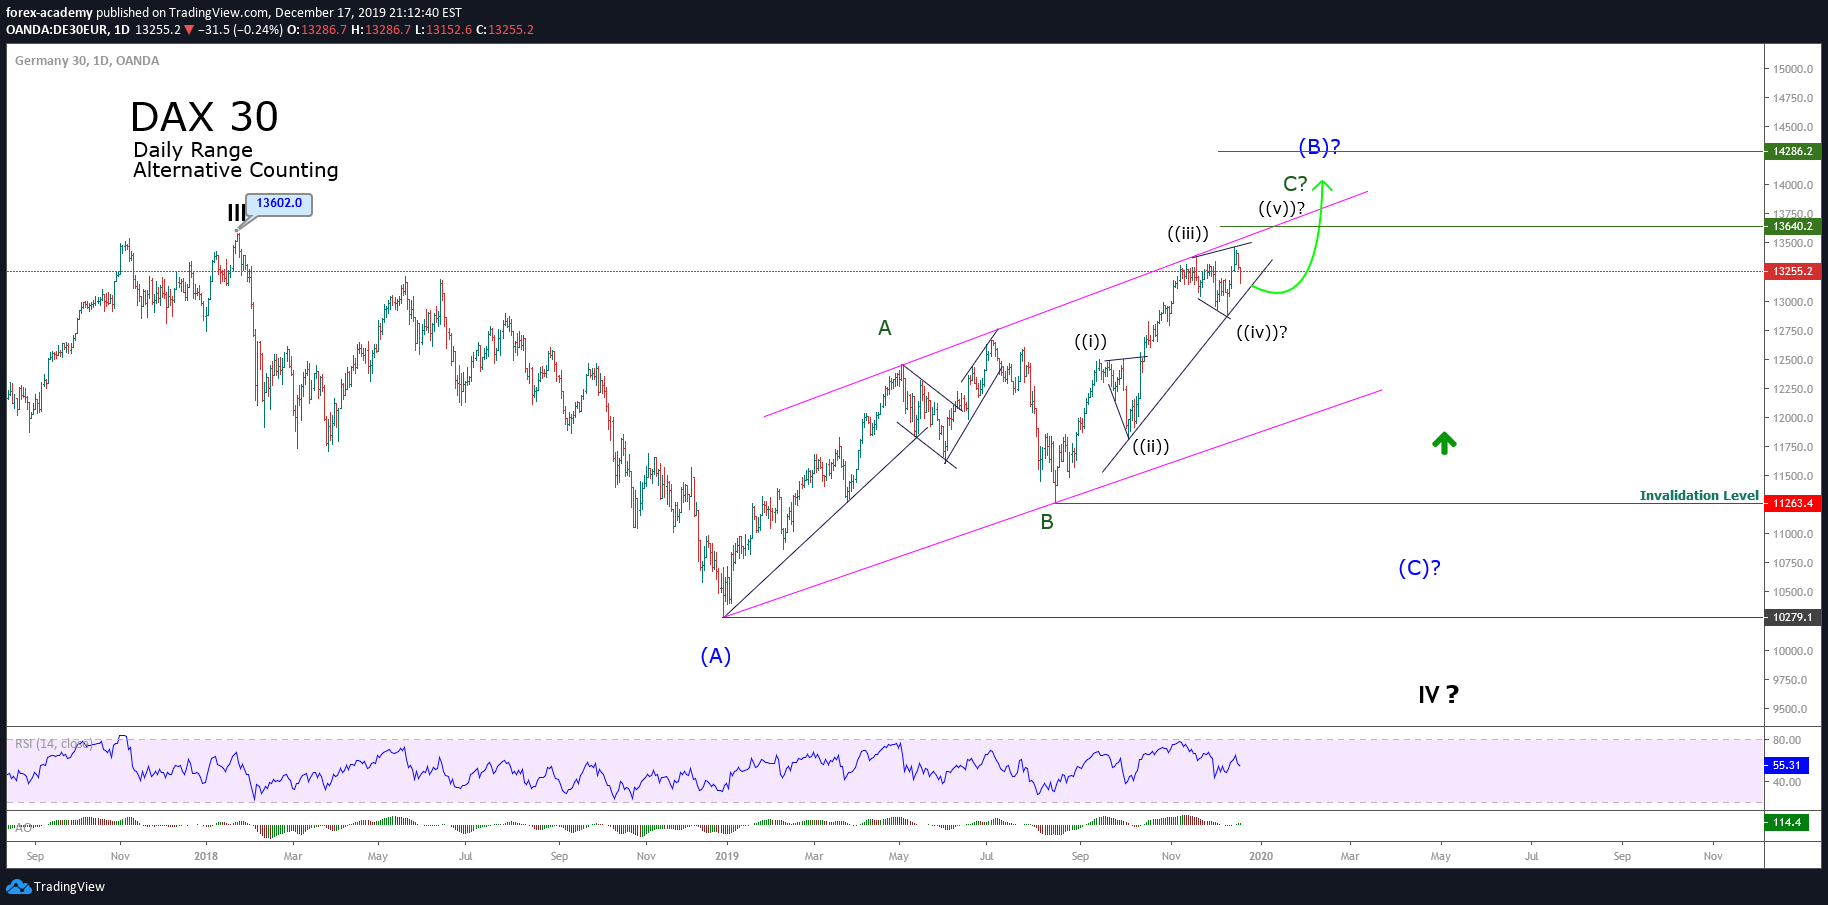
In its log-scale weekly chart, the DAX 30 reveals the price moving in a possible fifth bullish wave of Primary degree identified in black. At the same time, we note that the German benchmark had developed a third wave extended of Primary degree.

According to Elliott wave theory, in an impulsive structure, there can only be one extended wave. In this context, and based on the price development formed by DAX 30, we can recognize the movement of five internal impulsive waves of Intermediate degree labeled in blue within the third wave of Primary degree. This bullish movement ended in the second half of January 2018 when DAX climbed until 13,602 pts.

On the other hand, the alternation principle between corrective waves is recognized to happen between the second and fourth waves. While the second wave performed a corrective movement that took 133 days, the fourth wave was developed in 784 days.

As for the fifth wave’s potential completion, there is still no evidence to confirm this completion. On the one hand, according to Elliott wave theory, when in an impulsive sequence, the third wave is extended, it is highly likely that the fifth wave will fail in its attempt to reach new peaks.

On the other hand, we recognize that there is no confirmation of the fulfillment of the criterion of similarity in price, time, or both between the first and fifth wave. In other words, while the first wave advanced 4,024 pts in just over two years, the fifth wave, which started in the second half of March 2020,  has grown about 5,500 pts in barely six months.

To conclude, the overall market sentiment seems to have shifted from the extreme bullish to neutral. Furthermore, the market structure shows the progress fifth wave of Primary degree progress, giving exhaustion signals. Thus, our bias for the German DAX 30 index continues being neutral.

Categories
Forex Market Analysis

DAX Could Resume its Advances

Commentary from our Previous Analysis

Last July 06th, we commented in our mid-term technical analysis that the German index DAX 30 showed an incomplete upward corrective structure corresponding to a potential zigzag pattern.

The following figure illustrates our previous analysis released on July 06th, in which the structural sequence reveals an incomplete wave ((c)) of Minute degree identified in black. This observation led us to expect more upsides for the German index.

Market Sentiment Overview

DAX 30, in its daily chart, unveils the recovery developed from the mid-March, which took it from an extreme bearish sentiment until the strong bullish sentiment zone. 

On the previous chart, we observe that the price action found resistance in the opening 2020 zone, at 13,126.5 pts, where the German index developed a limited retrace in the past week. 

On the other hand, DAX 30 continues moving above the 60-day moving average, which leads us to conclude that the mid-term bias remains on the bullish side. In this context, the price action doesn’t show a reversal signal nor a highly volatile trading session. That leads us to observe a change in the sentiment of the traders, driving the price toward the 52-week high located at 13,828.8 pts.

Elliott Wave Outlook

The mid-term Elliott wave perspective for the DAX 30 index illustrated in its 4-hour chart reveals the market action is running in an ascending channel that remains intact, suggesting more upsides for the following trading sessions.

In terms of its Elliott wave sequence, the previous chart presents the German index advancing in its wave iv of Subminuette degree labeled in green, which seems to develop its first internal segment. In this context, according to wave theory, considering that the price advances in a corrective structure, the DAX 30 index should complete two additional internal legs before resuming its next rally, corresponding to wave v in green.

The next upward movement should complete its wave (v) of the Minuette degree, labeled in blue, Which began on June 29th at the low of 11,949.6 pts. At the same time, after its fifth wave ends, DAX 30 would complete its wave ((c)) of Minute degree, in black, which belongs to the wave B of Minor degree identified in green. This movement could extend its gains to 13,544.3 pts and even surpass the psychological barrier at 14,000 pts. In this context, once the German index completes its current bullish cycle, it could start a new bearish movement, corresponding to wave C of Minor degree.

Finally, the RSI oscillator seems to have found support above level 40, which leads us to confirm that the bullish bias remains intact. In consequence, further upward movement on the German index is a high probability event.

Categories
Forex Elliott Wave Forex Market Analysis

DAX Could Keep Making New Highs- An Elliott Wave Scenario Planning

The German index DAX 30 contains the 30 biggest German public companies traded in the Deutsche Böerse. In this article, we will review what to expect from the German index for the coming weeks.

The Big Picture

DAX 30, in its two-week chart, shows the price action progress of the index from the lowest level it touched in early March 2009. Once the DAX found buyers at the 3,585.8 points, the price rallied until 13,602 points when the German index completed the wave III labeled in black.


Since the March 2009’s low, the price moved in a bullish impulsive sequence that is still incomplete. The German index has already completed three waves of Primary degree, labeled in black. Currently, the price is running in its wave IV, also labeled in black.

The First Scenario

As we discussed in a previous article, scenarios allow us to analyze the likelihood of different “what if?” viewpoints.

The first possible scenario showed on the daily chart consists if wave IV is complete with the corrective move as an (A)-(B)-(C) sequence ended at 10,279.1 points.

Thus, a first approximation to the current path could be a possible ending diagonal pattern in progress. If this scenario is valid, the DAX should be moving in a wave (3) (labeled in blue), and we must assume that this wave is incomplete.

Consequently, the next leg should have a limited decline, and bringing the way for a new bullish movement as a wave (5).

The Alternative Count

The second scenario proposes an alternative count. In this case, the daily chart shows the price action moving in an incomplete wave (B), labeled in blue.

In this context, as the wave (B) is incomplete, the price action is running in an internal leg identified as wave C labeled in green. At the same time, wave C is incomplete and should finish the waves ((iv)) and ((v)) of Minute degree labeled in black.

According to the Elliott Wave Principle, under this scenario, DAX could be developing an irregular flat formation. This structure is characterized by following an internal sequence divided into 3-3-5, and the price tends to surpass the previous relevant high, in this case, located at 13,602 points.

If this scenario is valid, the price should develop a downward wave (C), which could drive to DAX to re-test the zone of the last Christmas low at 10,279 points.

The Conclusion

Both scenarios proposed to grant us the likelihood of a marginal upside and, then, a corrective move. However, the extension of the next path will confirm the Elliott wave structure that corresponds.

Probably, DAX will extend its gains over the 14,000 points, reaching a new all-time high before starting a deeper corrective move. This movement to the upside could emerge as a three or five wave structure, depending on which scenario is right, as stated above.

Categories
Forex Market Analysis

Forex and Indices – Daily Update – 06.08.18


Fundamental Overview


The U.S. Dollar leads the market sentiment.

Monday’s trading session starts with the US Dollar Index gaining 0.21 per cent against the main currencies. The Aussie Dollar dips 0.19 per cent expecting for the Reserve Bank of Australia (RBA) interest rate decision which will take place in the overnight session. The analysts’ consensus does not expect changes in the monetary policy decision which should remain at 1.5 per cent, this despite the inflation (YoY) reached the 2.1 per cent, beating the 2 per cent RBA’s target.

source: tradingeconomics.com


Technical Analysis


EURUSD


The EURUSD pair in the 1-hour chart is moving bearish, below the first daily support located at 1.1547 and the second daily support at 1.1528. For long positions, the price should close above the breakdown candle at 1.1566, with a potential profit target in the first daily resistance at 1.1597. In the short position case, the second daily support breakdown could drive to the confluence between the third daily support and the first weekly support at  1.15015. Consider that this level could act as a potential reversal level.


GBPUSD

The Cable is moving bearish and is the worst performer of the session falling more than 0.5 per cent. The GBPUSD pair is testing the first weekly support at 1.2924. The bearish movement continuation could send the price to the third daily support at 1.28999, consider this level as a potential reversal zone. For bullish positions, the price should break above the breakdown candle at 1.2968 level, with a potential profit target in the daily pivot level at 1.30055.


USDCHF


The Swiss currency, from the past week, has moved bullish in five clear moves, currently is testing the confluence zone between the first weekly resistance and the second daily resistance on the 0.9986 area. A breakout of this level could carry to the price to reach the third daily resistance located at 1.0007 level. In the opposite case, the reversal move from the current zone could drive to fall to the weekly pivot level situated at 0.99238.


EURCAD

After the Friday 03 breakdown candle, the EURCAD cross consolidates between the daily pivot at 1.50490 and near to the first daily support at 1.50113. A breakdown below 1.50113 as a bearish continuation, could pull the price to touch the second daily support located at 1.4967 level. For the contrary, the breakout and close above 1.50490, could lead to the EURCAD to re-test the previous high at 1.51009 level.


EURNZD

EURNZD cross is running slightly bullish inside of an upper degree sideways structure. The price is testing the zone between the weekly pivot and the daily pivot on the range between 1.7166 and 1.7170. For long positions, the price should break and close above 1.7170, with a potential target in the first weekly support at 1.7210. For short positions, the breakdown and close below 1.7133 should drag the price to the second weekly support at 1.70546 level.


FTSE 100

FTSE 100 in the first trading session of the week, is moving in a limited range between 7,635 and 7,679 pts., which could be characterised by the stational August lower volatility. For long positions the price should break above 7,679 pts., and could push to the British index to the HHL level at 7,740 pts. For the contrarian, the selling side should be valued if the price breaks under 7,635 pts., with a potential target in the first daily support located at 7,601 pts.


DAX 30

In the last four hours, DAX 30 is moving below the weekly pivot level, in a range between the 12,541 and 12,615 pts. After the DAX made the “V-Turn” in the first hours of the Monday session, testing the low of the Tuesday 02 session at 12,706 pts., we foresee that this level will be relevant short-term so we need to stalk it. Long positions should be considered as long as the price breaks and close above 12,615, with a potential target on the first weekly resistance at 12,653 pts. For short positions, the German index should breaks under the low of the day at 12,541, with a potential target on the first weekly support at 12,452 pts.


Categories
Forex Market Analysis

Forex and Indices – Daily Update – 03.08.18


Fundamental Overview


The U.S. unemployment rate declined to 3.9 per cent in July.

During the Friday trading session, the US Labor Department issued the employment data for July. Non-farm payrolls reached 157,000 new jobs, being lesser than the 190,000 expected by analysts, and was worst than the 248,000 jobs created in June. The unemployment rate for its part fell to 3.9% in July from 4% reported in June by the Labor Department. Despite these data, it is still not possible to reach the level reached in May, which reached 3.8%. Finally, Average Hourly Earnings increased to 0.3% in July from the 0.1% registered in June. The following question is how much will impact the increase in average earnings in the consumer confidence and inflation rate?

source: tradingeconomics.com


Technical Analysis


EURUSD

EURUSD in the 1-hour chart is consolidating between the daily pivot level and the first daily support. For long positions, we need to wait for the close above 1.16, with a profit target in the first daily resistance at 1.1640. Short positions should be valued if the price breaks and close below 1.1580 with a potential profit target in the second weekly support at 1.1544.


GBPUSD

GBPUSD is testing as the support the lower HHL at 1.30103, a consolidation below this level could be a signal for more weakness. For short positions, the price should break and close below 1.30 level with a potential profit target in the lower low of July 19 at 1.2957. For long positions, the price must to break and consolidate above 1.3038 with a potential target in the weekly pivot level at 1.3130.


USDCHF

The USDCHF pair has moved bullish following the triangle pattern as a continuation structure. Currently, the pair is running between the first daily resistance and the daily pivot level. Long positions could be valued if the price breaks above 0.9960, with a potential profit target in the first weekly resistance at 0.9976. For short positions, the price must close under the daily pivot level at 0.9941, with a potential profit target in the confluence between the second daily support and the first weekly support at 0.99.


EURAUD


EURAUD is moving sideways between 1.5724 and 1.5782. Currently, the cross is testing the lower base of the range. A breakdown could drive to the EURAUD drop to the first weekly support at 1.5673. In the bullish scenario, the price could reach the second daily resistance at 1.5818.


GBPAUD

GBPAUD is moving sideways testing the base of the lateral channel in the same way that EURAUD. The breakdown could trigger more falls with a potential target in the second weekly support at 1.7572. For the bullish case, the breakout above 1.7690 could lead the price to the potential profit in the daily pivot level at 1.7720.


FTSE 100

The British index FTSE 100 is consolidating in the confluence zone between the second daily support and second weekly support. For short positions, the price should break below 7,551 pts., with a potential profit target in the third weekly support at 7,516 pts. For the reversal case, long positions should be valued if the price breaks above 7,590 pts, with a potential target in the next swing zone at 7,661 pts.


DAX 30

The DAX 30 is consolidating below the third daily support. In this case, it is highly probable that the price makes a reversal move, at least, to the first daily support located at 12,684 pts. For short positions, the price should close below 12,485 pts, with a potential target in the second weekly support at 12,348 pts.


Categories
Forex Market Analysis

Forex and Indices – Daily Update 02.08.18


Fundamental Overview


In today’s session, market sentiment is led by the preference of risk protection assets facing the expectation for the US employment data, which will be announced on the Friday 03rd session. The US Dollar and Japanese Yen, which advanced 0.30% and 0.30% respectively. Within the commodity currencies group, the oceanic currencies are the hardest hit; the New Zealand Dollar is the worst performer which falls 0.49%, followed by the Australian dollar that drops 0.45% in the trading session.

Source: Forex Academy Collection


Technical Analysis


EURUSD

EURUSD in the 1-hour chart is moving bearish, below the weekly pivot level. For short positions, the price should break under the 1.1657 level with a profit target in the confluence zone between the first weekly support and the Lower HHL at 1.16061 level. For long positions (reversal case), the price should break above the breakdown candle at 1.1691, with a profit target between the confluence zone between the first weekly resistance and the Upper HHL at 1.1729.


GBPUSD

The pair GBPUSD is moving slightly bearish below the weekly pivot consolidating between 1.3090 and 1.3140. A breakdown below 1.309 could drive to the pound to the first weekly support at 1.3050. The bullish case, if the price breaks above 1.3140, the potential target is the first weekly resistance located at 1.3189.


USDCHF

USDCHF in the hourly chart is consolidating as a triangle pattern; this chart pattern suggests more upsides. For long positions, is essential that the price breaks above the weekly pivot level at 0.9937, with a profit target at the third daily resistance at 0.9974. Short positions should be valued if the price breaks under 0.9917, the potential target is the HHL at 0.9880.


EURGBP

The EURGBP cross is running bearish and is consolidating as a flag pattern. For bearish continuation, the price could drop to the confluence zone between the second daily support and the first weekly support at 0.8860. For long positions, the price should break above the weekly pivot level at 0.8897 with a potential move to the HHL at 0.8928.


GBPNZD

The GBPNZD cross is running sideways with a bullish bias in the last sequence which started from the first weekly support at 1.76318. For long positions, the price should break above the first daily resistance with a mid-term target placed on the confluence between the second weekly resistance and the third daily resistance at 1.7864. Short positions should be valued if the price closes below the daily pivot level at 1.77059, and the potential target is at the first weekly support at 1.76318.


DAX 30

DAX 30 is moving slightly neutral in the weekly pivot level at 12,746 pts. For short positions, the price should break below 12,707 with a potential target in the first weekly support at 12,604 pts. Long positions should be regarded if the German index closes above 12,800 pts, with a potential profit target at 12,920 pts.


FTSE 100

The FTSE 100 index shows bearish signals closing below the weekly pivot level at 7,687.9 pts. Continuation of the previous bearish move should be valued if the price breaks under the first weekly pivot at 7,635.2 pts., with a profit target in the confluence zone between the HHL and the third weekly support at 7,521 pts. Long positions could be valued if the price breaks above the weekly pivot level, with a potential target in the first weekly resistance at 7,754 pts. Additionally, note that if the price plunges to the third weekly support, it could be an interesting reversal level.


Categories
Forex Market Analysis

Forex and Indices – Daily Update 26.07.18


Fundamental Overview


Forex News: The market sentiment of the session was led by the US Dollar (DXY), which advanced against the main currencies group climbing 0.68 per cent. The Dollar boost was aided on the one hand, by the labour market data, in the Thursday session the Initial Jobless Claims data rose 217,000, which despite the increase of 9,000 from the previous week’s revised level, continue showing optimistic levels for the American economy. On the other hand, the ECB interest rate decision continues without changes for the common currency, contributing to the strength in the USD appreciation. The worst performer currency of the session was in the “commodities currencies group”; the Aussie (AUD) fell 1.04 per cent dragged by the dive in Copper price which retraced 1.59 per cent.

Forex News – Daily Performance

Forex News - Daily PerformanceSource: Forex.Academy Collection.


Technical Analysis


EURUSD

EURUSD made a false breakout which could not reach the first daily resistance, turning to the daily pivot and even falling below the weekly pivot point changing the market sentiment from bullish to bearish. For long positions, we need to see the breakout above the bearish breakdown candle at 1.1710, with a first potential profit target placed at the first daily resistance at 1.1756, the second potential target is the confluence level between the second daily resistance and the first weekly resistance at 1.1785. Short positions should be valued as a continuation of the breakdown, with a profit potential target at 1.1615. Pay attention to this area because the confluence with the third daily resistance at 1.16077 could be a potential buy zone.


GBPUSD

The GBPUSD pair in the 30-minutes chart tested the first daily resistance of the intraday trading session at 1.3214, After this, the price made a re-test, from where the pound started to fall and found support in the weekly pivot point at 1.31257. For long positions, the price should break over the daily pivot level at 1.31739 with a potential profit target at 1.3215 (first intraday resistance). Short positions should be valued as the continuation of the previous movement when the price breaks under the weekly pivot level (1.31257) with a potential target in second daily support at 1.31065.


USDCHF

The Swiss currency in the 30-minutes chart continues moving sideways between the first daily support (0.99007) and below the first daily resistance (0.9942). For long positions, the USDCHF should break above the first daily resistance at 0.9942 level with a short-term target at 0.9960 (weekly pivot level); for bearish positions, we need to see that the price to close below the intraday range at 0.9910 with a potential profit target in 0.9877 (first weekly support.)


EURCAD

The EURCAD cross in the 30-minutes chart is moving bearish, testing the second weekly support located at 1.52488. For bullish positions, the price should break and consolidate above 1.5278 with a potential target is at the first weekly support at 1.5325. For bearish positions, as a continuation of the trend, the price could drop to the third weekly support at 1.51778.


GBPCAD

The GBPAUD cross is moving bearish nearly above the first weekly support at 1.71211. For long positions, the price should breakdown candle at 1.7185 with a potential target on the daily pivot level at 1.7232. If we are looking bearish continuation, the price could see the bottom at the 1.70067 level (confluence zone between the third daily support and second weekly support.)


FTSE 100

FTSE 100 in the 30-minutes chart is moving in a narrow range below the daily pivot level (7,669.8 pts) and above the weekly pivot level (7,649 pts.) For bullish positions, the price should break above 7,686 pts, with a potential target on the first weekly resistance at 7,735 pts, which is the convergence zone with the second daily resistance. Bearish positions should be considered if FTSE 100 index breaks below the weekly pivot level at 7,649 with a potential profit target at the first weekly support (7,593 pts.), the second profit target is the HHL at 7,521 pts.


DAX 30

The DAX index 30 in the 30-minutes chart soared to the third daily resistance (12,827 pts), from this zone we have two options. Long positions could extend to the second weekly resistance at 12,912 pts, only if the price breaks above the 12,827 pts. The second option is for short trades; it could be considered if the price breaks below 12,715 pts with a profit target located at 12,604 pts.


Categories
Forex Market Analysis

Forex and Indices – Daily Update – 25.07.18


Fundamental Overview


President Trump will meet with Juncker.

US President Donald Trump will meet with the president of the European Commission, Jean-Claude Juncker, in an attempt to overcome the difficulties in bilateral relations between the United States and the European Union, specifically facing the application of additional tariffs to European cars exported to the United States which Trump seeks to increase.

The European Union applies additional 10 per cent tariffs to automobiles imported from the United States, while the United States applies only 2.5 per cent to European cars. Finally, President Trump commented on his Twitter account that both the United States and the European Union should eliminate all tariffs, barriers and subsidies, making trade between them both more just.


Technical Analysis


Forex Trading Indicators

EURUSD

Forex Trading Indicators: EURUSD continue moving sideways but with an intraday bullish bias. The price continues bouncing from the daily pivot at 1.1684. For intraday positions, long positions should be considered if the price breaks above 1.1710, with a potential profit target placed at the second resistance at 1.1747 and the second potential target in the area between the third daily resistance (1.1777) and the first weekly resistance (1.1785). Short positions should be valued if the pair breaks down the weekly pivot level at 1.1680 with a profit potential target at 1.1615.


GBPUSD

Forex Trading Indicators: The GBPUSD pair, as seen on a 30-minutes chart, broke up and consolidated above the first daily resistance on Tuesday 24th’s trading session. In the current session, the price can not strike above the first intraday resistance (1.3178.) For long positions, the price should break over 1.3175 with a potential profit target at 1.3212 (second intraday resistance). Short positions could be valued when the price breaks under 1.3140 with a potential target in first daily support at 1.3090.


USDCHF

Forex Trading Indicators: The USDCHF pair in the 30-minutes chart is moving sideways between the daily pivot (0.9937) and slightly below the first intraday support (0.9915). For long positions, the Swiss currency should break above the daily pivot level with a short-term target at 0.9960 (weekly pivot level); for bearish continuation, we need to see a price close below the intraday range at 0.9914, the potential profit target is at 0.9887 (third daily support).


EURAUD

Forex Trading Indicators: The EURAUD cross in the 30-minutes chart is testing the confluence between the daily and weekly pivot point at 1.5778. For bullish positions, the price should break above 1.58, and the potential target is at the first intraday resistance (1.5829). Bearish positions should be considered if the cross breaks under 1.5717 with a profit target in the confluence zone between the first weekly support (1.56735) and the second daily support (1.56612).


GBPAUD

Forex Trading Indicators: The GBPAUD cross is running sideways between 1.7680 and 1.7794. For long positions, the price should break above 1.7778, and its potential target is slightly above the first weekly resistance at 1.7858. In the case of short positions, the price should break down 1.7680, with a potential target at 1.7589 level.


FTSE 100

Forex Trading Indicators: The FTSE 100 in the 30-minutes chart turned bearish moving from the daily pivot at 7,699 to the weekly pivot level (7,649.9). For bullish positions, the price should break above 7,700 pts, with a potential target at 7,791 pts, which is the convergence zone between the second weekly resistance level and the second daily resistance. Bearish positions should be valued if the British index breaks under the weekly pivot level at 7,649 with a potential profit at the first weekly support (7,593 pts.), the second profit target is the HHL at 7,521 pts.


DAX 30

Forex Trading Indicators: DAX 30 in the 30 minutes chart. After failing the test to the first weekly resistance (12,737.1 pts.), the German index moves bearish below the daily and weekly pivot level turning to bearish the market sentiment. For long positions, we need to see the breakout above 12,600 pts with a potential target in the re-test of the first weekly resistance at 12,737 pts. A short position is considered if the price breaks down 12,537, and its potential target is the second weekly support at 12,293 pts with extension in the HHL at 12,143 pts.


Categories
Forex Market Analysis

Forex and Indices – Daily Update – 24.07.18


Fundamental Overview


Mixed data of preliminary PMI in the Eurozone.

The Flash Purchase Managers Index (PMI) data in July show signs that this third quarter for the eurozone has begun to lose the buoyant momentum that registered during the first half of the year. Manufacturing PMI modestly reached 55.1 points, slightly higher than the 54.9 points reached in June. In the opposite side, Services PMI index fell to 54.4 points from the 55.2 points reported in June. The slowdown in growth momentum suggests that similar levels could be seen in August.


source: tradingeconomics.com

The main cause of this deceleration could be attributed to the fuels price increase of oil as well as the increase in tariffs on steel and aluminium.


source: tradingeconomics.com


Forex and Indices Technical Analysis


EURUSD

The EURUSD in 30-minutes chart continues consolidating. The price is moving above the weekly pivot suggesting a bullish pressure for the pair. Long positions should be considered if the price breaks above 1.1710, with a potential profit target placed at 1.1775. Short positions should be valued if the pair breaks down 1.1667 with a profit target at 1.1615


GBPUSD

The GBPUSD in the 30-minutes chart is consolidating the Friday 20th rally. For long positions, the price must break above 1.3137 with a potential profit target at 1.3208. Short positions should be considered if the price breaks under 1.3085 with a potential target at 1.3022.


USDCHF

The pair USDCHF in the 30-minutes chart is developing a bullish retrace of the previous sell-off. For bullish positions, the next resistance is 0.996; for bearish continuation, the critical support to break down is 0.9922, and the potential profit target is at 0.9887.


EURCHF

The EURCHF cross in the 30-minutes chart is testing resistance with the 200-period moving average which is converging with the first daily resistance. For long positions, we need to see the breakout of the 1.1629 level with a potential target at 1.165 (Weekly Pivot Zone). In the bearish side, the price should break under 1.1603 level, with a potential profit target at 1.1582.


GBPCHF

The GBPCHF cross is turning bullish after the 1.3049 level breakout. Long positions have the potential target at 1.3117, coinciding with the third daily resistance. On the short side, the price should break down 1.3001 level, with a potential target at 1.2965 level.


FTSE 100

FTSE 100 in the 30-minutes chart shows that the price is moving above 24 and 200 moving average. Also, the British index has bounced from the weekly pivot level, the next resistance es at 7,728. For bullish continuation, the next target is 7,786 pts, which is the convergence between the second weekly resistance level and the third daily resistance.


DAX 30

DAX 30 in the 30 minutes chart shows that the price has surpassed the third daily resistance without to make a reversal move to the daily pivot level, it suggests that the German index should continue with the bullish bias with a target placed at 12,855 pts (previous resistances confluence area.)


Check out Forex and Indices technical analysis for July 16, 2018.

Categories
Forex Market Analysis

European Union and Japan Sign a Trade Deal – Forex and Indices – Daily Update – 17.07.18


Fundamental Overview


European Union and Japan sign a trade deal

Financial Market Updates: Japan and the European Union signed a trade deal amid uncertainty generated by the protectionist policy led by the Trump Administration. The trade deal creates the largest open economic area. The agreement promises to eliminate 99 per cent of tariffs.


Technical Analysis


EURUSD

Today the EURUSD pair failed the bullish continuation, remaining in the consolidation range, it suggests that the pair should continue with the previous bearish cycle. In consequence, we update our bias from a bullish to a bearish move. The potential sell zone (PSZ) is between 1.1760 and 1.1807 with a bearish target placed at 1.1293. Invalidation level is 1.1852.


GBPUSD

As noticed in previous Daily Updates, the GBPUSD pair in a 2-hour chart is moving sideways, the short-term pivot level at 1.3275 has failed, in consequence, GBPUSD should make a new lower low. The Pound could fall to the area between 1.3024 and 1.2885, completing a major degree bearish cycle. Invalidation level is at 1.3472.


USDCHF

The complex corrective structure that is developing the USDCHF pair in the 2-hour chart shows a signal more for a bullish continuation than a downward reversal move. In the last session, the Swiss currency tested and bounced from the potential buy zone. We foresee USDCHF making a new higher high with the target placed in the area between 1.0112 and 1.0141. Invalidation level is at 0.9857.


EURJPY

The EURJPY cross in the 2-hour chart is moving bullish in an ascending wedge; the price tested the exhaustion zone between 132.01 and 133.05, from where we expect a bearish reversal move as a bull trap. We foresee drops to the area between 129.87 to 129.28. Consider that if the price makes a bull trap after this, it is highly likely that the price will make a bullish failure pattern.


GBPJPY

The GBPJPY cross in the 2-hour chart is making a consolidation pattern after a bullish impulsive move, which could make fresh highs to the area between 150 and 150.70. Our vision for the cross is that the price could make a limited low to the 146.2 level before it continues its previous bullish trend. Invalidation level is 143.799.


FTSE 100

As commented in previous Daily Update, FTSE 100 in the 2-hour chart continues consolidating between 7,720 pts and 7,550 pts. We maintain our bias as neutral in FTSE 100 index.


DAX 30

DAX 30 in the 2-hour chart soared above the 12,600 pts and is near to reaching the exhaustion zone at 12,695 pts. The next control level is 12,807 pts which could drive to 13,020 pts, completing an internal bullish cycle. Invalidation level of the bullish cycle is 12,104 pts.


Categories
Forex Market Analysis

Forex and Indices Daily Update – 16.07.18


Forex Fundamental Analysis


New Zealand CPI (YoY) increase 1.5 per cent in June.

The yearly inflation change in New Zealand increased by 1.5 per cent, below the 1.6 per cent foreseen by analysts and advance from the 1.1 per cent reported in April. Housing and household utilities advanced 3.1 per cent, followed by rentals which were up 2.5. The climb in oil prices, almost 10 per cent, boosted the transport sector to increase the CPI (YoY) 2.0 per cent.


source: tradingeconomics.com


 Technical Market Analysis


EURUSD

In the last session, EURUSD surpassed the Short-term Pivot Level at 1.1690. Now we expect a consolidation structure as a flag pattern before it continues increasing the bullish momentum to the target area at 1.19067. Invalidation level is 1.15080.


GBPUSD

The GBPUSD pair is still moving sideways in the 2-hour chart, testing the Short-term Pivot Level at 1.3275. The breakout of this level should activate the bullish continuation with a target placed in the 1.3475 zone. Invalidation level of the new bullish cycle is 1.30494.


USDCHF

The bearish move after the bull trap looks like a first bearish impulse. From now we should expect a retrace in three waves, probably to the 1.0009 area before it continues with another decline. In the long term, the USDCHF is bullish, in consequence, we will maintain neutral for this pair expecting opportunities to go long with the main trend.


EURNZD

The EURNZD cross in the 2-hour chart has broken down the ascending short-term trendline at 1.7248 with a bearish high momentum candle. We expect more drops with a target placed at the psychological level of 1.70. Invalidation level is at 1.73782.


GBPNZD

The GBPNZD cross in the 2-hour chart has broken down the ascending trendline as the same way that the EURNZD has. This suggests that we should see more strength in the NZD group against the other currencies. The first target is at 1.92393 from where we could see an exhaustion of the bearish cycle. Invalidation level is at 1.95802.


FTSE 100

The FTSE 100 in the 2-hour chart continues to consolidate, developing a complex corrective structure. In terms of the traditional Technical Analysis, the structure could be a Diamond Pattern, if this is correct, we should see declines to the 7,400 area, if the falls extend, the next bearish target area could be 7,100 pts zone. We prefer to maintain neutral expecting for long positions.


DAX 30

DAX 30 in the 2-hour chart still is moving below the 12,600 pivot level. We can consider two scenarios: the first one is after the 12,600 level breakout to expect more climbs to the area between 12,695 to 12,742. The second one is if the price breaks down, the bearish target could be 12,040 pts. In the same way that in the FTSE, our position changes from bullish to neutral expecting long positions.


Categories
Forex Market Analysis

Forex and Indices – Daily Update – 13.07.18


Fundamental Forex Trading Overview


BoE’s Deputy Governor Cunliffe suggests a delay in a rate hike.

The Bank of England’s (BoE) Deputy Governor, Sir Jonathan Cunliffe, said on Friday that we should be cautious in an interest rate increase and that there are still arguments for a “stodginess” policy. Cunliffe suggests a delay in a rate hike due, despite the economic growth, to the wage rate is not increasing to the 3 per cent that the BoE had initially forecasted.

The BoE’s next Monetary Policy Committee meeting will be on August 2, for this meeting most economists polled expect the rate to increase.


Technical Analysis


 EURUSD

The EURUSD in the 2-hour chart is bouncing from the Potential Buy Zone as expected in our previous Daily Update on Thursday 12th when we commented that EURUSD was making higher highs and higher lows. Now when the pair is testing support in the green box, we expect new upsides to 1.19067 (orange box – maturity area) completing a major degree connector. Invalidation level is 1.15080.


GBPUSD

The GBPUSD in this 2-hour chart is completing a new bearish leg in the Potential Buy Zone. We foresee a breakout of the short-term trendline and the continuation of the previous bullish cycle with a target placed in the 1.3475 area. Also, the exhaustion area is the target area of the inverted head and shoulders pattern which will be active once time the short-term pivot level was surpassed. Invalidation level of the new bullish cycle is 1.30494.


USDCHF

As noticed in our last Forex and Indices daily update, the Swiss currency is being the weakest currency. The USDCHF in the 2-hour chart soars to the highest level since May 2017. Using the correlations in the US Dollar group with DXY, EURUSD and GBPUSD, we could suspect that this is a false breakout.


EURCAD

The EURCAD cross in the 2-hour chart has broken down the short-term pivot level at 1.53684 and made a pullback to the same level turning the support into resistance. We expect more falls with a target placed in the area between 1.5144 to 1.5061. Invalidation level is 1.55225.


GBPCAD

The GBPCAD cross in the 2-hour chart is consolidating testing the 1.73 psychological support level. It is likely that the price moves bullish making a false breakout before to continue the previous bearish impulse. Invalidation level is at 1.76907.


FTSE 100

The FTSE 100 in the 2-hour chart continues to consolidate, developing a complex corrective structure and testing around the 7,700 level. We foresee a limited upside for the British index to 7,792 pts. Invalidation level is 7,508.


DAX 30

The DAX 30 in the 2-hour chart is moving bullish, testing the 12,600 pivot level. We expect more climbs to the area between 12,695 to 12,742. The critical level to watch is the 12,807 pts, from where if the price surpasses it, DAX could rise to 13,020 pts. Invalidation level is 12,104.


Categories
Forex Market Analysis

U.S. Inflation Grows Firmly In June – Forex and Daily Update – 12.07.18


Fundamental Overview


U.S. inflation grows firmly in June.

Forex Trading Signals: The Consumer Price Index (YoY) in the United States in June reached the highest level in 6 years, climbing to 2.9% from the 2.8% reported in May. According to what was stated by the U.S. Bureau of Labor Statistics, the CPI in June increased driven by the food index, which advanced 0.2 per cent; and the gasoline index, which grew by 0.5 per cent. Despite this increase, the energy index decreased 0.3 per cent, mainly due to the Energy Services index, which fell 1.5 per cent in June.

Forex trading signals Source: Forex Trading Signals – Forex.Academy Collection


Technical Overview


EURUSD

The EURUSD 2-hour chart is showing bullish signals due to the price making higher highs and higher lows. Currently, the common currency is making a retrace to the green box, from where we expect new upsides to the 1.19067 area, completing a major degree connector. Invalidation level is 1.15080.


GBPUSD

The GBPUSD 2-hour chart is making a new bearish leg after the upward sequence in 5 moves started on June 28th. We expect a continuation of the previous bullish cycle from the zone between 1.3181 to 1.3099 with a target placed on 1.3475 area from where the pound should decide the next moves. Invalidation level of the bullish cycle is at 1.30494.


USDCHF

The USDCHF 2-hour chart is making a breakout of the consolidation range which is developing from the first half of June. The RSI oscillator shows that price has a bullish bias. In the short-term, we expect a limited retrace to incorporate to the bullish long-term trend. The invalidation area is 0.98579.


EURCHF

The EURCHF cross in the 2-hour chart is moving bullish after the breakout above 1.1565 level. We expect more upsides which could drive the cross to the targets at 1.1768 in the short-term, and 1.19475 in the long-term. Invalidation level is 1.14799.


GBPCHF

The GBPCHF cross has broken up the psychological 1.32 resistance. We expect a retrace to the area between 1.319 until 1.31057, from where the price should continue rising to 1.3312 level in the short-term and the 1.3442 level in the mid-term. Invalidation level is 1.3023.


FTSE 100

FTSE 100 in the 2-hour chart continues moving sideways in a complex corrective structure, but the main trend is bullish. We expect a limited upside to 7,792 level, from where we should wait for a new connector completion. Invalidation level is 7,508.


DAX 30

The DAX 30 is bouncing from the Potential Buy Zone (green box), from where we expect an upward movement to the area between 12,695 to 12,742. If DAX climbs above 12,807 pts, the German index could reach and test the 13,020 level resistance. Invalidation level is 12,104.


Categories
Forex Market Analysis

Forex and Indices – Daily Update – 03.07.18


Fundamental Overview


Asian Session with all eyes placed on the RBA decision.

Forex and Indices: In the Overnight session, markets will place their eyes on the Board of Reserve Bank of Australia (RBA) interest rate decision in which the analysts’ consensus expects that Governor Philip Lowe and the Board members decide to keep the interest rate at the record low 1.50% which is unchanged since August 2016.

Despite the unemployment rate drop in May to 5.4%, and the inflation rate kept unchanged in May at 1.9%, being near to the RBA inflation target; The cooling on housing market and  the increased volatility in global markets due mainly to the tariffs conflicts, could drive to the RBA  to decide to keep the interest rate unchanged again.

Forex and Indices - Daily Update

Source: Forex.Academy Collection – Forex and Indices


Technical Analysis


EURUSD

The pair still is moving in a bearish wedge pattern which, if it breaks below 1.15649, could drive the price to a new lower low ending the bearish cycle near to the 1.1450 zone coinciding with the lower trendline of the bearish wedge. In the opposite case, if EURUSD breaks above 1.16801, the common currency could drive to test the invalidation level placed at 1.1852.


GBPUSD

GBPUSD is still running in a bearish wedge and has a new lower low pending before the cable starts a new bullish cycle. This lower low could be developed as a Bullish 2B pattern (Bear Trap) as a reversal pattern. As long as the price does not make a reversal pattern, the price will continue its bearish bias. Invalidation level of the bearish cycle is at 1.34725.


USDCHF

USDCHF is developing a triangulation structure. The RSI oscillator shows that the price has a bearish bias. However, as the price doesn’t have a definite trend in the short-term, we will expect a false breakout before we define our bias for this pair. In the long-term, the Swiss currency is consolidating a rally which started on February 15th, 2018.


EURAUD

The EURAUD cross maintains a bullish bias, due to the price moving inside an ascending wedge. Additionally, RSI is running in an ascending trend and is above the 60 level. We can expect a false breakout to the 1.59 zone before it completes the bullish cycle. If the price falls below 1.5702, we could evaluate short positions.


GBPAUD

The GBPAUD 2-hour chart shows a sideways move, as long as the price moves above 1.78747. The cross will have a last bullish target pending, placed at 1.8085 with an invalidation level below 1.78080, from where we will consider short positions with a profit target in the 1.74 zone.


FTSE 100

The FTSE 100 is moving sideways as a complex corrective structure consolidating the March to May rally. In the middle of global volatility in the stocks markets, we prefer to consider long positions rather than the short positions. The short-term support to control is 7,500 pts.


DAX 30

The DAX 30 2-hour chart shows that the German index has found support at 12,100 pts. From this area, we could start to propose potential zones for entry in the long side.


Categories
Forex Market Analysis

Forex and Indices – Daily Update – 29.06.18


Fundamental Overview


“Green sprout” in New Zealand?

Forex Market Update: The increase in building consents in New Zealand which reached 3,407 permits in May, the highest level reached since June 2004, represents 7.1% after the fall of 3.6% registered in April. Will this be a green outbreak of improvement in New Zealand’s macroeconomic conditions or will it be only an isolated effect?


Forex Market UpdateSource: Forex.Academy Collection – Forex Market Update


Technical Analysis


EURUSD

The pair is moving in a bearish wedge pattern which could drive to the price to a new lower low ending the bearish cycle near to the 1.145 zone coinciding with the lower trendline of the bearish wedge. Invalidation level of the downward cycle is at 1.18523.


GBPUSD

GBPUSD is moving in a bearish wedge in the same way as the EURUSD. We expect a spike to the PRZ before it makes a reversal move, maybe in the next week. A key level to watch out for is 1.30 as a psychological level. Invalidation level of the bearish cycle is at 1.34725.


USDCHF

The Swiss currency is moving in a triangulation structure which represents a continuation of the previous bullish move. However, as an inverse correlation with EURUSD, the movement could be a false breakout as a bull trap. In this pair, we will maintain in a neutral position before taking a position in the market.


EURCHF

The EURCHF cross is turning bullish after the breakout above the 1.1565 level, a throwback to this level could drive the cross to the 1.1772 short-term targets. RSI is supporting this scenario with the upward trendline.


GBPCHF

The GBPCHF 2-hour chart shows the importance of the invalidation level of a proposed scenario and its ex-post analysis. In this cross, we expected a limited retrace to the area between 1.3124 and 1.3089 for an upward move, with the profit target in the area between 1.3323 and 1.3374. However, after the retrace to the blue box, the GBPCHF cross continued falling. Watching the AO oscillator between May 18th and June 1st, we can appreciate that the bearish move corresponds to a bearish wave 3, then the retrace analysed is a wave 4. In consequence, the final movement as a bearish wedge pattern, which should end the bearish cycle.


FTSE 100

The FTSE 100 is moving sideways with a bearish bias which is correcting the previous rally realised from March to May. Despite the bearish bias of global indices, we prefer to avoid the short positions expecting the timing for entry in the bullish side.


DAX 30

In the Thursday 28th trading session, DAX 30 fell to the control level finding support to the corrective move. Now we expect consolidation on the 12,100 pts from where the German Index could start a new bullish cycle.


Categories
Forex Market Analysis

Good News Expected for RBNZ Decision – Forex and Indices – Daily Update – 27.06.18


Fundamental Overview


Good News Expected for RBNZ Interest Rate Decision.

During the overnight session, Stats NZ released the Trade Balance data from New Zealand, which shows an improvement in the commercial situation in June. Exports of meat grew by 17% reaching $817M. While the meat exported increased by 12 per cent reported Stats NZ, the destination of the main export was China, which rose by 27 per cent reaching $1.2B in June. The European Union exports also increased rising by 17 per cent ($664M).

On the other hand, vehicles, parts, and accessories led imports by 25 per cent, climbing to $924M. Whereas, Oil imports were reduced by 30 per cent, falling to $455M in May.

rbnz interest rate decision

Source: Forex.Academy Collection.


Technical Analysis


EURUSD

EURUSD is making the retracement of the first impulsive move testing the blue box from where the euro could start the continuation of the previous movement. RSI is testing support above the 40 level, which makes us suspect that the EURUSD pair could be testing support. Our mid-term vision is that the common currency could beat 1.1853, even reaching the target placed at 1.19467. Invalidation level is at 1.1508.


GBPUSD

The GBPUSD pair is still consolidating the previous impulsive move in the descending long-term trendline. The price is moving in the Potential Reversal Zone (Blue Box) from where we expect the bullish reaction as a continuation of the previous movement. We foresee fresh highs with the target at 1.3443. Invalidation level is at 1.31020.


USDCHF

USDCHF is moving slightly bullish consolidating in the long-term ascending trendline. Our main vision for USDCHF is the formation of a flag pattern reaching the 0.99277 level before continuing with the previous bearish move with a target placed on the area between 0.97225 and 0.96495. Invalidation level of this scenario is at 0.99909.


EURNZD

EURNZD continued developing a bullish impulsive move. As we forecasted in a previous Daily Update (June 20th, 2018), the cross is moving near to the target area at 1.7064. Still, we foresee a more upside to the 1.7148 level. Invalidation level is 1.6572.


GBPNZD

GBPNZD still is moving in an ascending channel to the Potential Reversal Zone proposed in our Daily Update for June 20th. The price could reach the target between 1.944 and 1.958 area, from where the cross should complete a bullish cycle. Invalidation level is 1.8909.


FTSE 100

The FTSE 100 index bounced from the sell-off performed on the Monday 25th trading session; despite this bounce, we expect more dips. FTSE should reach at least the 7,468.3 level before it completes the short-term bearish cycle. From this zone, we could build a new bullish connector. If the index breaks down, the Control Level is likely to reach from the 7,182 level to 7,073 area. Watch out for the RSI which is moving sideways between the 40 and 60 level; this coincides with the consolidation pattern that still is running. Invalidation level of the bearish scenario is 7,793.5.


DAX 30

DAX 30 is testing support on the PRZ forecasted at 12,238 pts. The RSI level at 26 makes us foresee that the German index is developing a wave three. In consequence, more downsides are pending; likely DAX 30 plunge below 12,100 pts. Invalidation level of the bearish cycle is at 13,170 pts.


Categories
Forex Market Analysis

Forex and Indices Daily Update 25.06.18


Fundamental Overview


Understanding the Conference Board (CB) Consumer Confidence Index (CCI).

Tomorrow, the U.S. CB Consumer Confidence Index will be released. This reflects the business conditions and likely developments for the months ahead. The report is issued monthly and is a barometer of the health of the U.S. economy from the perspective of the consumer.

The current CCI level reported in May is 128 pts, and the analysts’ consensus for June is a decrease to 127.6 points. The decreasing could be attributed to the protectionist policy which the Trump Administration is boosting. Despite this decline, consumer confidence keeps having record highs. The highest level reached in the year is 130 pts, the record high since December 2000.

CCI level -forex daily chart trading strategy

Forex Daily Chart Trading Strategy


Technical Analysis


FOREX DAILY CHART TRADING STRATEGY

EURUSD

Since June 22nd, the EURUSD has made an impulsive move reaching the short-term target area between 1.17043 and 1.17617. Our vision is that the common currency could strike the 1.1853 level before it starts a brief retracement to the area between 1.1679 and 1.15892, from there, the price should make a new rally with a target placed at 1.19467. Invalidation level is at 1.1508.


GBPUSD

GBPUSD bounced on June 21st aided by the Bank of England monetary policy decision. Now the price is consolidating the previous impulsive move. We should see a limited fall in three waves to the area between 1.3237 and 1.3165, from where we foresee fresh highs with the target at 1.3443. Invalidation level is at 1.31020.


USDCHF

The USDCHF pair is testing the long-term ascending trendline. Our forecast for USDCHF is that it could make a flag pattern reaching the 0.99277 level before we see the continuation of the previous move with a target placed on the area between 0.97225 and 0.96495. Invalidation level of this scenario is at 0.99909.


EURJPY

The EURJPY cross is moving in a corrective structure as an A-B-C Pattern, which could make a new lower low. RSI Oscillator is running supported by an ascending trendline refecting the corrective structure of the principal trend. We foresee a new bearish move to 124.94 and 126.62; this area converges with the ascending long-term trendline from where EURJPY could start a new rally. Invalidation level of the bearish cycle is 130.347.


GBPJPY

The GBPJPY cross is building a consolidation pattern as a flag pattern, which could make fresh highs to the area between 149.34 and 150.70. Our vision for the cross is that the price could reach the bearish mid-term trendline before it collapses to the lower line of the ascending channel completing a bearish flag pattern of major degree. The next key support is 143.209, invalidation level of the main bearish cycle is at 152.775.


FTSE 100

The FTSE 100 index started the week by falling for the sixth consecutive week. In this session the British index broke down the key support at 7,548, the low reached on June 18th. As we forecasted, FTSE continues their selloff approaching the Potential Reversal Zone in the 7,400 area, from where FTSE could build a new bullish connector. If the index breaks down, the Control Level is likely, that reaches from 7,182 level to 7,073 area. Invalidation level of the bearish scenario is 7,793.5.


DAX 30

DAX  30 is moving bearish in the same way that FTSE 100 is developing a Dead Cat Bounce Pattern. Today, the German index has fallen to the Potential Reversal Zone forecasted, from now we are cautious because the index could start to bounce. The price action, and RSI Oscillator and Awesome Oscillator do not show divergences or reversal signals. To summarise, the short-term bias is bearish. Invalidation level of the bearish cycle is at 13,170 pts.


Categories
Forex Market Analysis

Analysts Expect Raises on Inflation and Retail Sales Data – Forex and Indices – Daily Update – 21.08.18


Fundamental Overview


Analysts expect raises on inflation and retail sales data.

The Canadian Dollar will be the driver currency of this Friday 22nd trading session, with the release of Inflation and Core Retail Sales data. Analysts expect the Consumer Price Index (CPI) for the month of May to rise to 0.4%, driven mainly by the increase in fuel and food prices; with this increase, the CPI (YoY) estimated should reach 2.5%, being higher than the 2.2% reported in April.

On the other hand, analysts foresee that core retail sales (MoM) would rise to 0.5% during the month of April, which represents an optimistic scenario since the contraction of 0.2% reported in March.

This data could contribute to the scenario of a possible hike in the interest rate by the Bank of Canada (BoC), being in line with what was commented by the BoC Governor Stephen Poloz, who stated that he expects an increase in the interest rate soon.


Technical Analysis


EURUSD

EURUSD bounced from the lowest level in three weeks from 1.1507 to 1.1633. Our vision is that the common currency could make a limited recovery to the 1.17 area before we see fresh lows likely in the 1.1425 zone. Invalidation level of the mid-term bearish cycle is 1.1852.


GBPUSD

GBPUSD bounced from the PRZ forecasted at 1.3109 aided by the Bank of England (BoE) monetary policy decision. Now we should see fresh higher highs and lower highs to validate the change in bias. The short-term resistance level is at 1.3298.


USDCHF

The USDCHF pair broke down the short-term ascending trendline. Now we expect that the price tests the long-term ascending trendline. Our main vision for USDCHF is that it could make a new bearish leg with first support at the 0.98 level, and 0.9788 as the second support.


EURCAD

EURCAD could make a new higher high in the upper line of the ascending channel with a target in the 1.5533 area. After this move, if the price breaks down the short-term ascending trendline, we should see a flag pattern as a continuation of the previous movement.


GBPCAD

GBPCAD is developing in an ascending wedge, which could see fresh highs at the 1.7732 level, as a false breakout before it falls to the long-term ascending trendline. The first support level to watch out for is 1.7455.


FTSE 100

FTSE 100 continued falling for the fifth consecutive week. In the current session, it tested support at 7,548, the low reached on June 18th. Our vision for the British index is that it could complete the corrective sequence in the 7,400 area, from where FTSE could build a new bullish connector.


DAX 30

As was commented in our previous Daily Update, the DAX 30 is moving bearish, developing a Dead Cat Bounce Pattern. In the current trading session, the German index has fallen below the May 31st low at 12,547.6. The next support level is in the 12,300 area, from where we foresee the DAX should start to bounce.


Categories
Forex Market Analysis

Economists Expect Lower Growth in New Zealand – Forex and Daily Update 20.06.18


Fundamental Overview


Economists expect lower growth in New Zealand.

Lower growth could reach New Zealand for the first quarter of 2018. Amongst the reasons for the lower GDP is the cooling in the housing market, as well as the low prices of dairy products.

Analysts polled expect the quarterly growth to be only 0.5%, being lower than the 0.7% of the previous quarter, this would result in an increase of 2.7% annually, compared to the 2.9% reported in the last quarter of 2017. This deceleration would force the RBNZ to maintain the interest rate at the next monetary policy decision meeting.


FOREX DAILY ANALYSIS


EURUSD

EURUSD is still testing the bottom line consolidating below 1.16 as a relevant resistance level. We expect a new lower low between 1.1520 and 1.1425. Invalidation level of the mid-term bearish cycle is 1.1852.


GBPUSD

GBPUSD is moving bearish, and still, we expect that the price complete the bearish cycle in the key support at 1.3109, creating a bullish connector. Short-term resistance level is 1.3298.


USDCHF

USDCHF still is moving bullish seeking the parity making a flag pattern. We still maintain our vision for the Swiss currency that could make a new bearish leg with a mid-term target on 0.98 level testing the bullish long-term trendline.


EURNZD

EURNZD is developing a bullish impulsive move. We foresee that the cross should to make a retrace as a flag pattern from where EURNZD could bring a new opportunity to incorporate us into the bullish trend with a profit target at least at 1.7064. Invalidation level is 1.6572.


GBPNZD

GBPNZD is running upward building an ascending channel. Our vision is that every dip is an opportunity to go long with a target between 1.944 and 1.958, from where the cross should complete a bullish cycle. Invalidation level is 1.8909.


FTSE 100

The FTSE 100 bounced and broke the bearish short-term trendline, but this move could be as a Dead Cat Bounce Pattern. The British index could complete a new bearish leg to the 7,400 area, from where FTSE should build a new bullish connector.


DAX 30

DAX 30 is moving with a bearish bias, the bounce of the current trading session could be a Dead Cat Bounce Pattern, which could drive us to see new lows below the short-term support at 12,547.6, it could even fall to the 12,300 area, from where we foresee that the German index should start a new bullish sequence.


Categories
Forex Market Analysis

U.S. Housing Starts Soars – Forex and Indices – Daily Update 19.06.18


Fundamental Overview


U.S. Housing Starts soars to 2007 highs in May.

Daily Forex Technical Analysis: The U.S. Housing Starts surged 1.35 million in May, the highest level in near to 11-years and over the 1.31 million forecasted. Building permits fell to 1.301 million, under the 1.35 million expected by the analysts.

This buoyant data is attended by the housing market sentiment which fell to 68 points in June from the 70 points reported in June. This decrease in the homebuilder’s sentiment is produced mainly by the rising costs in lumber prices.

On the other hand, the 20-City Home Price Index in the US reported by S&P/Case-Shiller in May soared to the record high 208.62 points, the highest level previous to the 2008 financial crisis.


Daily Forex Technical Analysis


EURUSD

Tha pair EURUSD is moving sideways finding to test the May 29th level support at 1.15102, and it looks like the price is making a bottom pattern. For it to place us on the bullish side in EURUSD, we expect the short-term resistance breakout at 1.16445.


GBPUSD

The Pound broke down the low of the May 29 (1.32045 level)  losing the 1.32 psychological level. Now we expect that the price will complete the bearish cycle in the area between 1.3109 and 1.2936, from where the price should start to bounce at least to the 1.3298 level.


USDCHF

USDCHF is running bullish to the parity making a flag pattern. Our vision for the Swiss currency is that it could make a new bearish leg with a mid-term target on 0.98 level.


EURCAD

EURCAD is developing an expanding triangle inside an ascending channel; we expect that the cross makes a new high to the 1.555 area before we see more drops to the 1.49 zone.


EURAUD

EURAUD reached the mid-term target zone in the 1.57 area. We foresee that if the cross breaks down the short-term trendline, EURAUD will complete a flag pattern, which should drive to new lower lows, likely to 1.53 area.


DAX 30

DAX 30 is moving laterally in a major degree structure testing the long-term pivot level at 12,652.2. A breakdown of this level could drive the price to test the short-term support at 12,547.6, it could even fall to 12,300 area, from where we expect the start of a new rally.


FTSE 100

FTSE 100 broke down the May-29th low making a new lower low; this makes us foresee that the British index should see a new lower low, probably to the 7,400 area, from where FTSE should build a new bullish connector.


Categories
Forex Market Analysis

An Interest Rate War is Coming? – 13.06.18 Daily Update


Fundamental Overview


An Interest Rate War is Coming?

Financial Market Latest Updates: In today’s session, the Federal Reserve has decided to increase the interest rate by 0.25%, hiking it from 1.75% to 2%. Beyond commenting the Dollar Index movements or the FED Chairman Jerome Powell’s remarks at the press conference; this interest rate increase the United States is carrying out will mean a change in the course of the monetary policy for the rest of the principal Central Banks.

On the one hand, the ECB has been starting to raise the discourse of the end of the bond purchase program in June and a potential increase in the interest rate that would start from 2019. On the other hand, the Bank of Canada Governor, Stephen Poloz, has commented that there will possibly be a new increase in the interest rate in July (currently at 1.25%). The Reserve Bank of Australia is not far behind in this discourse of rate increases and considers that given the level of inflation in Australia, sooner than later there should be an interest rate hike (the current interest rate is 1.5%.)


Technical Analysis


EURUSD

EURUSD continues moving sideways in the pennant pattern expecting the ECB interest rate decision where we foresee that the pair makes new highs above the 1.19 level.


GBPUSD

GBPUSD continues testing the blue box and bouncing. We expect significant moves in this pair in the next week with the BoE Monetary Policy Meeting scheduled on Thursday 21st. As long as the price does not make a 2B Pattern, a new cycle will not initiate.


USDCHF

USDCHF as forecasted in our previous Daily Update, made a bullish false breakout and then a bearish move. We still expect fresh lows at least to the blue box between 0.9831 and 0.9809.


EURGBP

EURGBP is moving sideways. In terms of the traditional Technical Analysis, we could consider the structure as an inverse head and shoulders pattern and a continuation pattern. Our main scenario is that the cross could strike the 0.8921 level mid-term.


EURJPY

EURJPY is testing the 130.27 resistance, forming an ascending triangle as a continuation pattern of the previous bullish move. We expect that the price reaches the 132.5 level, from where the cross should make a new bearish connector.


FTSE 100

FTSE 100 still is moving in the lateral channel. Remember that the next BoE interest rate decision meeting will take place on June 21st. Despite none of 63 economists polled by Reuters expect any move from the current 0.5%, a surprise effect of the rate hike could move the British Index considerably.


DAX30

DAX 30 still is moving in the sideways corrective structure, it’s probably waiting for the ECB interest rate decision and the Mario Draghi discourse before it continues the bearish bias.


Categories
Forex Market Analysis

Forex and Indices – Daily Update – 12.06.18


Fundamental Overview


The exposure of the historic meeting and agreement reached between the U.S. President Donald Trump and the North Korean leader Kim Jong Un for the “denuclearisation” of the Korean peninsula have already been discounted. However, currently, the uncertainty is being headed by the statements of IMF’s Director Christine Lagarde, who has said that the escalation in trade tensions are affecting the global economy, commenting that clouds over global economy are ‘getting darker by the day’ after the G7 summit.

World Trade Organization General Director, Roberto Azevedo, also echoed the comments made by Lagarde adding that the increase in commercial tensions that we are witnessing involves a high economic impact, which can undermine the strength of economic growth since the last financial crisis.”


Forex Technical Analysis Signals


EURUSD

EURUSD is consolidating, developing a pennant pattern bounded by the levels 1.173 and 1.184. A breakout of this pattern could lead the price to the 1.196 level. Invalidation level keeps in 1.1616.


GBPUSD

GBPUSD moves in a corrective structure as a flag pattern testing the blue box area as a support level. The breakout of the 1.342 level should lead to the pound to 1.359 resistance. The invalidation level of this scenario is 1.3254.


USDCHF

The structure of the Swiss currency looks like an Irregular Flat Elliott Wave. If this scenario is valid, and for inverse correlation with EURUSD, the USDCHF pair could reach 0.99 level before it drops again. Invalidation level is 0.9983.


EURCAD

EURCAD moves inside a pennant pattern; we expect a breakout of this structure to lead the price to new higher highs at least to 1.5533 level where we foresee the start of a new downward move for to build a new bearish leg.


EURAUD

In the same way as EURCAD and EURUSD, the EURAUD cross is consolidating, but in this case, the price is moving inside a pennant pattern. In the short-term, if EURAUD breaks above 1.5621, we expect fresh highs that should reach the 1.5761 level. Invalidation level for this scenario is 1.5282.


DAX 30

DAX 30 continues driving sideways, in the current session it has touched the blue box reaching the 12,948 pts level, rejecting to the downside. We maintain our scenario on which a price decline below 12,652 pts should activate a bearish second leg, with a target of 12,000 pts. Invalidation level is 13,102 pts.


FTSE 100

A lateral channel of 112 pts bounds the FTSE 100; our vision is that the British index should make a false bullish breakout before continuing its previous downward movement to complete the corrective structure. The potential target is 7,390 with an extension at the 7,073 level. The invalidation level of the bearish scenario is 7,903.5.


Categories
Forex Market Analysis

Forex and Indices – Daily Update – Two Summits One Weekend


Forex Fundamental Analysis Signals


In this session, markets are moving expectant at the G7 summit news, mainly due to the tone between President Trump and the rest of the leaders of the seven wealthiest economies of the world. The expectation occurs in the context of the tariffs imposed by the Trump Administration as part of the “America First” agenda to the steel and aluminium imports from Canada, European Union, and Mexico. The United States and European Union have established a dialogue for this Friday, said a French official. President Macron is confident in the advancement of trade issues that have split the United States and its trade allies.

Another summit that markets are following is the meeting of the Shanghai Co operation Organization (SCO). The meeting will begin this Saturday and will include with China, Russia, India, Pakistan and other four nations from Central Asia.  The importance of this meeting lies in the fact that while G7 leaders are discussing the new protectionism, the Chinese President Xi Jinping and the Indian Prime Minister Narendra Modi will talk about an “open and inclusive world economy.”


Technical Analysis


DAX 30

The DAX 30 opened the session with a bearish gap. Still, the index is in a corrective structure. This is normal after the rally that started developing on March 26th when DAX found support at 11,726.6 up to May 22nd when it reached the 13,204.3 points. Our vision for DAX is that price could make a new lower low at 12,528.9 pts.


FTSE 100

The FTSE 100 maintained the same consolidation structure from the past week. In the same way as the DAX 30, the FTSE is consolidating after the rally showed since March 26th when it touched the 6,866.9 level and then made an extended wave soaring to 7,903.5  in May 22nd. We foresee a new lower low at 7,468.3 points.


EURUSD

The common currency is developing a retracement from the 1.1840 level; the highest level reached in four weeks. We expect the pair will make a new higher low to the area between the levels 1.1724 to 1.1667, as an A-B-C structure. From this zone, we should see new higher highs to the 1.19 area.


GBPUSD

The pound is making a corrective move shaping an A-B-C pattern, which should dip to the area between 1.33423 and 1.32880. From this area, the pair GBPUSD should continue the bullish cycle started on May 29th, when the price touched the 1.32045 support. The mid-term target is at 1.35940. Invalidation level for this sequence is 1.32544.


USDCHF

The Swiss currency is making a bearish move from the highest level reached on May 7th, when it touched the 1.00563 level. From this area, the pair started to dip in five waves, finding support at 0.97883 on June 7th. From this level, the USDCHF pair bounced above the last corrective structure touching the 0.98877 price. If 0.97883 represents the short-term bottom, we expect a new lower move to the area between 0.98313 and 0.98092, from where the USDCHF could begin to see new higher highs.


GBPJPY

The cross is making a corrective pattern as a flag structure, if the price reaches the zone between 146.234 and 145.719, we foresee a new rally which should carry the price to new highs between 148.908 to 149.645 area.


GBPCHF

GBPCHF is building an expanding ascending triangle. Our main scenario is a new low to the area between 1.31242 and 1.30806, from this area we expect a new higher target in the zone between 1.33236 and 1.33745. Invalidation level is 1.30581.


Categories
Forex Market Analysis

Forex and Indices – Daily Update – June 07th, 2018

Forex and indices trading signals for the end of the trading session of June 07th, 2018 and short-term forecast for the coming sessions. In this issue, we make a follow-up of the price cycles of: EURUSD, GBPUSD, USDCHF, EURAUD, EURJPY, FTSE100 and DAX 30.


Hot Topics:


  • Pairs against the Greenback in key levels
  • Euro crosses close to make a second leg
  • European indices trading signals remain with bearish bias but are not activated.

Pairs Against The Greenback In Key Levels

EURUSD reached the 100% of equal waves in the 1.1831 level; this suggests is that the common currency should make a corrective move, probably to the area between 1.172 to 1.166 levels. The bullish target long-term is the area between 1.1889 to 1.194 levels. Invalidation zone is below 1.1616 level.


USDCHF reached the blue box zone from where we anticipate that the Swiss currency should start a bounce. For this pair, our position has changed from bearish to neutral.


GBPUSD, as expected in the previous daily update, is making a corrective move as a bearish connector, where we expect more rises to the pound. Short-term bullish target is between 1.3485 and 1.36 levels. Invalidation level is below 1.3254.


Euro Crosses Close To Make a Second Leg

EURJPY has reached our target area for the first cycle. By the Alternation Principle from the Elliott Wave Theory, we foresee a complex correction, probably a sideways structure. In principle, the correction could end near 128.6 level. From this zone, the price should pay its bearish divergence. As our readers could see in the chart, the corrective sequence is not tradeable (dashed line.) Invalidation level is 126.330.


For EURAUD we have two scenarios. The first scenario consists of the completion of the internal bullish cycle with the price reaching the 1.5547 level, where it could begin a corrective move. The second scenario is for the price to make a corrective sequence in three waves to the 1.5382 area, where the cross could start a rally to the 1.5547 level. If it soars above the Control Level at 1.5621, it is likely that the price would complete its internal bullish cycle in the zone between 1.57025 to 1.57612 level. Invalidation level is at 1.5282.


European Indices Remain With Bearish Bias But Are Not Activated

The FTSE closed the session in the blue box, the potential bearish move with the target in the area between 7,468 to 7,390.5 is active. If the British index breaks down and closes under the 7680, the bearish targets will be activated. The invalidation level remains above 7,803 pts.


In the same way, the DAX remains with a bearish bias short term, selling positions will activate only if the price breaks down and closes below 12,700 pts, with a profit target at 12,500 pts, and the potential extensions to deeper falls to 12,300 and 11,900 pts. Invalidation level remains above 13,102 pts.


Categories
Forex Market Analysis

Forex and Indices – Daily Update – June 06th, 2018

Hot Topics:

  • US Trade Balance Falls.
  • Euro raises supported by ending bonds debate.
  • European Indices Move Sideways.

US Trade Balance Falls

The US Trade Balance deficit falls in April to the lowest level for seven months, boosted by the shipments of industrial materials and soybeans.

GBPUSD continues moving higher, aided by the weakness in the Dollar Index. For the coming sessions, we expect that the price makes a bearish connector, probably in the 1.348 zone before it sees new higher highs. Invalidation level is at 1.3254.

Today Forex Market Analysis


The USDCHF pair still moves sideways above the bullish long-term trendline. If the price breaks down the trendline, we expect more dips. In the first instance to the target should be 0.9783; in the second instance, the next support is 0.9725. Invalidation Level is 0.9983.


Euro Raises Supported by Ending Bonds Debate

In the next week, the ECB could start to debate the end of their bonds buying said Peter Praet, the ECB chief economist. This is not the first signal of the QE ending, on May 29th, the ECB member Sabine Lautenschlaeger noted that “June might be the month to decide once and for all to gradually end net asset purchases by the end of this year.”

EURUSD continued rising after the flag breakout and supported by the macroeconomic data. The next resistance levels are 1.1889, 1.19635 and 1.2102. Invalidation level is updated to 1.1616.


EURJPY continues its rally that started on May 29th when it tested the support 124.621. The first corrective structure it developed was brief, this move makes us suspect that the rally continuation could lead to the 132 to 133 area. In the short-term, the cross could see the 130.270 level for bringing steps to a consolidation structure before it continues the bullish cycle. Invalidation level is 126.330.


EURNZD is making a bullish connector inside a bearish major degree structure. Our vision is that the price could visit the area between the 38.2% to 50% of Fibonacci Retracement before it continues its downtrend. In the short-term, the price made a breakout of the 1.6713 level; this move could lead the price to areas between 1.6866 as first resistance and 1.6947 as the second resistance. Invalidation level is below 1.66.


European Indices Move Sideways

The FTSE 100 is moving in a range between 7,680 and 7,720, expecting more volatility. The price could make a limited high completing an A-B-C pattern before it continues the bearish cycle.


The DAX 30 is running sidelong but could complete three waves move in the zone between 12,946 to 13,014 pts before it continues the bearish sequence started on May 23rd, with the bearish target in the 12,528 pts area. If the price plunges below 12,386, the DAX could complete the bearish cycle near to the 12,000 pts. Invalidation level is updated to 13,102.7 pts. In case that price breaks above this level, the next bullish target is 13,250 pts.


Categories
Forex Market Analysis

Forex and Indices – Daily Update – June 05th, 2018


FOREX MARKET NEWS AND ANALYSIS

Hot Topics: 

  • U.K. PMI Services helped the Pound Group to Show Reversal Signals.
  • Main Pairs Against the US Dollar Keeps Consolidating.
  • European Indices Close Lower.

U.K. PMI Services helped the Pound Group to Show Reversal Signals.

PMI Services in May reached 54 pts, the highest level for three months. After the data release, GBPUSD raised to 1.34 level. Now we expect a corrective move before a new bullish cycle. Invalidation level remains at 1.32544.


As we expected in our last Daily Update, GBPAUD made a bullish move from the second weekly support to the weekly pivot level direction. Now after the impulsive move, we expect that the price could make a consolidation move as a flag pattern before proceeding with its previous movement.


GBPNZD is making a potential bottom structure if the breakout of the 1.91286 level activates the figure, with the profit target at 1.93377. We are surveilling the 1.9005 level as Control Level.


Main Pairs Against the US Dollar Keep Consolidating.

The common currency still is developing a consolidation structure after the impulsive move started in the previous week. RSI has found support at the 41.69 level which makes us foresee a new clue for the bullish reversal move that could be starting.


The inversely correlated currency with the Euro and Swiss Franc is also making a sideways consolidating structure. We expect more declines for this pair; our first bearish target is 0.9815, the second target is 09783 level. Invalidation level is 0.9983.


European Indices Close Lower.

The FTSE 100 broke down the ascending flag pattern in the blue box. The invalidation level remains at 7,803 pts. In the same way, the RSI has broken down its ascending flag pattern. The British index could visit the 7,500 level, or if it moves below this level, the FTSE could make a second leg down before a new bullish cycle.


DAX 30 has made the same breakdown in the ascending wedge pattern. RSI also has broken down its ascending wedge. The first bearish target is 12,528. In case that price falls below 12,386, the next bearish targets are 12,125 and 11,990.


Categories
Forex Market Analysis

Forex and Indices – Daily Update


Hot Topics: 


  • Major currencies show bullish signals against the greenback.
  • Indices recovers but more falls are expected.
  • Pound crosses could turn bullish.


Major currencies show bullish signals against the greenback.

Forex Daily Market Update

The EURUSD broke up the flag pattern testing the 1.17 level resistance. Now the price is making a throwback to the congestion area. RSI also is showing bullish signals with the breakout and test to the flag structure.


GBPUSD looks like as its turning bullish. On the one hand, the price is making higher highs and higher lows. On the other, the RSI found support above the 40 level; this signal makes us foresee that a turning movement is near for the pound.


USDCHF is in a congestion zone between 0.9845 and 0.989. We expect a new bearish move to the region between 0.9784 and 0.9815. The shape of the price sequence that started on May 9th looks like a consolidation structure and is likely that the price could see new highs.


Indices recovers but more falls are expected.

FTSE 100 is recovering from the last selloff but is moving in the Potential Reversal Zone. RSI moves in an ascending channel but it still didn’t break the key level 60 to show bullish signals. Invalidation level is above 7,803.5.


In the same way as the FTSE, the DAX is moving in a consolidation structure as an ascending wedge. RSI is moving in the 51.53 level, but it doesn’t mean that in the short-term the trend is bullish, it suggests that the bias remains bearish and the price is making a retracement. Invalidation level is above 13,040.6.


Pound crosses could turn bullish.

GBPCAD is moving sideways and tested the monthly pivot level at 1.73191 becoming a relevant resistance. We think the cross could make a new low near the first weekly support at 1.71310, where the price could start a bullish cycle with a profit target at the weekly second resistance confluence area on 1.7510. Invalidation level is placed below 1.7065.


GBPAUD  has been moving mostly bearish during this session, but we expect that the price could make a bullish reversal move in the area between 1.7360 and 1.73195, where it could bounce from, with the eyes placed on the weekly pivot at 1.76242. Invalidation level is below 1.725.


Categories
Forex Market Analysis

Forex and Indices – Daily Update – May 31st, 2018


Update On Forex Market Hot Topics:


  • The U.S. Commerce Department announces tariffs to EU.
  • Euro currency shows bullish signals against crosses.
  • European Indices Continue the Selloff.

The U.S. Commerce Department announces tariffs to EU.

The U.S. Commerce Secretary Wilbur Ross announced that it would impose tariffs on European Union steel and aluminium imports as shortly as Thursday. The European Commision President Jean-Claude Junker considered this measure to be “totally unacceptable” and will introduce a settlement dispute with the WTO, and will announce counterbalancing measures in the coming hours, he said.

In this session, EURUSD is correcting the bullish move showed in the last trading session where it climbed above the Invalidation level placed at 1.16317. We foresee that the price could make a corrective structure as a flag pattern, as a continuation of the previous move. The invalidation level is at 1.15205, the next targets levels are 1.1811 and 1.1975.

Update On Forex Market


GBPUSD is consolidating the bearish trend, short-term. In the last trading session, the cable has corrected the strike to the invalidation level of the bearish cycle located at the 1.33231 level. Our vision is that the Pound still has space for more declines, likely to be the area between 1.31095 and 1.29365.


USDCHF is moving close to the bullish long-term trend-line, where the first target area is placed between 0.9815 and 0.9783. If the price continues its movement down, the next support levels are 0.9725 and 0.9641. Invalidation level remains at 0.99831.


Euro currency shows bullish signals against crosses.

EURJPY has made a bear trap (or 2B Pattern) testing the 124.621 level, from where the price made a bullish impulsive move advancing above the 127 level. Now we anticipate that the price could make a consolidation pattern as a flag and then from its breakout, the price could see new highs in the 131 zone. Invalidation level is below 124.998.

Update On Forex Market


EURGBP is moving inside a consolidation structure where the last internal cycle shows an impulsive bullish bias. Oscillators confirm the bullish bias of the cross. The breakout of the upper line of the channel could boost the price to the 0.89 area. Invalidation level is 0.8997.


European Indices Continue the Selloff.

The FTSE 100 closed the session slightly bearish. The British index could make a new high as an A-B-C pattern to 7,800 pts, from where the price could create a new lower low with 7,573 pts as a target. Invalidation level of the bearish cycle is 7,803.5.

Update On Forex Market


DAX dipped more than 1%, dragged like other Euro-zone indices; EURO STOXX 50 felt 1.00%, IBEX 35 drop 1.05% in a session driven by the U.S. tariffs to the EU. The DAX could find support at 12,528 pts, but if it breaks down the 12,386 level, the plunge could be more deep finding support at the 12,000 pts. Invalidation level of the bearish cycle is 13,040 pts.


Categories
Forex Market Analysis

Forex and Indices – Daily Update for May 29th, 2018

FX Market Update Hot Topics:

  • U.S. CB Consumer Confidence in May Slightly Below the Analysts’ Expectations.
  • RBA Board Member says “who cares what’s happening to house prices.”
  • The indices sell-off continues, supported by the Italian crisis.

U.S. CB Consumer Confidence in May Slightly Below the Analysts’ Expectations.

The consumer confidence drops slightly below the analysts’ consensus at 128 pts versus the 128.2 expected. However, the confidence level in April was corrected down from 128.7 to 125.6 pts. Despite this correction, the U.S. Consumer Confidence keeps in the highest levels since 2001.fx

EURUSD accelerated its drops to the critical zone of the bearish cycle. The common currency falls for the seventh consecutive week breaking down the November 2017 support at 1.15539. For the coming sessions, we expect a limited fall to 1.14483 and then a recovery in three waves which could see the 1.197 level in the long-term. In the short-term, we update the invalidation level of the bearish cycle to 1.16317.


In the same way with EURUSD, GBPUSD continue its plunges for a seventh consecutive week dropping to the 38.2% Fibonacci level of the previous long-term cycle. We foresee new falls to the region between 1.31095 and 1.29357. Updated invalidation level is 1.33231. If price breaks above the break-down candle, we will consider changing the bias from bearish to bullish.


The Swiss currency is moving sideways expecting more volatility for the Greenback. We continue seeing more drops for this pair to the zone between 0.9815 to 0.9783 levels. The new invalidation level is 0.99831. The break-down candle signals more declines in the short-term.


RBA Board Member says “who cares what’s happening to house prices.”

The RBA’s Board Member Ian Harper said to the Wall Street Journal that “the bank will raise their interest rates when it has a basis for doing that because inflation is starting to pick up.” Member Harper added, “when all that starts to line up who cares what’s happening to house prices.” Harper continued that the RBA target “doesn’t target house prices.”

EURAUD. As the scenario expected, the price fell under the control level; now we expect a limited drop to the area between 1.5307 to 1.5195 levels, from where the price could start to bounce. Invalidation level is 1.54554.


GBPAUD is bouncing in the Potential Reversal Zone, 1.76773 to 1.75597, from where we foresee a bullish move to 1.78995. Invalidation level is on 1.77451. In the short-term, RSI shows signals of change in the trend bias from bearish to bullish.


The indices sell-off continues, supported by the Italian crisis.

FX Market Update: This Tuesday, the FTSE has continued the sell-off started last Wednesday 23rd, and the price consolidates below the invalidation level at 7,750 pts proposed in previous updates. The impulsive bearish move could stop briefly at 7,570 pts and make a bounce.  The new invalidation level for the short-term is 7,803.5 pts, and the main bias keeps on the bearish side.


In the same context, DAX  30 opened with a bearish gap, testing the mid-term support on 12,659.1 pts. Considering the bearish gap context, it is probable that the German index in the short-term makes a Dead Cat Bounce Pattern, watching the 12,000 pts as a target. Invalidation level is updated and established at 13,040.6 pts.


Categories
Forex Market Analysis

Indices Broke Down Their Bullish Trendlines

Hot Topics:

  • Indices Broke Down Their Bullish Trendlines.
  • Euro Group Close to Find a Short-Term Bottom.
  • US Dollar Climbs Before Minutes Release.


Indices Broke Down Their Bullish Trendlines

Trend Line Analysis: Indices in the early trading hours of the session opened lower breaking down its bullish trendlines. However, FTSE and DAX did not crumble below their invalidation levels. Likely, both indices could make a 1-2-3 pattern. Invalidation level in FTSE is at 7,753.3 points.


On the other hand, DAX has paid its bearish divergence in 12,958 points, as said in a previous Daily Update. Invalidation level of the bullish structure is at 12,918. We expect the German index to have a consolidation structure and reveal the new potential move.


Euro Group Close to Find a Short-Term Bottom

The Euro group, in general, is moving bearish. Currently it is consolidating and showing signals of a potential reversal; however, we expect a brief price recovery, to then see more downward moves long-term.

EURUSD continues its downtrend and has two new potential bearish targets in the short-term: 1.16734 and 1.15637. From this zone, the pair could create a new bullish connector. Invalidation level is moved at 1.18298.


EURAUD continues above the Control Level and is moving sideways. For the oceanic cross, we have two scenarios:

  • First scenario: the price breaks below the control level and finds new lower targets in 1.53074 or 1.52952.
  • Second scenario: the price breaks above the invalidation level at 1.56192 and sees new highs, the first resistance is 1.57233 level.


EURCAD is bouncing from the first bearish cycle target level at 1.50373. The invalidation level for this bearish cycle is 1.51385. If the price breaks above this level, the price could see the 1.5533 level again.


US Dollar Climbs Before Minutes Release

Trend Line Analysis: The US Dollar Index raises at the halfway point of the trading session while it waits for the Minutes of the FOMC. GBPUSD still moves at the potential reversal zone, where the price should make a new connector. Invalidation level of the bearish sequence is 1.34918.


In the same way, the USDCHF moves higher making a pullback to the breakdown zone. Probably, the pair will move higher as an ascending A-B-C pattern before to collapsing again, building a new leg long-term. Invalidation level of the bearish cycle is at 1.00561.


Categories
Forex Market Analysis

Negotiations Between US-China Support Indices Advances

FINANCIAL MARKET UPDATE TODAY

Hot Topics:

  • Indices continue soaring boosted by US-China negotiation progress.
  • UK Government seeks to pay its national debt.
  • The price action between EURUSD and USDCHF show divergences.
  • EURCAD and EURAUD are moving on critical zones.

Indices continue soaring boosted by U.S.-China negotiation progress

The advance in negotiations between the U.S. and China maintain the optimism in markets for the second consecutive session. The FTSE 100 consolidated in the record highs. Despite the fact that RSI shows a little bearish divergence, this does not mean a reversal sign of the trend. We keep our bullish vision for the FTSE in 8,000 pts as the next target.


DAX 30 adds to the market optimism by the progress between the U.S. and China negotiations. The index climbs near to the first target level proposed in previous updates (Daily Update – May 15th). The RSI oscillator does not show movement exhaustion signals.
– First target level 13,250.5.
– Second target level: 13,497.7.
– Invalidation level: 12,918.3


UK Government seeks to pay its national debt

The UK Government will appeal to the High Court for access to a National Fund untouched since 1928 to pay its National Debt. The “National Fund” was opened in 1928 by an anonymous donation of £500,000 with the condition that it must keep untouched until the U.K. have enough money to pay its national debt entirely. Currently, the fund ascends to £475 million, but the U.K. debt rises to £1.7 trillion.

The pound is moving sideways, in this session has tested the 1.348 resistance. RSI shows bullish divergences signals; we expect that the RSI moves above the 60 level for it to start to change the current bearish bias to bullish. Consider that the price action must confirm the new bias. For the moment we maintain neutral our position in GBPUSD.


The price action between EURUSD and USDCHF show divergences

USDCHF is moving bearish and has paid its bearish divergence falling to the 0.99203 level. It is likely that the price continues moving bearish to 0.9875 and start to bounce for it to make a new connector for a major degree bearish cycle. Invalidation level remains on 1.00561.


On the other hand, EURUSD keeps moving sideways. In the current session, the common currency has tested the resistance level at 1.18257 without success. However, RSI is showing reversal signals but it is necessary that the oscillator breaks above the 59.06 level and the price soar above the key resistance level 1.18257. Invalidation level is below 1.1717.


EURCAD and EURAUD are moving on critical zones

EURCAD has touched the first long-term bearish target level at 1.50373. The RSI oscillator shows bullish divergences as a bearish trend exhaustion signal. Now is the time to expect what the price action does, if the cross moves to the second long-term bearish target at 1.4866 or makes a reversal pattern. In this zone, our position turns from bearish to neutral.


Similarly to EURCAD, EURAUD moves below our second bearish long-term target placed in 1.5552 level. RSI shows bullish divergence as weakness in the bearish cycle. Now we are watching the control level in 1.54673, and waiting to see what will the price action will do. We have two scenarios:

– First scenario: The price breaks below the control level. In this case, it is likely that the cross continues its bearish momentum. For this scenario, the new bearish targets are placed at 1.5307 and 1.5195 levels. Invalidation level is 1.57279.

– Second scenario: The price makes a bullish reversal pattern, in this case, we have 1.5727 as the target.


Categories
Forex Market Analysis

Italy and the Two Children Policy Drive the Markets


Hot Topics:


  • Majors against US Dollar shows exhaustion signals.
  • European indices close the mixed trading session.
  • GBPNZD arrives at our PRZ aided by the two children policy announced in China.
  • EURAUD reaches the second bearish long-term target.

Majors against US Dollar shows exhaustion signals.

Italy is adding volatility to the Eurozone due to the agreement between Movement Five Stars, and Lega Party for the new Prime Minister.  EURUSD bounced from 1.1717 where the price created a bullish divergence. In today’s session, RSI broke its bearish trendline upward, but to complete the start of a new cycle, it is necessary that the price action confirms the new sequence. Invalidation level for this latest move is 1.17.


The GBPUSD fell to the Potential Reversal Zone as we expected last week. Currently, the price is moving narrowly, but we anticipate that the price would make a new lower low as a false breakdown. We still maintain the bearish bias while the RSI does not break above the invalidation level at 1.36.


The USDCHF pair leads the move against the US Dollar, the price made a throwback to parity and had been rejected downward. Our projection for the Swiss currency is that the price could reach 0.99203 as first support, second support is 0.98097. Invalidation level is at 1.00561.


European indices close the mixed trading session.

The FTSE 100 soars to the highest level reaching 7,868.1 in the last trading hour. The market could be placing its eyes on the 8,000 points as the psychological resistance to be struck during the next days. The new invalidation level is placed at 7,753.3 pts.


On the opposite side, the DAX 30 closed the trading session bearish, consolidating the ascending wedge pattern above the last price congestion zone. The increasing risk of Italy’s exit from the Eurozone is knocking the European markets. On the other hand, the BUBA’s chief Jens Weidman has announced that he is open to succeed Mario Draghi as president of the European Central Bank. The new invalidation level is moved up at 12,918.3 pts.


GBPNZD arrives at our PRZ aided by the two children policy announced in China.

GBPNZD continues moving downward as forecast in the past week, aided by the “two children” policy announced in China. The announcement is raising the confidence of the New Zealand dairy producers. After this bearish accelerated move, we expect a pause in the downtrend. Invalidation level is at 1.96636.


EURAUD reaches the second bearish long-term target.

EURAUD continues moving downward in the second long-term target at 1.5548. RSI shows signals of the climatic move; this means that the price acceleration in this bearish move is close to initiating a consolidation process. Invalidation level is at 1.5727.


Categories
Forex Market Analysis

Forex and Indices – Daily Update – EURAUD Potential 2B Pattern


Hot Topics:


  • Indices consolidate at their highs in the last trading session of the week.
  • Swiss Franc shows the first reversal signals, Pound and Euro still consolidate.
  • GBPNZD – The bearish momentum remains.
  • EURAUD – Develops a potential Bullish 2B pattern.

Indices consolidate at their highs in the last trading session of the week.

After having reached the highest level since January, the FTSE 100 price is rejecting the resistance level retracing to the bullish trend-line. Oscillators show bearish divergences, warning about the trend exhaustion. The leading RSI indicator still keeps the bullish bias for the current trend. We keep our eyes on the 8,000 points mark as a psychological resistance. Invalidation level is at 7,486 pts.

Forex signal live


The DAX 30 continues with its bullish momentum and now consolidates the breakout above the latest sideways structure (13,034 pts). The RSI oscillator still shows that the trend is upward. The pending bullish target is at 13,250 points. Invalidation level of the bullish cycle still rests at 12,665 points.


Swiss Franc shows the first reversal signals, Pound and Euro still consolidate.

The EURUSD continues consolidating in a Potential Reversal Zone. On the other hand, RSI is showing bullish divergence as an indication of exhaustion of downward movement. However, as long as the price does not break above the trend-line and move above 1.1810, we maintain the bearish bias. The invalidation level of the bearish cycle is at 1.1996.

Forex signal live


GBPUSD, the price continues moving in the sideways range and showing its intention to break down towards our Potential Reversal Zone. The RSI oscillator shows the bearish momentum continues. Invalidation level 1.3617.


After moving sideways for nine days, USDCHF is breaking down the consolidation range. We expect the Swiss Currency to reach the 0.9920 level, in agreement with its bearish divergence. RSI also shows bearish signals supporting the corrective scenario.


GBPNZD – The bearish momentum remains. The GBPNZD cross continues developing the bearish movement towards the long-term bullish trend-line. As was observed in our May 16th Daily Report (read more), the next target level for the current bearish move is 1.9388; the invalidation level is 1.9663.


EURAUD – Developing a potential Bullish 2B pattern.

We see a potential Bullish 2B Pattern on the EURAUD, which could be activated as long as the price breaks out of 1.5721 level, with a target at 1.5888. The price is moving at the bottom of the long-term upward trend-line. The invalidation level of this bullish scenario is 1.5654.

Forex signal live


Categories
Forex Market Analysis

Forex and Indices – Daily Update May 17th, 2018


Hot Topics: 


  • Main currencies consolidate levels against the Dollar.
  • Is a new strength cycle to the Euro upcoming?
  • Indexes continue rising

Main currencies consolidate levels against the dollar.

EURUSD

EURUSD continues to move laterally in a potential reversal zone. We still expect the price to visit the level 1.1737 as a cheat pattern (see 2B Pattern), before making a new bullish cycle.

Daily Forex Market Update


GBPUSD

GBPUSD continues to consolidate around the 1.35 level; we foresee that the price could create a false break down to 1.3423, from where it should make a connector and start a bullish process, probably as an ABC.


USD/CHF

USDCHF continues to move laterally in the parity zone without showing signs of change. By its correlation with EURUSD, we cancel the scenario proposed of the potential double top, and we project a last bullish movement, which could reach 1.0101.


Is the new cycle of strength for the Euro upcoming?

EURCAD

After breaking down its bullish trend line, we expect that the EURCAD can make a new lower low in the area between 1.5037 to 1.4866. In case it falls below 1.4818, which corresponds to our level of invalidation of the main upward cycle, we could see deeper declines to the 1.4519 level.

Daily Forex Market Update


EURAUD

EURAUD continues consolidating at its potential reverse zone, as in the case of EURCAD. We anticipate that the cross could make a new lower low at 1.5610 before returning to create a new bullish move. If EURAUD goes below 1.5467, the price could see more drops in the area between 1.5037 and 1.5159.


Indexes continue upwards.

FTSE

FTSE 100 continues its bullish rally for the eighth consecutive week and is approaching record highs reaching 7,788.2 points. It is likely that we will see the British index reach the psychological barrier of 8,000 points and may even reach 8,155 points.


DAX

As we mentioned yesterday, DAX broke up the consolidation structure and goes towards the 13,250 points, pending bullish objective level to reach. While the index does not complete its bullish cycle, all indices will continue with the bullish momentum.


Categories
Forex Market Analysis

Forex and Indices Daily Update – May 16th, 2018

Hot Topics:

  • Currencies against the Dollar could be completing internal cycles.
  • EURAUD – Closing partials and moving SL.
  • GBPNZD – More falls are expected.
  • Indices continue consolidating.

Currencies against the Dollar could be completing internal cycles.

Forex and Indices Market Update: EURUSD continues to move below 1.18 and bouncing within the potential reversal zone. However, it still shows no signs of changing the trend. It should be noted that the Dollar Index has completed an internal cycle which should begin to correct soon. For the pair, we maintain a neutral position.


In the same way, GBPUSD continues to move within a sideway range towards the zone of a potential reversal from where we expect it to begin to bounce.


Without significant changes, the Swiss Franc (USDCHF) continues moving sideways around the parity level; the current movement makes us speculate that there could be a limited upward move as a false breakout.


EURAUD – Closing partials and moving SL.

Forex and Indices Market Update: The EURAUD cross has reached the first level of the potential reversal zone at 1.57236, fulfilling the conditions of the completion of an internal cycle. Additionally, EURAUD has touched the long-term uptrend line and would be forming a bearish channel structure. The bearish bias persists, and the price could reach 1.5610. We still maintain our short positions and move the invalidation level to 1.5888. Now is time to make partial closes in open trades.


GBPNZD – More falls are expected.

Forex and Indices Market Update: The GBPNZD cross is moving within a consolidation structure with a bullish bias. Our outlook is that the price could make a new low in areas from 1.9388 to 1.93049, this area coincides with the long-term trend line. In case of breaking below 1.93, we could see more falls with a target at 1.905 level.


Indices continue consolidating.

Forex and Indices Market Update: The German DAX 30 index continues moving in a range between 12,918 and 13,034 points. We expect a new upward movement to complete the ascending wedge structure that could be in the form of a false breakout. The AO oscillator is showing a bearish divergence, which indicates a price exhaustion signal which could support our bullish target forecasted at 13,250 points.


The FTSE 100 shows the same situation; the British index is also consolidating in the upper part of the ascending wedge. For the moment we remain neutral in indices expecting a new trading opportunity.


Categories
Forex Market Analysis

DAX 30 Consolidating at 13,000 Points

Hot Topics:

  • DAX 30 continues consolidating close to 13,000 pts.
  • EURUSD could make a new connector.
  • The United Kingdom keeps its unemployment rate at 4.2% in April.

DAX 30 continues consolidating close to 13,000 pts.

The DAX 30 once reached 13,000 points. It still has a bullish objective pending in the area of 13,250, where it should complete the upward cycle developed since April. The invalidation level of the upbeat sequence is 12,665.3.


EURUSD could make a new connector.

The EURUSD is developing an internal bearish cycle which could be completed in the area between 1.18096 and 1.17371. From this zone, we anticipate that a new bullish connector could begin. The first target of this new cycle is 1.2413, which corresponds to the invalidation level of the current bearish sequence. As long as the single currency does not fall below 1.1717, this scenario remains active.


USDCHF continues moving sideways in the parity zone consolidating the bullish cycle started in April. The Swiss currency has pending levels to be visited as a corrective sequence, possibly as an A-B-C pattern. The target area is between 0.98097 to 0.97507.


The United Kingdom keeps its unemployment rate at 4.2% in April.

The unemployment rate in the United Kingdom in April remained unchanged at 4.2%, as in the previous period. The GBPUSD pair continues consolidating maintaining the bearish bias.  We expect the Pound to reach a new low that could happen in the area between 1.3433 to 1.3329. From this area, we will start looking for long positions. Should it fall below 1.3301, the Pound could go down to 1.3108.


The FTSE 100 continues with its bullish bias. However, the ascending wedge structure shows that this rally may be in an exhaustion phase. Short positions may be considered if the price falls below 7,687 pts., and the likely target would be 7,575.1.


Categories
Forex Market Analysis

DAX 30 Strikes the 13,000 Level

Hot Topics:

  • The Bank of England decided to hold its interest rate unchanged.
  • US Core CPI (YoY) remained at 2.1% in April.
  • DAX 30 strikes the 13,000 level.

Bank of England decided to keep its interest rate unchanged

The Bank of England (BoE) held its interest rate unchanged at 0.5%. GBPUSD registered the weekly maximum at 1.3617 from where it continued with its bearish bias. For now, the cable moves sideways; we expect an upward corrective movement towards the 200 moving average, which could converge with the 1.3712 level and then continue with more declines.

The FTSE 100 exceeded 7,700 pts, the highest level since the 23rd of January. The key drivers of the British index were: the retail company Next PLC (NXT) which closed the session gaining 6.14%, the broadcaster company IVT PLC climbing 6.05% and Royal Bank of Scotland (RBS) which advanced 3.77%. We maintain the bullish bias, bearish invalidation level below 7.486.6 pts.

US Core CPI (YoY) remained at 2.1% in April.

Core CPI (ex-energy and food) of the United States remained at 2.1% in April; the same level reached in March. After the inflation data release, the EURUSD climbed and is moving above 1.19 again, validating our scenario of the potential bullish 2B pattern published yesterday Tuesday the 9th in our charting section.

USDCHF could be developing a double top pattern, which would be activated if the price closes below 1.0003 (low between highs). The invalidation level is above 1.0056. Before placing short positions, we must wait for a break-down.

DAX 30 strikes the 13,000 level.

The DAX 30 index in the first half of the European session reached 13,030 pts; the highest level reached since February, following what we forecasted in previous market updates. We expect a continuation of this bullish action. The target area is between 13,250.5 to 13,497.7 levels. The level of invalidation of the bullish bias is 12,665.3.

Categories
Forex Market Analysis

Dollar Index reaches its highest level since December 2017.

Hot Topics:

  • Dollar Index reaches its highest level since December 2017.
  • Indices return to the bullish path
  • EURAUD advances as forecasted.

Dollar Index reaches its highest level since December 2017.

The dollar index rose to 92.74 after the employment data from the United States, its highest level since December 2017. The unemployment rate fell in April to 3.9% from the 4.1% achieved in March, the lowest rate for more than 17 years. Technically, the greenback reached 92.74 and began to draw back forming a potential bearish 2B pattern.

The single currency reached the potential reversal zone, testing the support level at 1.19 from where it began to bounce. From this area, we will be monitoring long positions in the EURUSD.

The USDCHF made the same move as the dollar index, climbing to a new higher high, but it still did not touch the level of invalidation we have forecast in previous updates (above 1.0370). Short positions will be valued below the 0.9973 level, the invalidation level for short positions remains intact.

The cable, as in the case of the EURUSD pair, made a new low at 1.3488 developing a potential ending diagonal pattern. Once the breakout occurs it will be validated; we could begin to place long positions. In the meantime, we will remain alert to the movements that it carries out.

Indices return to the bullish path

The FTSE short position proposed yesterday has been invalidated when its price has been rejected at the lower edge of the rising wedge, drawing a bullish movement. For now, the index is in our potential reversal zone so we will maintain our neutral position.

The DAX 30 continued moving bullish in the current session with all eyes on the next psychological resistance at 13,000 points. The invalidation level is 12,400 pts.


EURAUD advances as forecasted.

The cross continues moving on the bearish trend we have been forecasting since January and out of which we have been profiting when we took short positions at 1.6084. It is time to move our stop-loss to break-even, and possibly, take partial profits.


©Forex.Academy

Categories
Forex Market Analysis

EUR Moving Sideways, UK PMI Services Rebound, and DAX Bearish

Hot Topics:

  • UK PMI Services rebound from the lowest level for 21 months.
  • DAX is moving bearish as commented previously.
  • The Euro stagnates while waiting for employment data release of the United States.
  • EURCAD: Follow-up of the bearish cycle continuation.

UK PMI Services rebound from the lowest level for 21 months.

Business activity in the United Kingdom increased modestly in April reaching 52.8, bouncing from 51.7, the lowest level recorded 21 months ago. Chris Williamson, Chief Business Economist at IHS Markit, noted that “The economic growth rate remained decelerated moderately at the start of the second quarter.” Finally, he added that “the performance of the economy has continued to deteriorate”.

The FTSE 100 index has reacted downwards from our potential reversal zone, breaking down the rising wedge pattern, where we are already positioned short (Suggested in advance to our premium members).

The pound continues with the bearish bias consolidating below 1.36. We still expect sterling to make a new low in the area from 1.35 to 1.3481. The level of invalidation of the bearish bias is above 1.365.

DAX is moving bearish as commented previously.

The DAX 30 follows the bearish bias in a similar way the FTSE 100 did. This corrective move was also commented to our subscribers in our previous updates. We expect the German index to move down to the 12.622 pivot level, which by traditional technical analysis, should switch from resistance to support.

The Euro stagnates while waiting for employment data release of the United States.

The single currency is moving in a range between 1.195 and 1.20 pending the employment data that will be published tomorrow by the U.S. Bureau of Labour Statistics. The EURUSD pair could make a new lower low, likely near to 1.190, from where it could bounce up to 1.207.

The USDCHF is forming a double top pattern, which would be activated if it breaks below 0.995. By inverse correlation with the EURUSD pair, and considering that it still has space to make a new lower low, the Swiss currency could make a higher move as a buyer trap or 2B Pattern.

EURCAD: Follow-up of the bearish cycle continuation.

On April 20th we commented to our subscribers that the cross EURCAD had a new lower low to develop, whose target could be in the area from 1.54 to 1.5310. Today, we see that the cross has reached our forecasted area. Now we should start to take profits and wait for the price action to show a new trading opportunity.

EURCAD updated:

©Forex.Academy

Categories
Forex Market Analysis

Main European Indexes Reach Areas of a Potential Reversal

Hot Topics:

  • Main European indexes reach areas of a potential reversal.
  • Dollar maintains the upward trend after the Fed’s decision to keep the rate unchanged.

Main European indexes reach areas of a potential reversal.

The FTSE 100 is developing an ascending wedge pattern; the bullish movement has led the British index to reach a critical resistance at the 7,572.2 level, the area from which we expect it to begin making a corrective move, possibly down to the 7,326 pivot. Sales are considered if the price closes below the breakout candle at 7,523.

DAX 30. After the break on Tuesday, May 1st, the German index climbed above the resistance at 12,622.4, closing the session in the blue box that we have been watching since last week. This bullish movement that was developed in five waves could begin to correct in three waves, and from the end of this potential drop-down, we would start valuing long positions.

Dollar maintains the upward trend after the Fed’s decision to keep the rate unchanged.

The EURUSD continues its bearish trend consolidating below the 1.20 level; the Single Currency could fall from 1.1991 to 1.1833, where it could begin a bounce. Long positions are considered above the 1.2011 level.

The Pound has broken down the support level of 1.36, entering in the potential reversal zone, where we foresee that it could perform a lower low reaching the 1.3481 level. At this level, buyers may be waiting to place their long positions with a target around the 1.39 zone.

The Swiss franc is forming a top pattern around parity. It could form a spike, which we estimate should not exceed 1.03, where it should begin a corrective move. Our most conservative vision on short positions is once the price breaks-down below 0.9955 with a profit target at 0.9836.

©Forex.Academy

Categories
Forex Market Analysis

Indices: Bull traders still could have space to go up?

Hot Topics:

  • Monitoring the indices alignment before a correction.
  • Euro group: weakness will continue against its main pairs.

Monitoring the indices alignment before a correction.

As we have said in previous daily updates, the markets are correlated, and big moves occur when they are all aligned. The FTSE 100 continues making a bullish extended cycle and is near to reaching critical levels for a reversal (7,500 to 7,600 area.)

In this session, for the fourth time, the DAX 30 couldn’t soar above the critical resistance level 12,622. It is likely that the German Index climbs up above the resistance before we expect it to fall.

Finally, as we can see, the NIKKEI 225 could still reach the area between the 22,620 to 22,800, before starting a corrective move. In conclusion, Indices still have space to see a new high, but we expect limited bullish moves.

Euro group: weakness will continue against its main pairs.

The Euro currency is developing a bearish move after the rally that started in 2017. The EURUSD pair continues the bearish cycle reaching the first blue box, testing the 1.2071 level. Before the Employment data release in the US, we expect a downward continuation to the zone between 1.1869 to 1.1815. From this area, it could start to bounce but it is too soon to foresee that move.

Looking at the Euro crosses, EURAUD is moving as we anticipated in our last Short-Term Pick (24th April), We expect the price to drop down to the region between 1.5748 and 1.5650. Invalidation level is at 1.6192.

EURCAD could not reach the 1.5811 zone; this situation makes us think that the bearish force could accelerate to our target level which is 1.54.

On the other hand in the money market, the USDCHF pair is still on an upward trend which is near to completing the bull cycle. In the zone between 0.9943 to 0.9993, the pair could make a new connector, then, start developing a bearish cycle.

The Pound has dropped to the 1.375 level, from where we expect the cable to start a bounce and make a consolidation move. The retracement could reach the area between 1.39 to 1.40. Invalidation level is at 1.4246.(c) Forex.Academy

Categories
Forex Market Analysis

EURUSD after ECB press conference is moving as was planned.

Hot Topics:

  • ECB decides to keep the interest rate unchanged at 0%.
  • FTSE continues its way to reach new highs.

ECB decided to keep the interest rate unchanged at 0%.

The ECB in its April monetary policy meeting has decided to keep the interest rate unchanged. As we expected, in the past week, the Euro group has continued its weakness. In the EURUSD pair, our central vision continues being bearish at least till the 1.20 zone.

The inverse correlation continues acting between EURUSD and USDCHF. The bullish trend in the Swiss currency remains very sharp, and our eyes are placed in the 0.999 to 1.02 area, from where the pair could react to the downside.

DAX 30 stays on a sideways movement without enough volatility to advance above the pivot level 12,622. We expect a new low near to the blue box area before to the German Index sees new highs.

FTSE continues its way to reach new highs.

The FTSE 100 in today’s session moved mostly upward, struggling to reach a new high with no success.  Consider that it is still testing the 61.8% Fibonacci retracement level of the bearish move that started in the second half of January. A test in the blue region is expected before making a new bearish leg.

As we said in the previous Daily Update, the GBPUSD pair is making a sideways movement before continuing its bearish cycle. The invalidation level is 1.4261, and the cycle target is 1.3815.

©Forex.Academy

Categories
Forex Market Analysis

German government cuts its growth forecast for 2018

Hot Topics:

  • German government cuts its growth forecast for 2018.
  • FTSE 100 falls dragged by mining sector stocks.

German government cuts its growth forecast for 2018.

The German government reduced its forecast for 2018 growth to 2.3% from 2.4%. This growth correction happens after the IFO business confidence index was published, which has fallen for the fifth consecutive month in April. Despite the cut, the Economy minister Peter Altmaier said: “Germany is doing well economically. Actually, we are doing very well”.

In this context, DAX 30 is making a bearish corrective move, which could extend to the area between 12,180 and 11,930 pts before it continues its bullish trend. Invalidation level is below 11,792.4.

The EURUSD moved lower and lost its 1.22 level, looking for the 1.215 to 1.207 levels. We keep in mind the ECB Monetary Policy meeting where we don’t expect changes in the interest rate. In case the Euro rises above 1.224, our current bearish bias in the common currency will change to a bullish bias.

By inverse correlation, the USDCHF pair continues moving bullish, surpassing the maximum registered yesterday. The current situation makes us think that the Swiss currency could build a sideways pattern and be making a corrective move before continuing with its trend. The invalidation level is in 0.95774.

FTSE 100 falls dragged by mining sector stocks.

The FTSE 100 moves bearish in the last trading hour and drops more than 0.70% in the session, dragged mainly by the mining sector stocks, where metals have moved away from their annual highs. The leading British index could extend its falls to the 7,100 level, from where it could resume the upward trend. The invalidation level remains at 6,971.8.

The pound sterling has rejected the level of 1.40 thus forming the pivot level. After the fall recorded in the last trading session, we expect a recession to the area of 1.407 to continue the previous bearish movement with a target between 1.38 to 1.375. Invalidation level is located at 1.4246.

©Forex.Academy

Categories
Forex Market Analysis

Time for a new Correction

Hot Topics:

  • Is it time for a new Indexes’ correction?
  • US Dollar can’t continue its rally against their main pairs.

Is it time for a new Indexes’ correction?

The FTSE closed the session near our blue box, the area from which we expected that the price would make a corrective movement at least down to 7,326.  It could even be down to the 7,000 pts level.


The DAX closed the session testing the 12,622 resistance, failing once again in its attempt to strike the resistance. The pattern left at the end of the session looks like a double top pattern. If the price breaks down at 12,465.5, the target level will be 12,294.

US Dollar can’t continue its rally against their main pairs.

The Euro stopped its correction despite the positive economic data in the US. Consumer confidence increased in April, at the same time, the New Homes Sales (MoM) in the US advanced 4% in March, the highest level for four months. We think the corrective move in the Euro has paused, waiting for the ECB Monetary Policy decision. As long as the price moves below 1.2476, our bias remains bearish.


The pound has dropped below the psychological level of 1.40 and is now making a pullback looking to recover the previous zone. We will wait and expect the beginning of its next move to take a position in the GBPUSD pair. Our primary vision is that price could make new lower lows, to reach even below 1.37 level.


The CHF climbed up to the 0.98 level from where it has been rejected. It is likely that the Swiss currency makes a new high in 0.9825 before starting a bearish correction. The target is between the 0.965 and 0.9720 zone at least. The invalidation level of the current bullish cycle is 0.9577.

©Forex.Academy

Categories
Forex Market Analysis

Markit PMI release: Eurozone growth stays lower, and the US rises solidly

Hot Topics:

  • Markit PMI release: Eurozone growth stays lower, and the US rises solidly.
  • Main European indexes closed with gains.

Markit PMI release: Eurozone growth stays lower, and the US rises solidly.

After the publication of Markit PMI data from both the Eurozone and the United States, we see two opposite sides of economic dynamism. On the one hand, the Eurozone economy remained unchanged in April compared to March, maintaining the sector index of 55.2; manifesting a sense of stagnation in economic growth. Chris Williamson, Chief Business Economist at IHS Markit, said: “The decline in January’s high is neither surprising nor alarming.”

On the other hand, in the United States, the private sector is showing signs of robust growth in both the Manufacturing industry and the Services sector. The Manufacturing PMI Index grew to 56.5 in April, the highest level in 43 months, above the 55.6 reported in March. Likewise, the service sector reported an increase in activity that reached 54.4 in April, compared to the 54 published in March, the highest level reached in two months.

The Euro has broken below the triangle pattern that was respected until last week. Currently, the pair is testing support at the psychological level of 1.22. We keep our bearish vision with the target between the 1,215 and 1,207 area.


The pound for its part, after having broken below 1.40, we expect a bearish continuation to the levels of 1.379.


The CHF, which is correlated inversely with the common currency, gives us signs of bullish continuity, being able to bring the price up to 0.9836 before making a corrective move.

Main European indexes closed with gains.

The FTSE 100 continues to advance in a rising wedge pattern towards the blue box area between the levels of 7,456.3 to 7,523. From this zone, it should react to form a potential new bearish leg.


The DAX 30 is again looking to overcome the 12,622 pivot level. If it does overcome it, the movement could reach over 13,000 pts.

©Forex.Academy

Categories
Forex Market Analysis

The Positive Data Reported in Canada could support a rate hike soon

Hot Topics:

  • The positive data reported in Canada could support a rate hike soon.
  •  The Greenback rally continues.
  • FTSE maintain the bull trend, DAX waits for ECB meeting?

Positive data reported in Canada could support a rate hike soon.

The consumer inflation (YoY) in March increased to the highest level in three years reaching 2.3%, climbing from the 2.2% reported in February. The Core Inflation (YoY) descended to 1.4% in March from the 1.5% in February. The higher oil prices have influenced inflation to rise. On the other hand, retail sales in February have increased to 0.4% from 0.1% reported in January. The Bank of Canada maintains a 2 percent inflation target; this scenario could signal an interest rate hike soon. In the last Monetary Policy meeting, the Bank of Canada decided to maintain the rate at 1.25%.

In the technical context, a correction for the Canadian Dollar group could show soon. In the EURCAD cross, we expect a bullish movement with a target placed in the 1.58 level before making new lows.

In the same way, GBPCAD is developing a bullish retracement process that could reach 1.805 – 1.81, the area from where it could make the bearish continuation of the main trend.

The Greenback rally continues.

For the fourth consecutive session, the US Dollar saw advances compared to its main competitors. The Euro has broken down its short-term consolidation structure but has been stopped by the lower trend-line of its long-term triangle pattern.

The Pound tested the 1.40 psychological level again, from where it is bouncing. We expect a retracement to a Fibonacci level before we decide to sell this pair.

The Swissy could visit the area between 0.9765 and 0.9836 before it makes a bearish cycle.

FTSE maintains the bull trend, DAX waits for ECB meeting?

The main European indices have closed with a mixed sentiment. The FTSE 100 closes the last trading session of the week climbing above the pivot level 7,326. We expect more upsides until the 7,450 – 7,520 area before it makes a bearish leg.

On the opposite side, DAX 30 could not climb up above the pivot level of 12,622. The German index could make a new bearish leg, likely to be around the 12,100 – 12,200 area before the ECB Monetary Policy Meeting and continue the bullish cycle.

© Forex.Academy

Categories
Forex Market Analysis

US Dollar Climbs Against Its Pairs

FOREX WEEKLY FORECAST

Hot topics:

  • FTSE could make a new shoulder before it sees more upsides.
  • US Dollar climbs against its pairs.
  • ADP Nonfarm Employment in Canada raises.

The FTSE could make a new shoulder before it sees more upsides.

The FTSE 100 is turning bearish losing 0.09%, in the same way as principal indices. The 7,326 level is relevant resistance to be controlled. Nearest supports are 7,164 pts and 7,030 pts.FTSE
The German DAX is also moving bearish after reaching its highest level for eight weeks, falling 0.25%. The 12,622 level has been rejected for the second time and is now the key level to watch. Supports levels to be controlled are 12,125 pts and 11,892 pts.German DAX

US Dollar climbs against its pairs.

In the same way, as it has been our central vision for the Dollar Index, once released the Philly Fed Manufacturing Index, the greenback is rising. The common currency is breaking down following the scenario proposed in our previous updates. Our vision is that the price could fall to the 1.215 level.US Dollar climbs against its pairs
After making a fake breakout, the Pound has started a bearish move losing 1.43, and now is testing support at the 1.42 psychological level.Forex Weekly Forecast

The Swiss Franc is testing resistance in the 61.8% Fibonacci retracement reaching the 0.97 level. As long as the chief falls below the 0.9699 level, we expect that the price drops to 0.96126.Forex  Forecast

ADP Nonfarm Employment rises in Canada.

The nonfarm employment change, released by Automatic Data Processing (ADP), increased by 42.8K from February to March. While there were losses in finance, information, and education, they were outpaced by significant growth in the construction industry, said Ahu Yildirmaz, vice president and co-head of the ADP Research Institute. The EUR-CAD cross is raising as a corrective move of the principal bearish cycle. As long as the cross reaches 1.58, new sellers can be expected to add to short positions with their target at 1.54.ADP Nonfarm Employment rises in Canada

© Forex.Academy

Categories
Forex Market Analysis

EZ Economic Sentiment Plunges To Its Lowest Level Since 2016

Hot Topics:

  • EZ Economic Sentiment plunges to the lowest level since 2016.
  • Pound falls after unemployment rate release.
  • Dow continues advancing with all eyes on the 25,000 pts level.
  • Expecting the Crude Oil Inventories data release.
  • Limited down movement before BoC MP decision.


EZ Economic Sentiment plunges to the lowest level since 2016.

The Eurozone ZEW Economic Sentiment in March dropped to 1.9, the lowest level since July 2016. The ZEW President Achim Wambach said, “The reason for this downturn in expectations can mainly be found in the international trade conflict with the United States and the current situation in the Syrian war.” 

Once the sentiment data was released, the common currency reacted dropping 0.25%. As we have envisioned, the Euro dropped from the blue box.

In the European stocks market, the German index DAX 30 continued its rally closing the session with a gain of 0.99%. The index is moving in an ascending channel; the price could still reach new highs until the 12,702 – 12825 area before starting a potential corrective move.

At the same time, the Dollar Index climbed from 88.94, the 3 weeks lowest level, advancing to its short-term pivot of 89.36. The price still is bouncing from the Potential Reversal Zone (PRZ). Invalidation level is in 88.52 level.


Pound falls after unemployment rate release.

The unemployment rate in March fell 4.2%, the lowest level in more than four decades. The GBPUSD pair plunged 0.31% from the highest level of the year. On the technical side, the pound has made a false breakout reaching 1.4376 and falling sharply below 1.43. We are now expecting a setup as a 1-2-3 pattern before we look to sell the pair.


Dow continues advancing with all eyes on the 25,000 pts level.

In the middle of the big companies earnings release, Dow Jones continued advancing, breaking up our key resistance level of 24,625 closing the session with gains of 0.59%. Our central vision is bullish with the target placed at the 25,407 level.

As result of the market risk on sentiment, the USDJPY has moved above our invalidation level (106.61), bouncing in the Potential Continuation Section (PCS); closing the session at 107.0, maintaining the bullish bias with the target placed at 108.41 level.


Expecting the Crude Oil Inventories data release.

Today, the weekly Crude Oil Inventory data released by the EIA is expected. On the technical side, the price is making a bullish channel in five movements. We estimate that Crude Oil could reach the 67.86 – 68.75 area where sellers could enter in action with their targets placed at 64 $/barrel.


Limited falls before BoC MP decision.

The most expected release for this session is the interest rate decision from the Bank of Canada. The analysts’ consensus expects that the BoC will keep its rate unchanged at 1.25%. Our vision is that the loonie could make a new low to the 1.2499 level, where it could find new buyers with their target at 1.274.

Categories
Forex Market Analysis

Euro Plunges on Weak European Industrial Production data

Hot Topics:

  • Euro plunges by weak European Production Industrial Data.
  • The Pound is near to our control zone.
  • Bank of Japan’s Sakura Report: household spending and robust exports are aiding recovery.
  • Crude Oil is consolidating above $66.
The Euro plunges by weak European Industrial Production data.

Weak industrial production data in the Eurozone has triggered a 0.41% drop in the Euro, during today’s session, as we were expecting in the last Daily Update. Industrial production (YoY) fell from 3.7% in January to 2.9% in February, well below the mobile quarterly average of  3.97%.

The weak data published was mainly due to the reduction in the production of intermediate goods, capital goods, and durable and non-durable consumer goods. The common currency could go back to test the medium-term uptrend line. The support level to be controlled is 1.225 (For full resolution, click on the chart).

The German Index DAX 30 advances 1.08% within a tight upward channel, despite the weak European industrial production data.  In the case of overcoming the resistance at 12,476.8 pts, the price could take us to the 12,702.42 – 12,825.92 area.

In the case of the Dollar Index, which advanced 0.36%, we will wait to see how it behaves around 89.36 and 89.03 levels, from which we could validate a reversal of the uptrend. The invalidation level remains below 88.52.

The pound is near to our control zone.

The sterling closed the session yesterday with an advance of 0.37%, approaching the levels that we see as a potential reversal zone (PRZ) that could extend even below to 1.427. From the raised area, the pound could begin to develop that bearish move as a new bearish leg.

Bank of Japan’s Sakura Report: household spending and robust exports are aiding recovery.

In their quarterly report, the Bank of Japan (BoJ) concludes that six regions reported their economy had been expanding or expanding moderately, and three regions had continued to recover moderately.

In general terms, household income is increasing moderately as the labour market conditions had continued to tighten continuously. In this macroeconomic context, Kuroda reports that the BoJ will continue with the bonds purchase program to stimulate economic growth.

On the technical side, the USDJPY pair is gaining bullish momentum that could lead us to the 108.2 – 108.5 area. The relevant resistance level is 107.48; invalidation level is at 106.61.


Crude Oil is consolidating above $66.

After reaching its highest level since 2014, crude oil is consolidating close to the $66 level. Following the rally that took place on April 06th, we expect the consolidation to be relatively extensive, so we should wait for a more discernible scenario to take positions in favour of the prevailing trend.

The USDCAD/oil correlated pair is consolidating between 1.2544 – 1.2623, in the same fashion that Crude Oil is doing. By inverse correlation, we expect that the Loonie makes a reversal pattern between 1.2540 and 1.246. The invalidation level for the reversal move is below 1.2250.

Another energy commodity correlated with the USDCAD pair is Natural Gas, which is making a complex corrective structure that could make a new low between 2.522 – 2.260 before it finds buyers.