Categories
Forex Basic Strategies

Pivot Trading Strategy – Easiest Way To Trade Pivot Points

Pivot points are the significant levels used by the market technician to determine the future movement and the major support/resistance levels on the price chart. Pivot point takes the prior period high, low, and close to estimate the future support and resistance levels. Pivot points are the leading indicator, and once they are set on a price chart, it will remain the same throughout the day.

Timeframes

The pivot point of the 1, 5, 10, and 15-minute chart use the prior day high, low, and close. Whereas the pivot points for the 30, 60, and 240-minute chart use the last week high, low, and close to calculate the pivot points. Once the new week starts, the pivot point appears on the price chart until the end of the week.
The pivot point for the daily and chart use the prior month data, and the pivot point for the weekly and the monthly chart use the last year’s data. The new pivot point for the year ahead will be calculated on the 1st of January. These would be based on the high, low, and close of the last year’s pivot points.

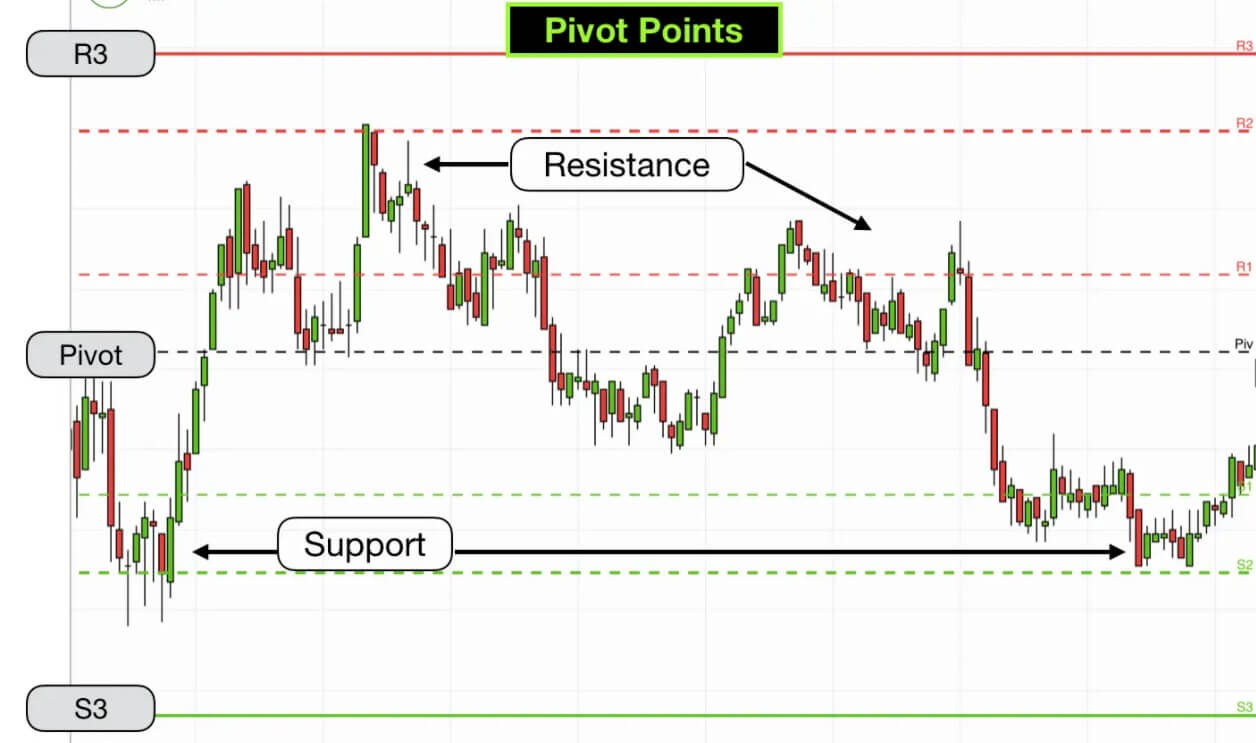
There is a total of seven basics pivot levels on the price chart.

  1. Basic pivot level – It is the middle of the center pivot line.
  2. Resistance 1 (R1) It is the first pivot point above the centerline.
  3. Resistance 2 (R2) It is the second pivot level above resistance 1.
  4. Resistance 3 (R3) It is the third pivot level above resistance 2.
  5. Support 1 (S1) It is the first pivot level below the middle pivot line.
  6. Support 2 (S2) It is the second pivot level below support 1.
  7. Support 3 (S3) It is the third pivot level below support 2.

Trading Strategies Using Pivot Points

There are various pivot point trading strategies in the market; this one is especially we created for our fellow traders, our strategy is backtested on demo and even on trading simulation, so you no need to put the work required to find out the probability of this strategy—all we suggest you follow this strategy very well to make consistent money from the market.

Pivot points most often work very well in trending market conditions; some traders even use pivot points on lower timeframes to scalp the markets. The strategy is to find out the uptrend in any instrument and wait for the pivot point to go above the Pivot point centerline, and then wait for the pullback back to the pivot line to take buy entry. You can close your position at resistance one if the market momentum is choppy, and even in a strong trending market, you can also book the profit at resistance two or three.

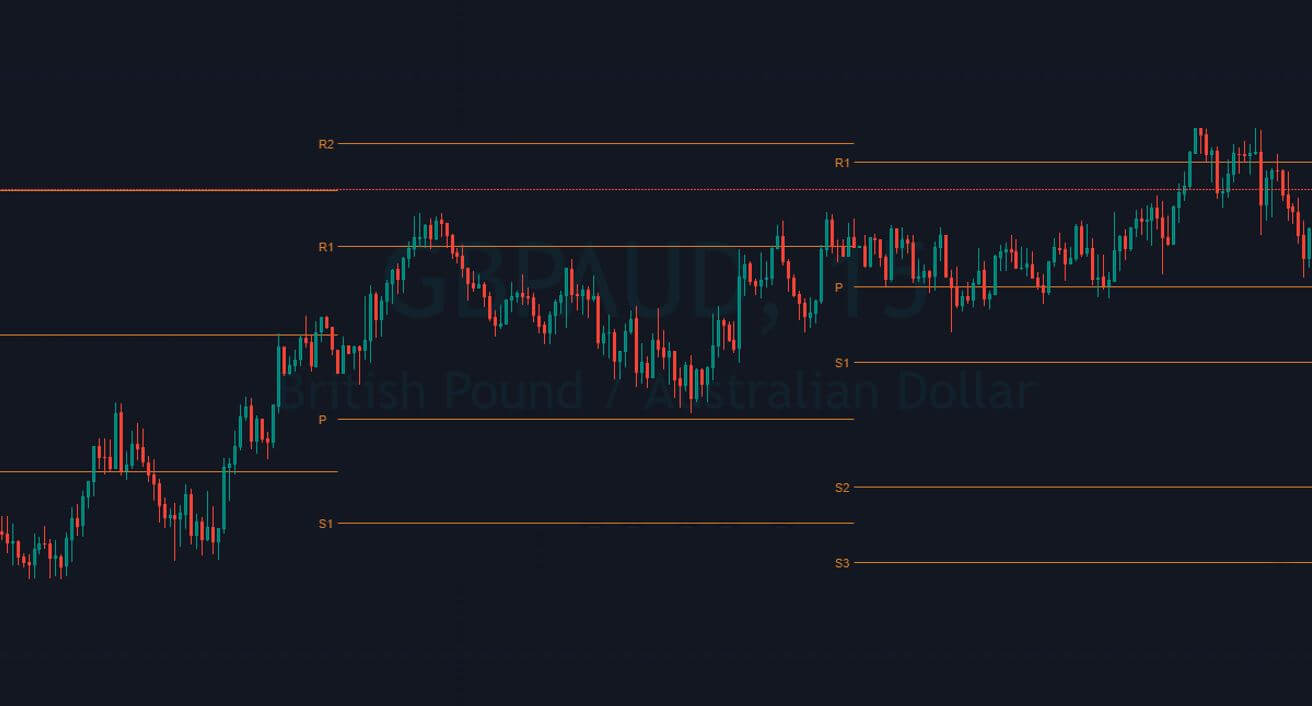
The image below represents the uptrend in the GBPAUD forex pair.

The image below represents our buying entry in this pair.  Notice that the day before our entry price action breaks the pivot line and the very next price action pullback to the pivot line. Keep in mind that the pullback must hold at the pivot line then only it confirms the buy trade, never place the limit order at the pivot line. Let the price action test the support line take entry.

The image below represents our entry, exit, and take profit in the GBPAUD forex pair. When you follow so many steps to take an entry, it means that you are going for the precision in the market, and for the precision entries, always put the stop loss just below the entry price. In the image below, notice that our stop loss was just below the pivot line, and for the take profit, we go to the R1 of the next day, which was R2 for the previous day. Take profit is an art in the market, and when you use the pivot points, it’s even easier to book profit. If the price action immediately approaches the R1, then you can expect the price action to hit the R2 or even R3. If the price action shows you the struggle to hit the R1, then simply do not expect the deeper targets.

Pivot Points + Double Moving Average

Moving average is a widely used indicator in the market which smooths out the price action by filtering out the noise from the random short-term price fluctuations. There are an infinite amount of moving averages in the market, which helps the traders to identify the market trend, entry, and exit also the potential reversals. When the moving average goes above the price action, it means that the trend is down, and when it goes below the price action, it indicates the uptrend in the security. In this strategy, we used the 30 and 15-period average to trade the market.

The trading strategy is, first of all, to find out the downtrend in any pair and wait for the prices to close below the pivot line also check the crossover above the price action on a double moving average to take an entry.

The image below represents the downtrend in an NZDCAD forex pair.

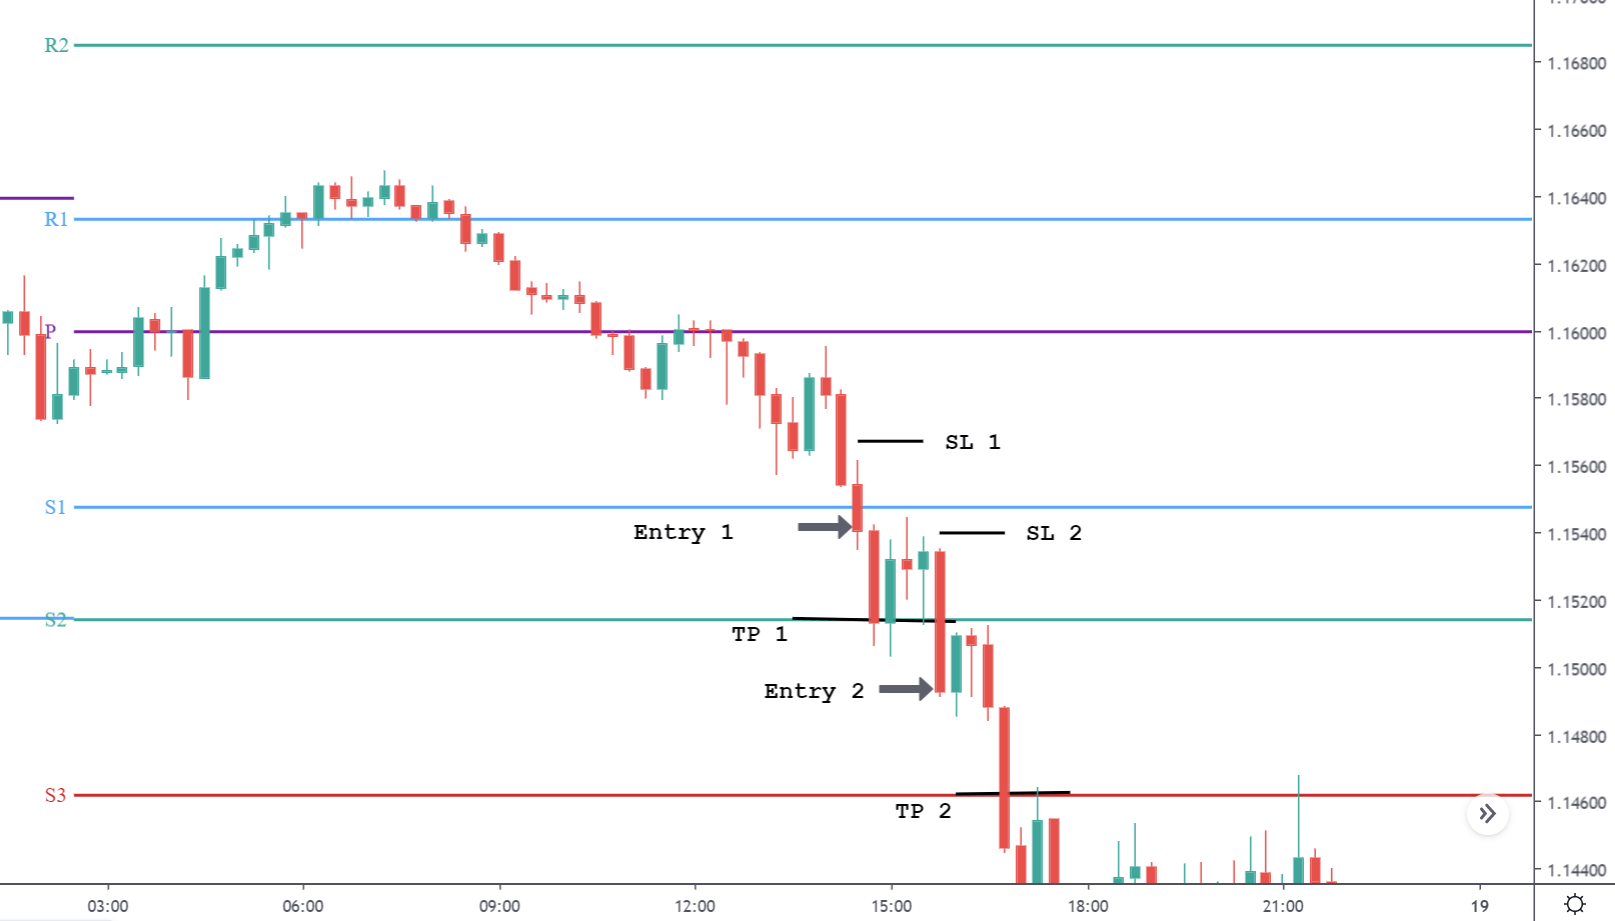
As you can see in the below image of the NZDCAD forex pair, it indicates the selling entry in this pair. In a downtrend, when the price action holds below the pivot line, it shows that the prices respect the resistance area; also, the crossover on the MA indicates the market is ready to print a brand new lower low.

The below image represents our entry, exit, and take profit in this pair. As you can see, the entry was when prices hold below the pivot line, and the stops were just above the pivot line because the holds below show that the buyers hold no power to break above the pivot line. After our entry, price action strongly blasts to the north, which shows that we can expect our trade to travel even longer. Price action holds for some time at the S1, and then it immediately blasts to the S2 and prints the brand new lower low.

Conclusion

Pivot points are the leading indicator in the industry, which provides a glance at potential support and resistance level in the market. These levels are useful for taking an entry, or it can be useful for putting stop loss or for booking profit also. AS the leading indicator, you can use them all alone to trade the market, or you can pair them with some other indicator to trade the market. The critical benefit of pivot points is they work on all the financial markets also on all the trading timeframes. Try not to use this indicator in the ranging conditions and also avoid the use in the highly volatile markets.

Categories
Forex Chart Basics

Pivot Points in Forex Trading: What You Need to Know NOW

When you study Forex trading you may have discovered the term, pivot points. This is a collection of supports and resistors that are previously calculated to give you ideas about where to buy and sell a couple of currencies. Pivot points are not just used in Forex and in fact, have a history in futures exchanges in the United States. This brings us to the days of voice trading and before computers existed.

Unlike many other indicators you might find, pivot points are, because of their nature, predictable. Essentially, what you’re doing is seeing where the overall pivot in the market can be, and then the next three levels of support and the three levels of resistance. This indicator is quite powerful, but the same as other indicators, it must be confirmed either by the action of prices or other factors such as the previous support level.

The analysis of pivot points focuses on the relationship between the maximum point, the minimum, and the starting prices between each day of operation. In other words, the prices of the previous day are used to calculate the pivot point of the current day. The pivot point, the central axis of the indicator, is considered as “fair value” for the market. Remember, if the price is rising and is returned, it is said to have resisted. Alternatively, if the price is falling and is returned, it is said to have found support. This indicator will show what is the “fair value” of the market, and three potential areas in both directions, which are called support one, support two, support three and also resistance one, resistance two, and resistance three to make the role of guidelines.

The Calculations

The turning point of the day is exactly equal to the maximum price of the previous session plus the minimum price of the previous session and the price of the previous session’s departure. The division of these three numbers by three gives you the pivot point. Once you know the turning point then you can extrapolate the resistors and supports. S1, S2, S3, R1, R2, and R3.

Pivot point of the current session = High (previous session) + Low (previous) + Close (previous)

The other pivot points can be calculated as follows:

  • Resistance 1 = (2 x pivot point) – Minimum (previous session)
  • Support nº 1 = (2 x pivot point) – Maximum (previous session)
  • Resistance nº 2 = (pivot point – support 1) + Resistance 1
  • Support nº 2 = Pivot point -(Resistance 1 – Support 1)
  • Resistance nº 3 = (Pivot point – Support 2)+Resistance 3
  • Support nº 3 = Pivot point – (Resistance 2 – Support 2)

Statistical Probabilities

One of the main reasons why traders use pivot points is that they work statistically. For example, the EUR/USD pair has given results below support 1 almost 44% of the time. The maximum of the day has been over Resistance 1 almost 42% of the time, while the minimum has been under Support 2 17% of the time. Continuing with this, resistance 2 has been exceeded by day maxima only 17% of the time, while minima and maxima exceeding or being below support 3 and resistance 3 only occurs 3% of the time. Because of this, you may perceive how likely it is that the price will go to any of those areas. Think of it as a Gauss bell, and the standard deviation equations you learned in school. When you are beyond two standard deviations it is very rare to stay there, you can think about our three and support 3 in the same way.

Think about it this way; if the resistance level 1 is only exceeded 42% of the time, in this way that means that if you are on the market for a short term, the odds are in your favor if you put the loss cut over the resistance 1. Obviously, there are many possible combinations here. Luckily, most trading platforms now include pivot points, so you won’t need to know how to calculate them.

An Example in Action

Have a look at any graph of the AUD/USD pair with an hourly timeframe that has the pivot point indicator built-in. At this point, I would like to point out that not all Metatrader platforms come with it, but there are free downloads available online on a multitude of schemes. In this particular situation, the pivot point of the previous day is the yellow line while the support levels are blue and the resistance levels are red. As you look at this chart, notice that the market started the day at a point much lower than the pivot. The central pivot line, the yellow one, should be considered as a potential “fair value” for the market. Instead of starting there, we started at $1, and we started seeing support. You can clearly see that initially, we moved towards the pivot point but then you overcame it. You’ll notice we stopped at Resistance 1, which is where we closed the day.

You can see the importance of those levels in this table because even when they are surpassed the next level will begin to show its influence. What I have not pointed out in this graph is that the central pivot is at the level of 0.73, an area that has been in support and resistance more than once. It is therefore not a great surprise to see that the market suddenly closed at that level and did not deviate from it. If you decided to stay in the market above $1 you would probably have made a profit near the pivot point. Beyond that, if we deviate outward as it happened, then I could well see the area below the pivot point to put a stop loss. While it is not itself a trading system, the pivot points are based on statistical probability, something on which much quantitative trading is based. Keep in mind that many machines sell and buy currencies today, so those ratios and formulas can be relevant. Then using pivot points and Forex trading you add some quantitative trading to your strategy.

Pivot points are typically used for short-term trading, however, there are pivot points that are used in monthly installments in the same way. When calculating these, simply replace the maximum, the minimum, closing values of the previous sessions with one of the previous month. It works the same way, any time frame.

Categories
Forex Basic Strategies

Combining The ‘Rail Road’ Trading Pattern With Pivot Points To Generate Accurate Trading Signals

Introduction

In the previous set of articles, we discussed strategies based on most of the technical indicators in forex. But there is one technical indicator that was not covered extensively and, i.e., the ‘Pivot Points’ indicator. Traders do not use it extensively because they don’t know the right way of using it and are not aware of their strength.

Today, we solve this problem by discussing a mostly based strategy on the Pivot Points indicator. By now, we all know that a technical indicator should never be in isolation. Therefore, the ‘Pivot Points’ indicator is combined with some very powerful chart patterns and key technical levels to improve the probability of successful trades.

‘Pivot Points’ are nothing but potential support and resistance levels that will help us determine the same, even it is established. The pivot point’s parameters are usually taken from the previous day’s trading range to calculate today’s pivot points. The simplest way of plotting the pivot point indicator on the chart is by selecting the indicator from the broker’s charting software.

The main pivot point (PP) is the central pivot based on which all other pivot levels are calculated. Calculating the central pivot point is pretty simple. We just have to add yesterday’s high, low, and close and then divide that by 3, a simple average of the high, low, and close. We don’t have to worry about the calculations as the software does all that for us and gives it readymade.

The only thing we have to remember is that if the price is trading above the central pivot point, it signals a bullish trend. If the price is below the central line, it is considered a bearish trend.

Time Frame

The strategy works well on small time frames such as 15 minutes, 3 minutes, and 1 minute. It would not be wrong to classify the above strategy as a ‘Scalping Strategy.’

Indicators

We use just one technical indicator for the strategy and, i.e., ‘Pivot Points.’ We could also use the Simple Moving Average (SMA) to get a clear idea about the market trend.

Currency Pairs

The strategy is only applicable to major currency pairs of the forex market. EUR/USD, USD/JPY, GBP/USD, GBP/JPY, AUD/USD, EUR/GBP, and NZD/USD are preferred currency pairs.

Strategy Concept

The ‘Pivot Point’ strategy is based on the concept that when price respects any of the support and resistance levels of the ‘Pivot Point’ indicator, they tend to become ‘true’ S/R levels that can be relied upon. When price re-tests these ‘true’ support and resistance levels, it moves in the direction as anticipated. The above logic works greatly in favor of traders and thus increases the probability of making a profit. However, there are some rules we need to follow to execute the above strategy successfully. Let’s discuss these rules in detail.

Trade Setup

To explain the strategy, we will be executing a ‘long’ trade in EUR/USD currency pair using the strategy’s rules. Here are the steps to execute the strategy.

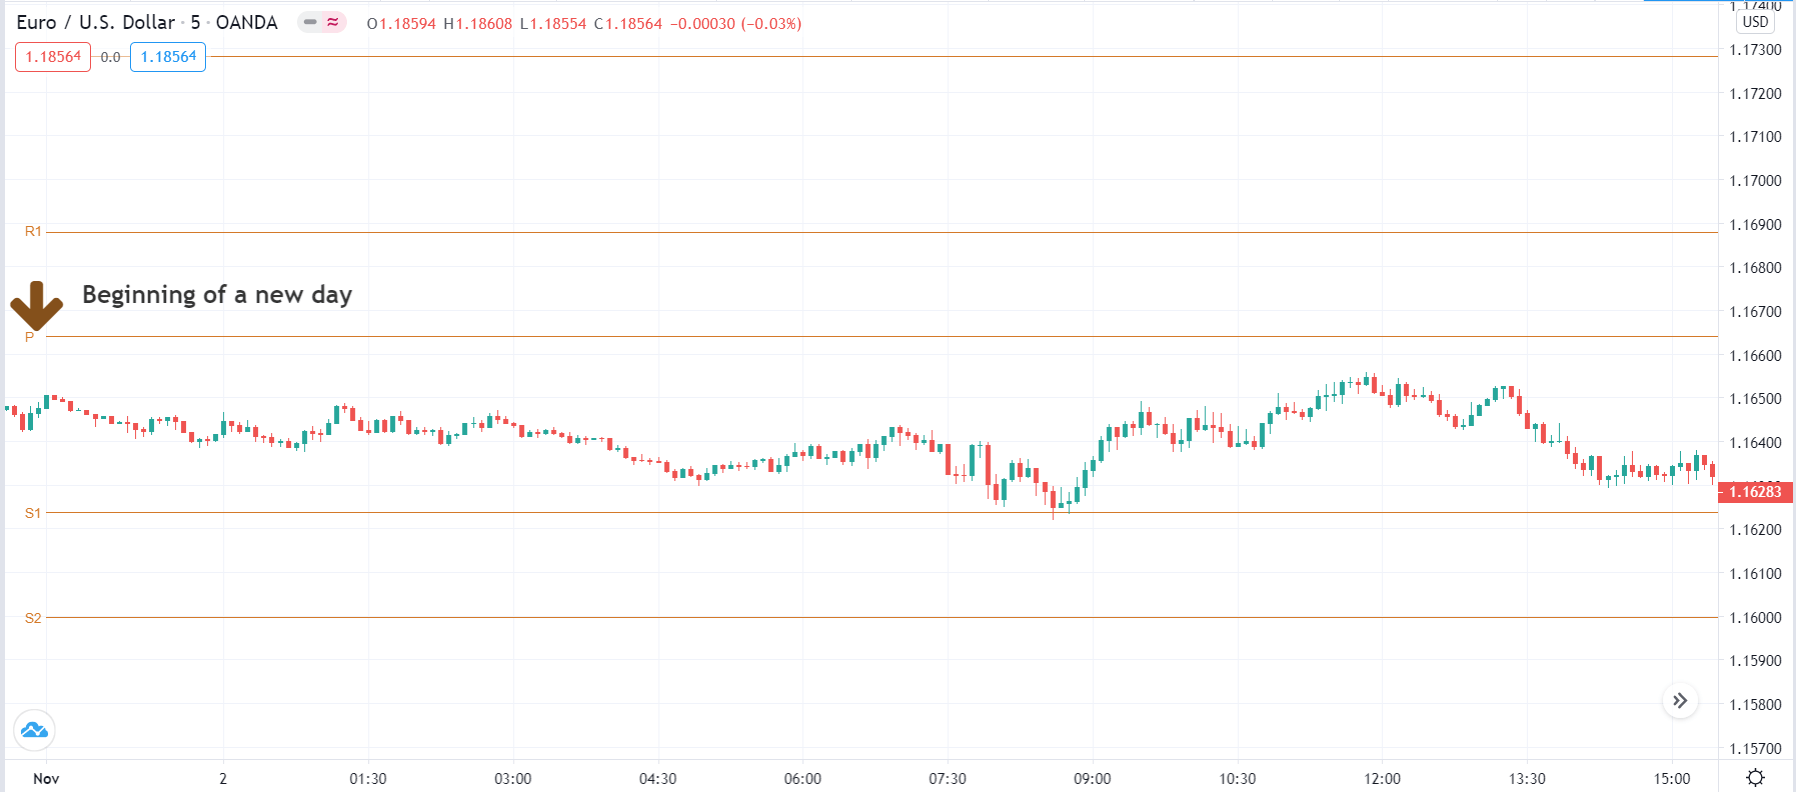
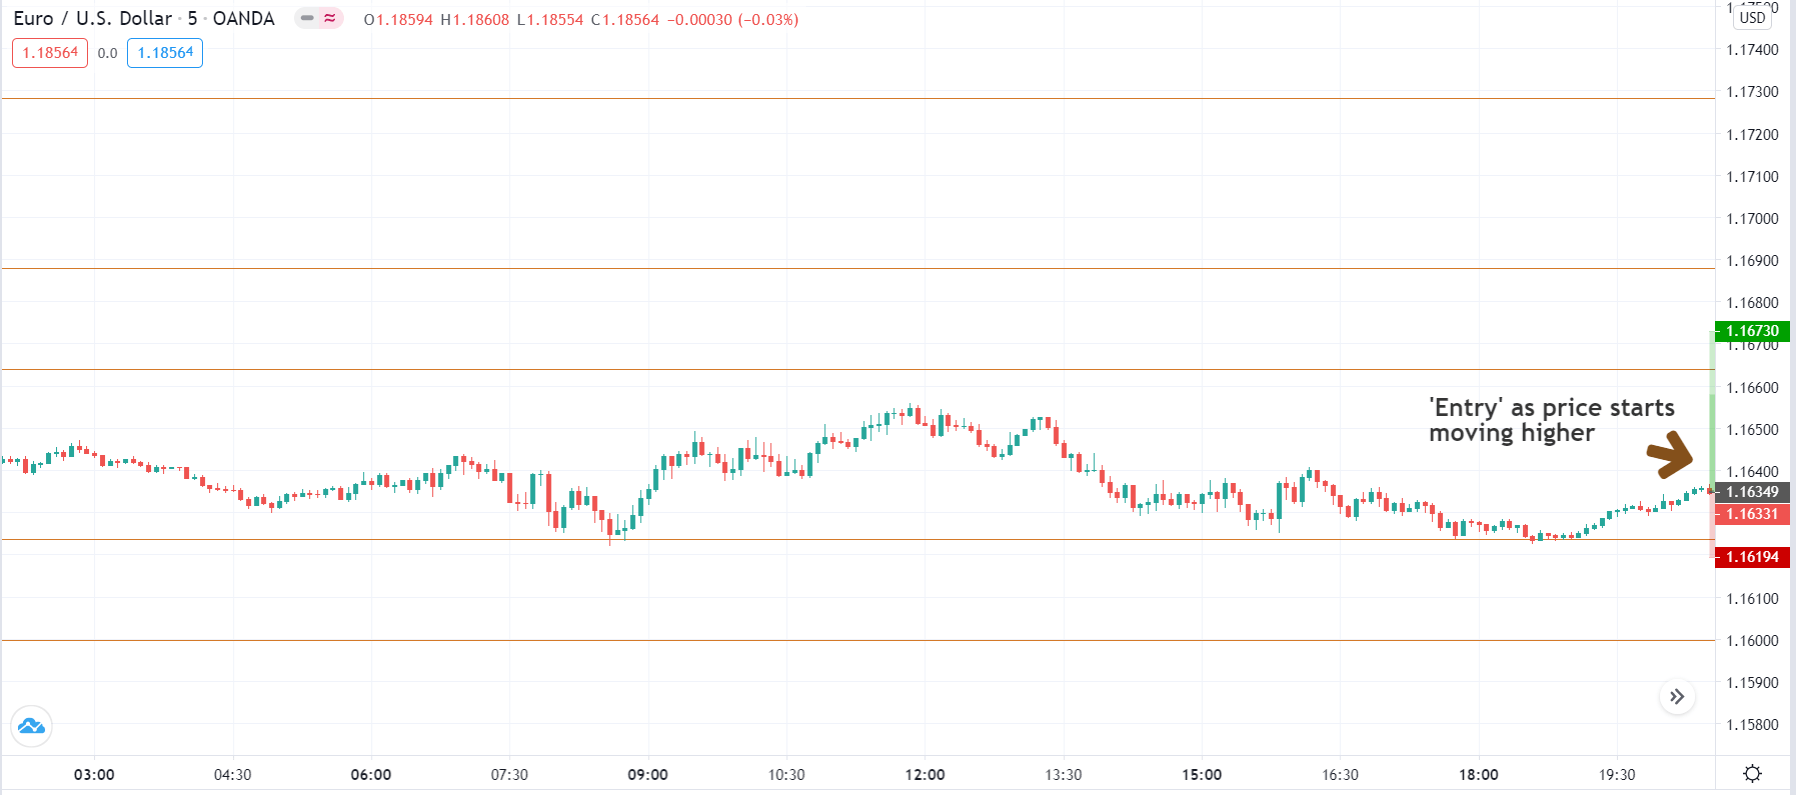
Step 1: Firstly, we have to plot the pivot point indicator on the chart with its default settings. As this is mostly an intraday strategy, we start each day as fresh using the partitions made by the pivot point indicator. The below image exactly shows how the beginning of a new day would look like on the pivot points.

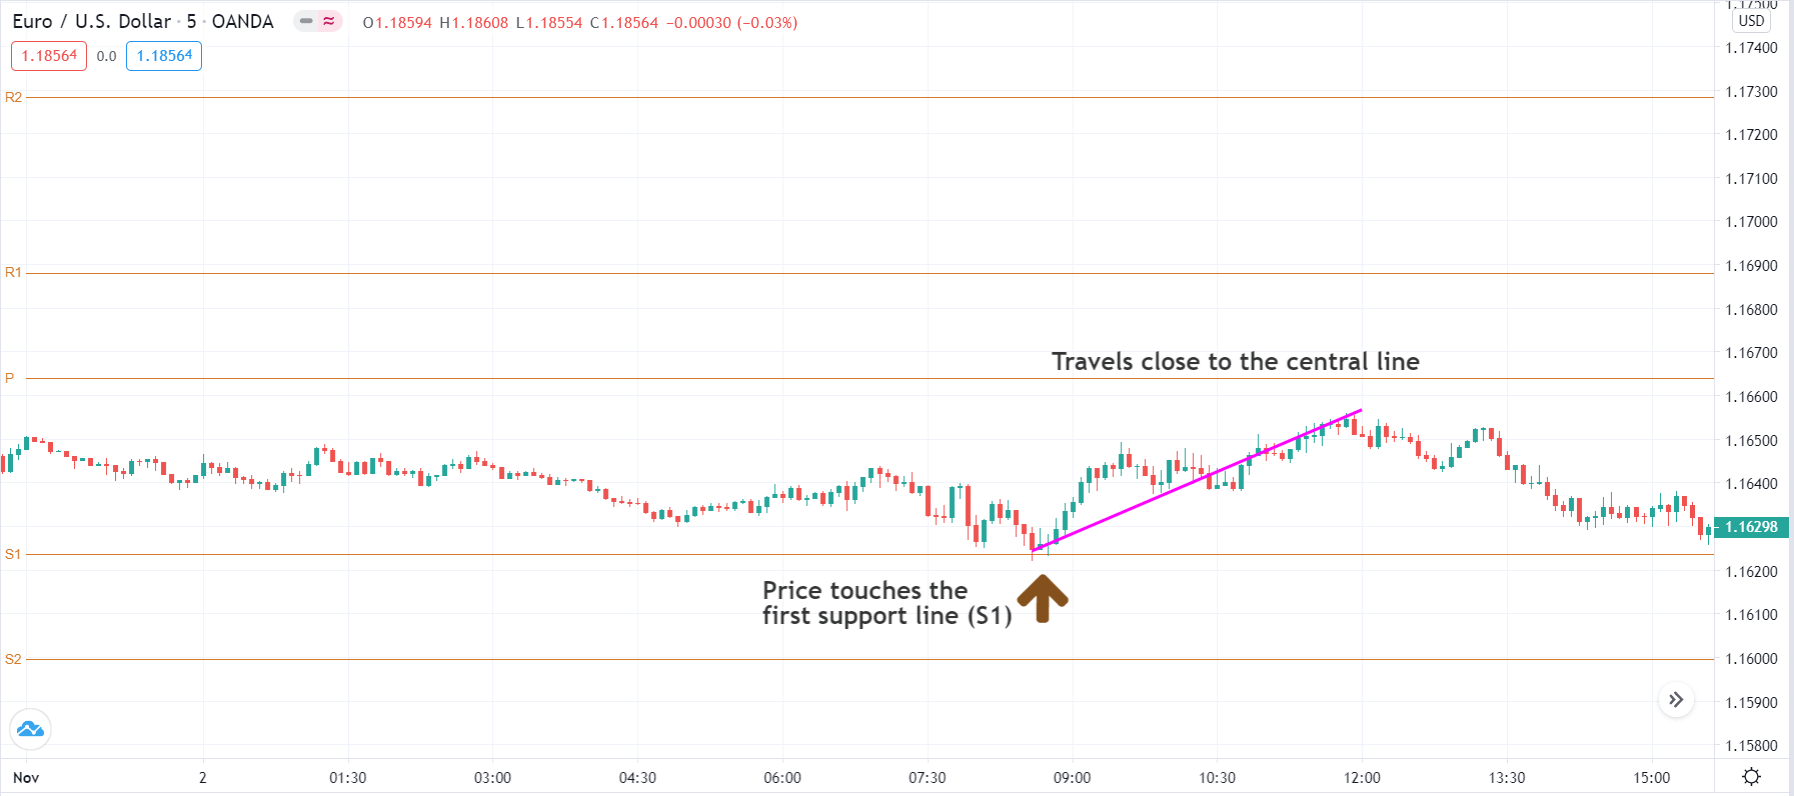
Step 2: Next, we need to wait for the price to touch any support and resistance levels as plotted on the chart by the pivot point indicator. Not all touches are going to be important to us. Only the price touches that cause major price movement in the market will be considered as significant. For instance, if the price touches R1, R2, R3, R4, or R5 and goes down to the central line (PP), this shall be considered ‘true’ resistance. Likewise, if the price touches S1, S2, S3, S4, and S5 and goes back up to the central line, this shall be considered ‘true’ support.

The below image shows how price touches S1 and travels close to the central line. Hence, this can be considered as ‘true’ support. The further price travels, the stronger is going to be the ‘support.’

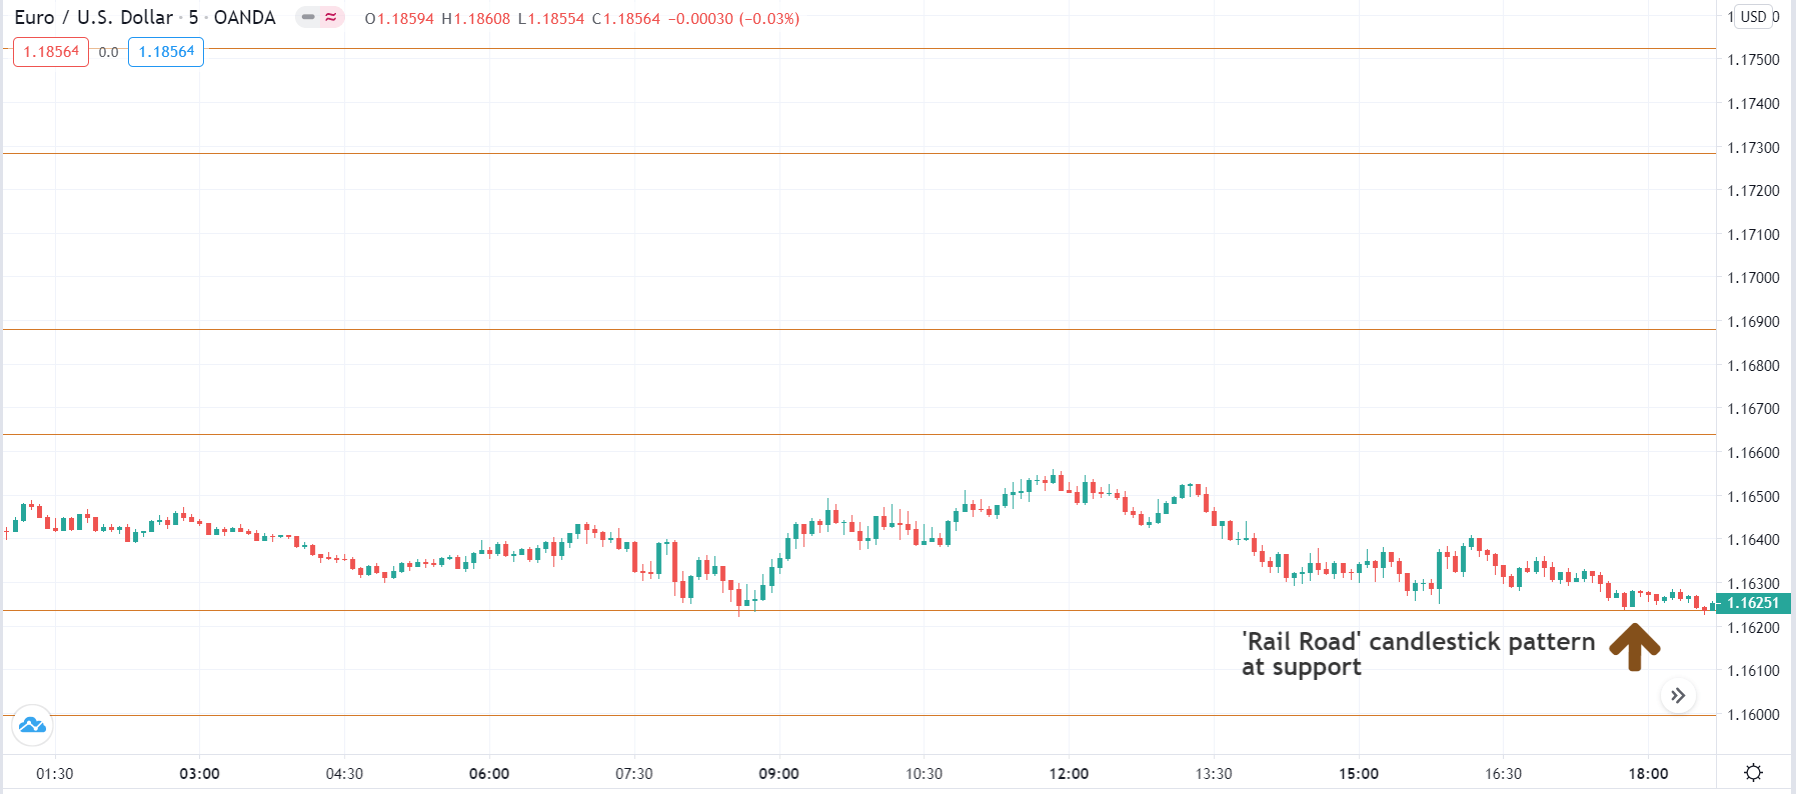
Step 3: After establishing ‘true’ support and resistance levels, we wait for the price to return to this level and show a suitable price action pattern before we can actually enter into a trade. Once the price touches established ‘support’ or ‘resistance,’ we need to watch for the formation of the ‘Rail-Road Track’ candlestick pattern on the chart. The ‘Rail-Road Track’ is essential because it confirms the respective level. We still don’t enter for a trade. The next step explains the rule of ‘entry.’

Step 4: To be sure that the support or resistance is holding, we enter only after the price starts moving in the direction we expect to move. For example, in the case of ‘true’ support, we enter ‘long’ when the price moves a further higher from the ‘support.’ Similarly, in the case of ‘true’ resistance, we enter ‘short’ when the price moves further lower from the ‘resistance.’

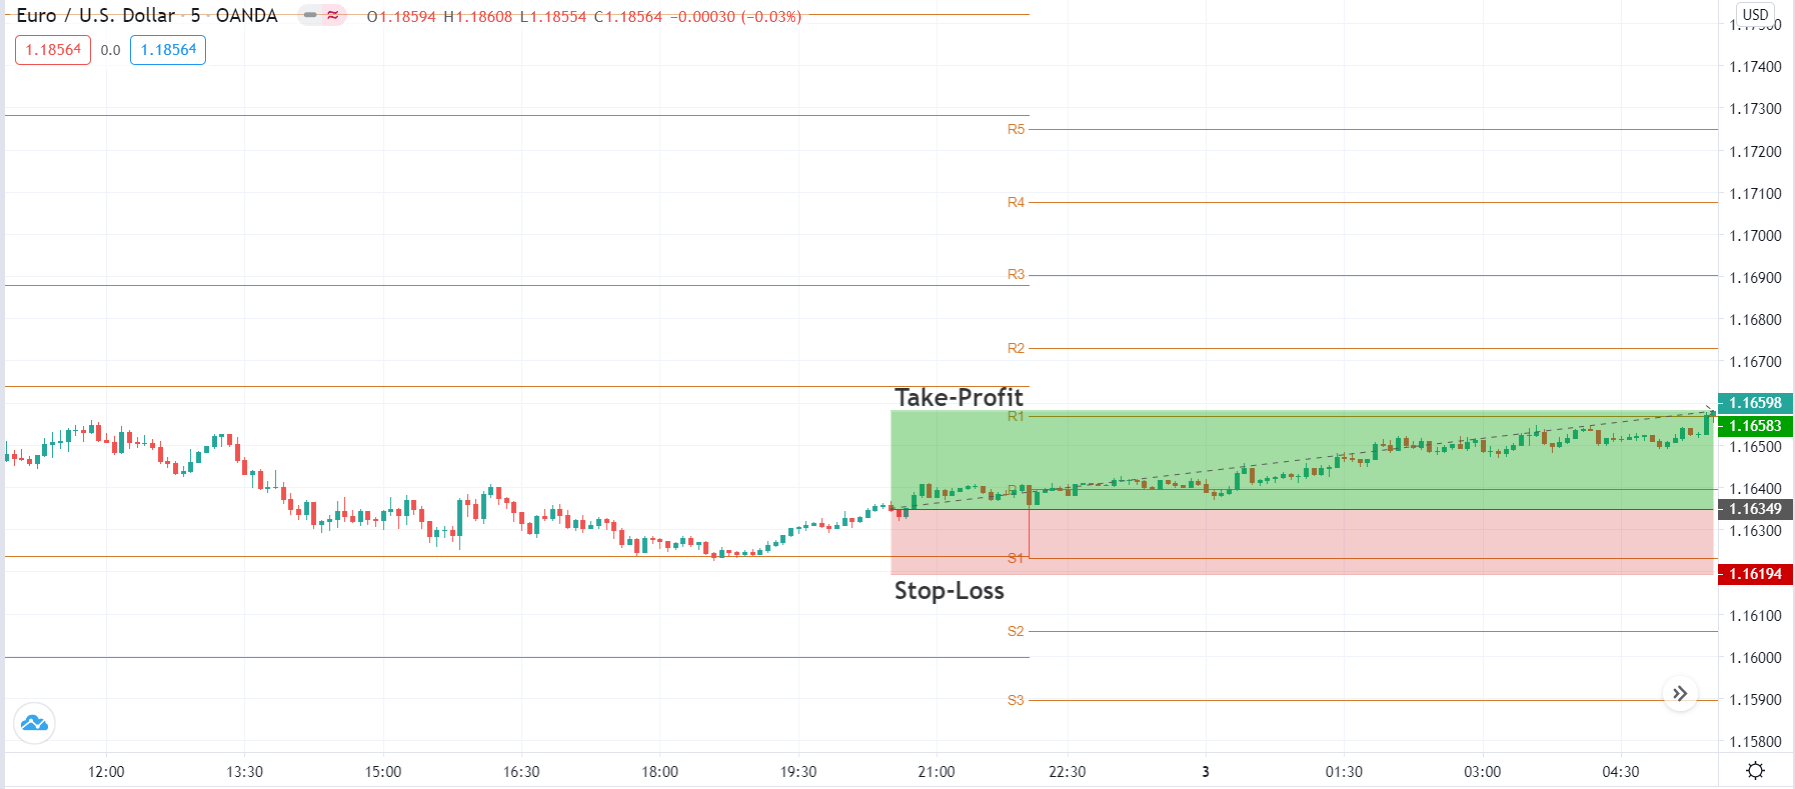
Step 5: In this step, we define the take-profit and stop-loss levels for the trade. The stop-loss is placed below the ‘support’ from where the price had bounced off, in case of a ‘long’ position. On the other hand, it is placed above the ‘resistance’ from where the price had collapsed. The ‘take-profit’ is set at the opposing ‘support’ and ‘resistance’ level as indicated by the pivot point indicator.

Strategy Roundup

The pivot point strategy is like a complementary tool to the traditional S/R strategy that can be used to improve the results. Since we are dealing with really small time frames, the probability of ‘successful trades’ can be ‘low.’ However, that shouldn’t be a concern for us as the risk to reward (RR) of trades executed using the above strategy is above average. This will ultimately put us in a profitable position.

Categories
Crypto Videos

Crypto Pivot Points! Master The Market!

Cryptocurrency trading – Pivot Point guide


What are pivot points?
Pivot points are a pattern repetition indicator that is used to predict support and resistance levels. They can also help determine the overall market trends.
The most common way to use and calculate a pivot point is the so-called “five-point system.” This system comprises of an average of the numerical high, low as well as close of the previous trading period. These numbers are used to plot a course for five levels: two sets of resistance levels, two sets of supports, and a “pivot point.”

Calculating pivot points
The five-point system is one of the ways of calculating and identifying support and resistance levels. It is also one of the simplest, and is calculated like this:
Pivot Point (P) = (Previous Low + Previous High + Previous Close)/3
Resistance level 1 (R1) = (Pivot Point x 2) – Previous Low
Resistance level 2 (R2) = Pivot Point + (Previous High – Previous Low)
Support level 1 (S1) = (Pivot Point x 2) – Previous High
Support level 2 (S2) = Pivot Point – (Previous High – Previous Low)
The pivot point from our example is derived from the previous high, low, and close divided by 3. This allows traders to define an area where the price action seems most sensitive and likely to shift in sentiment.

Pivot point strategy – time frames

While it is possible to utilize pivot points on longer time frames, common practice looks at the smaller time frames such as 4-hour, 1-hour, 30, and 15-minute charts.
When used alongside other indicators such as the MACD and the RSI, traders can ensure the legitimacy and significance of their predictions.

Pivot point – example

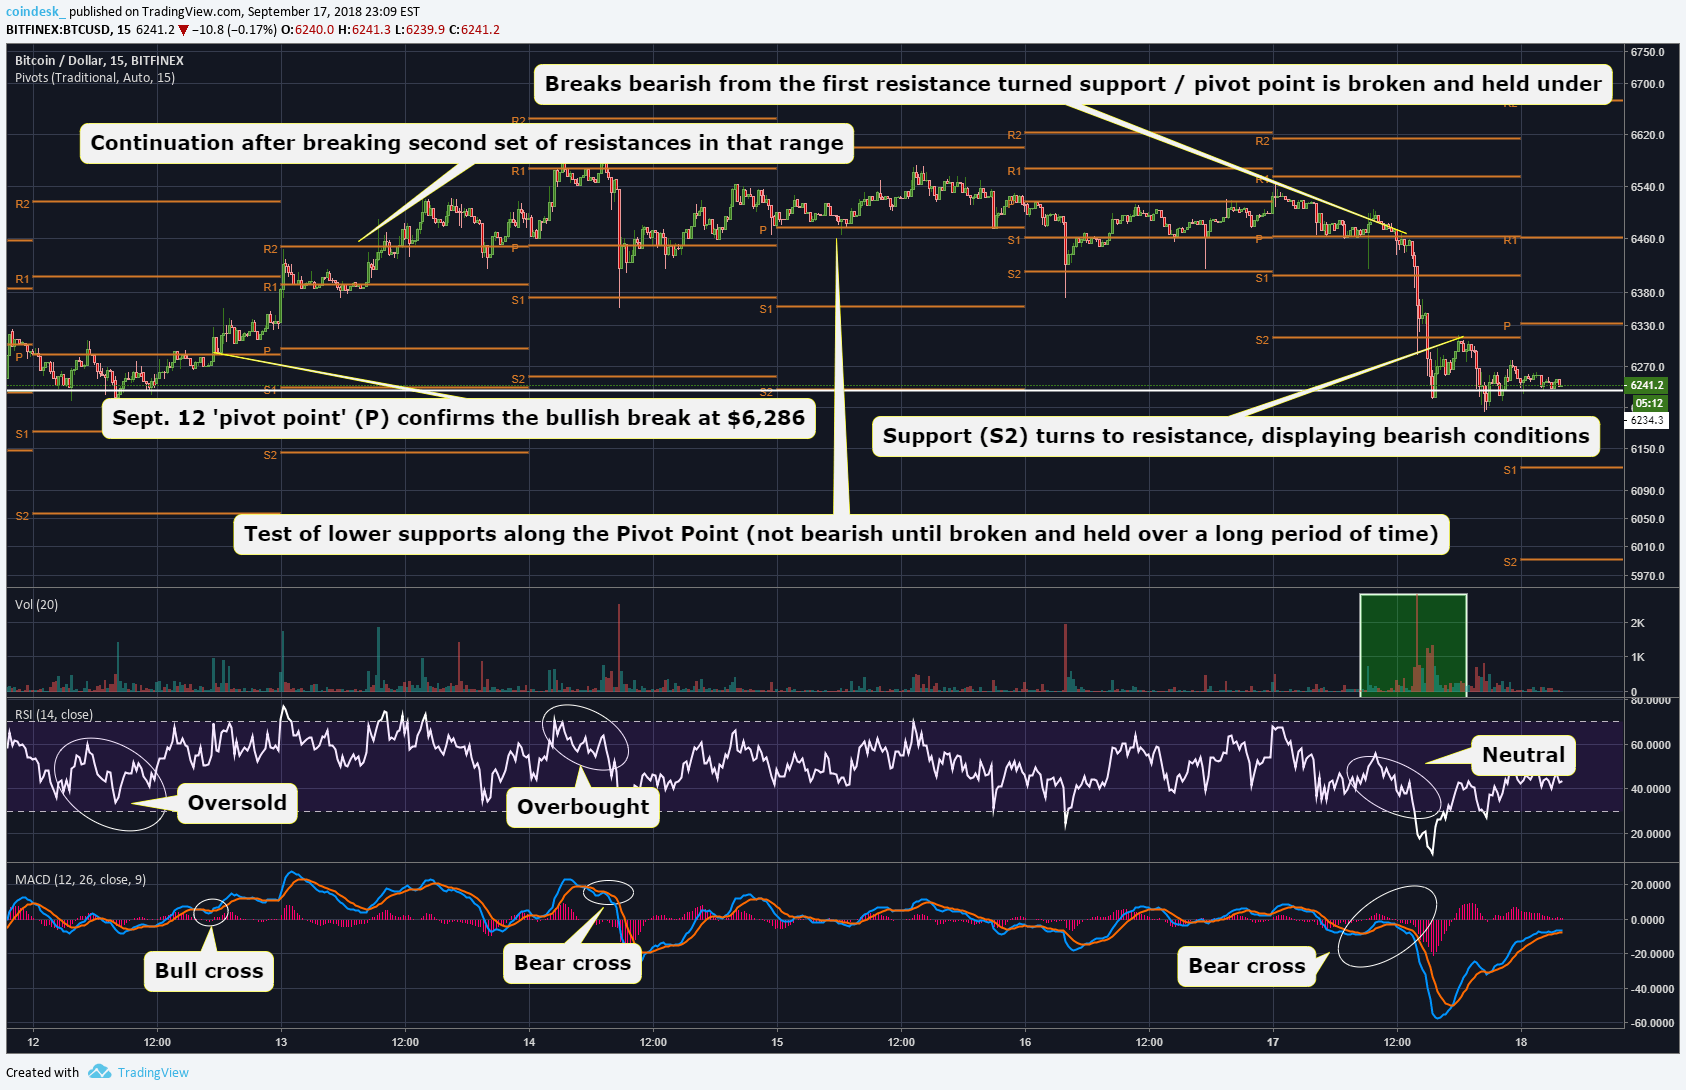
An example shows the Bitcoin chart above with resistance levels marked as “R1” and “R2,” and support levels marked as “S1” and “S2.” The pivot point is marked as “P.”
Some traders end up using up to four resistance and support levels.
The first example shows that the pivot point acted as a threshold for prices to go bullish for continuation, therefore confirming the legitimacy of the move $6,285.
The RSI showed oversold conditions just before the breakout, and the MACD printed a bull cross, which added an additional layer of confirmation to this bullish move.
After a few unsuccessful attempts to surpass the R1 resistance level, Bitcoin plummeted on Sept. 14.
Finally, Bitcoin’s price went under the pivot, as well as both supports on Sept. 17.
Each of these moves had multiple indicators that confirmed the market sentiment moves as either a support and resistance test or a legit rally or breakdown.

Conclusion

Pivot points are certainly a useful addition to a trader’s technical toolbox that allows them to confirm the support and resistance levels, as well as to judge the strength of big price moves.

Categories
Forex Course

99. Pivot Points: What have we learned so far?

Introduction

In the previous six lessons, we discussed pivot points right from understanding what they are, to the strategies one can apply to trade the markets. Now, let’s summarize what we’ve learned so far and move on with another exciting tool for analyzing the markets.
Pivot Point Basics

A pivot point is a technical indicator in technical analysis trading, which determines potential support and resistance levels in the market. This indicator is stationary, unlike the other indicators that move with the change in price.

The pivot points are levels that are essentially determined using the previous day’s high, low, and close price. So, every trading day, we can obtain one set of the pivot point.

What is the pivot point made up of?

There are up to six levels that make up the pivot point levels. One of the levels is the pivot point level, and the rest are support and resistance levels. The six pivot levels are symbolized as follows:

Pivot Point (PP/P)

First Support (S1), First Resistance (R1)

Second Support (S2), Second Resistance (R2)

Third Support (S3), Third Resistance (R3)

Fourth Support (S4), Fourth Resistance (R4)

Fifth Support (S5), Fifth Resistance (R5)

Note that, most of the time, we stick to the levels until S3/R3 because the price does not usually touch the levels beyond it.

How are the pivot levels calculated?

As mentioned, the pivot points are calculated using the close, high, and low of the prior trading day.

For example, the Pivot Point, First Support, and First Resistance are calculated as follows:

PP = (High + Low + Close) / 3

S1 = (2 x PP) – High

R1 = (2 x PP) – Low

Similarly, one can calculate levels until R5/S5. However, these values need not be calculated practically. There are trading platforms that automatically calculate these values.

Types of Pivot Points

There are four types of pivot points based on how the levels are calculated.

  1. Standard
  2. Woodie
  3. Camarilla
  4. Fibonacci

Most of the time, the standard pivot point levels are used.

Strategies using Pivot Points

There are several ways through which one applies pivot points. In our course, we have listed out three strategies.

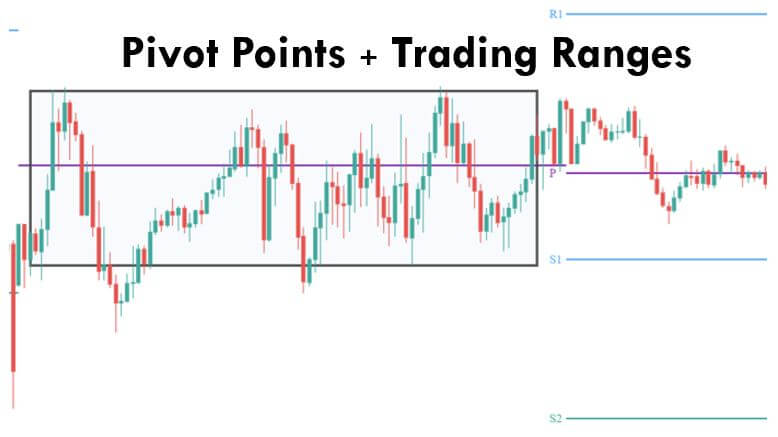
Range trading strategy

According to this strategy, one can consider buying when the support level of the pivot points coincides with the support level of the range. A similar strategy can be applied for shorting as well.

Breakout Trading Strategy

As the name pretty much suggests, traders can consider going long or short when the price breaks above the resistance or below the support level.

Measuring Sentiment

Traders can use the pivot point level (PP) to determine the trend of the market. If the market breaks above the PP, it indicates a buyer’s market and vice versa.

Summing it up

The pivot point is that indicators that can be used every level of traders from beginners, intermediate to the advance trades. However, this indicator is not a standalone indicator. It must always be used in conjunction with other indicators and tools to have higher odds of favoring you. We hope you enjoyed this series on pivot points. Happy trading!

Categories
Forex Course

98. Do You Know There Are Four Types of Pivot Points?

Introduction

In all the previous lessons of pivot points, we considered the traditional pivot points. But this is not the only type of pivot points that are existing. There are three other types to it as well. In this lesson, we shall cover the four different types of pivot points that exist.

Types of Pivot Points

The four types of pivot point are mentioned as follows:

  • Traditional Pivot point
  • Woodie Pivot point
  • Camarilla Pivot point
  • Fibonacci Pivot point

Since we’ve already discussed the traditional pivot point in detail, we shall be concentrating on the rest of the types. Note that, in all the different types of pivot points we will be studying, the only difference is the calculation of the pivot point levels. As far as the concept to trade using these pivot points is concerned, it remains the same as the traditional approach.

Woodie Pivot Point

The Formulae

Pivot point (P) = (High + Low + 2Close) / 4

First Resistance (R1) = (2 x P) – Low

Second Resistance (R2) = P + High – Low

First Support (S1) = (2 x P) – High

Second Support (S1) = P – High + Low

From the above formulas, we can notice that the way of calculations is pretty different from that of the traditional type. In the traditional, we considered the difference between High and Low to calculate support and resistance levels. But, in this case, consider the range as well as the close of the previous day. Some traders prefer this over the traditional pivots because it gives more weightage to the close price of the previous day.

Camarilla Pivot Points

The Formulae

P = (High + Close + Low) / 3

S1 = Close – ((High – Low) x 1.0833)

S2 = Close – ((High – Low) x 1.1666)

S3 = Close – ((High – Low) x 1.2500)

S4 = Close – ((High – Low) x 1.5000)

R4 = Close + ((High – Low) x 1.5000)

R3 = Close + ((High – Low) x 1.2500)

R2 = Close + ((High – Low) x 1.1666)

R1 = Close + ((High – Low) x 1.0833)

If we look closely, we can infer that the support and resistance levels are calculated using the range and the close price similar to the Woodie calculation. The only major difference being, in Camarilla, four levels of Support and Resistance is calculated and is multiplied by a multiplier.

The theory with which Camarilla was created is based on the concept that the price has a natural tendency to return to the mean (here, close of the previous day). So, the simple strategy here is to sell when the price reaches the R3 or R4 level and buy when the price bottoms to S3 or S4 level. However, if the price breaches the S4 or R4 level, it indicates a strong trend in the market.

Fibonacci Pivot Points

The Formulae

P = (High + Low + Close) / 3

S1 = P – ((High – Low) x 0.382)

S2 = P – ((High – Low) x 0.618)

S3 = P – ((High – Low) x 1.000)

R3 = P + ((High – Low) x 1.000)

R2 = P + ((High – Low) x 0.618)

R1 = P + ((High – Low) x 0.382)

For calculating Fibonacci level, the pivot point level is calculated using the traditional method. Then the Support and Resistance levels are obtained by finding the product of the previous day’s range and the corresponding Fib level. The most used Fib levels are 38.2%, 61.8%, and 100%. Finally, adding/subtracting this value with the pivot point yields the Support and Resistance levels.

All of these indicators will be available with most of the brokers and charting tool software. Consider trying all of these pivot points on a demo account and use the ones that work the best for you. This hence brings us to the end of this lesson as well as the concepts involved in the pivot points. In the next lesson, we’ll summarize this topic and move ahead with another interesting technical analysis tool. Cheers!

[wp_quiz id=”70131″]
Categories
Forex Course

97. Where Are The Pivot Point Levels Put To Use?

Introduction

In our previous two discussions, we enlightened you with different strategies for using the pivot points. If you noticed, there we focused only on the pivot support and resistance levels. We didn’t really touch base on the Pivot Point (P) level. So, in this chapter of pivot points, we shall understand how the pivot point level is useful.

The usefulness of Pivot Point

The pivot point is used to measure market sentiment. Yes, with pivot points, we can even gauge the sentiment of the market. In other words, the pivot point helps us determine the direction of the market. It tells us in which direction is the money flowing in the market. So, basically, it indicates the trend of the market. Now, let’s take a few examples to understand the use of pivot points.

What does a Pivot Point tell us?

We know that the pivot point determines the type of market we are in. Inferences are made when the price falls below or above the pivot point.

  • When the market breaks below the pivot point (P), it indicates a bearish market or a market where the sellers are under control.
  • When the market breaches above the pivot point (P), it indicates a bullish/buyer’s market.

Bearish Example

Consider the chart below representing the GBP/JPY on the 15min timeframe. The pivot points are indicated as shown. Initially, we can see that the market was holding above the Pivot Point (P). Later in the day, it broke below the pivot point and then continued to move south. Also, it didn’t even respect the support levels. From this, we can conclude that the support levels do not work every single time. It perfectly fine when it is combined with other tools of analysis. However, a breakout trader would’ve profited the most from it.

Most importantly, one must not use this pivot point level as a tool to enter a trade. It is only an indicator that determines the sentiment of the market. It only tells us if the buyers are showing interest in the currency pair or the sellers. And with information in hand, we use other trading techniques to time the market.

Bullish Example

In the below chart, we can see that the market was trading below the pivot point level. Then it shot up and broke the pivot level as shown. This marks the start of an uptrend. And it is clearly visible that the market headed north by breaking through R1 as well as R2. But at R3, it found resistance. Now since the market is trending up, one can look at the price drop from R2 as a discount and anticipate buying at the R2 level, which is ‘resistance turned support.’

Similarly, traders can determine the direction of the market using the pivot point level and time their entry based on other technical tools and ideas. We hope you found this lesson informative and interesting. Cheers!

[wp_quiz id=”69915″]
Categories
Forex Course

96. Trading Breakouts using Pivot Points

-Introduction

We know that pivot points are no different from the typical support and resistance levels. We also saw how these levels were respected when trading a ranging market. But, could it used to trade breakouts? Let’s find out in this lesson.

Just like your normal Support and Resistance, the pivot levels don’t hold forever. At one point or the other, the price breaks out from these levels. In our range strategy, we always hit buy at the support and sell at the resistance. But there are times the market breaks from these levels and stops us out. When such things happen, we can develop another plan ready for the same and take advantage of it.

In the trading community, there are two types of traders: aggressive traders and conservative traders. And the approach to trade breakouts is different for both. So, we made two strategies to benefit the aggressive as well as the conservative traders.

The Pivot Points Breakout Strategy

Doing it the Aggressive way

The aggressive approach to trade breakouts is very simple. The strategy for such traders is to trigger the trade when the price breaks above resistance or below the support. The logic to this is that the resistance/support which was supposed to hold is now not being respected. It means that the opposite party is showing more strength. Hence, we will also be following the stronger side.

Aggressive traders are the ones to catch the initial move of the breakout. But there is high risk involved in these types of entries.

Trade Example

Below is the chart of GBP/CHF on the 15min timeframe. The pivot points are marked as shown. Initially, we can see that the price broke below S1 support. Here, aggressive traders can get in for a sell after the close of the candle. Later, the price continued to fall down and ended up breaking the S2 support as well. This could be another entry for the aggressive breakout traders.

Placements

As aggressive traders, it is important to have good risk management on the trades. The most basic necessity is the placement of stop-loss and take-profit orders. For the above trades, traders can keep the stop-loss just above the level they entered the trade. However, it would be better to place the stop-loss much higher than that level because we can stay safe from spikes. And a typical TP would be the next Support level. Refer to the above chart to get better clarity on it.

Doing it the Conservative way

The conservative approach is more of a safe approach to trade breakouts. According to this strategy, look to enter the trade when the price retests the level after breaking through that level. In trading terms, this is called the ‘role reversal’ concept. This concept simply means the turning of ‘support into resistance’ and ‘resistance into support.’ For example, when the price breaks below the support level, it is not a ‘support’ anymore; but is now ‘resistance.’ Now, let’s put this into action.

Consider the same chart shown above. We shall be looking if there are opportunities for conservative traders in the same market. In the below chart, we can see that the market broke below the S1. So, now we treat S1 as the resistance and prepare to sell when the price retraces to the S1 level. Similarly, we can enter for a sell when the price breaks below S2 and retests back to S2.

When it comes to the placement of stop-loss and take-profit, one can follow the same approach, as explained in the aggressive traders’ placement.

This brings us to the end of this lesson. Note that the above strategy is only to get an understanding of how to trade breakouts using pivot points. It is highly recommended to apply other technical tools to have more odds in your favor. Cheers.

[wp_quiz id=”69720″]
Categories
Forex Course

95. Adding Pivot Points to Your Range Strategy

Introduction

In the previous two lessons, we completely understood the basics of pivot points as well as how to calculate and interpret them. And now, we can move on and start applying this indicator to our charts and find trading opportunities using it.

In this lesson, we shall use the pivots points in our range trading strategy. We will be giving you a complete guide on the trading range with the assistance of pivot points.

Incorporating Pivot Points into Ranges

The Basics

As we already learned, pivot point has S1, R1, S2, R2, etc. which represents Support and Resistance whose working principles are the same as the typical Support and Resistance. According to the definition, support is the area in which the market tends to hold and move up, and resistance is the area where the market holds and typically moves downwards.

Talking about a range, it is the state of the market which moves in a sideways direction and repeatedly bounces off from support and resistance level. So, we shall be testing the pivot points as the place where the market can hold and possibly reverse.

The Thumb Rule

When the market is at any of the upper Resistance levels, we look to go Short on the security. When the price is at any of the lower Support levels, we look to go Long on the security.

Live Chart Example

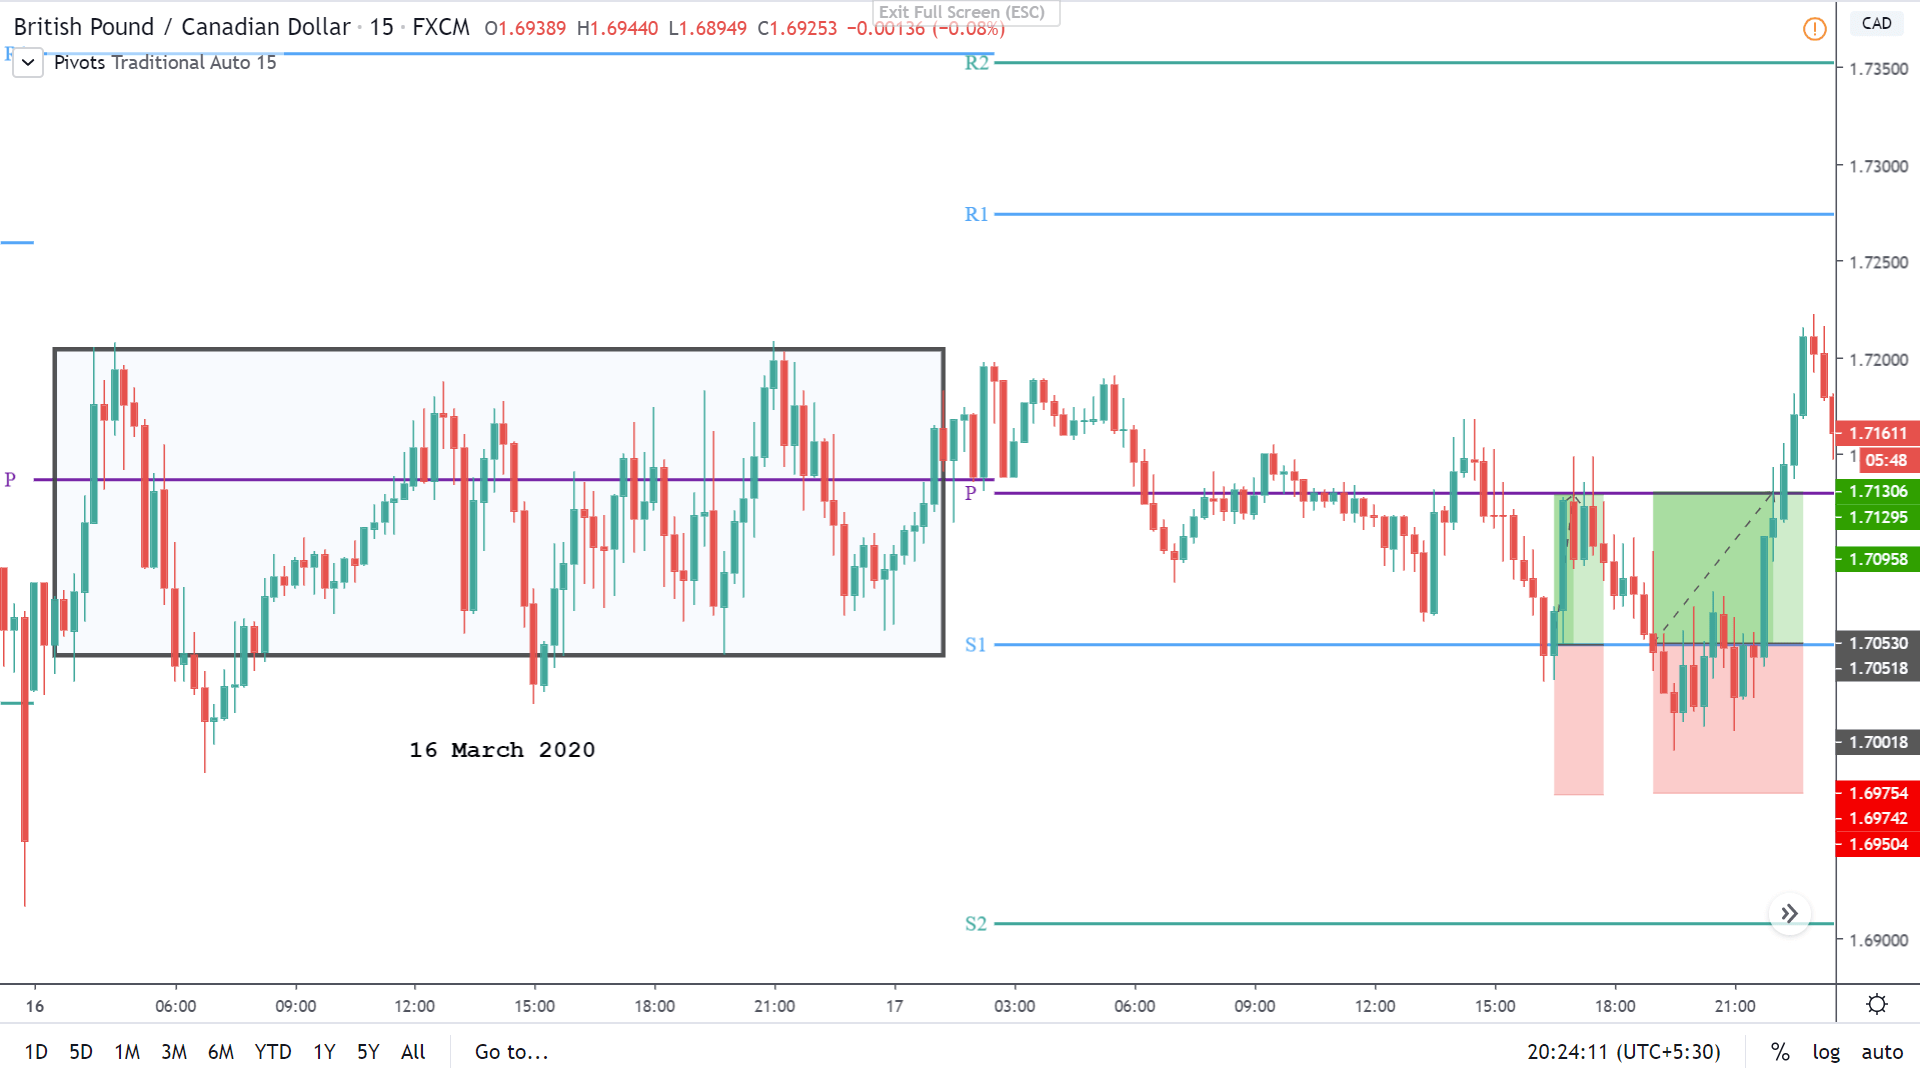
Below is the chart of GBP/CAD on 15min timeframe. We can see that currently, the market is in a range (as shown in the box). The market was ranging on the 16th of March. With these values of 16th March, we calculate the pivot points for the next day and find trading opportunities.

Now consider the same chart after we’ve determined the P, S1, R1, S2, R2 pivot levels. Following up range, we can see that the S1 level was formed exactly at the bottom of the range. Now, both S1 and the bottom of the range is indicating a Buy a signal. Hence, when the price touches the S1 level, we can go long on this pair.

From the chart, we can clearly see that we found two opportunities to hit the buy at the first Support level S1.

Placements

Having a predetermined take profit and stop loss is vital in trading. In this particular example, the take profit can be placed at the pivot point (P) and stop loss below the S1 such that the trade yields 1:1 Risk Reward. Note that there are times when the take profit can be placed at the R1 level as well. But this requires expertise in technical analysis as well as in pivot points.

The above example is the way for traders to get the hang of how to trade pivot points. To do it more professionally, one must use other technical analysis tools to have a confirmation on the pivot levels. For instance, if there appears a Doji candle at the S1 level and also the stochastic indicator is indicating that the market is in the oversold area, then there are more odds in our favor that the support will work in the direction we predicted.

So, to sum it up, one must use the pivot point levels by clubbing it with other technical tools to find optimum results. We hope you comprehended this lesson to the best of your ability. Cheers!

[wp_quiz id=”69435″]
Categories
Forex Course

94. Calculating and Comprehending Pivot Points

Introduction

In the previous lesson, we understood what pivot points are. However, it is also necessary to understand how these levels are calculated. So, in this lesson, let’s go ahead and figure out how these levels are marked and comprehended.

Before getting right into it, let’s brush up the previous topic real quick.

  • The pivot point is an indicator used to identify Support and Resistance levels.
  • It is a static indicator, unlike the other indicators that move with the price.
  • It helps in determining the overall trend of the market in any given timeframe.
  • It is calculated using high, low, and close values.

Below is an image of how pivot points look when applied on the charts. As already mentioned, S stands for Support, R stands for Resistance, and P(PP) stands for Pivot Point. Now we shall see what exactly is S1, R1, S2, R2, etc.

Calculating Pivot Points

Different levels of Support and Resistance are shown when calculating the Pivot point’s support and resistance levels, and they are represented as S1, R1, S2, R2, etc. Now, let’s calculate each one of them. The Pivot Point P(PP) value is given by the average of the high price, low price, and the close price.

Pivot point P(PP) = (High + Low + Close) / 3

First level Support and Resistance Formula:

First Resistance (R1) = (2 x P) – Low | First Support (S1) = (2 x P) – High

Second level Support and Resistance Formula

Second Resistance (R2) = P + (High – Low) | Second Support (S2) = P – (High – Low)

Third Level Support and Resistance Formula

Third Resistance (R3) = High + 2(P – Low) | Third Support (S3) = Low – 2(High – P)

In the above formulas:

High represents the high price from the previous trading day,

Low represents the low price from the previous trading day, and

Close represents the closing price from the previous trading day.

Note: Since the forex market is open 24 hours, the New York closing time, i.e., 5:00 pm EST, is taken as the previous day data. For example, if you want to calculate the levels for Wednesday, you must consider the values of Tuesday.

Comprehending Pivot Points

In this indicator, we came across three levels, namely, Pivot point level, Support level, and the Resistance level. Let’s now understand what they actually depict.

The pivot point is a level drawn at the price of the average of the High, Low, and the close price of the prior trading day. So, if the market falls below the pivot point level on the subsequent trading day, we say that the market is showing bearish sentiment. And if the price goes above the pivot point, we say that the indicator is indicating bullish sentiment.

When it comes to the Support and Resistance levels, their meaning is the same as that of the actual Support and Resistance that is defined in the industry. The Support level is the price at which the market tends to shoot up, and Resistance is the level where the market tends to fall.

This brings us to the end of this lesson. In the coming lessons, we will understand how to trade the markets applying the Pivot Points indicator.

[wp_quiz id=”69225″]
Categories
Forex Course

93. Introduction to Pivot Points

What is a Pivot Point?

The pivot point is a technical indicator that shows the levels typically used to determine the overall trend of the market in different timeframes. These points are essentially used by professional traders to identify support and resistance levels. As a retail trader, one must keep an eye on these levels to identify potential buy/sell signals. To put in simple terms, the pivot points and its corresponding support and resistance levels are places at which markets can possibly change its direction.

The reason this indicator is very enticing is because of its objective. Unlike other technical indicators, there is no decision making involved. The Pivot Points are very similar to the Fibonacci levels. This is because these levels are pretty much self-fulfilling. However, there are some differences in some respects, which shall be discussed in the next section.

It is important to know that the pivot point indicator is mostly designed for short-term traders who wish to take advantage of small price movements. The technique to trade this is similar to that of trading support and resistance, where we participate in the market on a break or bounce from these levels.

The Difference between Pivot Points and Fibonacci Retracements

Though Pivot points and Fibonacci retracements are made by drawing horizontal lines to depict potential support and resistance levels, there vary in few aspects. In Fibonacci levels, there is subjectivity involved in picking the swing lows and highs. But, in pivot points, there is no discretion involved.

In Fib retracements, the levels can be constructed by connecting any price points on a chart. Once the levels are determined, the lines are then drawn at percentages of the selected price range. In the case of pivot points, fixed numbers are used instead of percentages. And the fixed values are the high, the low, and the close of the prior day.

Interpreting Pivot Points

Pivot points indicator is typically used by traders who trade the market using technical analysis. This indicator can be applied to the Stock, Forex, Commodity, Futures as well as the Cryptocurrency market. This indicator is unique from the other indicators because it doesn’t move with the price action.

It is static, and the levels drawn remain at the same prices throughout the day. This means that traders can plan their strategy much in advance. For example, in most of the approaches, if the price falls below the pivot point, traders will go short on the security. And similarly, if the price goes above the pivot point, they will look for buying opportunities.

How do Pivot Points look?

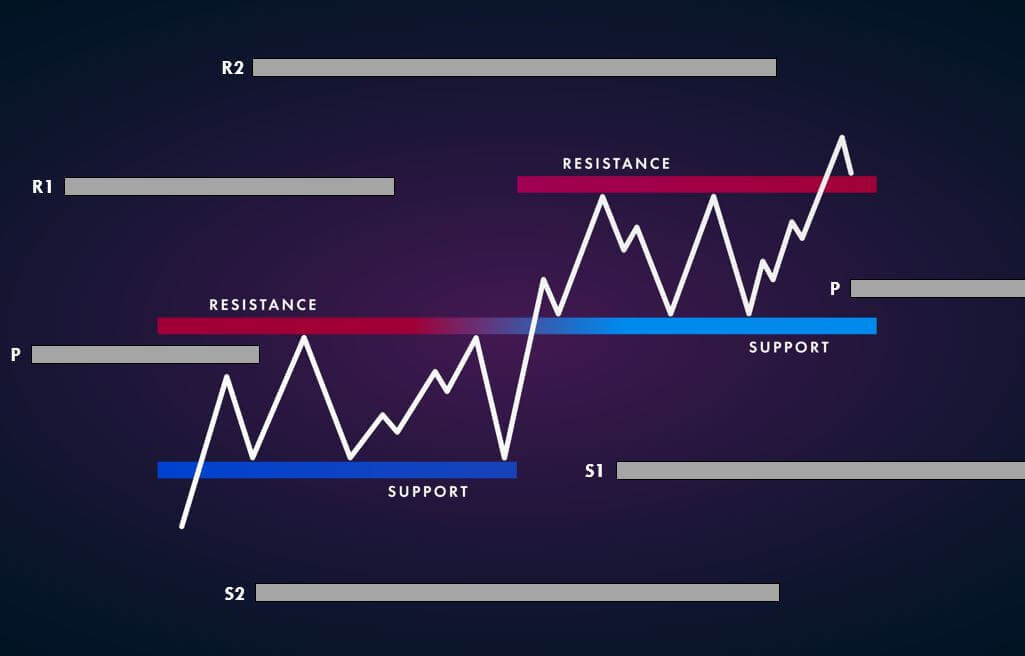
When the standard pivot points are applied to the charts, it will look something like this (as shown below).

In the above chart, P stands for Pivot Point | stands for Support | stands for Resistance

There are R1, S1, R2, S2, etc. as well, but it shall be explained in the upcoming lessons. Stay tuned!

[wp_quiz id=”69068″]
Categories
Forex Course

Introduction To Forex Course 4.0

Hello People,

As you all know, we have completed Course 3.0 successfully. Thanks a lot for the brilliant response and great job on the quizzes you all have taken. We have covered some of the most critical fundamentals pertaining to technical analysis in course 3.0. Please make sure to practice all the concepts we have discussed in a demo account. Without practice, it is impossible to ace the Forex Market using technical analysis. We have also made a quick navigation guide for Course 3.0 so that it’ll be easier for you to get a quick recap whenever required. You can find that guide in the link below.

Quick Navigation Guide – Forex Academy Course 3.0

With all these learnings in mind, we will be moving on to the Forex Academy Course 4.0. We have discussed most of the basics concerning technical trading in the previous course. Hence, we will be exploring some sophisticated strategies and intermediate to advanced concepts of technical analysis in Course 4.0. It is crucial to have acquired the knowledge of whatever we have studied in the previous course to catch up with these complex concepts. So it is highly recommended to finish the previous course before starting off with this one.

Topics that will be covered in Course 4.0

Forex Chart Patterns & Their Importance

Trading The Most Popular Chart Patterns

Oscillators

Momentum Indicators

Pivot Points & their importance

Each of these topics will have about 7 to 10 course articles with corresponding quizzes. The USP of this course are the writers who prepared TOC and the related content. They are professional technical & price action traders who have a combined experience of 20+ years in the Forex market. So make sure to follow all the concepts that are discussed in this course and practice them well to become a successful Technical Trader. Also, try to answer the quiz questions until you get all the questions right. We wish you all the luck. Cheers!

Categories
Forex Market Analysis

Forex and Indices – Daily Update – 06.08.18


Fundamental Overview


The U.S. Dollar leads the market sentiment.

Monday’s trading session starts with the US Dollar Index gaining 0.21 per cent against the main currencies. The Aussie Dollar dips 0.19 per cent expecting for the Reserve Bank of Australia (RBA) interest rate decision which will take place in the overnight session. The analysts’ consensus does not expect changes in the monetary policy decision which should remain at 1.5 per cent, this despite the inflation (YoY) reached the 2.1 per cent, beating the 2 per cent RBA’s target.

source: tradingeconomics.com


Technical Analysis


EURUSD


The EURUSD pair in the 1-hour chart is moving bearish, below the first daily support located at 1.1547 and the second daily support at 1.1528. For long positions, the price should close above the breakdown candle at 1.1566, with a potential profit target in the first daily resistance at 1.1597. In the short position case, the second daily support breakdown could drive to the confluence between the third daily support and the first weekly support at  1.15015. Consider that this level could act as a potential reversal level.


GBPUSD

The Cable is moving bearish and is the worst performer of the session falling more than 0.5 per cent. The GBPUSD pair is testing the first weekly support at 1.2924. The bearish movement continuation could send the price to the third daily support at 1.28999, consider this level as a potential reversal zone. For bullish positions, the price should break above the breakdown candle at 1.2968 level, with a potential profit target in the daily pivot level at 1.30055.


USDCHF


The Swiss currency, from the past week, has moved bullish in five clear moves, currently is testing the confluence zone between the first weekly resistance and the second daily resistance on the 0.9986 area. A breakout of this level could carry to the price to reach the third daily resistance located at 1.0007 level. In the opposite case, the reversal move from the current zone could drive to fall to the weekly pivot level situated at 0.99238.


EURCAD

After the Friday 03 breakdown candle, the EURCAD cross consolidates between the daily pivot at 1.50490 and near to the first daily support at 1.50113. A breakdown below 1.50113 as a bearish continuation, could pull the price to touch the second daily support located at 1.4967 level. For the contrary, the breakout and close above 1.50490, could lead to the EURCAD to re-test the previous high at 1.51009 level.


EURNZD

EURNZD cross is running slightly bullish inside of an upper degree sideways structure. The price is testing the zone between the weekly pivot and the daily pivot on the range between 1.7166 and 1.7170. For long positions, the price should break and close above 1.7170, with a potential target in the first weekly support at 1.7210. For short positions, the breakdown and close below 1.7133 should drag the price to the second weekly support at 1.70546 level.


FTSE 100

FTSE 100 in the first trading session of the week, is moving in a limited range between 7,635 and 7,679 pts., which could be characterised by the stational August lower volatility. For long positions the price should break above 7,679 pts., and could push to the British index to the HHL level at 7,740 pts. For the contrarian, the selling side should be valued if the price breaks under 7,635 pts., with a potential target in the first daily support located at 7,601 pts.


DAX 30

In the last four hours, DAX 30 is moving below the weekly pivot level, in a range between the 12,541 and 12,615 pts. After the DAX made the “V-Turn” in the first hours of the Monday session, testing the low of the Tuesday 02 session at 12,706 pts., we foresee that this level will be relevant short-term so we need to stalk it. Long positions should be considered as long as the price breaks and close above 12,615, with a potential target on the first weekly resistance at 12,653 pts. For short positions, the German index should breaks under the low of the day at 12,541, with a potential target on the first weekly support at 12,452 pts.


Categories
Forex Market Analysis

Forex and Indices – Daily Update – 03.08.18


Fundamental Overview


The U.S. unemployment rate declined to 3.9 per cent in July.

During the Friday trading session, the US Labor Department issued the employment data for July. Non-farm payrolls reached 157,000 new jobs, being lesser than the 190,000 expected by analysts, and was worst than the 248,000 jobs created in June. The unemployment rate for its part fell to 3.9% in July from 4% reported in June by the Labor Department. Despite these data, it is still not possible to reach the level reached in May, which reached 3.8%. Finally, Average Hourly Earnings increased to 0.3% in July from the 0.1% registered in June. The following question is how much will impact the increase in average earnings in the consumer confidence and inflation rate?

source: tradingeconomics.com


Technical Analysis


EURUSD

EURUSD in the 1-hour chart is consolidating between the daily pivot level and the first daily support. For long positions, we need to wait for the close above 1.16, with a profit target in the first daily resistance at 1.1640. Short positions should be valued if the price breaks and close below 1.1580 with a potential profit target in the second weekly support at 1.1544.


GBPUSD

GBPUSD is testing as the support the lower HHL at 1.30103, a consolidation below this level could be a signal for more weakness. For short positions, the price should break and close below 1.30 level with a potential profit target in the lower low of July 19 at 1.2957. For long positions, the price must to break and consolidate above 1.3038 with a potential target in the weekly pivot level at 1.3130.


USDCHF

The USDCHF pair has moved bullish following the triangle pattern as a continuation structure. Currently, the pair is running between the first daily resistance and the daily pivot level. Long positions could be valued if the price breaks above 0.9960, with a potential profit target in the first weekly resistance at 0.9976. For short positions, the price must close under the daily pivot level at 0.9941, with a potential profit target in the confluence between the second daily support and the first weekly support at 0.99.


EURAUD


EURAUD is moving sideways between 1.5724 and 1.5782. Currently, the cross is testing the lower base of the range. A breakdown could drive to the EURAUD drop to the first weekly support at 1.5673. In the bullish scenario, the price could reach the second daily resistance at 1.5818.


GBPAUD

GBPAUD is moving sideways testing the base of the lateral channel in the same way that EURAUD. The breakdown could trigger more falls with a potential target in the second weekly support at 1.7572. For the bullish case, the breakout above 1.7690 could lead the price to the potential profit in the daily pivot level at 1.7720.


FTSE 100

The British index FTSE 100 is consolidating in the confluence zone between the second daily support and second weekly support. For short positions, the price should break below 7,551 pts., with a potential profit target in the third weekly support at 7,516 pts. For the reversal case, long positions should be valued if the price breaks above 7,590 pts, with a potential target in the next swing zone at 7,661 pts.


DAX 30

The DAX 30 is consolidating below the third daily support. In this case, it is highly probable that the price makes a reversal move, at least, to the first daily support located at 12,684 pts. For short positions, the price should close below 12,485 pts, with a potential target in the second weekly support at 12,348 pts.


Categories
Forex Market Analysis

Forex and Indices – Daily Update 02.08.18


Fundamental Overview


In today’s session, market sentiment is led by the preference of risk protection assets facing the expectation for the US employment data, which will be announced on the Friday 03rd session. The US Dollar and Japanese Yen, which advanced 0.30% and 0.30% respectively. Within the commodity currencies group, the oceanic currencies are the hardest hit; the New Zealand Dollar is the worst performer which falls 0.49%, followed by the Australian dollar that drops 0.45% in the trading session.

Source: Forex Academy Collection


Technical Analysis


EURUSD

EURUSD in the 1-hour chart is moving bearish, below the weekly pivot level. For short positions, the price should break under the 1.1657 level with a profit target in the confluence zone between the first weekly support and the Lower HHL at 1.16061 level. For long positions (reversal case), the price should break above the breakdown candle at 1.1691, with a profit target between the confluence zone between the first weekly resistance and the Upper HHL at 1.1729.


GBPUSD

The pair GBPUSD is moving slightly bearish below the weekly pivot consolidating between 1.3090 and 1.3140. A breakdown below 1.309 could drive to the pound to the first weekly support at 1.3050. The bullish case, if the price breaks above 1.3140, the potential target is the first weekly resistance located at 1.3189.


USDCHF

USDCHF in the hourly chart is consolidating as a triangle pattern; this chart pattern suggests more upsides. For long positions, is essential that the price breaks above the weekly pivot level at 0.9937, with a profit target at the third daily resistance at 0.9974. Short positions should be valued if the price breaks under 0.9917, the potential target is the HHL at 0.9880.


EURGBP

The EURGBP cross is running bearish and is consolidating as a flag pattern. For bearish continuation, the price could drop to the confluence zone between the second daily support and the first weekly support at 0.8860. For long positions, the price should break above the weekly pivot level at 0.8897 with a potential move to the HHL at 0.8928.


GBPNZD

The GBPNZD cross is running sideways with a bullish bias in the last sequence which started from the first weekly support at 1.76318. For long positions, the price should break above the first daily resistance with a mid-term target placed on the confluence between the second weekly resistance and the third daily resistance at 1.7864. Short positions should be valued if the price closes below the daily pivot level at 1.77059, and the potential target is at the first weekly support at 1.76318.


DAX 30

DAX 30 is moving slightly neutral in the weekly pivot level at 12,746 pts. For short positions, the price should break below 12,707 with a potential target in the first weekly support at 12,604 pts. Long positions should be regarded if the German index closes above 12,800 pts, with a potential profit target at 12,920 pts.


FTSE 100

The FTSE 100 index shows bearish signals closing below the weekly pivot level at 7,687.9 pts. Continuation of the previous bearish move should be valued if the price breaks under the first weekly pivot at 7,635.2 pts., with a profit target in the confluence zone between the HHL and the third weekly support at 7,521 pts. Long positions could be valued if the price breaks above the weekly pivot level, with a potential target in the first weekly resistance at 7,754 pts. Additionally, note that if the price plunges to the third weekly support, it could be an interesting reversal level.


Categories
Forex Market Analysis

Forex and Indices – Daily Update 26.07.18


Fundamental Overview


Forex News: The market sentiment of the session was led by the US Dollar (DXY), which advanced against the main currencies group climbing 0.68 per cent. The Dollar boost was aided on the one hand, by the labour market data, in the Thursday session the Initial Jobless Claims data rose 217,000, which despite the increase of 9,000 from the previous week’s revised level, continue showing optimistic levels for the American economy. On the other hand, the ECB interest rate decision continues without changes for the common currency, contributing to the strength in the USD appreciation. The worst performer currency of the session was in the “commodities currencies group”; the Aussie (AUD) fell 1.04 per cent dragged by the dive in Copper price which retraced 1.59 per cent.

Forex News – Daily Performance

Forex News - Daily PerformanceSource: Forex.Academy Collection.


Technical Analysis


EURUSD

EURUSD made a false breakout which could not reach the first daily resistance, turning to the daily pivot and even falling below the weekly pivot point changing the market sentiment from bullish to bearish. For long positions, we need to see the breakout above the bearish breakdown candle at 1.1710, with a first potential profit target placed at the first daily resistance at 1.1756, the second potential target is the confluence level between the second daily resistance and the first weekly resistance at 1.1785. Short positions should be valued as a continuation of the breakdown, with a profit potential target at 1.1615. Pay attention to this area because the confluence with the third daily resistance at 1.16077 could be a potential buy zone.


GBPUSD

The GBPUSD pair in the 30-minutes chart tested the first daily resistance of the intraday trading session at 1.3214, After this, the price made a re-test, from where the pound started to fall and found support in the weekly pivot point at 1.31257. For long positions, the price should break over the daily pivot level at 1.31739 with a potential profit target at 1.3215 (first intraday resistance). Short positions should be valued as the continuation of the previous movement when the price breaks under the weekly pivot level (1.31257) with a potential target in second daily support at 1.31065.


USDCHF

The Swiss currency in the 30-minutes chart continues moving sideways between the first daily support (0.99007) and below the first daily resistance (0.9942). For long positions, the USDCHF should break above the first daily resistance at 0.9942 level with a short-term target at 0.9960 (weekly pivot level); for bearish positions, we need to see that the price to close below the intraday range at 0.9910 with a potential profit target in 0.9877 (first weekly support.)


EURCAD

The EURCAD cross in the 30-minutes chart is moving bearish, testing the second weekly support located at 1.52488. For bullish positions, the price should break and consolidate above 1.5278 with a potential target is at the first weekly support at 1.5325. For bearish positions, as a continuation of the trend, the price could drop to the third weekly support at 1.51778.


GBPCAD

The GBPAUD cross is moving bearish nearly above the first weekly support at 1.71211. For long positions, the price should breakdown candle at 1.7185 with a potential target on the daily pivot level at 1.7232. If we are looking bearish continuation, the price could see the bottom at the 1.70067 level (confluence zone between the third daily support and second weekly support.)


FTSE 100

FTSE 100 in the 30-minutes chart is moving in a narrow range below the daily pivot level (7,669.8 pts) and above the weekly pivot level (7,649 pts.) For bullish positions, the price should break above 7,686 pts, with a potential target on the first weekly resistance at 7,735 pts, which is the convergence zone with the second daily resistance. Bearish positions should be considered if FTSE 100 index breaks below the weekly pivot level at 7,649 with a potential profit target at the first weekly support (7,593 pts.), the second profit target is the HHL at 7,521 pts.


DAX 30

The DAX index 30 in the 30-minutes chart soared to the third daily resistance (12,827 pts), from this zone we have two options. Long positions could extend to the second weekly resistance at 12,912 pts, only if the price breaks above the 12,827 pts. The second option is for short trades; it could be considered if the price breaks below 12,715 pts with a profit target located at 12,604 pts.


Categories
Forex Market Analysis

Forex and Indices – Daily Update – 25.07.18


Fundamental Overview


President Trump will meet with Juncker.

US President Donald Trump will meet with the president of the European Commission, Jean-Claude Juncker, in an attempt to overcome the difficulties in bilateral relations between the United States and the European Union, specifically facing the application of additional tariffs to European cars exported to the United States which Trump seeks to increase.

The European Union applies additional 10 per cent tariffs to automobiles imported from the United States, while the United States applies only 2.5 per cent to European cars. Finally, President Trump commented on his Twitter account that both the United States and the European Union should eliminate all tariffs, barriers and subsidies, making trade between them both more just.


Technical Analysis


Forex Trading Indicators

EURUSD

Forex Trading Indicators: EURUSD continue moving sideways but with an intraday bullish bias. The price continues bouncing from the daily pivot at 1.1684. For intraday positions, long positions should be considered if the price breaks above 1.1710, with a potential profit target placed at the second resistance at 1.1747 and the second potential target in the area between the third daily resistance (1.1777) and the first weekly resistance (1.1785). Short positions should be valued if the pair breaks down the weekly pivot level at 1.1680 with a profit potential target at 1.1615.


GBPUSD

Forex Trading Indicators: The GBPUSD pair, as seen on a 30-minutes chart, broke up and consolidated above the first daily resistance on Tuesday 24th’s trading session. In the current session, the price can not strike above the first intraday resistance (1.3178.) For long positions, the price should break over 1.3175 with a potential profit target at 1.3212 (second intraday resistance). Short positions could be valued when the price breaks under 1.3140 with a potential target in first daily support at 1.3090.


USDCHF

Forex Trading Indicators: The USDCHF pair in the 30-minutes chart is moving sideways between the daily pivot (0.9937) and slightly below the first intraday support (0.9915). For long positions, the Swiss currency should break above the daily pivot level with a short-term target at 0.9960 (weekly pivot level); for bearish continuation, we need to see a price close below the intraday range at 0.9914, the potential profit target is at 0.9887 (third daily support).


EURAUD

Forex Trading Indicators: The EURAUD cross in the 30-minutes chart is testing the confluence between the daily and weekly pivot point at 1.5778. For bullish positions, the price should break above 1.58, and the potential target is at the first intraday resistance (1.5829). Bearish positions should be considered if the cross breaks under 1.5717 with a profit target in the confluence zone between the first weekly support (1.56735) and the second daily support (1.56612).


GBPAUD

Forex Trading Indicators: The GBPAUD cross is running sideways between 1.7680 and 1.7794. For long positions, the price should break above 1.7778, and its potential target is slightly above the first weekly resistance at 1.7858. In the case of short positions, the price should break down 1.7680, with a potential target at 1.7589 level.


FTSE 100

Forex Trading Indicators: The FTSE 100 in the 30-minutes chart turned bearish moving from the daily pivot at 7,699 to the weekly pivot level (7,649.9). For bullish positions, the price should break above 7,700 pts, with a potential target at 7,791 pts, which is the convergence zone between the second weekly resistance level and the second daily resistance. Bearish positions should be valued if the British index breaks under the weekly pivot level at 7,649 with a potential profit at the first weekly support (7,593 pts.), the second profit target is the HHL at 7,521 pts.


DAX 30

Forex Trading Indicators: DAX 30 in the 30 minutes chart. After failing the test to the first weekly resistance (12,737.1 pts.), the German index moves bearish below the daily and weekly pivot level turning to bearish the market sentiment. For long positions, we need to see the breakout above 12,600 pts with a potential target in the re-test of the first weekly resistance at 12,737 pts. A short position is considered if the price breaks down 12,537, and its potential target is the second weekly support at 12,293 pts with extension in the HHL at 12,143 pts.


Categories
Forex Market Analysis

Forex and Indices – Daily Update – 24.07.18


Fundamental Overview


Mixed data of preliminary PMI in the Eurozone.

The Flash Purchase Managers Index (PMI) data in July show signs that this third quarter for the eurozone has begun to lose the buoyant momentum that registered during the first half of the year. Manufacturing PMI modestly reached 55.1 points, slightly higher than the 54.9 points reached in June. In the opposite side, Services PMI index fell to 54.4 points from the 55.2 points reported in June. The slowdown in growth momentum suggests that similar levels could be seen in August.


source: tradingeconomics.com

The main cause of this deceleration could be attributed to the fuels price increase of oil as well as the increase in tariffs on steel and aluminium.


source: tradingeconomics.com


Forex and Indices Technical Analysis


EURUSD

The EURUSD in 30-minutes chart continues consolidating. The price is moving above the weekly pivot suggesting a bullish pressure for the pair. Long positions should be considered if the price breaks above 1.1710, with a potential profit target placed at 1.1775. Short positions should be valued if the pair breaks down 1.1667 with a profit target at 1.1615


GBPUSD

The GBPUSD in the 30-minutes chart is consolidating the Friday 20th rally. For long positions, the price must break above 1.3137 with a potential profit target at 1.3208. Short positions should be considered if the price breaks under 1.3085 with a potential target at 1.3022.


USDCHF

The pair USDCHF in the 30-minutes chart is developing a bullish retrace of the previous sell-off. For bullish positions, the next resistance is 0.996; for bearish continuation, the critical support to break down is 0.9922, and the potential profit target is at 0.9887.


EURCHF

The EURCHF cross in the 30-minutes chart is testing resistance with the 200-period moving average which is converging with the first daily resistance. For long positions, we need to see the breakout of the 1.1629 level with a potential target at 1.165 (Weekly Pivot Zone). In the bearish side, the price should break under 1.1603 level, with a potential profit target at 1.1582.


GBPCHF

The GBPCHF cross is turning bullish after the 1.3049 level breakout. Long positions have the potential target at 1.3117, coinciding with the third daily resistance. On the short side, the price should break down 1.3001 level, with a potential target at 1.2965 level.


FTSE 100

FTSE 100 in the 30-minutes chart shows that the price is moving above 24 and 200 moving average. Also, the British index has bounced from the weekly pivot level, the next resistance es at 7,728. For bullish continuation, the next target is 7,786 pts, which is the convergence between the second weekly resistance level and the third daily resistance.


DAX 30

DAX 30 in the 30 minutes chart shows that the price has surpassed the third daily resistance without to make a reversal move to the daily pivot level, it suggests that the German index should continue with the bullish bias with a target placed at 12,855 pts (previous resistances confluence area.)


Check out Forex and Indices technical analysis for July 16, 2018.

Categories
Forex Market Analysis

Forex and Indices – Daily Update – June 05th, 2018


FOREX MARKET NEWS AND ANALYSIS

Hot Topics: 

  • U.K. PMI Services helped the Pound Group to Show Reversal Signals.
  • Main Pairs Against the US Dollar Keeps Consolidating.
  • European Indices Close Lower.

U.K. PMI Services helped the Pound Group to Show Reversal Signals.

PMI Services in May reached 54 pts, the highest level for three months. After the data release, GBPUSD raised to 1.34 level. Now we expect a corrective move before a new bullish cycle. Invalidation level remains at 1.32544.


As we expected in our last Daily Update, GBPAUD made a bullish move from the second weekly support to the weekly pivot level direction. Now after the impulsive move, we expect that the price could make a consolidation move as a flag pattern before proceeding with its previous movement.


GBPNZD is making a potential bottom structure if the breakout of the 1.91286 level activates the figure, with the profit target at 1.93377. We are surveilling the 1.9005 level as Control Level.


Main Pairs Against the US Dollar Keep Consolidating.

The common currency still is developing a consolidation structure after the impulsive move started in the previous week. RSI has found support at the 41.69 level which makes us foresee a new clue for the bullish reversal move that could be starting.


The inversely correlated currency with the Euro and Swiss Franc is also making a sideways consolidating structure. We expect more declines for this pair; our first bearish target is 0.9815, the second target is 09783 level. Invalidation level is 0.9983.


European Indices Close Lower.

The FTSE 100 broke down the ascending flag pattern in the blue box. The invalidation level remains at 7,803 pts. In the same way, the RSI has broken down its ascending flag pattern. The British index could visit the 7,500 level, or if it moves below this level, the FTSE could make a second leg down before a new bullish cycle.


DAX 30 has made the same breakdown in the ascending wedge pattern. RSI also has broken down its ascending wedge. The first bearish target is 12,528. In case that price falls below 12,386, the next bearish targets are 12,125 and 11,990.


Categories
Forex Market Analysis

Forex and Indices – Daily Update


Hot Topics: 


  • Major currencies show bullish signals against the greenback.
  • Indices recovers but more falls are expected.
  • Pound crosses could turn bullish.


Major currencies show bullish signals against the greenback.

Forex Daily Market Update

The EURUSD broke up the flag pattern testing the 1.17 level resistance. Now the price is making a throwback to the congestion area. RSI also is showing bullish signals with the breakout and test to the flag structure.


GBPUSD looks like as its turning bullish. On the one hand, the price is making higher highs and higher lows. On the other, the RSI found support above the 40 level; this signal makes us foresee that a turning movement is near for the pound.


USDCHF is in a congestion zone between 0.9845 and 0.989. We expect a new bearish move to the region between 0.9784 and 0.9815. The shape of the price sequence that started on May 9th looks like a consolidation structure and is likely that the price could see new highs.


Indices recovers but more falls are expected.

FTSE 100 is recovering from the last selloff but is moving in the Potential Reversal Zone. RSI moves in an ascending channel but it still didn’t break the key level 60 to show bullish signals. Invalidation level is above 7,803.5.


In the same way as the FTSE, the DAX is moving in a consolidation structure as an ascending wedge. RSI is moving in the 51.53 level, but it doesn’t mean that in the short-term the trend is bullish, it suggests that the bias remains bearish and the price is making a retracement. Invalidation level is above 13,040.6.


Pound crosses could turn bullish.

GBPCAD is moving sideways and tested the monthly pivot level at 1.73191 becoming a relevant resistance. We think the cross could make a new low near the first weekly support at 1.71310, where the price could start a bullish cycle with a profit target at the weekly second resistance confluence area on 1.7510. Invalidation level is placed below 1.7065.


GBPAUD  has been moving mostly bearish during this session, but we expect that the price could make a bullish reversal move in the area between 1.7360 and 1.73195, where it could bounce from, with the eyes placed on the weekly pivot at 1.76242. Invalidation level is below 1.725.


Categories
Forex Market Analysis

Dollar Index Drops, Sterling jump to its max, Wall Street is moved up by Earnings

Hot Topics.

  • Dollar Index drops despite the increase in Retail Sales (MoM) in March.
  • Sterling strikes the highest level of the year for a second time.
  • Japanese Cabinet says the economy is “recovering moderately.”
  • Watching the Copper bullish cycle.
  • US Indexes climbs are boosted, aided by the companies earnings reports.

Dollar Index drops despite the increase in Retail Sales (MoM) in March.

The US economy continues showing strength signals about its economic growth. This time it was the retail sales report shift that advanced up 0.6% from February 2018 and 4.5% (YoY). Sales from the vehicle and parts dealers boosted 2% in March. Despite this good news, the US Dollar Index fell 0.40% touching its PRZ. While the price continues above the 88.52 level, we will consider the chance of a new bullish cycle.

The Euro, which represented more than 50% of the Dollar Index, closed the session with 0.41% gain. The pair still has almost 40 pips of space to reach its PRZ, previous to the ZEW economic sentiment data release. Meanwhile, the Index still could maintain its trading range. The invalidation level of the reversal scenario is above 1.2476.


Sterling strikes the highest level of the year for a second time.

The Pound is the best performing currency of the year with an advance of 6.24% (YTD). Not even the uncertainty driven by the Brexit negotiations or the negatives consequences of the severe weather conditions that have impacted some sectorial economic indicators have been enough to slow the Pound rally. In our last Daily Update, we saw a potential top and reversal pattern; our vision is that we could witness a 2B Pattern. In this case, we will be attentive to a breakout candle before to pulling the trigger.


Japanese Cabinet says the economy is “recovering moderately”.

The Cabinet Office of Japan described Japan’s economic growth as a “recovery at a moderate pace”. The private consumption and business investment in exports are “picking up”. Concerning the tariffs tensions between the US and China, the Cabinet economists see it as a risk factor they will observe closely. The USDJPY pair fell 0.31% to our PCS (Potential Continuation Section) as a bearish wedge pattern. If the price remains above 106.61, our vision continues to be bullish.The Pound/Yen cross is testing the second monthly resistance pivot level; however, it still could make new highs before a deeper correction. Our vision is that the cross could climb to the area between 155.8 – 157. Selling positions are considered only if the price breaks below the 152.95 level.

Watching the Copper bullish cycle.

Copper is developing a bullish cycle since January 2016. It is currently in an ascending expansive triangle pattern. In the long term, the red metal has “market debt” in the 3.44 level. In the short-term, as long as the price keeps above 2.98, the trend is bullish. If the price moves down to 3.01 – 3.03, copper could find new buyers at those levels, with their targets at around 3.20 – 3.21 and its extension in the 3.25 – 3.28 area.

US Indexes climbs are boosted, aided by the companies earnings reports.

This week,  the big companies started their quarterly earnings release. The optimistic analysts’ expectations came under the assumption that results are coming mainly from activities made before the tariffs conflict between the US and China. Dow Jones 30 closed the first trading session of the week with an advance of 0.44%. The Dow is testing the key level 24,620 and we are watching from our short-term picks. The invalidation level is below 24,090.

In the same way, Nasdaq 100 closed the session advancing 0.43%. The Technological Index is moving in an ascending triangle pattern. Mid-term, we expect that the price will hit the 7,090 level. The invalidation level for the bull market scenario is below 6,398 pts.

© Forex.Academy


Categories
Forex Educational Library

Finding Trading Opportunities using Pivot Points

Pivot Points

Pivot Points (PP) are maybe the most straightforward and accessible trading approach or technique. The objective of this article is to show how to find trade opportunities using Pivot Points. We won’t make any explanation regarding the different Pivot Points trading strategy, i.e., Camarilla, Woodie, Fibonacci, or DeMark.

A Pivot Points framework is a mathematical method based on the previous N-period calculation, where N could be hourly, daily, weekly, monthly, or even, yearly. The most common timeframes to compute pivots are daily and weekly. In the short-term -Intraday trading-  traders use mostly daily pivots;  in the mid-long-term – Swing trading- they tend to use weekly or monthly pivots.

The Pivot Point calculation formula uses the High (H), Low (L) and Close (C) prices of the period:

Different supports and resistance levels are determined as follows:

THE STRATEGIES

First Strategy, Objective Levels:

  1. Consider taking “long” positions if the price is over the PP, and “short” positions in the opposite case.
  2. First target: R1, second target: R2. If price gains momentum, consider R3 as a final target. Another possibility is to trade from R1 to R2 (see figure 1 and 2).
  3. An order stop should be placed below the low of the Pivot Point.

In figure 1, we observe the trade in AUDUSD. In this case, the long position went from R1 to R2, and it was based upon the bullish bias that started on the 2nd of June’s session and still holding on the 6th of June. Figure 2 shows the result of the trade, closed at R2

Pivot Points AUDUSD

Figure 1: Trade from R1 to R2.

Source: Personal Collection.

AUDUSD TRADE

Figure 2: Result of the trade from R1 to R2

Source: Personal Collection.


Second Strategy, Potential Reversal Level:

This strategy is riskier because sometimes it could signal counter-trend trades. In this case, the idea is:

  1. Consider going “short” when the price reaches R2 or R3. Go long when the price goes down to S2 or S3 levels.
  2. If a trade is taken from R3, the first objective is R2, and the next target is R1. The “V” Pattern is not frequent, but it’s feasible to find it on volatile sessions (see figure 3).
  3. When trading a swing long at S3, SL (stop loss) should be placed slightly below the low of the day; or conversely, a swing short requires an SL above the daily high.

In figure 3, the GOLD (XAUUSD) opens the Asian and European session with a bullish bias, but when the price rises to R3, the volatility drives prices back to the PP of the day (blue line). Under this scenario, there is a definite possibility to enter a short position at the next candle open, once the price has confirmed the change in intraday trend.

GOLD (XAUUSD)

Figure 3: R3 as Potential Reversal Level.

Source: Personal Collection.

Third Strategy: The Power of Confluence.

In trading, a confluence is the convergence of two or more levels. A confluence of two or more pivot levels improves the possibility of them being a consistent support/resistance level compared to a single pivot level. In figure 4, we observe some confluences in GBPNZD; the reader should keep in mind that a confluence defines a zone, not an individual level, and price action must validate every zone or pivot level. Confluences also could be used with different timeframes, for example, weekly pivots with monthly pivots as shown in figure 5.

GBPNZD

Figure 4: Confluences.

Source: Personal Collection.

GBPNZD confluences mix

Figure 5: Confluences.

Source: Personal Collection.

A personal study based on the price movements between Daily Pivot Points levels applied to the Aussie, where the objective is to use the support/resistance levels as objectives or reversal zones, has revealed the results shown in figure 6. As we can see, the price movements draw a kind of Gaussian Bell shape, where most of the price movements are concentred between S1 and R1. Another observation is to consider R3 as a Potential Reversal Level.


RANGE OF PRICE MOVEMENT

Figure 6: Range of Movements between Pivot Points.

Source: Personal Collection.

Finally, I’ll tell you about my personal experience using daily pivot points. Some days, when a session moves within a narrow range, the price is moving between the daily pivot, and therefore between S1 and R1 (see figure 7). Then, it’s highly likely that the next session shows an explosive movement or a highly volatile session, maybe due to a relevant news or economic data release. In this case, the potential move expected could be from PP to R2 (or S2).

AUDUSD narrow range big move

Figure 7: Narrow Range Session and Volatile Session Movements.

Source: Personal Collection.


SUGGESTED READINGS

  • Duddella, S. (2007). Trade Chart Patterns Like The Pros.
  • Person, J. L. (2007). Candlestick and Pivot Point Trading Triggers: Setups for Stocks, Forex and Futures Markets. New Jersey: John Wiley & Sons, Inc.

©Forex.Academy