Categories
Forex Course

197. Using The USDX Numbers To Trade The Forex Market

Introduction

The U.S. Dollar Index is one of the most reckoned currency indexes and trades on exchanges with the DXY ticker or the USDX ticker. This index has been around in the market since 1973, when the base value was kept at 100,000.00, which is now 100.00.

It is a very prominent factor that facilitates Greenback. And the basket used to measure the U.S. dollar index value has only been changed once post-Euro replaced many other European currencies in 1999.

Formula To Calculate USDX

USDX = 50.14348112 * the EUR/USD exchange rate ^ (-0.576) * the USD/JPY exchange rate ^ (0.136) * the GBP/USD exchange rate ^ (-0.119) X the USD/CAD exchange rate ^ (0.091) × the USD/SEK exchange rate ^ (0.042) * the USD/CHF exchange rate ^ (0.036).

Implementing The US Dollar Index to Trade Forex

The movement determined in the U.S. currency index, such as the USDX, offers traders a sense of how the currency is experiencing a change in its value against other currencies in the index. For instance, if there is a rise in the USDX level, this indicates the rise in the U.S. dollar. Similarly, when the level of USDX is falling, so is the dollar in the foreign exchange market.

Many financial reporters leverage the changes witnessed in the U.S. Dollar Index’s value to offer their viewers and audiences an idea of how the U.S. dollar performed in the foreign exchange market. This works as an alternative to analyzing how each currency increased or decreased against the dollar.

Moreover, the USDX can also act as an inverse indicator that reflects the strength of the consolidated Euro currency of the European Union, considering that the weight of Euro (57.6%) is the most in the index.

Another prominent aspect that the forex trader should consider is how the movements of the USDX is associated with the other currencies that are put against the U.S. Dollar.

For instance, when the currency pair is measured as USD/JPY, it is likely to be positively correlated, and both the currencies should rise and fall at the same time.

Contrarily, when the currency pair is measured like EUR/USD, then the currency pair and USDX are inversely correlated. This implies that they are likely to move in the opposite direction, where one will fall when the other rises.

[wp_quiz id=”97457″]
Categories
Forex Elliott Wave Forex Market Analysis

Is the US Dollar Index Finding A Bottom?

Technical Overview

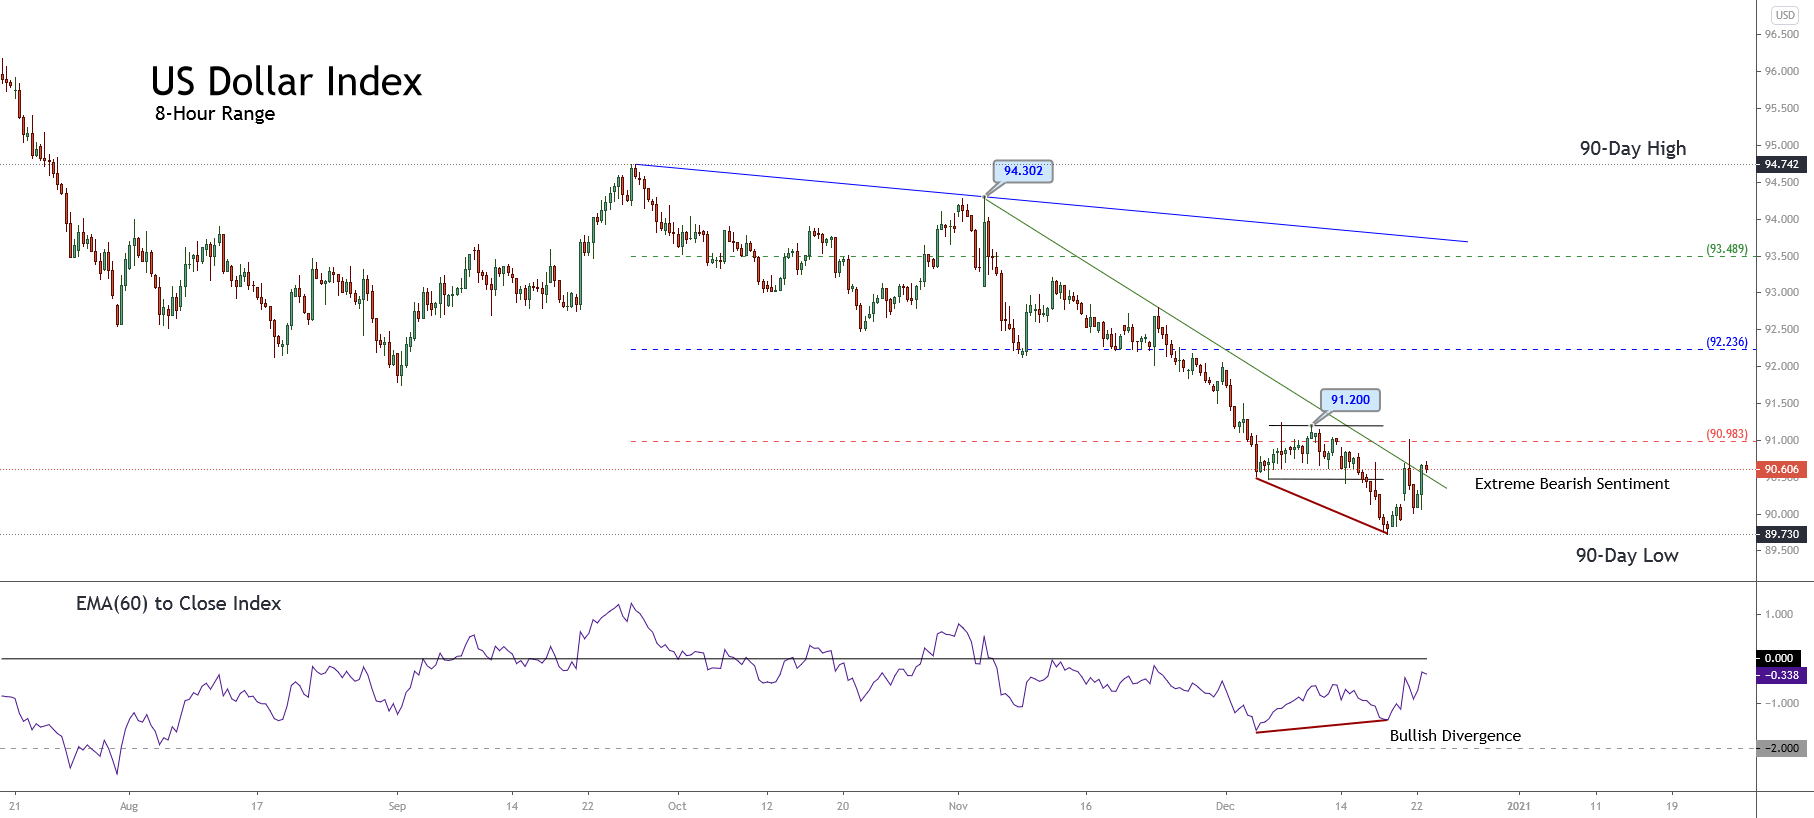
The US Dollar Index (DXY) continues bouncing in the extreme bearish sentiment zone, testing the resistance at 90.983. The breakout of this resistance level could lead to expect further upsides in the following trading sessions.

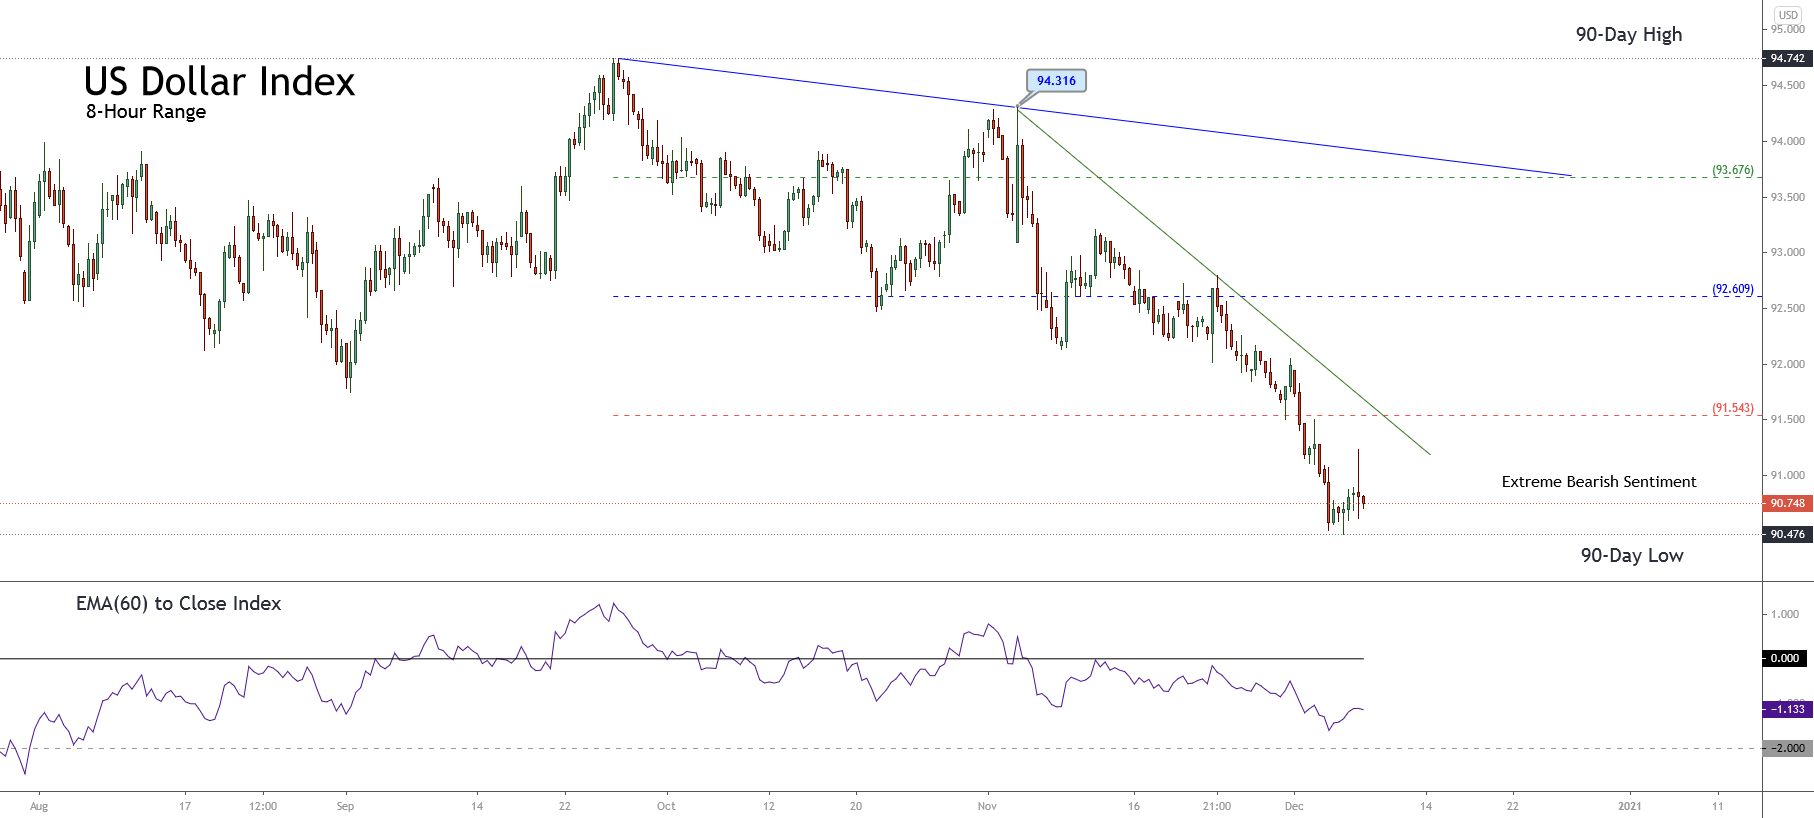
The following figure shows the US Dollar Index in its 8-hour timeframe exposing the mid-term market participants’ sentiment unfolded by the 90-day high and low range, revealing the bearish trend’s exhaustion. In this context, the surpassing of the next resistance at 90.983 could warn about the Greenback recovery, which could boost the price until the next resistance is located at 92.236. Likewise, the exhaustion could imply the consolidation of the bearish trend.

On the other hand, the primary mid-term trend plotted in blue shows the bearish pressure that remains in progress and the current since DXY found resistance at 94.742 on September 25th. Likewise, the secondary trend identified with the accelerated green downward trendline shows a pause of the short-term downtrend started at 94.302 on November 04th. In this context, the pause in progress represented by the rising minor trend could develop a limited rally, which could carry the price to test the precious swing at 91.200 reached on December 09th.

Technical Outlook

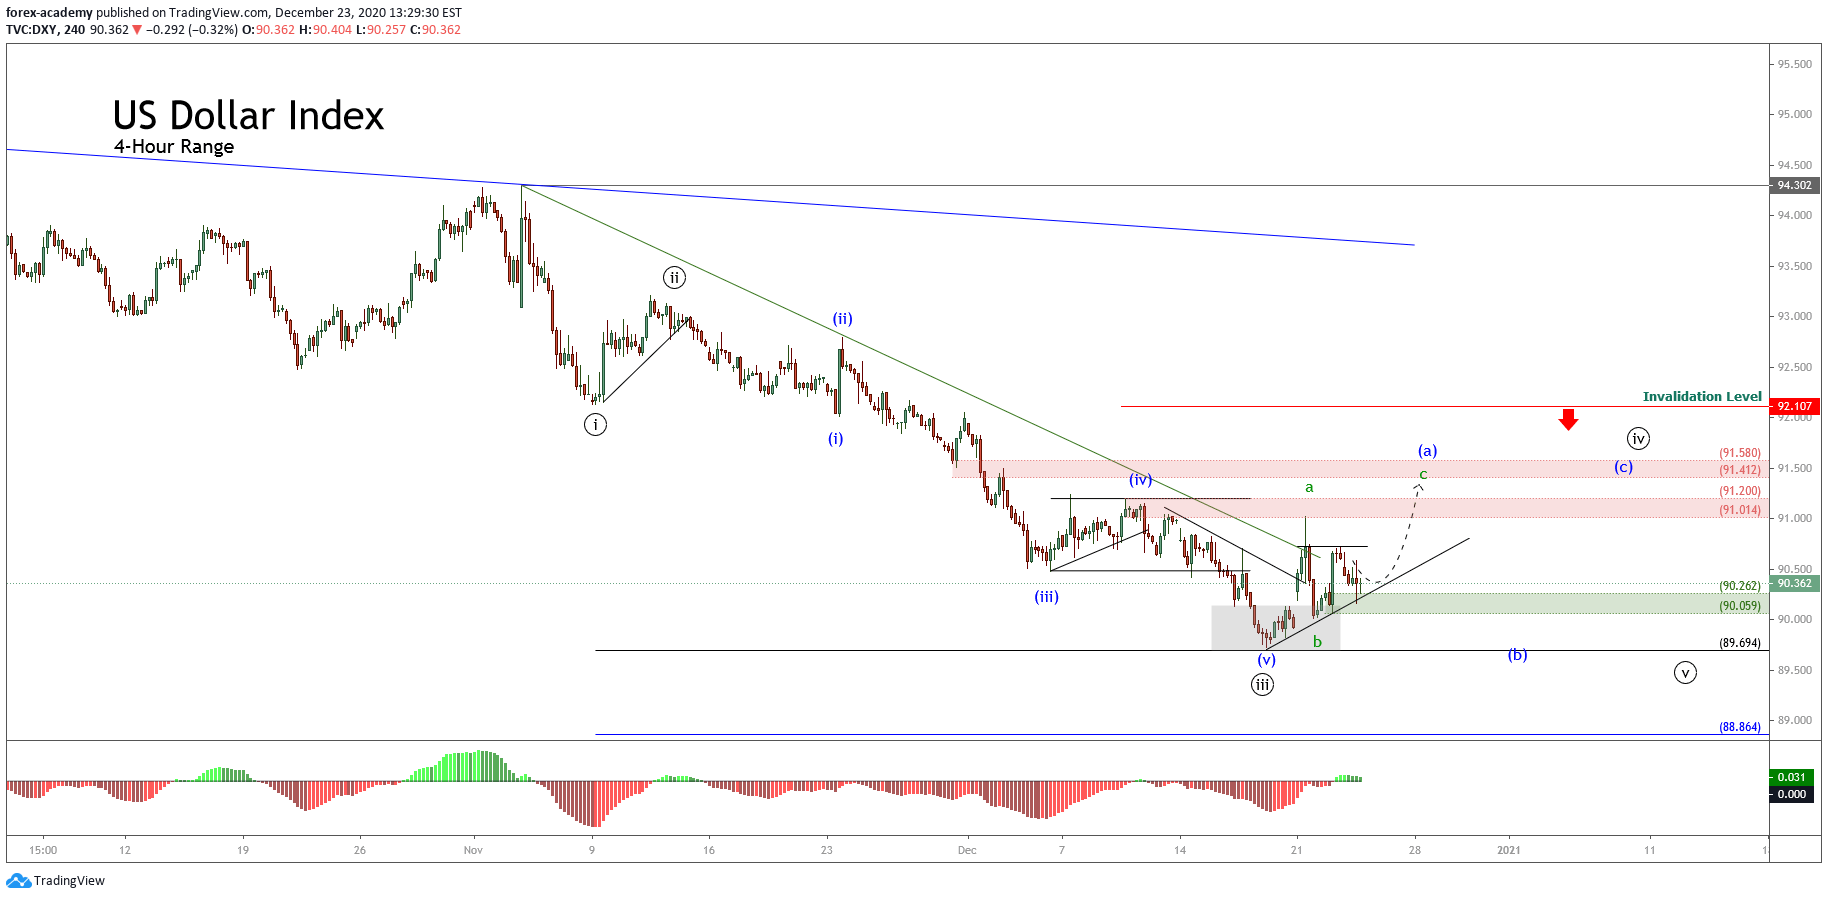
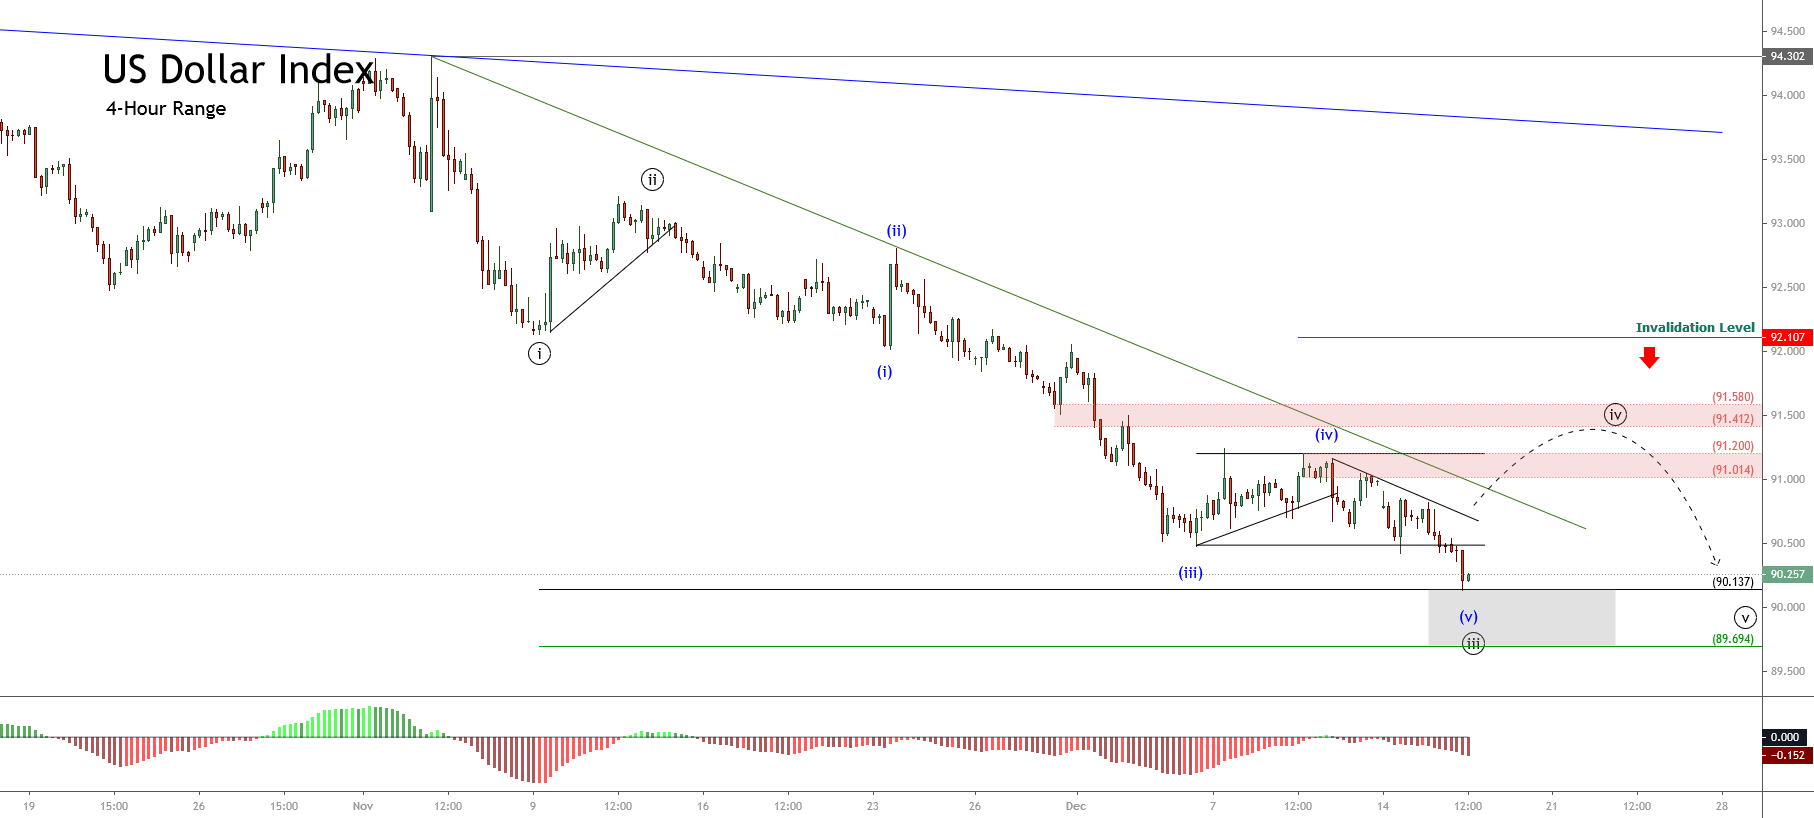
The short-term Elliott wave view for DXY exposed in the next 4-hour chart reveals the end of the bearish wave ((iii)) of Minute degree labeled in black and the start of wave ((iv)) of the same degree, suggesting the possibility of a corrective rally, which could take until January 20212.

From the previous chart, we distinguish the start of wave ((iv)) identified in black, which began when DXY found support at 89.73 on December 17th, ending the third wave of Minute degree labeled in black. Likewise, the price action surpassed the short-term downward trendline plotted in green, suggesting the bearish sequence’s exhaustion that began at 94.302 on November 04th.

With the short-term trendline piercing, DXY developed the first segment of a corrective wave of Subminuette degree identified as wave a labeled in green, which found resistance in the supply zone between 91.014 and 91.200. Once topped at 91.018, the Greenback retraced, developing its wave b of the same degree, which found support in the intraday demand zone between 90.262 and 90.059. 

The textbook suggests that the price action should develop a third move identified as wave c in green, which could advance until the next supply zone bounded between 91.412 and 91.580. Once the US Dollar Index completes the third segment, the Greenback will complete the wave (a) of Minuette degree identified in blue corresponding to the first segment of the wave ((iv)) in black.

In summary, the US Dollar Index looks starting to develop the first segment of the fourth wave of Minute degree, suggesting the pause of the primary trend’s downtrend, which could last up until January 2021. In this regard, DXY currently found temporary support at 89.730, and the price could develop a new decline corresponding to the fifth wave of Minute degree. The potential next decline could pierce the previous low, being its potential next bearish target located at 88.864. Finally, if the price action surpasses the invalidation level placed at 92.107, the Greenback could start to show recovery signals, which could carry to expect a bullish reversal move.

Categories
Forex Technical Analysis

US Dollar Index awaiting FOMC Meeting in the Extreme Bearish Zone

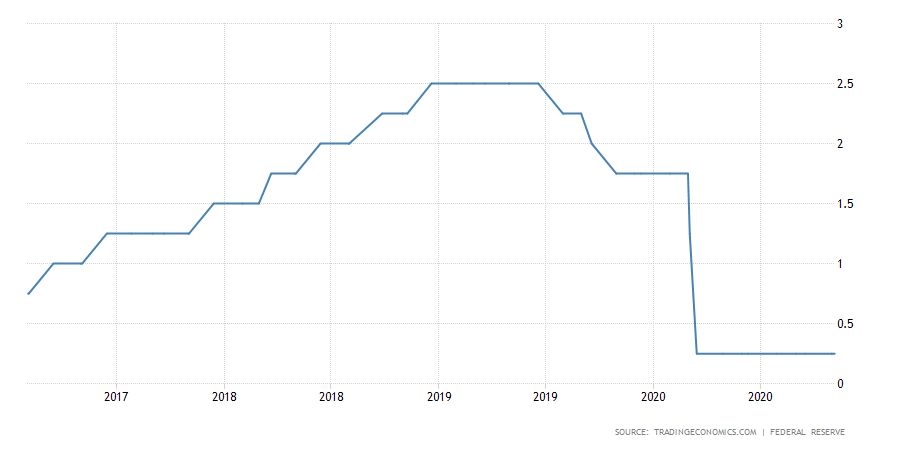
The US Dollar Index (DXY) reached a new yearly low of 90.128, expecting the last FOMC interest rate decision meeting of the year. The analysts’ consensus anticipates the rate unchanged at 0.25% by the FED.

Source: TradingEconomics.com

Technical Overview

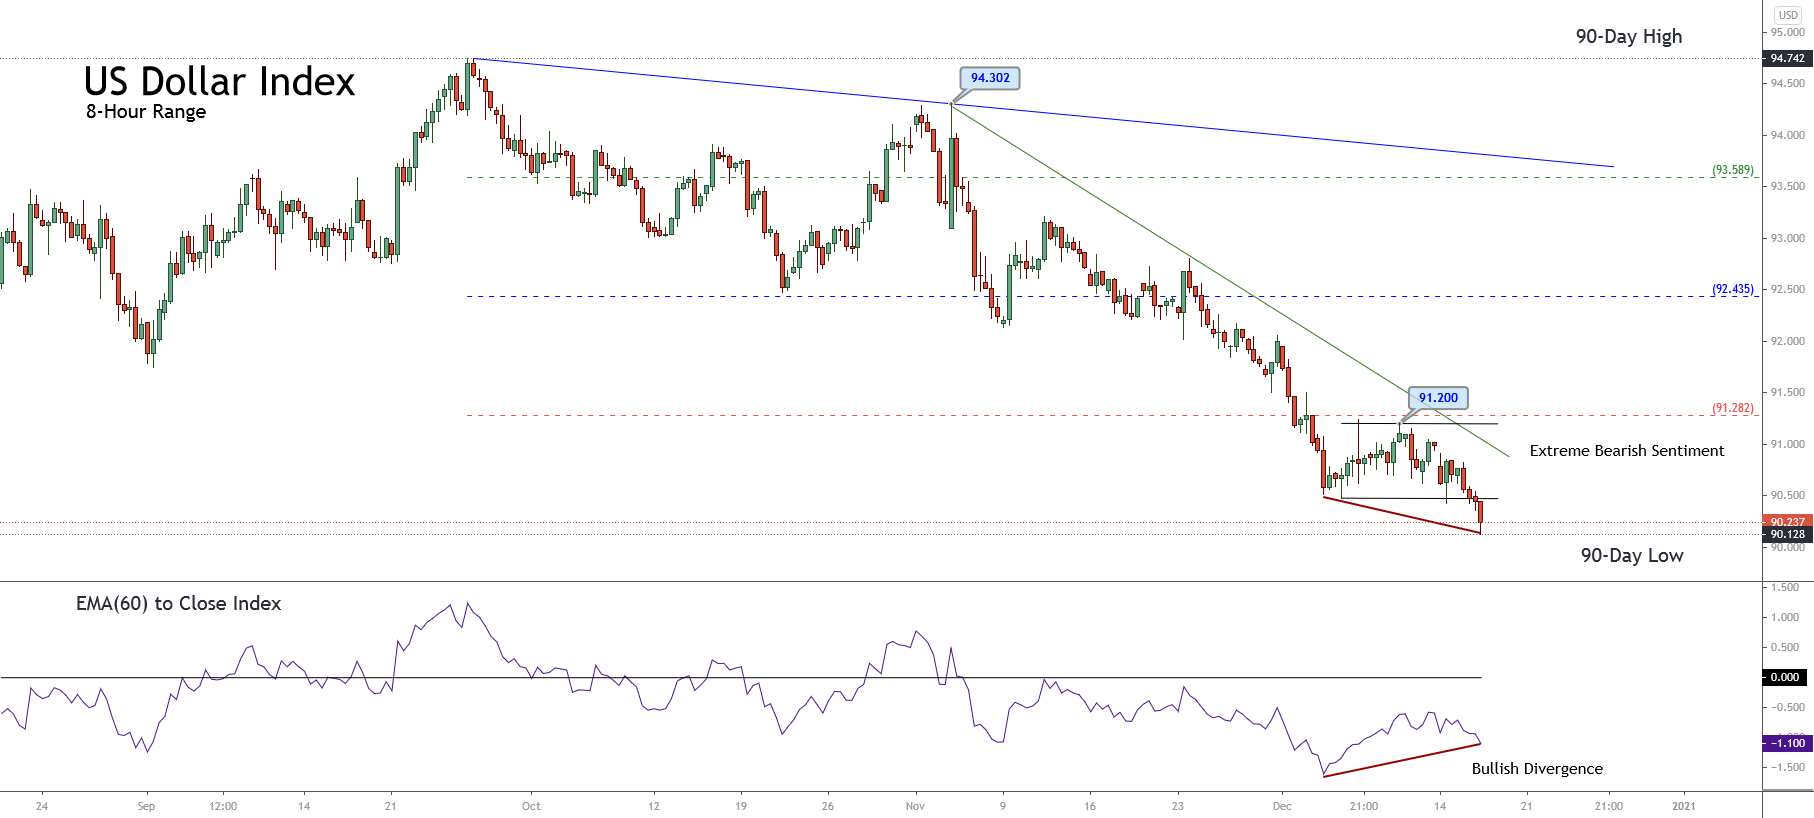
The short-term overview for the Greenback illustrated in the following 8-hour chart displays the short-term market participants’ sentiment unfolded by the 90-day high and low range, which shows the price action moving in the extreme bearish sentiment zone. Likewise, the bullish divergence observed on the EMA(60) to Close Index carries to expect a recovery for the following trading sessions.

On the other hand, the short-term primary trend outlined with its trend-line drawn in blue reveals that the bearish bias remains intact since September 25th, when the price topped at 94.742. The secondary trend plotted with the trend-line in green shows the acceleration of the downward movement that began on November 04th at 94.302.

Nevertheless, the breakdown of the last sideways range developed by DXY during the latest trading session, combined with the bullish divergence observed between the price and the EMA to Close indicator, makes us suspect a bounce, which could hit the resistance of the extreme bearish sentiment zone at 91.282.

Short-term Technical Outlook

The short-term Elliott wave view for the US Dollar Index unfolded by the next 4-hour chart exposes the bearish progression of wave ((iii)) of Minute degree labeled in black that belongs to the downward sequence that began on November 04th at 94.302. 


According to the textbook, the price action requires to confirm the third wave’s completion before acknowledging the start of the wave ((iv)) in black. In this regard, the internal structure of the wave ((iii)) added to the bullish divergence observed in the MACD oscillator; thus, suggesting the advance in wave (v) of Minuette degree identified in blue.

On the other hand, considering both the alternation principle and that the second wave of the same degree looks simple in terms of price and time, the next corrective structure should be complex in terms of price, time, or both.

In this context, the next DXY path could produce a bounce corresponding to the fourth wave of Minute degree, advancing to the supply zone between 91.014 and 91.200, and even strike the 91.580 level.

In summary, the US Dollar Index looks advancing in the fifth wave of Minuette degree that belongs to the third wave of Minute degree. In this context, the price action could experience a bounce corresponding to the fourth wave of Minute degree, which could move up to 91.850. Nevertheless, if the price surpasses the invalidation level located at 92.107, the Greenback could be showing the start of a reversal of the current bearish trend.

Categories
Forex Elliott Wave Forex Technical Analysis

US Dollar Index Under Bearish Pressure. What’s next?

The US Dollar Index (DXY) consolidates on Monday’s session in the extreme bearish sentiment zone bouncing a modest 0.06% from the last Friday 04th, from 90.476 to 90.757. However, the technical perspective is mostly bearish for the DXY basket of currencies.

Technical Overview

The following 8-hour chart shows the mid-term market participants’ sentiment unfolded in its 90-day high and low range. The figure reveals the bearish pressure that carries the Greenback in the extreme bearish zone between 90.476 and 91.543. Likewise, the intraday sideways candlestick formation suggests the likelihood of a pause and the downward continuation for the following trading sessions.

Regarding the US Dollar’s trend, the primary trend plotted in the blue line reveals the bearish bias. The secondary trend identified in green suggested the downward acceleration since November 04th when the price failed its bullish advance at 94.316. Likewise, the broader distance between the primary trend-line and the price leads to a limited correction before continuing the bearish path.

Short-term Technical Outlook

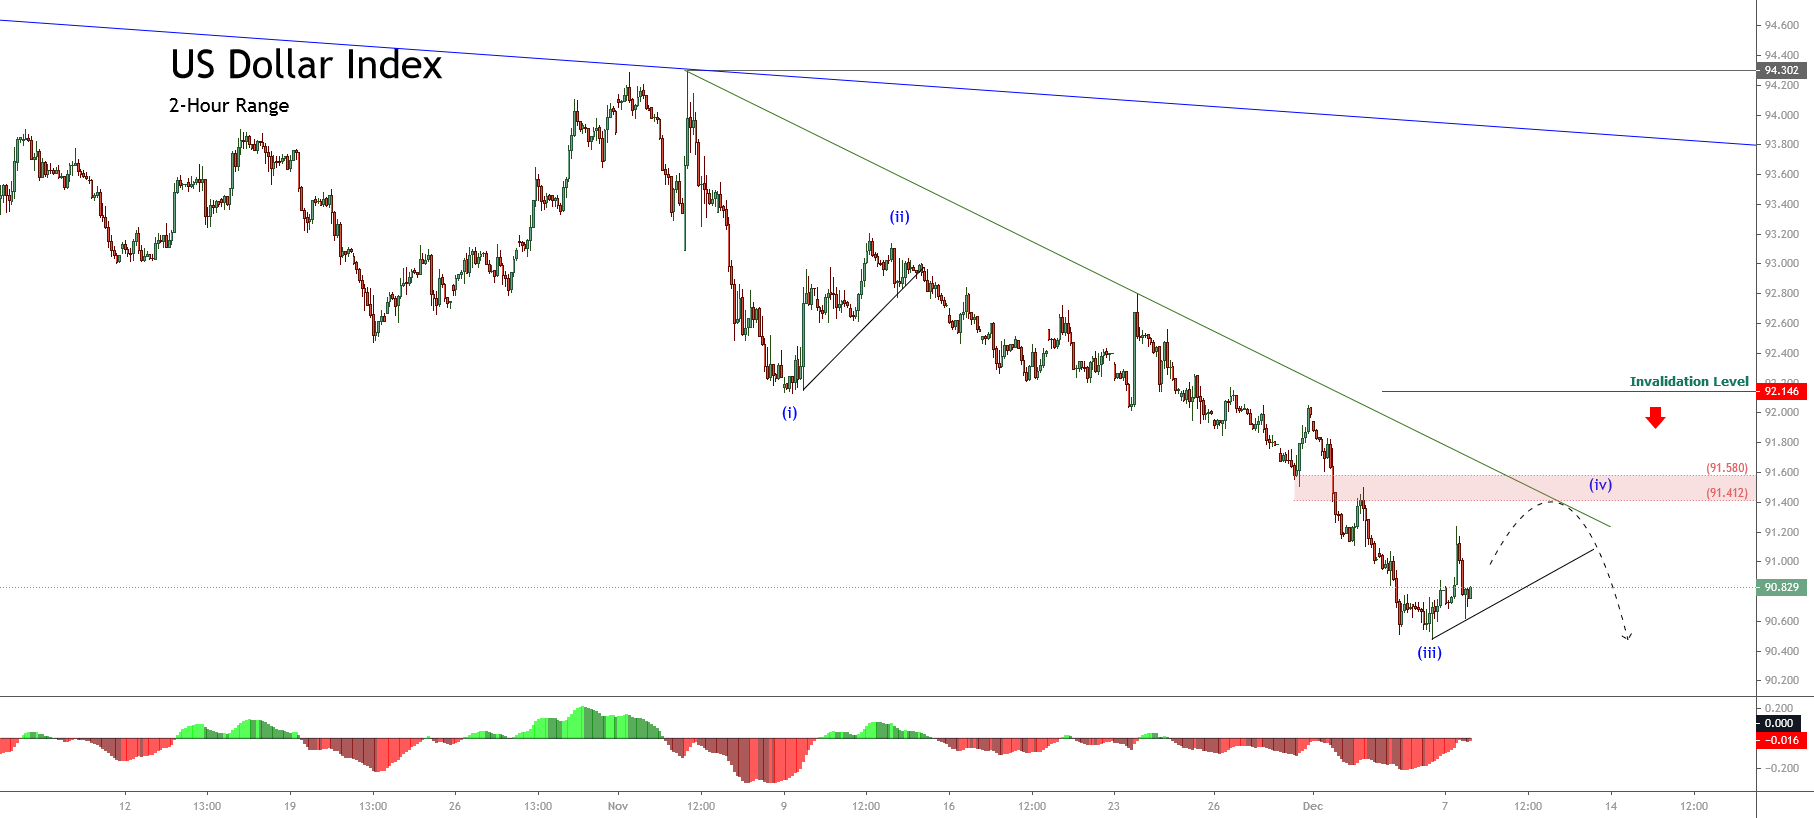
The short-term Elliott Wave perspective for the US Dollar Index exposed in the next 2-hour chart suggests the incomplete downward advance of a five-wave sequence, which could be starting to consolidate in its fourth wave of Minuette degree identified in blue.

The current bearish sequence began on November 04th when the price found fresh sellers at 90.302 and began a decline that is still present to date. The previous chart suggests the completion of the third wave of Minuette degree. This Elliott wave context is supported by the broadest distance observed in the MACD oscillator.

On the other hand, considering that the second corrective wave seems simple in terms of price and time, the alternation principle suggests that the fourth wave in progress should be complex in terms of price, time, or both. In this context, the next corrective pattern could be a triangle pattern or a combination such as a double-three or a triple-three formation.

The implication of the fourth wave’s extension could be indicative of the exhaustion of the bearish trend, and the price action should reverse soon.

Finally, if the price action rises and closes above the supply zone between 91.412 and 91.580, the US Dollar Index could reveal a possible reversion of the current bearish trend.

Categories
Forex Market Analysis

US Dollar Index – Technical Overview

The US Dollar Index (DXY) jumps on Thursday trading session after the FED’s policymakers decided to keep unchanged the rate at 0.25%

Market Sentiment Overview

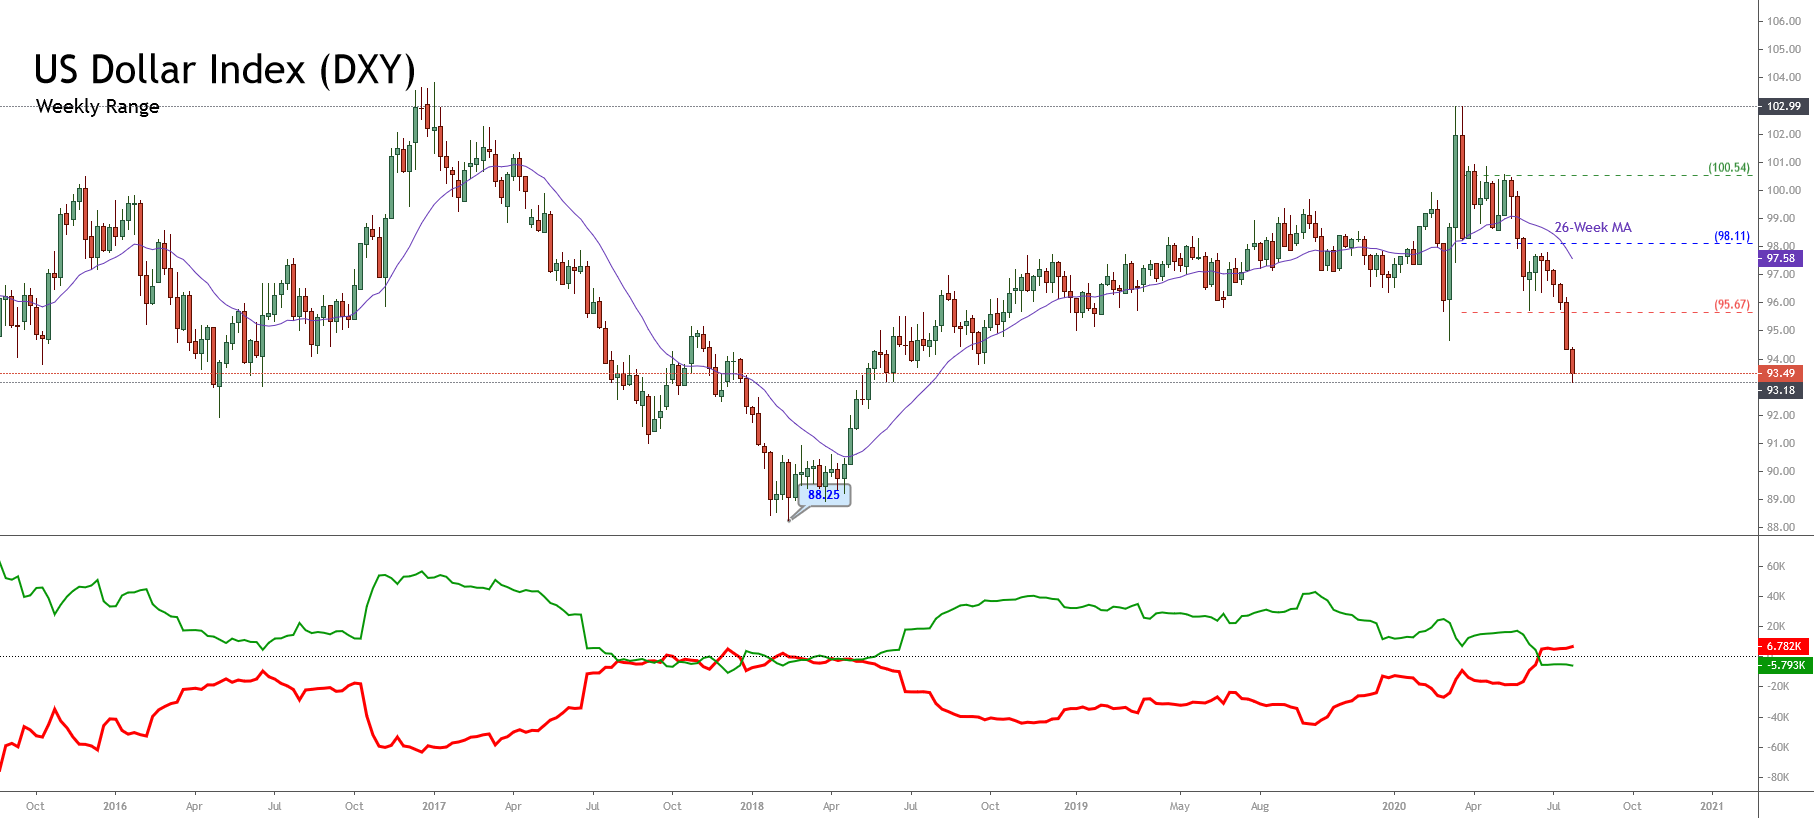
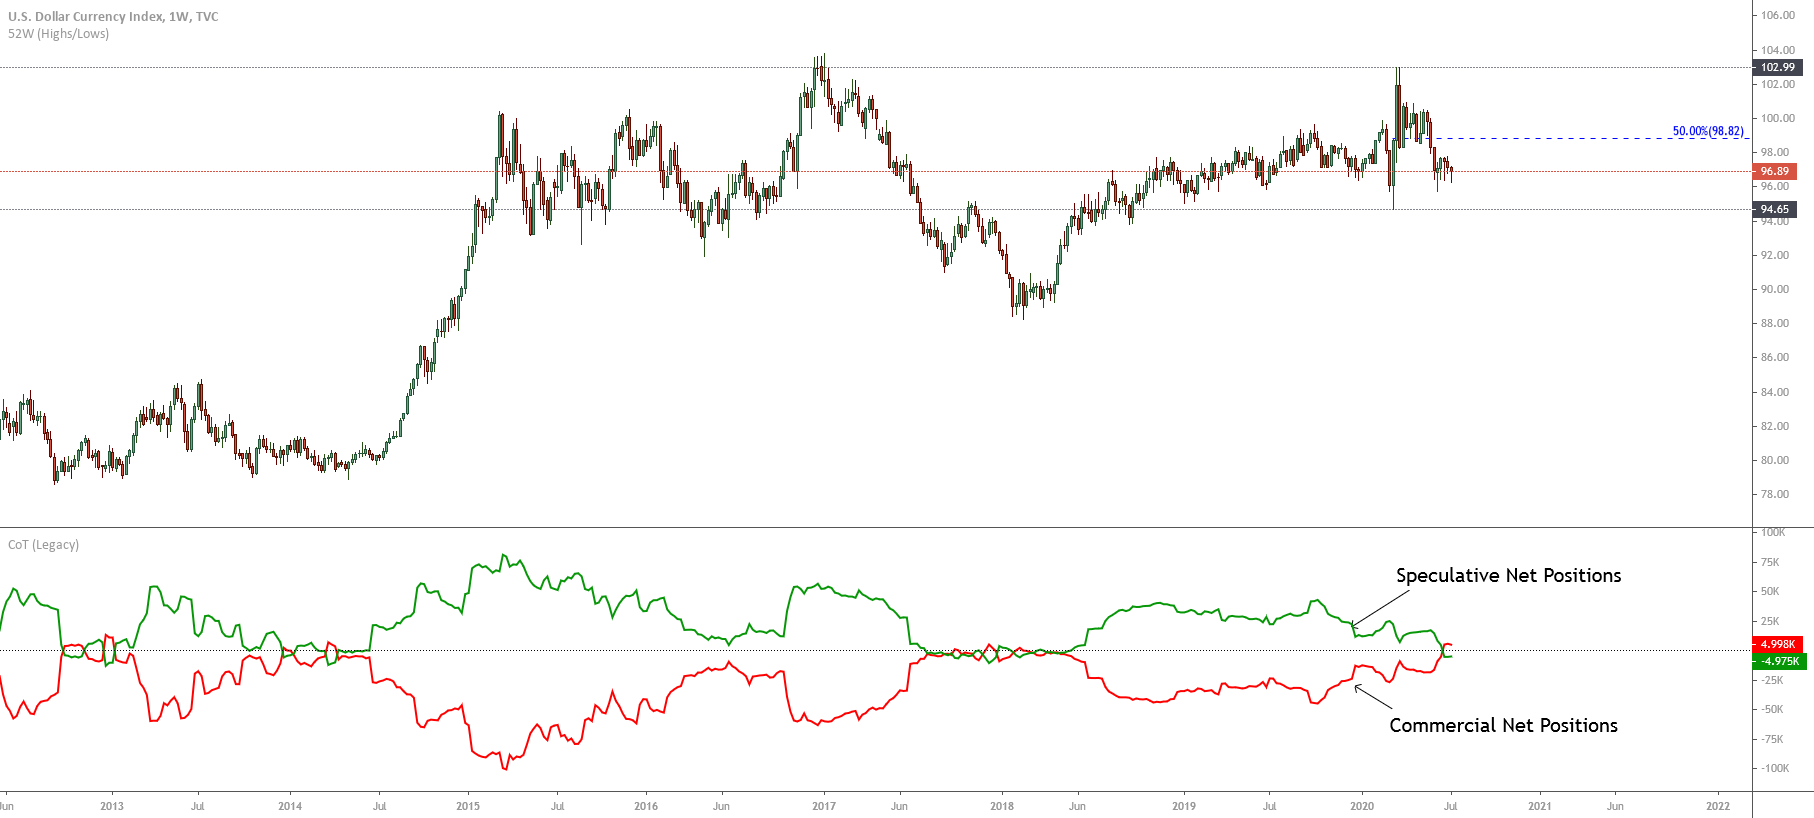
In its weekly chart, the US Dollar Index exposes a downward movement with an accelerated bearish momentum that brought it to decline for the sixth week in a row, falling to its lowest level since mid-June 2018 when the DXY found support at 93.19.


The price action observed in the 52-week high and low range places DXY in the strong bearish zone. This market context leads us to expect more declines in the long-term. Simultaneously, in the short-term, we could see a limited recovery, which could find resistance at the 95.67 zone.

From an institutional activity perspective, the net positioning informed by the COT report released by the CFTC last Friday, reveals that speculative traders (green line) continue favoring a bearish-side positioning. 

In consequence, the long-term market sentiment for the US Dollar index remains bearish. At the same time, a short-term recovery could signify only a retracement of the primary bearish trend.

Elliott Wave Outlook

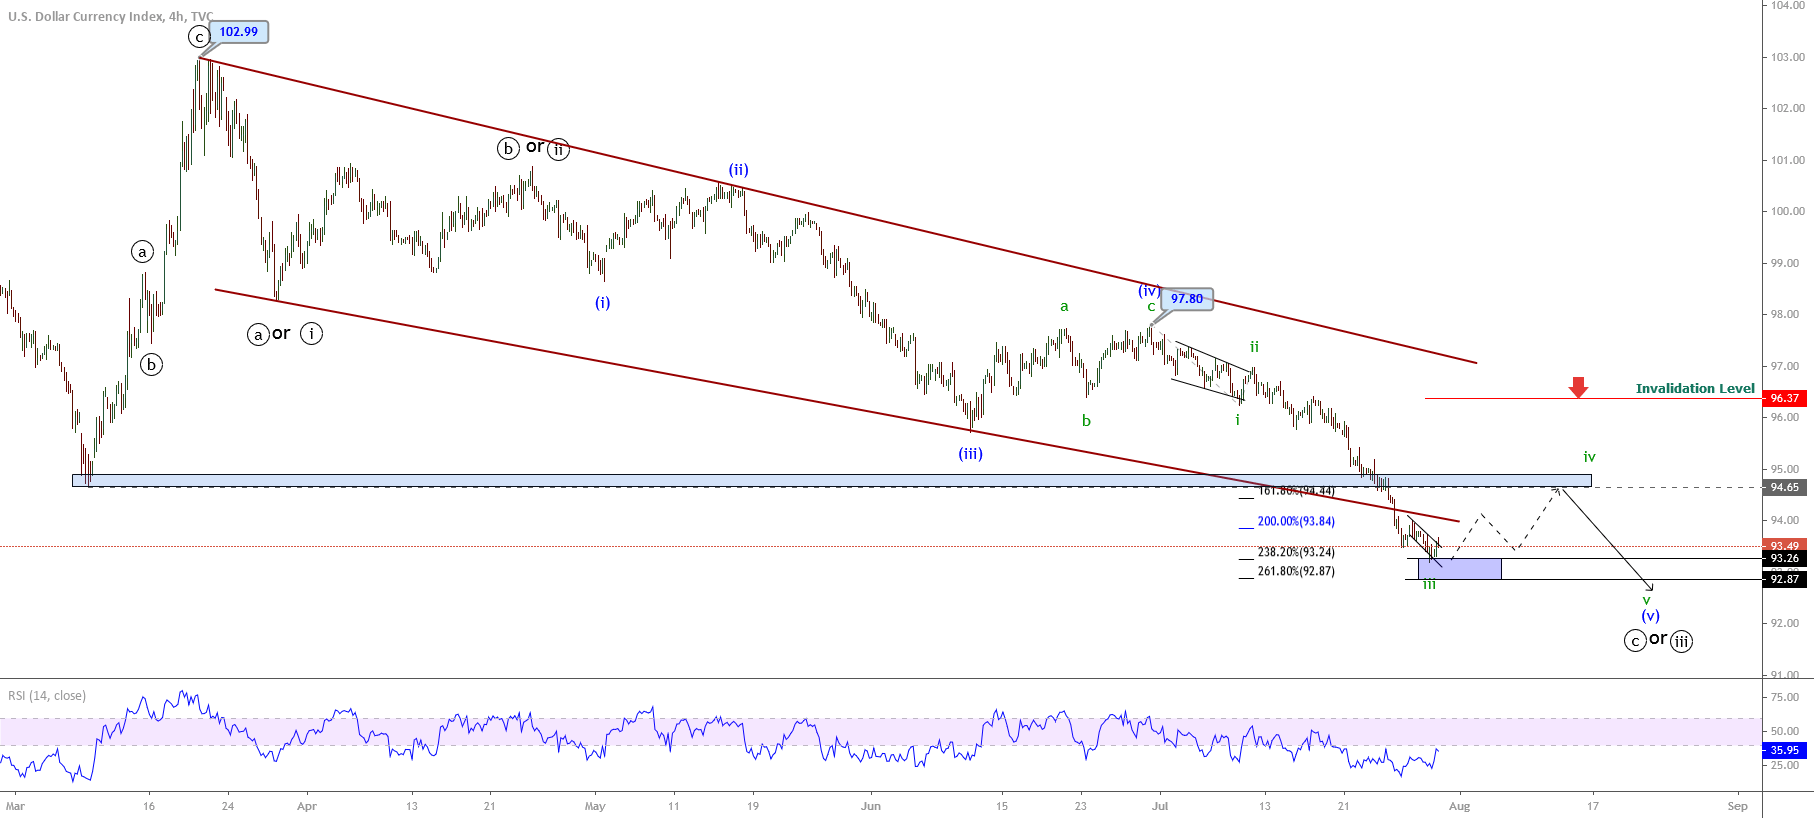
The short-term Elliott wave perspective for DXY illustrated in its 4-hour chart reveals the advance in a bearish trend that began on the last March 19th high at 102.99. Once the Greenback found fresh sellers, the bearish market participants took the price down in an incomplete descending sequence.

In the figure, we observe the US Dollar index moving in an incomplete wave ((c)) or ((iii)) of Minute degree labeled in black. At the same time, the price advances in its wave iii of Subminuette degree identified in green, this move belongs to the fifth wave of Minuette degree labeled in blue, which began on June 30th when the price made a lower high at 97.80.

Although the third wave in green touched the bearish target area located in the blue box and started to bounce, there is no evidence to support the end of the bearish cycle. Neither does the bullish divergence observed on the RSI oscillator bring us a signal of exhaustion or reversal trend. On the other hand, considering the alternation principle and that the current bearish movement has strong downward momentum, the fourth wave in green should likely evolve as a sideways sequence, possibly as a triangle pattern. This technical formation could find resistance at 94.65, corresponding to the last March 09th low. Even, the move could extend until the 95.72 level, where the price might reverse towards the primary bearish trend.

In summary, the US Dollar index currently runs in a bearish five-wave sequence, which seems incomplete. There exist a possibility that the Greenback starts to develop its fourth wave of Subminuette degree identified in green, which could find resistance in the area between 94.65 and 95.72. The current bearish scenario will be valid as long as the price stays moving below 96.37.


Categories
Forex Market Analysis

US Dollar Index Analysis – Is Preparing for a New Decline?

The US Dollar index (DXY) seems to be turning its market sentiment from bullish to bearish. The currency basket index against the US Dollar exposes bearish signals that lead us to anticipate a bearish outlook for the mid-term.

The Big Picture and Market Sentiment

The big picture of DXY in its weekly chart unveils that the price action continues moving by the sixth consecutive week below 50% of the 52-week high and low range, which carries us to suspect that big market participants could keep pushing lower the Greenback. During this year, the US Dollar index reports an advance of 0.16% (YTD),  dropping from 6.72% reached on March 19th when DXY reached its yearly high at 102.99.

In the previous chart, we distinguish the net positions between institutional traders (or speculative positions) in green, versus the net positions of commercial traders in red. The net positioning reveals that speculative traders are turning their bias to the bearish side; however, this doesn’t imply that DXY will plunge in the short-term.

Elliott Wave Outlook

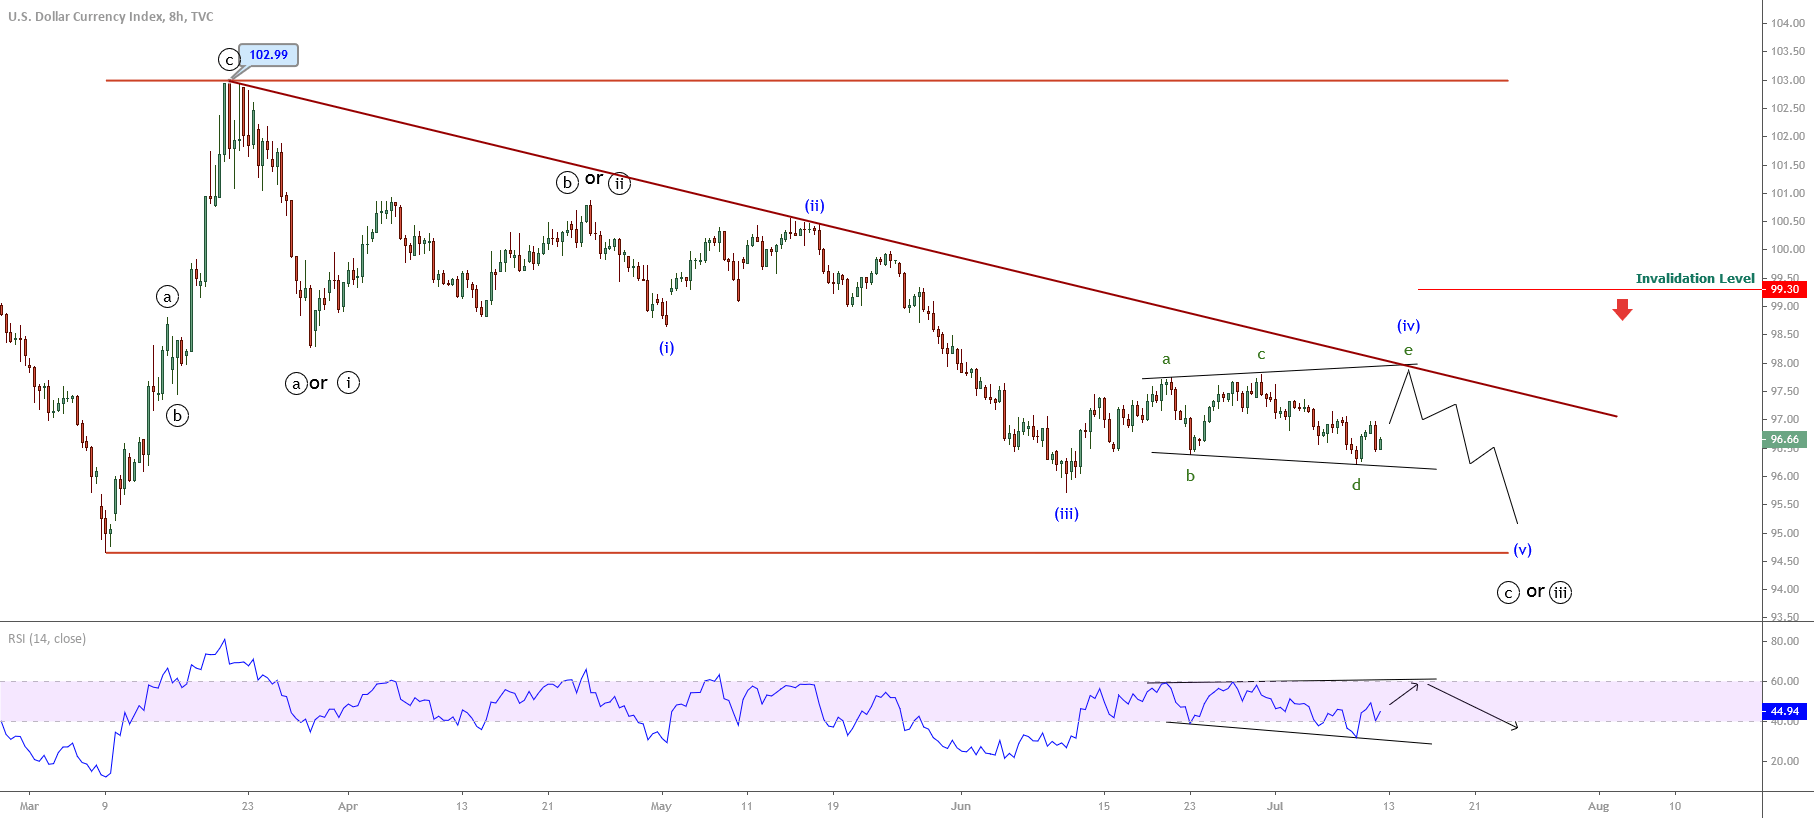
The mid-term Elliott wave perspective for the US Dollar Index exposed in its 8-hour chart illustrates an incomplete bearish cycle that began on March 19th once the index found fresh sellers at 102.99.

In the above chart, we observe the first bearish movement identified as wave ((a)) or ((i)) of Minor degree labeled in black reveals a strong bearish momentum, which leads us to suspect that it could correspond to the first movement of a zigzag pattern or an impulsive sequence.

Once DXY had completed its first downward movement, it started a corrective sequence that at a first stage looked like a triangle formation (subdivided into 3-3-3-3-3 internal segments); however, the corrective structure corresponds to a regular flat pattern (divided into 3-3-5). This correction ended on April 24th when the price topped at 100.87 pts and give way to a new downward move corresponding to wave ((c)) or ((iii)), which remains in progress.

The third bearish structural series, which remains in progress, reveals that the price action currently develops an expanding triangle pattern. This formation follows an internal sequence subdivided into 3-3-3-3-3.

On the other hand, in the last chart, we observe the RSI oscillator moving below the 60-level, which confirms the bearish bias that the US Dollar index maintains and, in consequence, doesn’t exists any trend reversal signal so far.

Our outlook for the coming weeks for the US Dollar index foresees a limited upward movement, which could surpass the end of wave c slightly, labeled in green, at 97.80. The end of the wave e could coincide with the descending trendline. Considering the expanding triangle nature, we could expect a volatile movement in the current upside, which could imply the development of a bullish trap. Once completed this upside, the Greenback should resume its downtrend falling into a five-wave sequence.

Categories
Forex Elliott Wave Forex Market Analysis

Dollar Index Long Term Wave Analysis

The US Dollar Index (DXY) from last October shows signs of exhaustion of the bullish cycle that started in February 2016. What says us the Elliott Wave Principle about the next path of the US Dollar? In this article, we will discuss what to expect for the Greenback.

Fundamental Perspective

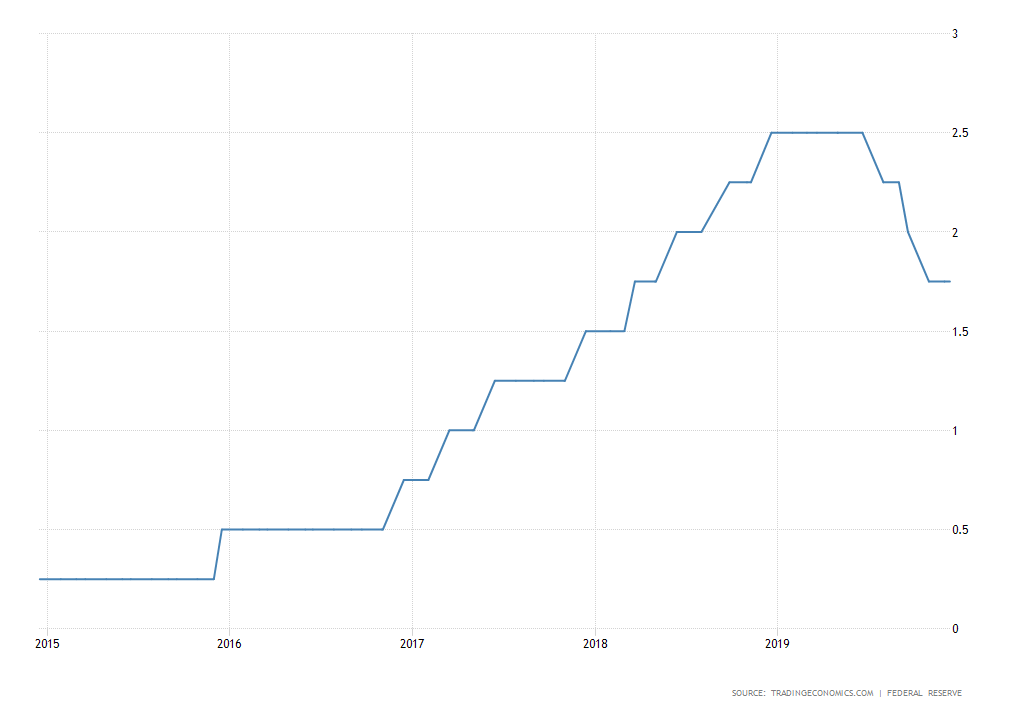
The Federal Reserve, during the last FOMC meeting, realized on December 11, decided to keep the interest rate at 1.75% by letting it unchanged for the second consecutive month.

The FED’s Chairman Jerome Powell, in his latest statement, indicated that the current monetary policy is adequate to sustain the expansion of economic activity in the United States. On the other hand, the labor market conditions remain stronger, and inflation continues in the 2% target.

In its projections for next year, the committee members do not visualize any further cut changes in the reference rate.

Technical Perspective

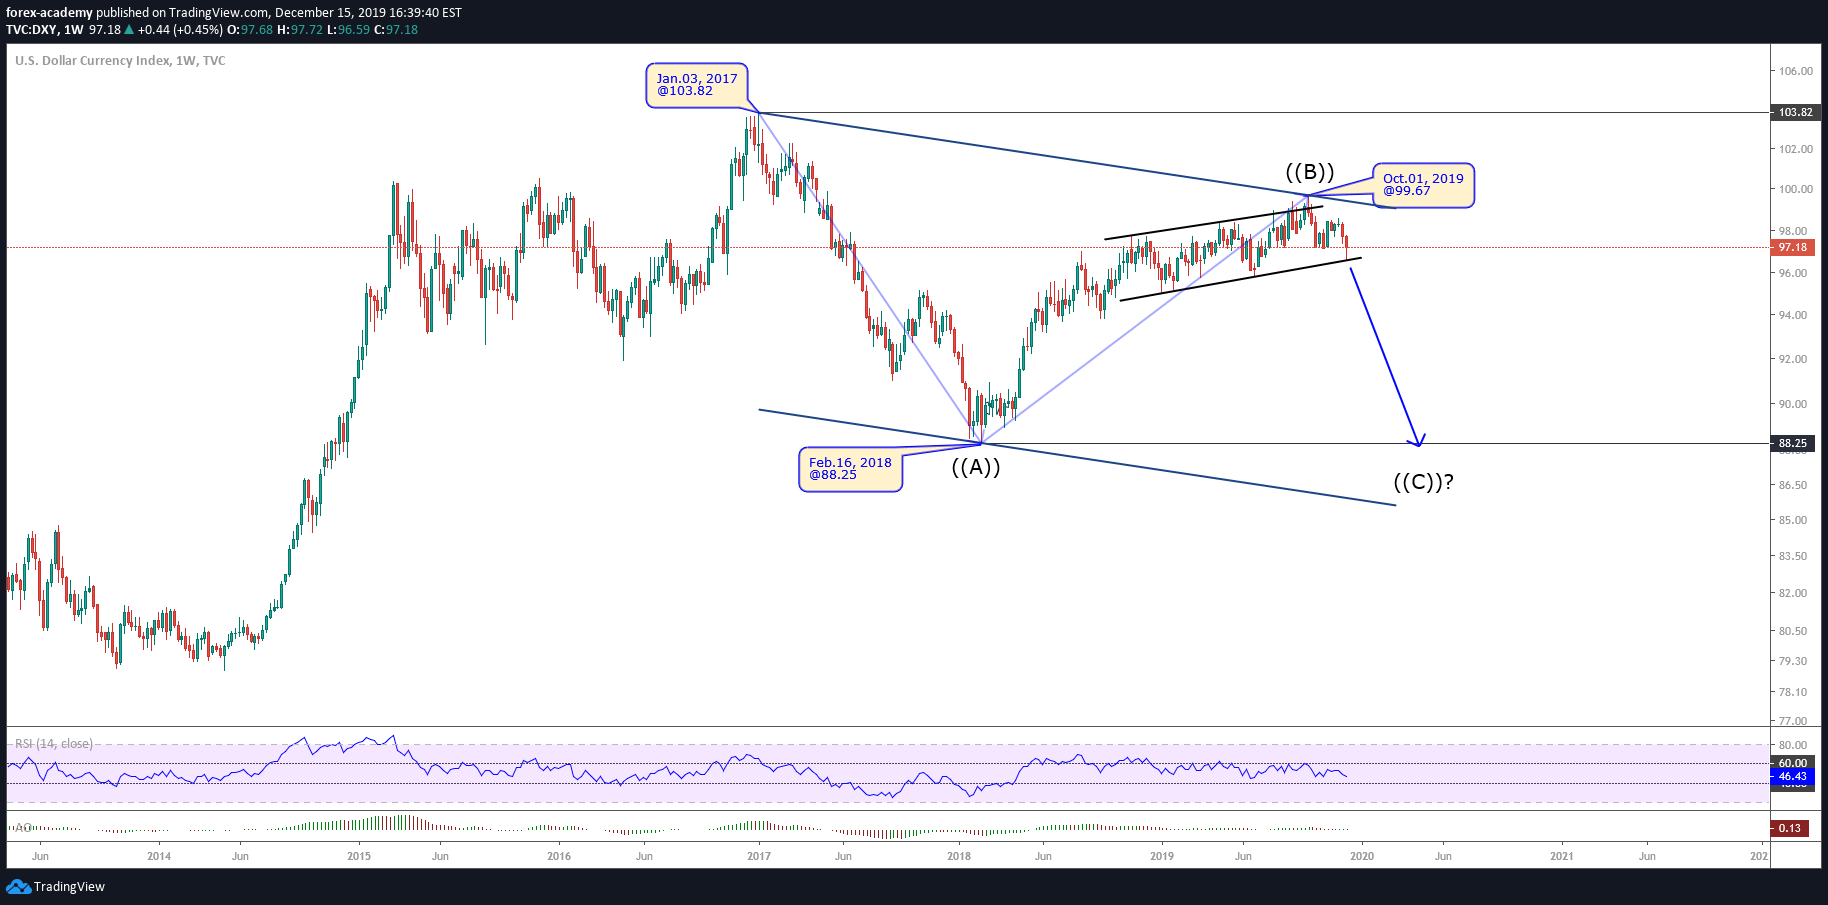
Dollar Index (DXY), in its weekly chart, shows the price action developing a downward corrective structure. This bearish structure began on January 03, 2017, when the DXY reached the level 103.82.

Until now, DXY has carried out two internal waves, which we identified as wave ((A)), and ((B)) labeled in black. In the weekly DXY chart, we observe that wave ((A)) progressed in five waves.

According to the Elliott Wave Principle, the formation developed by DXY should correspond to a corrective structure that presents the characteristics of a zigzag pattern. A zigzag formation is characterized by a 5-3-5 internal sequence.

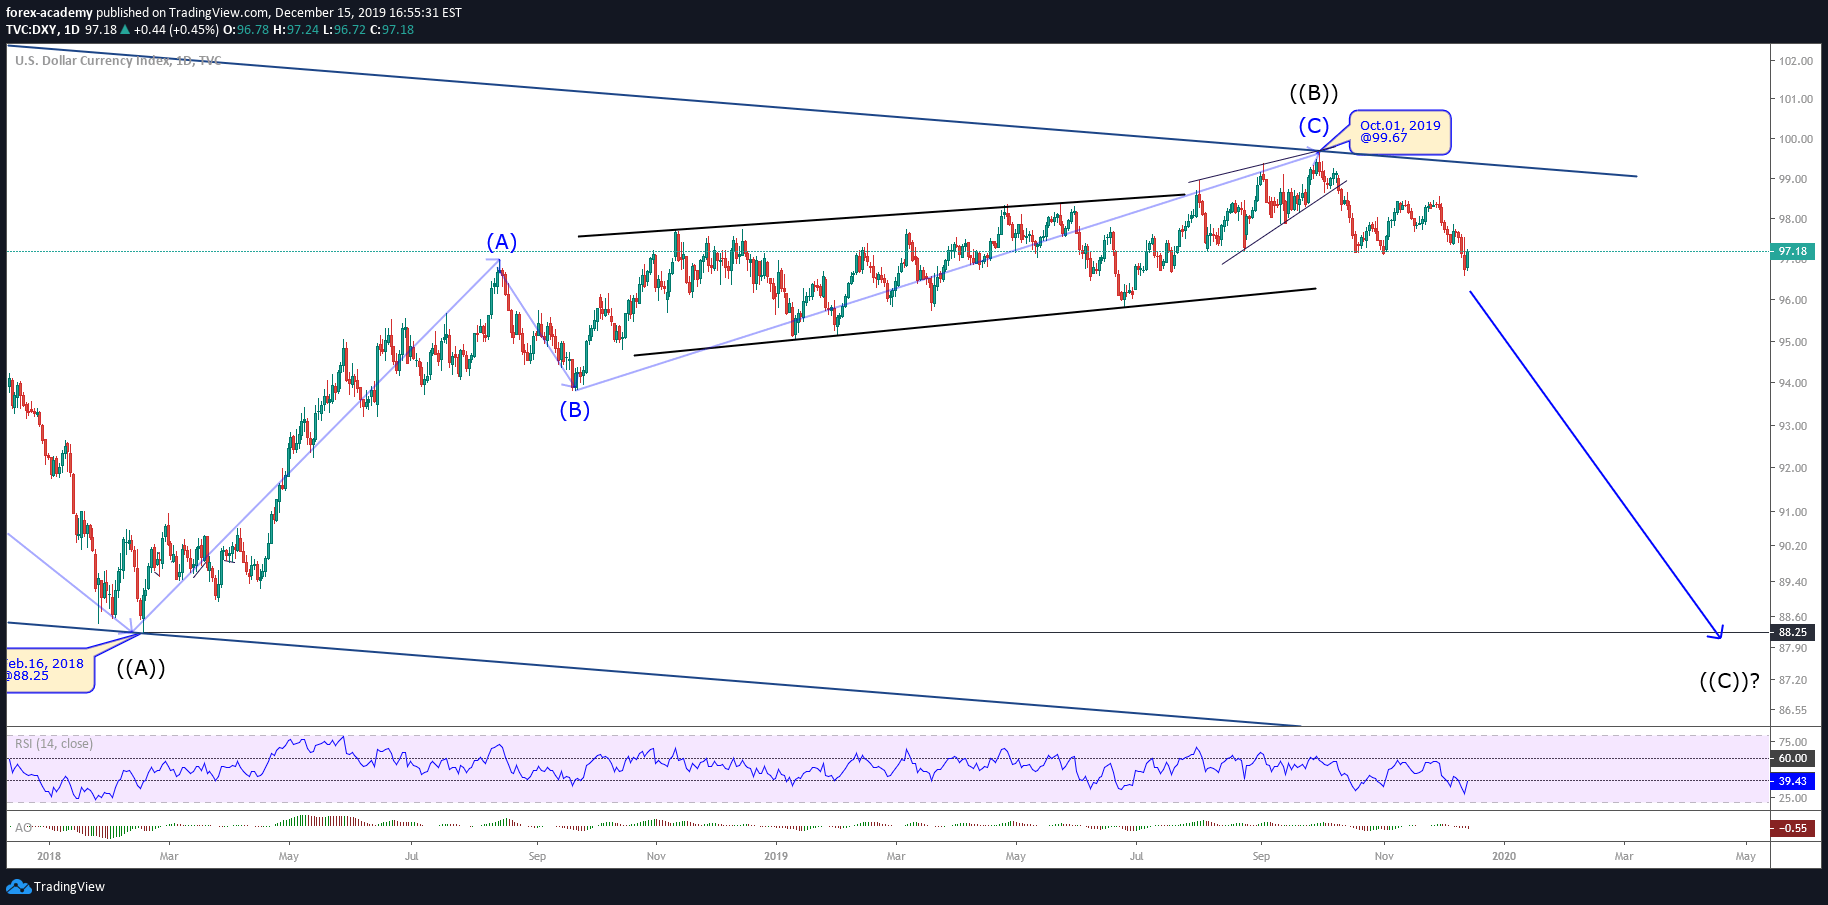
The graph below shows the daily DXY chart, which reveals a bullish sequence that develops into three internal waves, labeled in blue as (A), (B), and (C), which corresponds to the complete movement of upper-degree, identified as wave ((B)).

Likewise, we recognize how the price developed a structure in the form of an ending diagonal, that in terms of the Elliott Wave Theory, appears typically in waves “5” or “C.”

On the other hand, the pierce and closing below the August 2019 low at 97.17, make us suspect that the price could be making a change from the upward cycle started in February 2018 to a downward trend.

This movement could start the third internal move of the corrective wave, which should be developed in five waves.

Our Forecast

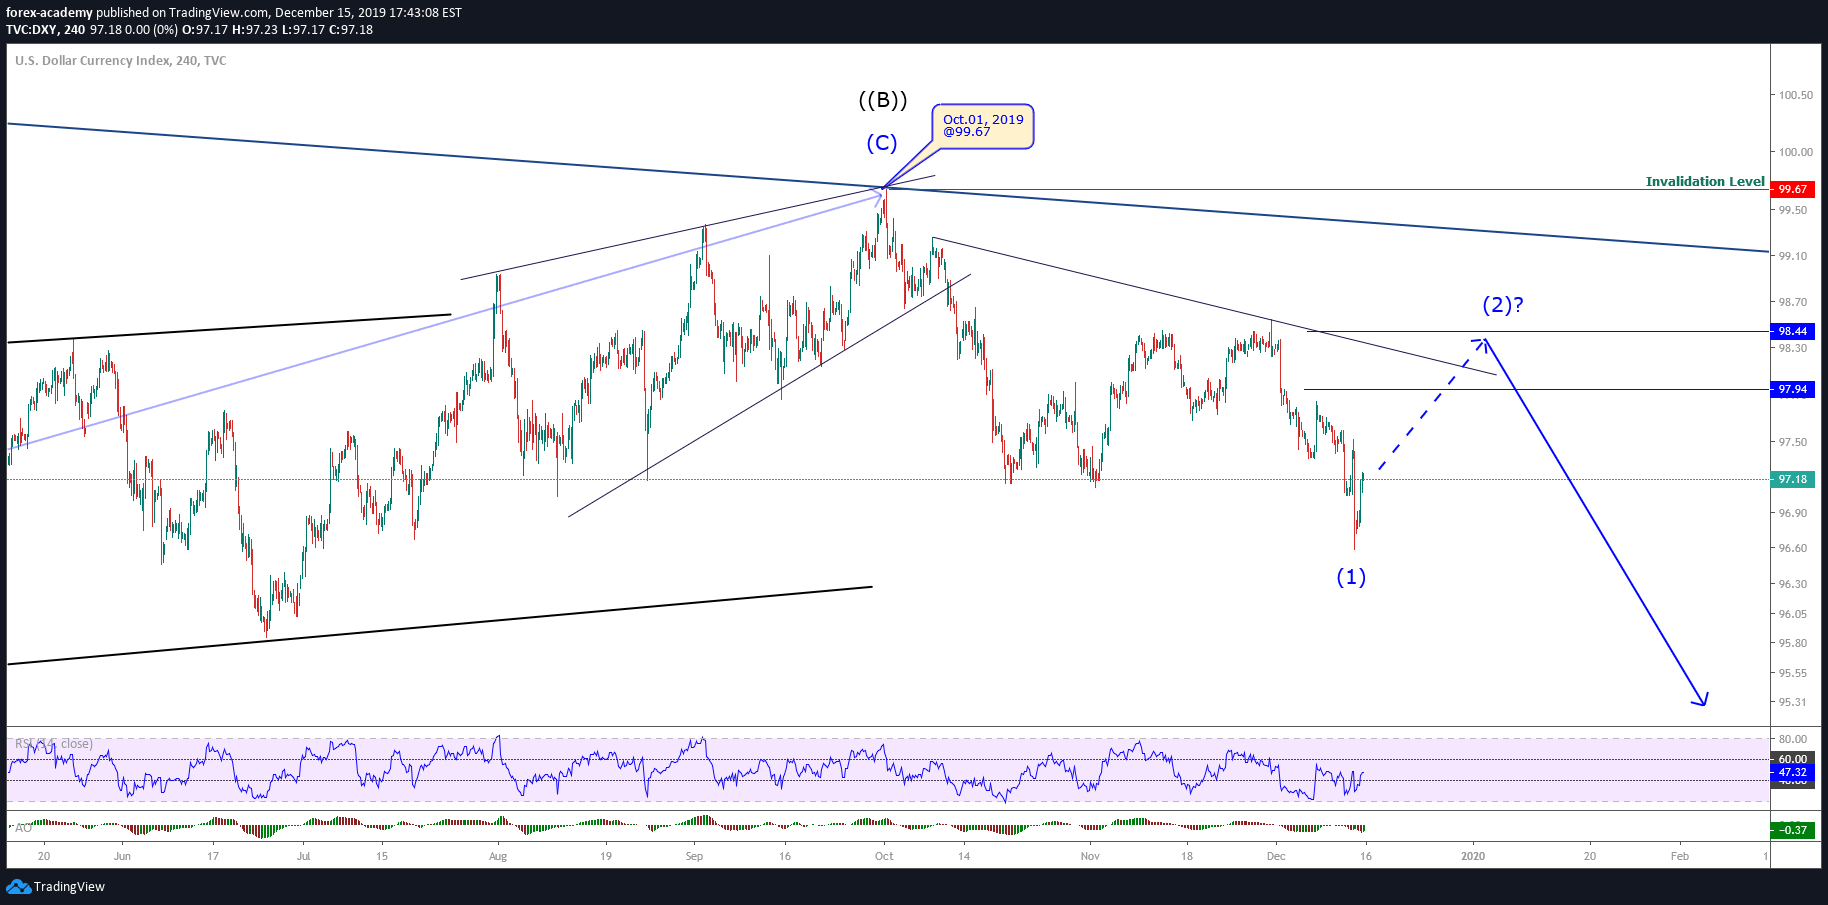
The 4-hour chart shows DXY has completed its first bearish motive wave labeled as (1) in blue. Once its five internal segments has ended, the price bounded off from the level of 96.59 on December 12.

Short term, we expect a bullish rebound in three waves that could reach the zone between 97.94 and 98.44. From this zone, the Greenback could find sellers waiting to activate their short positions.

The long-term target is located in the zone of the 90 points as a psychological round-number level. Further, this zone is the area of the 2018’s lows. This target area coincides with the lower line of the downward channel.

The invalidation level of the bearish scenario is located at level 99.67, which corresponds to the highest level reached in early October 2019.

Categories
Forex Market Analysis

NZD/USD long – attractive risk-reward ratio potential.

NZD/USD


The bigger picture on NZD/USD is very clear from the Elliott wave perspective. We see nice unfold of 5 waves down, starting from February 2018. The final move could be labelled as an ending diagonal pattern, which showing us a squeezing of the price action, and bear forces weakening, which should be followed by the strong sharp move up or pullback in at least 3 legs up, usually a zig-zag A-B-C pattern. Also, this trade could give us a very attractive risk-reward ratio potential.


DXY


As you can see on the chart, currently we are tracking the A-B-C zig-zag pullback pattern. We have two option, depending on how patient we are. The first one is to buy here with the target above the previous high 95.75 or to wait for this b wave of the A-B-C pattern to be finished in the 50-61% Fibo retracement area, and then to sell DXY with higher profit potential.


USD/CAD


As we expected the pair retraced and currently testing the previous resistance, now support level, which stands around 50% Fibonacci retracement. This is our sweet spot to start buying and building gradually our long position. Sooner or later we will see some sharp moves higher above the previous higher high 1,3226. because this leg should be labeled as a wave 3, which is usually the longest and the strongest.


AUD/USD


The bigger picture on Aussie is clear, the current price action is labelled as a wave 5, the final Elliott wave. On a smaller picture, the situation is a bit tricky, since we do not have yet any confirmation of when and where the pullback will start. So, for now, we should stay in a wait and see mode. We know for sure that the wave 5 must overcome the wave 4, so on a bigger picture we do expect Aussie weakening, but current market does not give us yet the good risk-reward trading opportunity.

Categories
Forex Market Analysis

What to Expect to the Dollar Index during the Second Half of the Year?

What to Expect to the Dollar Index <DXY> during the Second Half of the Year?

Dollar Index

The Dollar Index <DXY> has developed an upward impulsive movement during the first half of the year. The bullish cycle began on February 16th when it touched the lowest level of the year at 88.25. From this level, it started the first bullish impulse that took it up to 90.93, where it began a consolidation structure that finished in April; a period in which DXY climbed as a wave 3 from 89.23 to 95.03. Finally, after a retracement as a wave 4, the greenback soared to 95.53, exceeding the highest level attained in November 2017 when the price reached 95.15 and completing a major grade cycle.

The fact that DXY has surpassed last November 2017’s peak makes us think the Dollar Index might make new highs in the long term. During the second half of 2018, we expect the US Dollar to make a corrective movement as an A-B-C pattern that should carry it to seek support at the 93.27 level in the first instance. Then, after a corrective upward sequence to 94, we could see it fall as a C pattern to the area between 91.64 and 91.03, from where a new upward cycle could begin.


Categories
Forex Market Analysis

Dollar Index reaches its highest level since December 2017.

Hot Topics:

  • Dollar Index reaches its highest level since December 2017.
  • Indices return to the bullish path
  • EURAUD advances as forecasted.

Dollar Index reaches its highest level since December 2017.

The dollar index rose to 92.74 after the employment data from the United States, its highest level since December 2017. The unemployment rate fell in April to 3.9% from the 4.1% achieved in March, the lowest rate for more than 17 years. Technically, the greenback reached 92.74 and began to draw back forming a potential bearish 2B pattern.

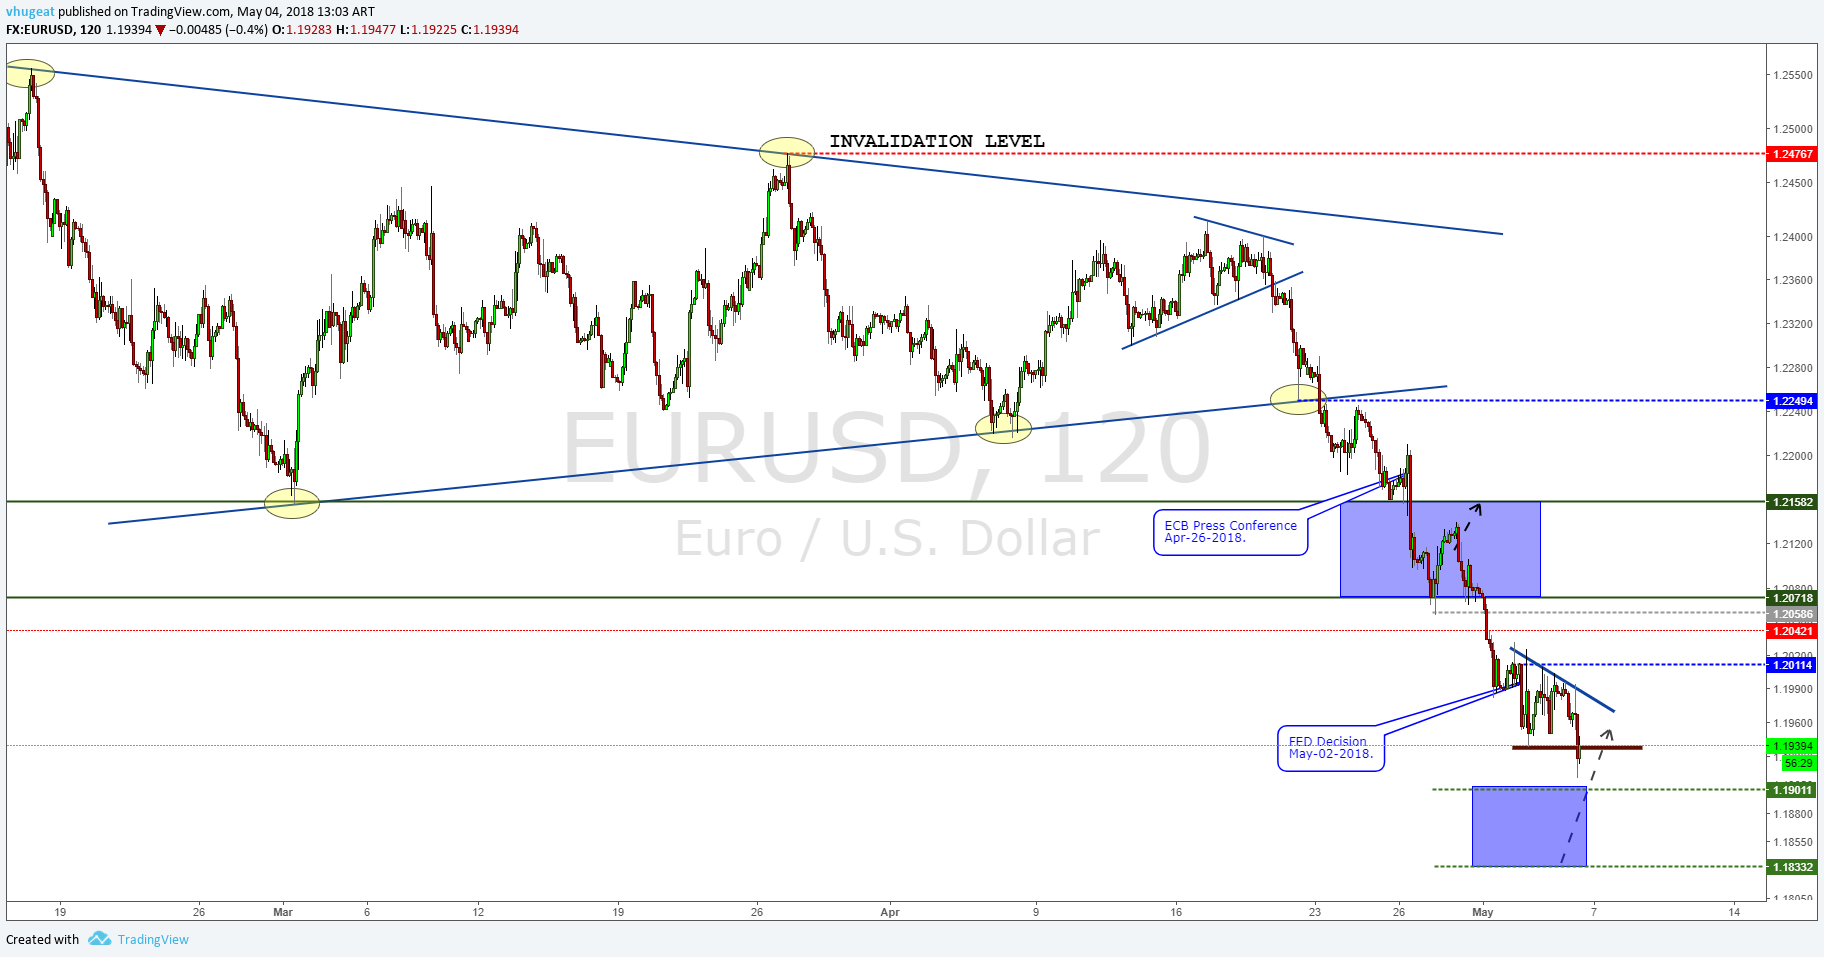
The single currency reached the potential reversal zone, testing the support level at 1.19 from where it began to bounce. From this area, we will be monitoring long positions in the EURUSD.

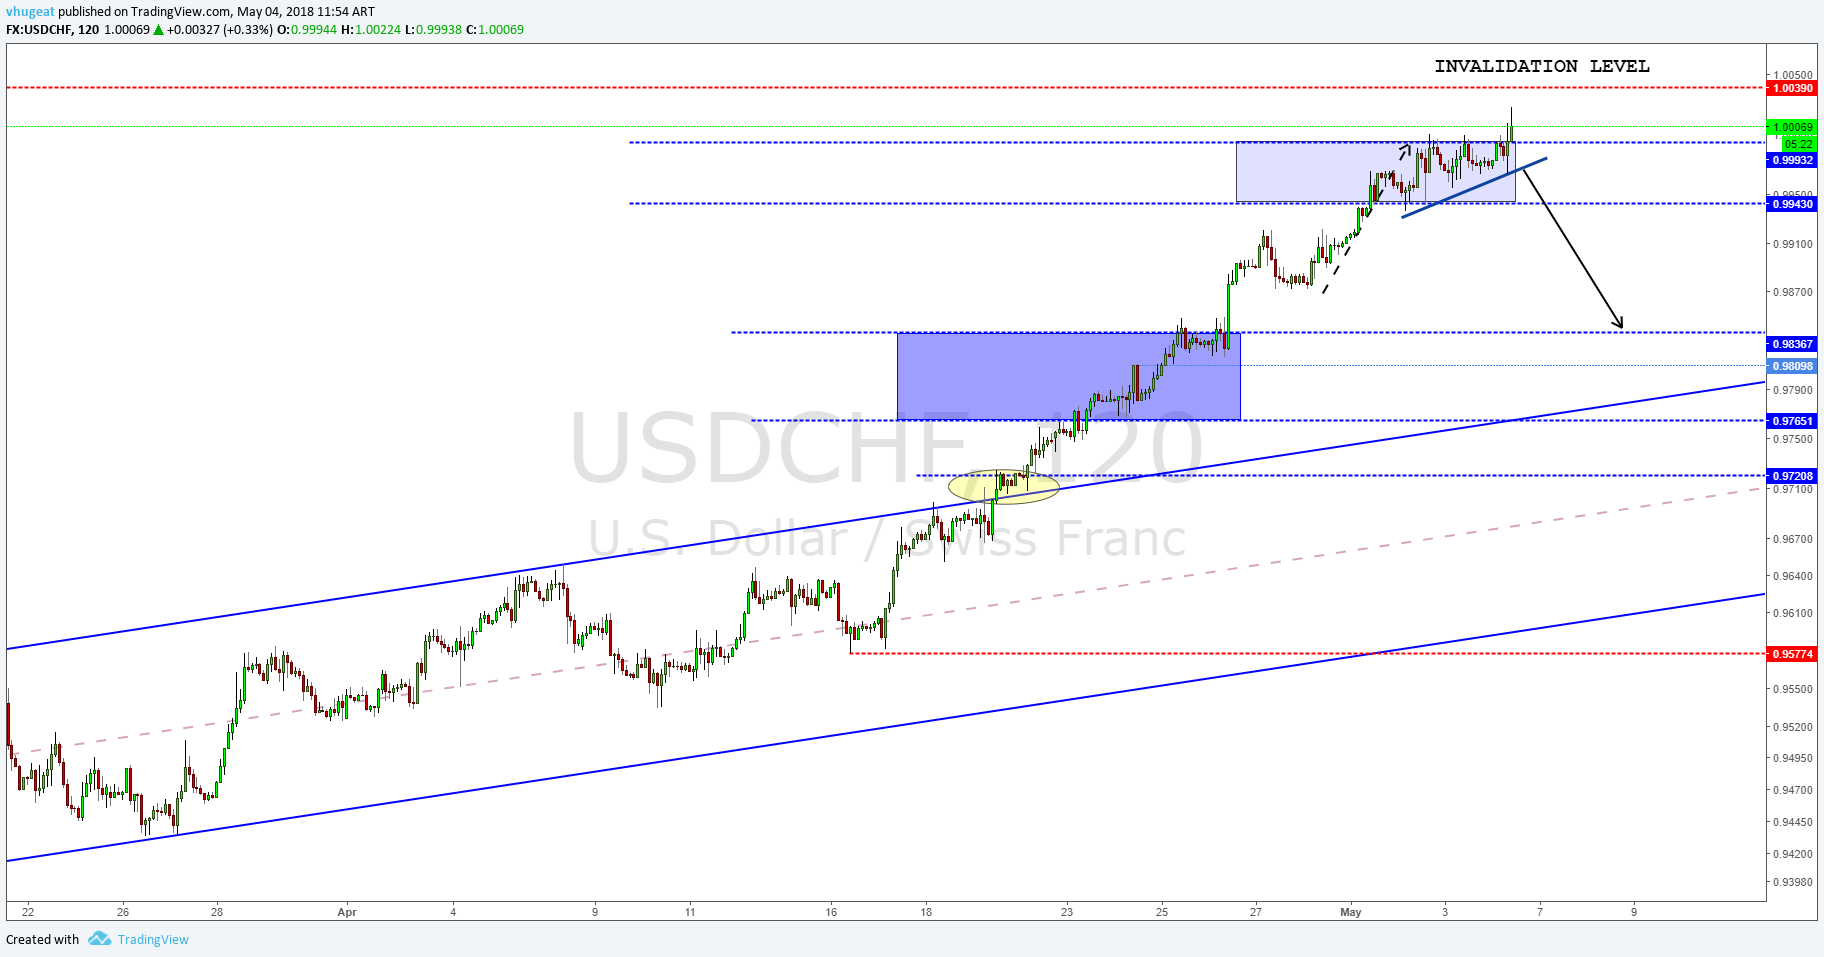
The USDCHF made the same move as the dollar index, climbing to a new higher high, but it still did not touch the level of invalidation we have forecast in previous updates (above 1.0370). Short positions will be valued below the 0.9973 level, the invalidation level for short positions remains intact.

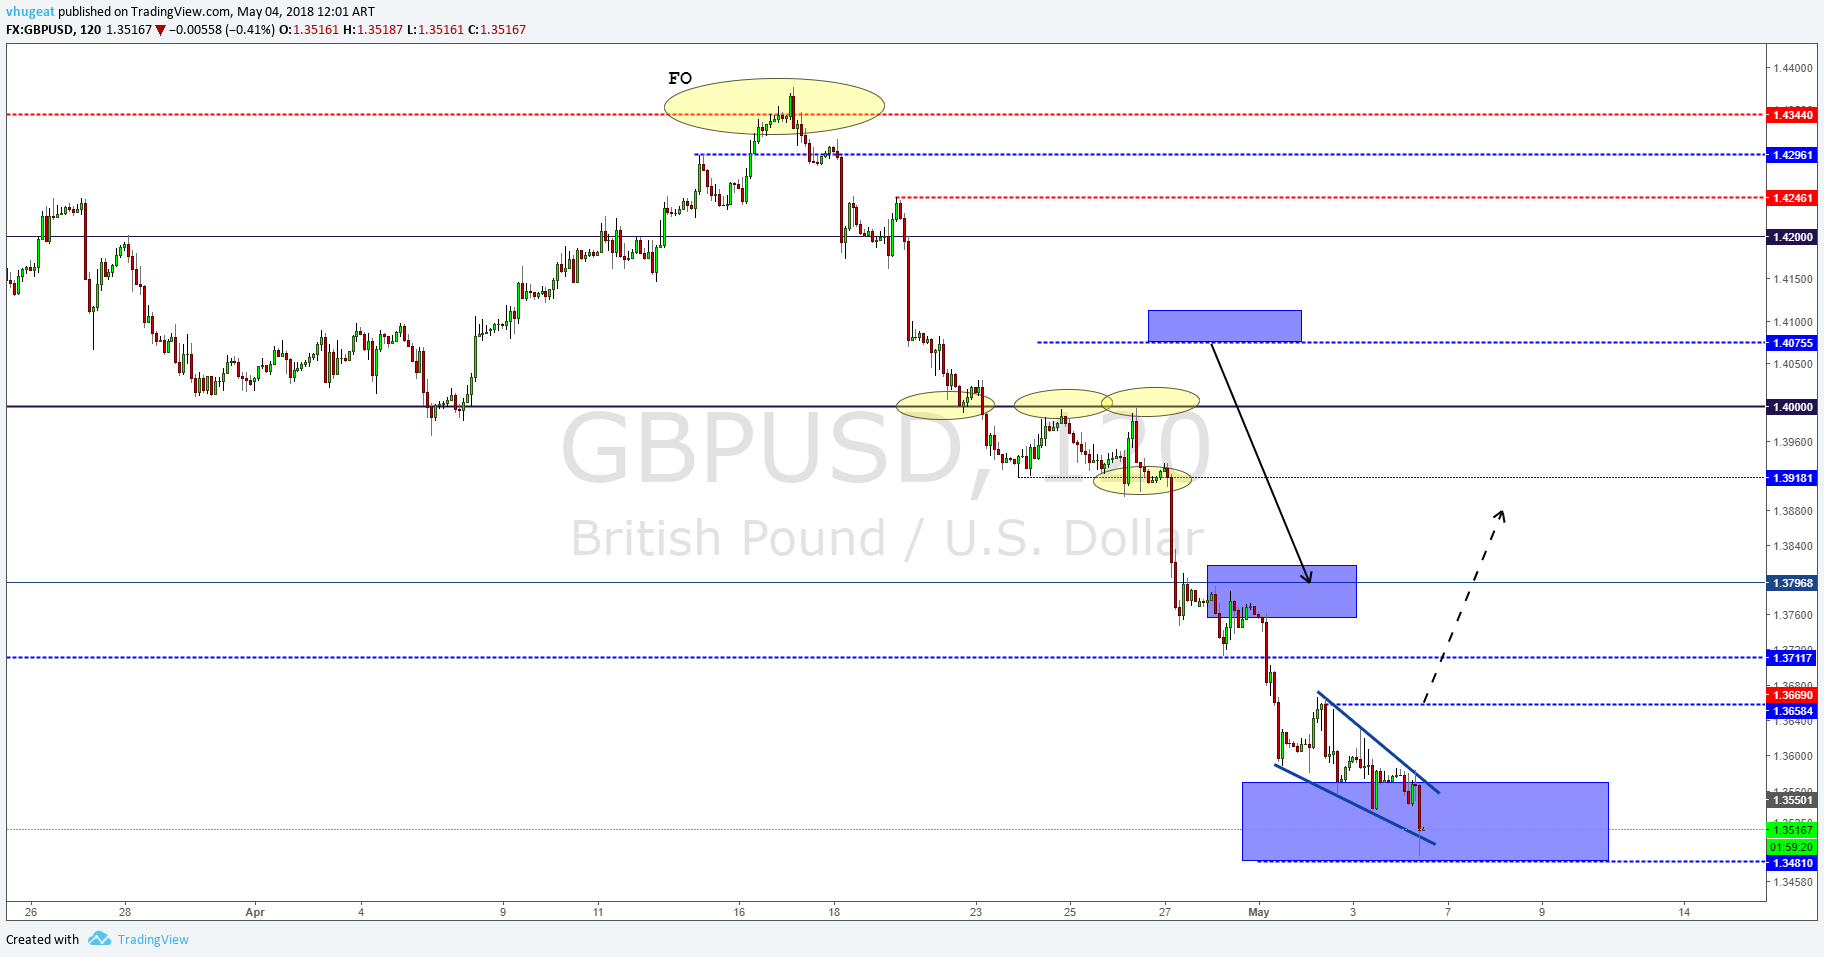
The cable, as in the case of the EURUSD pair, made a new low at 1.3488 developing a potential ending diagonal pattern. Once the breakout occurs it will be validated; we could begin to place long positions. In the meantime, we will remain alert to the movements that it carries out.

Indices return to the bullish path

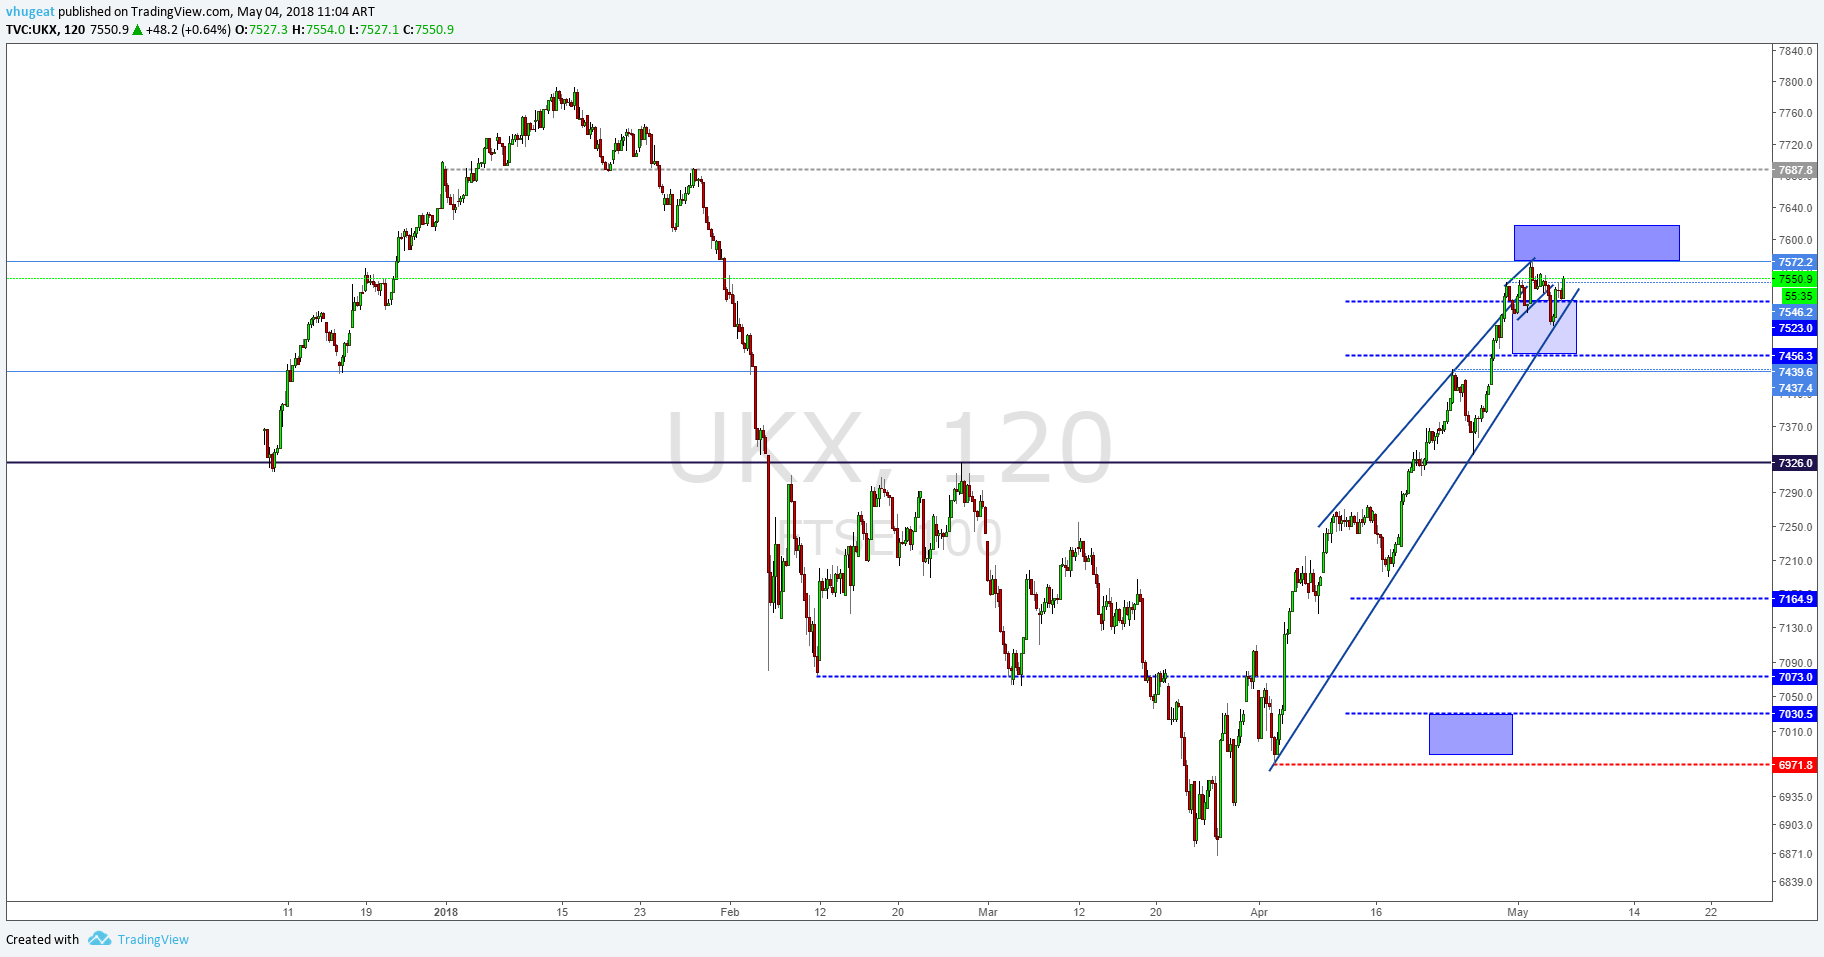
The FTSE short position proposed yesterday has been invalidated when its price has been rejected at the lower edge of the rising wedge, drawing a bullish movement. For now, the index is in our potential reversal zone so we will maintain our neutral position.

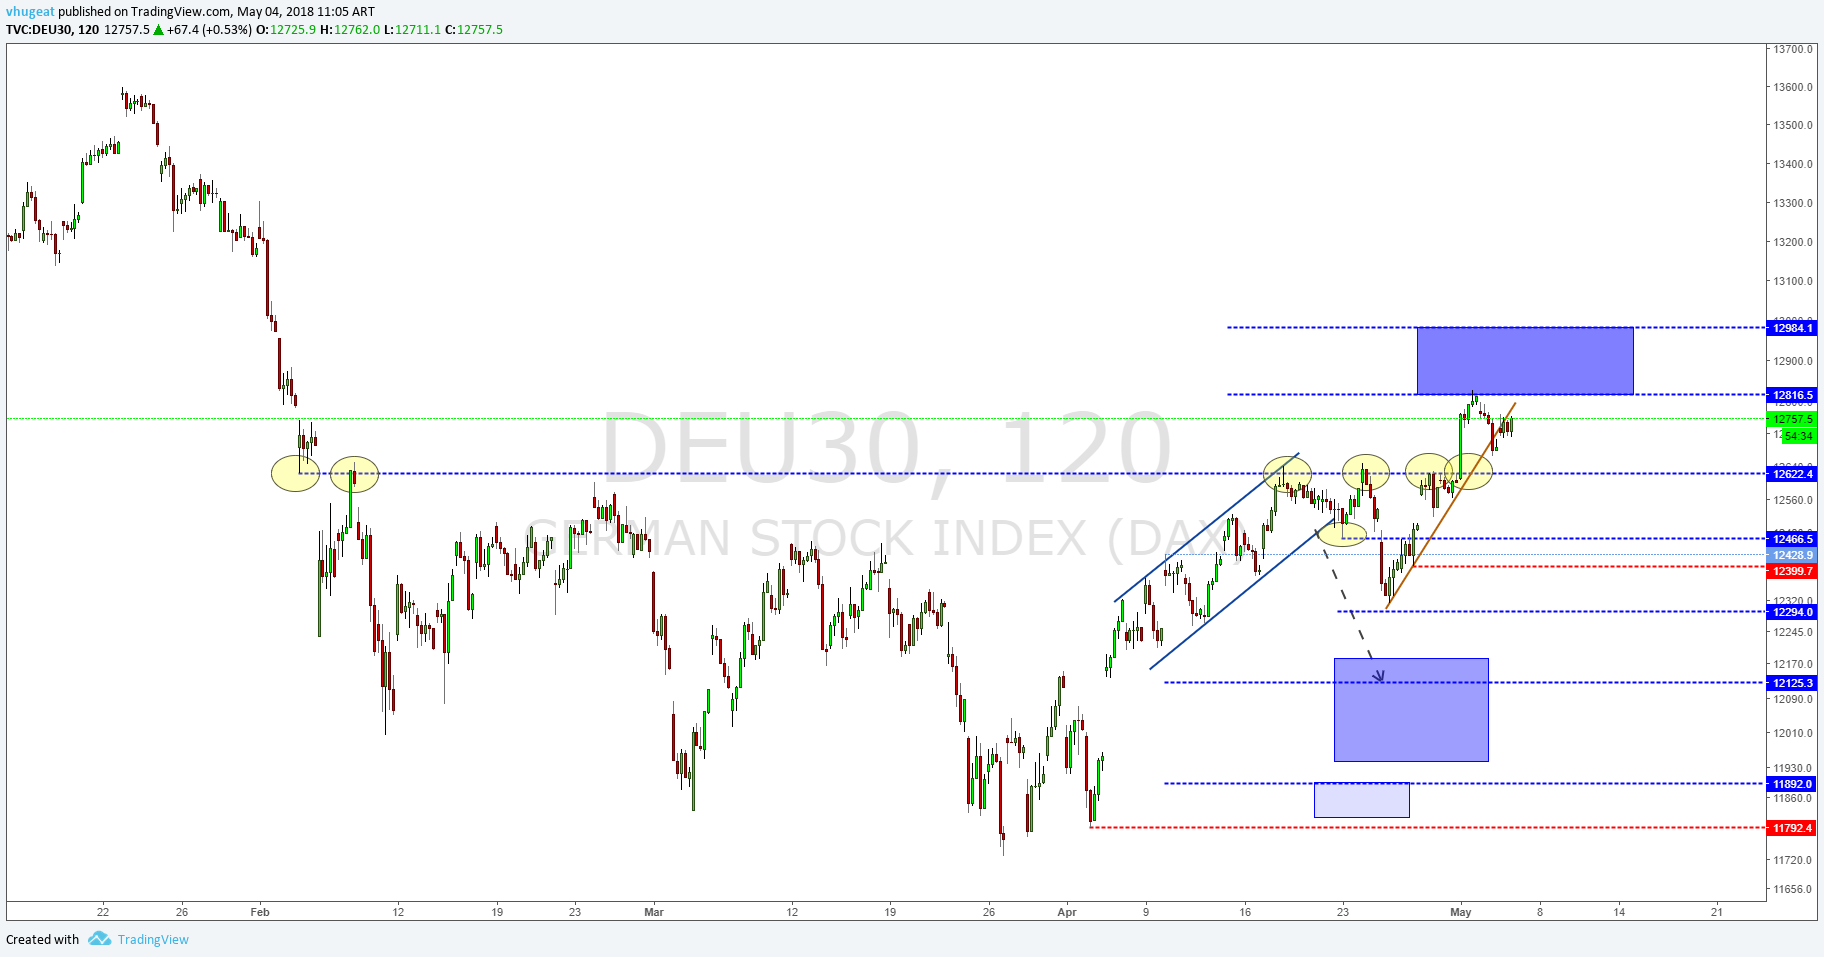
The DAX 30 continued moving bullish in the current session with all eyes on the next psychological resistance at 13,000 points. The invalidation level is 12,400 pts.


EURAUD advances as forecasted.

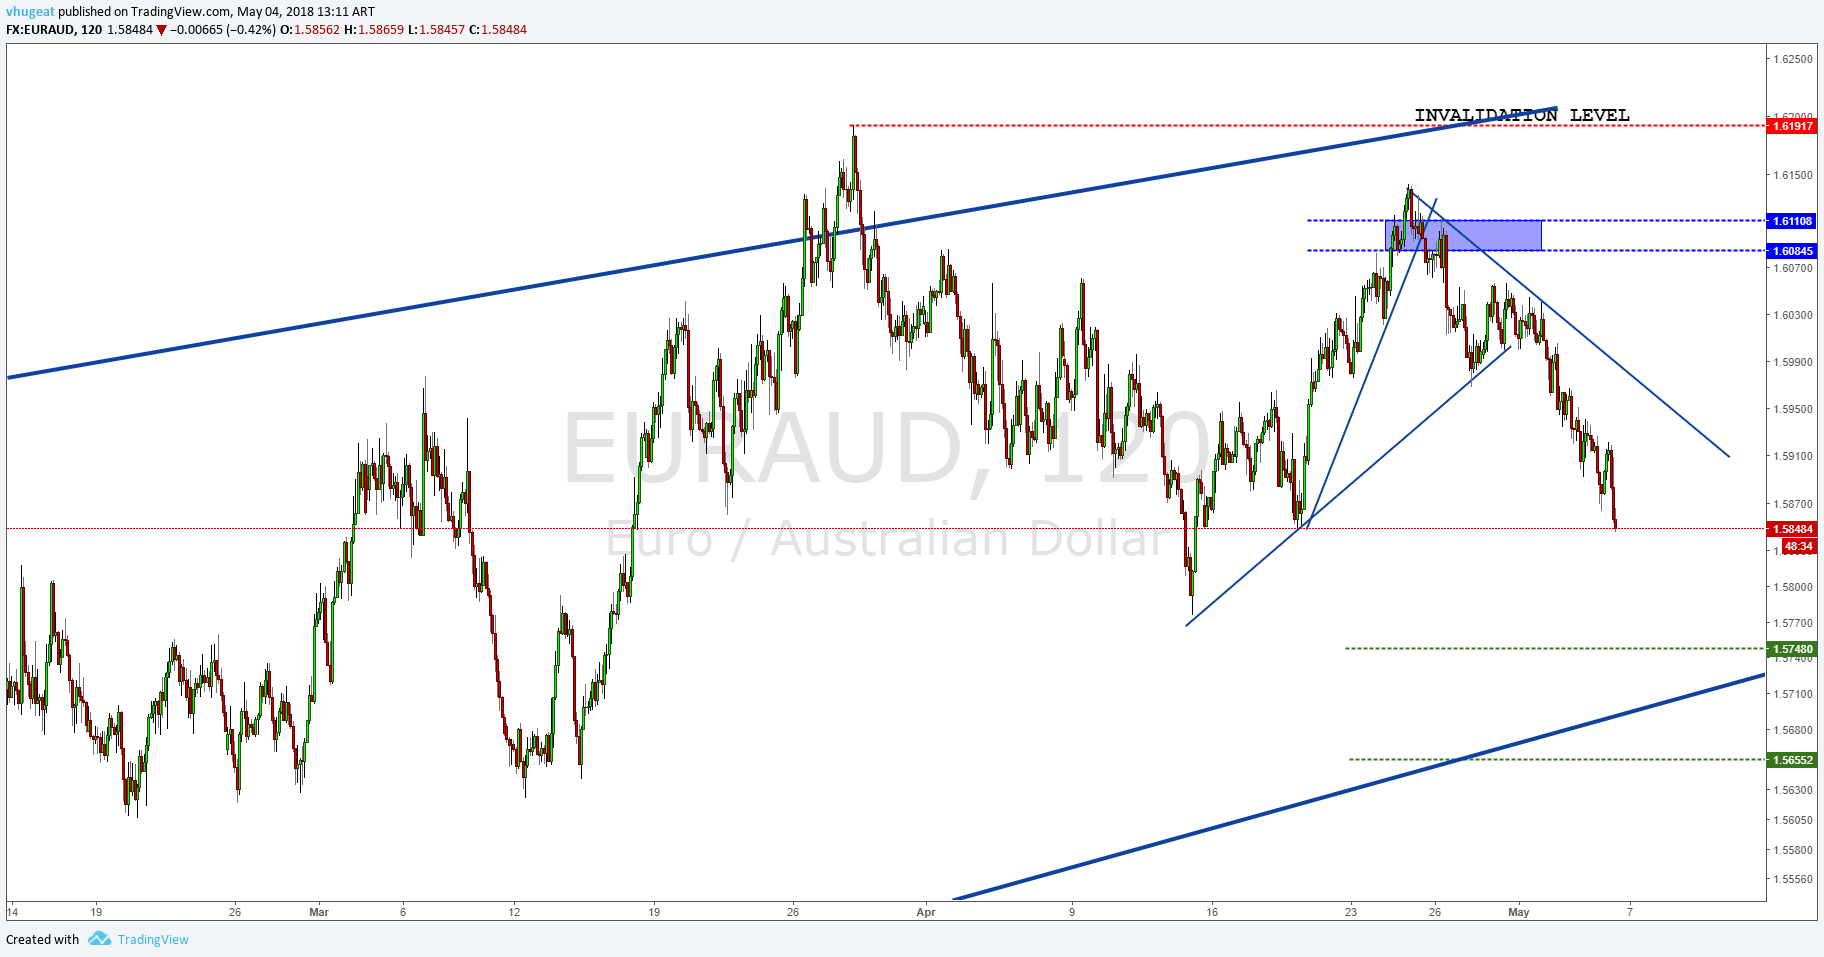
The cross continues moving on the bearish trend we have been forecasting since January and out of which we have been profiting when we took short positions at 1.6084. It is time to move our stop-loss to break-even, and possibly, take partial profits.


©Forex.Academy

Categories
Forex Market Analysis

US Dollar Climbs Against Its Pairs

FOREX WEEKLY FORECAST

Hot topics:

  • FTSE could make a new shoulder before it sees more upsides.
  • US Dollar climbs against its pairs.
  • ADP Nonfarm Employment in Canada raises.

The FTSE could make a new shoulder before it sees more upsides.

The FTSE 100 is turning bearish losing 0.09%, in the same way as principal indices. The 7,326 level is relevant resistance to be controlled. Nearest supports are 7,164 pts and 7,030 pts.FTSE
The German DAX is also moving bearish after reaching its highest level for eight weeks, falling 0.25%. The 12,622 level has been rejected for the second time and is now the key level to watch. Supports levels to be controlled are 12,125 pts and 11,892 pts.German DAX

US Dollar climbs against its pairs.

In the same way, as it has been our central vision for the Dollar Index, once released the Philly Fed Manufacturing Index, the greenback is rising. The common currency is breaking down following the scenario proposed in our previous updates. Our vision is that the price could fall to the 1.215 level.US Dollar climbs against its pairs
After making a fake breakout, the Pound has started a bearish move losing 1.43, and now is testing support at the 1.42 psychological level.Forex Weekly Forecast

The Swiss Franc is testing resistance in the 61.8% Fibonacci retracement reaching the 0.97 level. As long as the chief falls below the 0.9699 level, we expect that the price drops to 0.96126.Forex  Forecast

ADP Nonfarm Employment rises in Canada.

The nonfarm employment change, released by Automatic Data Processing (ADP), increased by 42.8K from February to March. While there were losses in finance, information, and education, they were outpaced by significant growth in the construction industry, said Ahu Yildirmaz, vice president and co-head of the ADP Research Institute. The EUR-CAD cross is raising as a corrective move of the principal bearish cycle. As long as the cross reaches 1.58, new sellers can be expected to add to short positions with their target at 1.54.ADP Nonfarm Employment rises in Canada

© Forex.Academy

Categories
Forex Market Analysis

Dollar Index Drops, Sterling jump to its max, Wall Street is moved up by Earnings

Hot Topics.

  • Dollar Index drops despite the increase in Retail Sales (MoM) in March.
  • Sterling strikes the highest level of the year for a second time.
  • Japanese Cabinet says the economy is “recovering moderately.”
  • Watching the Copper bullish cycle.
  • US Indexes climbs are boosted, aided by the companies earnings reports.

Dollar Index drops despite the increase in Retail Sales (MoM) in March.

The US economy continues showing strength signals about its economic growth. This time it was the retail sales report shift that advanced up 0.6% from February 2018 and 4.5% (YoY). Sales from the vehicle and parts dealers boosted 2% in March. Despite this good news, the US Dollar Index fell 0.40% touching its PRZ. While the price continues above the 88.52 level, we will consider the chance of a new bullish cycle.

The Euro, which represented more than 50% of the Dollar Index, closed the session with 0.41% gain. The pair still has almost 40 pips of space to reach its PRZ, previous to the ZEW economic sentiment data release. Meanwhile, the Index still could maintain its trading range. The invalidation level of the reversal scenario is above 1.2476.


Sterling strikes the highest level of the year for a second time.

The Pound is the best performing currency of the year with an advance of 6.24% (YTD). Not even the uncertainty driven by the Brexit negotiations or the negatives consequences of the severe weather conditions that have impacted some sectorial economic indicators have been enough to slow the Pound rally. In our last Daily Update, we saw a potential top and reversal pattern; our vision is that we could witness a 2B Pattern. In this case, we will be attentive to a breakout candle before to pulling the trigger.


Japanese Cabinet says the economy is “recovering moderately”.

The Cabinet Office of Japan described Japan’s economic growth as a “recovery at a moderate pace”. The private consumption and business investment in exports are “picking up”. Concerning the tariffs tensions between the US and China, the Cabinet economists see it as a risk factor they will observe closely. The USDJPY pair fell 0.31% to our PCS (Potential Continuation Section) as a bearish wedge pattern. If the price remains above 106.61, our vision continues to be bullish.The Pound/Yen cross is testing the second monthly resistance pivot level; however, it still could make new highs before a deeper correction. Our vision is that the cross could climb to the area between 155.8 – 157. Selling positions are considered only if the price breaks below the 152.95 level.

Watching the Copper bullish cycle.

Copper is developing a bullish cycle since January 2016. It is currently in an ascending expansive triangle pattern. In the long term, the red metal has “market debt” in the 3.44 level. In the short-term, as long as the price keeps above 2.98, the trend is bullish. If the price moves down to 3.01 – 3.03, copper could find new buyers at those levels, with their targets at around 3.20 – 3.21 and its extension in the 3.25 – 3.28 area.

US Indexes climbs are boosted, aided by the companies earnings reports.

This week,  the big companies started their quarterly earnings release. The optimistic analysts’ expectations came under the assumption that results are coming mainly from activities made before the tariffs conflict between the US and China. Dow Jones 30 closed the first trading session of the week with an advance of 0.44%. The Dow is testing the key level 24,620 and we are watching from our short-term picks. The invalidation level is below 24,090.

In the same way, Nasdaq 100 closed the session advancing 0.43%. The Technological Index is moving in an ascending triangle pattern. Mid-term, we expect that the price will hit the 7,090 level. The invalidation level for the bull market scenario is below 6,398 pts.

© Forex.Academy