Categories
Forex Elliott Wave Forex Market Analysis

USDCAD Bullish Divergence in a Complex Corrective Formation; What’s next?

The big picture of the USDCAD pair shows a bullish divergence suggesting the exhaustion of the current bearish trend that remains active since past March 2020 when the price topped at 1.46674 and began to decline in a complex corrective pattern. Follow with us what’s next for Lonnie.

Technical Overview

The long-term Elliott wave view of the USDCAD pair unfolded in its 2-day chart and log-scale, illustrates a downward movement that began on the second half of March 2020 when the price found fresh sellers at level 1.46674. Once the price topped, the Lonnie started to decline in a complex corrective formation identified as a double-three pattern (3-3-3) of Minor degree labeled in green.

According to the textbook, the double-three pattern characterizes itself by following an internal sequence subdivided into 3-3-3, each “three” a complete corrective formation. In this regard, the previous figure shows the price action moving in the third segment of the double-tree pattern corresponding to its wave Y. Also, the lower degree structural sequence reveals the progress in its wave ((c)) of Minute degree identified in black.

On the other hand, the technical indicators support the bearish bias that dominates the downtrend, persisting since March 2020. Both the trend and the momentum oscillators confirm the downtrend in progress. Nevertheless, the timing oscillator shows a bullish divergence plotted in green. This reading suggests the exhaustion of the bearish trend. In this context, the candlesticks formations observed in the last chart remains weighting declines over rallies.

Technical Outlook

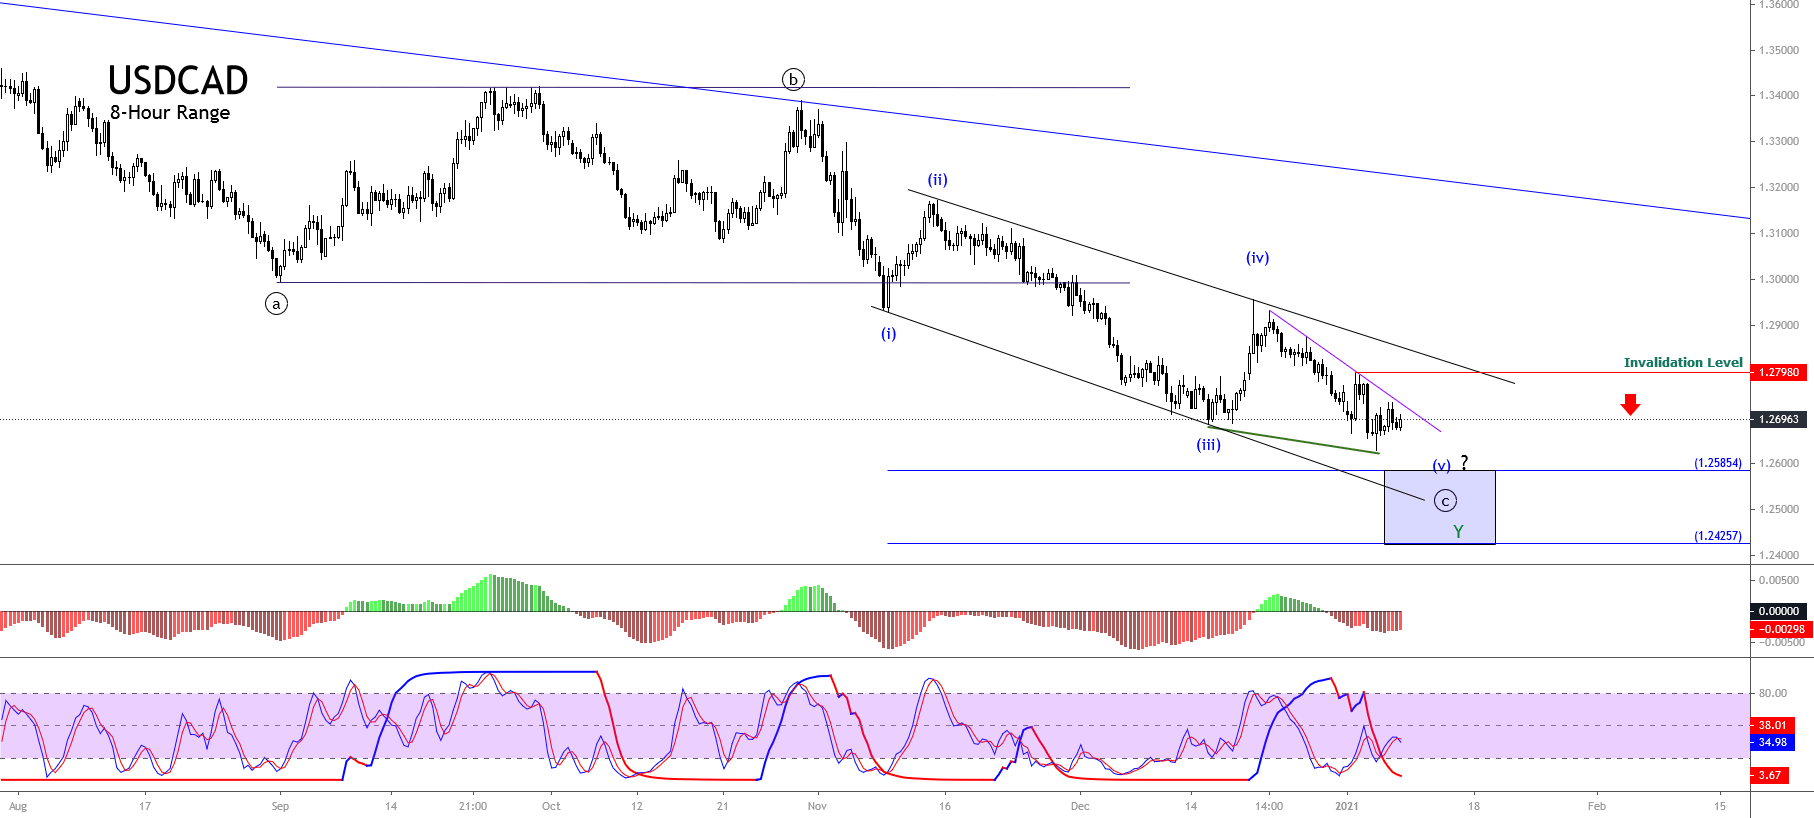
The short-term outlook for USDCAD exposed in the next 8-hour chart reveals the incomplete downward advance corresponding to wave ((c)) of Minute degree identified in black, suggesting a potential new decline.

The figure illustrates the downward channel in play that connects the extremes of waves (i)-(iii) and (ii)-(iv) Minuette degree identified in blue. The Elliott Wave theory suggests that the penetration below the base-line between waves (i) and (iii) could reveal the end of wave (v). In this regard, a potential new decline could strike the area bounded between 1.2585 and 1.2425. Likewise, the gap between momentum and timing oscillators supports the likely additional downward move in the USDCAD pair. 

In summary, the USDCAD advances in a downward complex corrective sequence identified as a double-three pattern of Minor degree, which looks running in its wave Y. Simultaneously, the internal structure reveals the progress in its wave ((c)) of Minute degree, which could see a new drop to the potential target area between 1.2585 and 1.2425. Finally, the bearish scenario will invalidate if the price soars and closes above 1.27980.

Categories
Forex Elliott Wave Forex Market Analysis

Is USDCAD Ready for a Short-Term Rally?

The USDCAD pair reveals a strong bearish movement that seems have found a short-term bottom. In this regard, the price could start a rally that could boost the price toward October’s highs zone.

Market Sentiment

The USDCAD pair continues moving in its extreme bearish sentiment zone, erasing the gains reached during the first quarter of the year when the price advanced over 13%. Currently, the Loonie gains a modest 0.67% YTD.

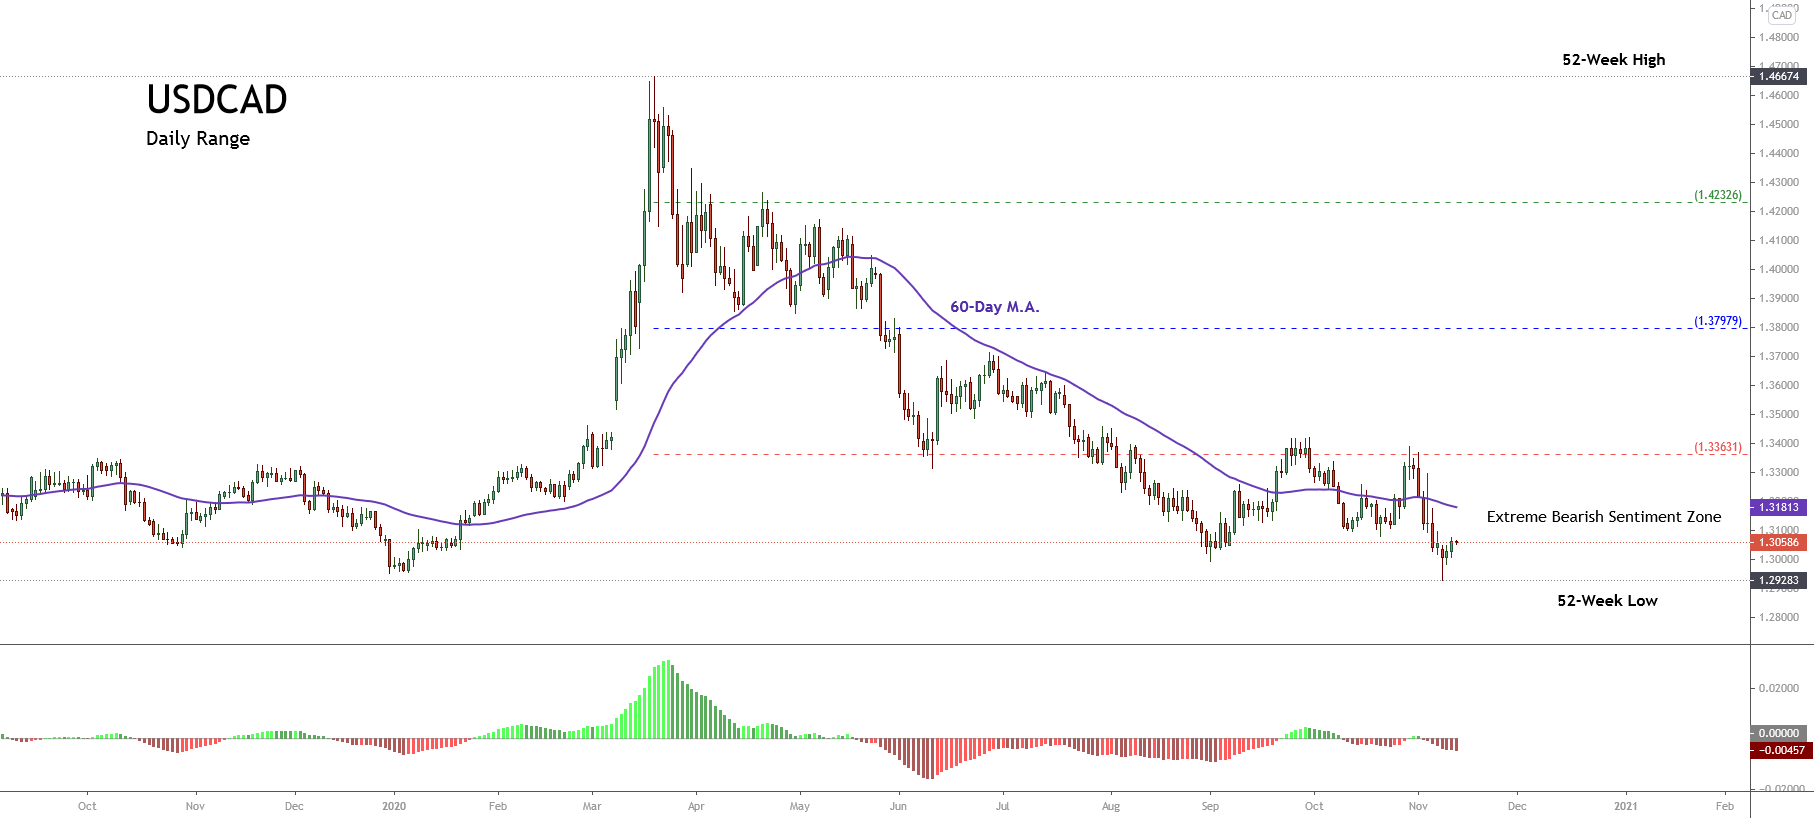
The next figure illustrates the USDCAD pair in its daily timeframe. The chart exposes the long-term market participants sentiment bounded by the 52-week high and low range. 

The chart reveals the price action continues developing fresh lower lows, which leads us to observe that market participants continue holding bearish positions on the pair. Furthermore, the 60-day weighted moving average continues above the price, which confirms the bearish bias that advances the price.

On the other hand, as long as the USDCAD price remains below 1.33631, the Loonie will stay under bearish pressure.

Technical Overview

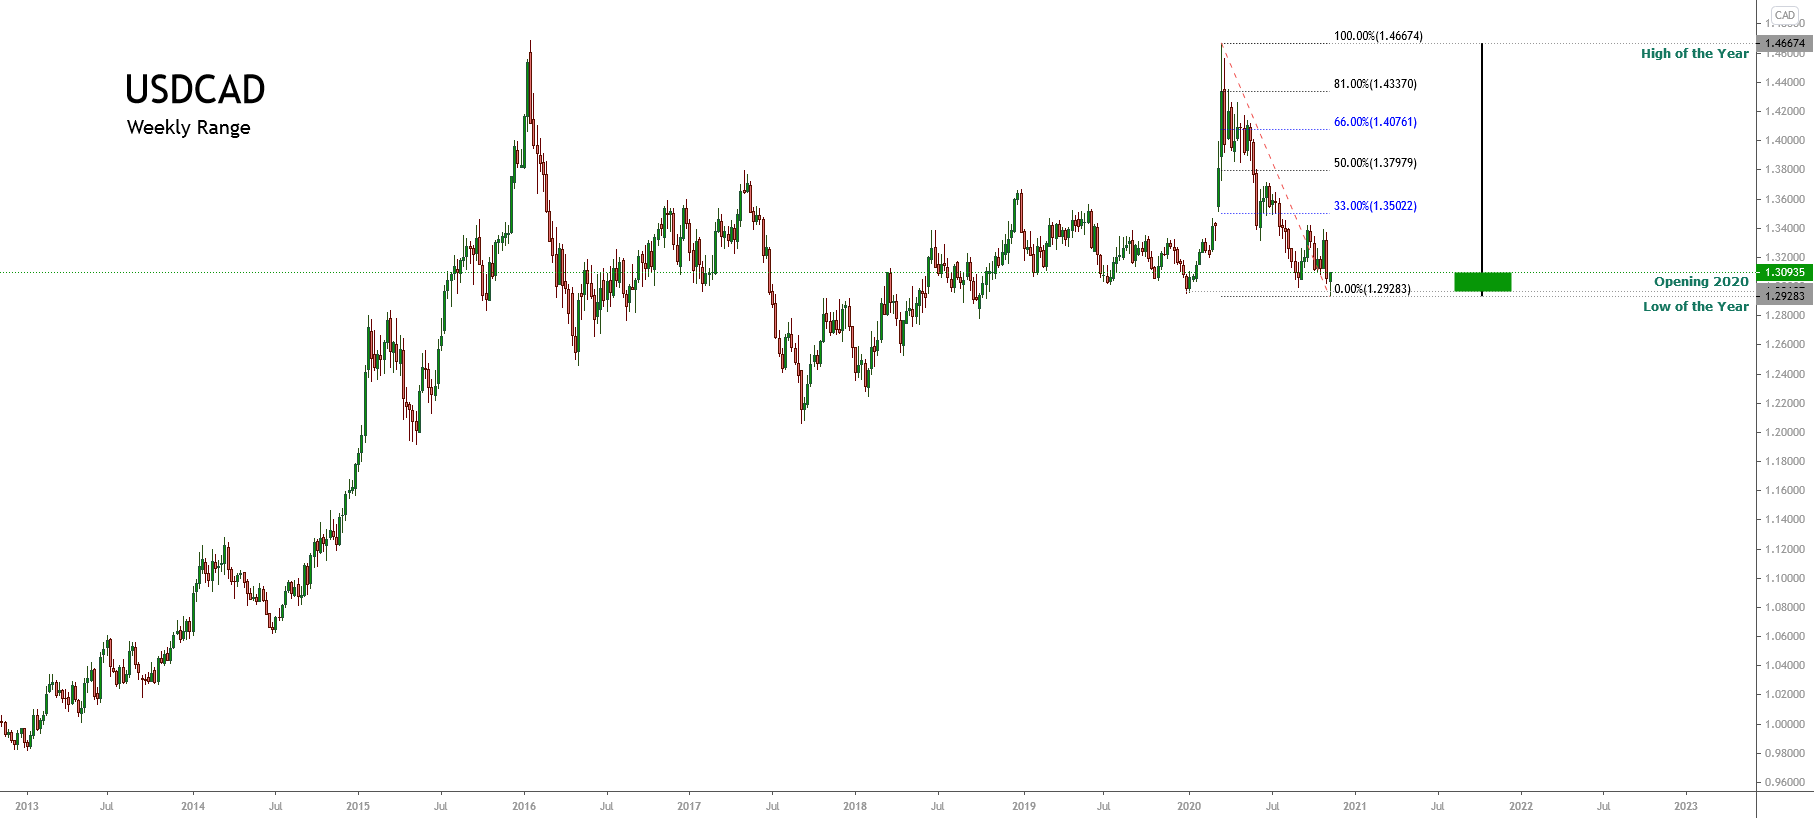
The USDCAD pair exposes a bearish reversal formation that erased the progress developed during the first quarter of the year. The following weekly chart reveals a powerful bearish long-tailed candle in terms of a yearly candlestick, suggesting that the price would continue developing more declines in the long-term.


On the other hand, the big picture exposes a long-term sideways formation that persists since mid-2015. Likewise, the last downward movement that began at 1.46674 appears to have found a bottom on 1.29238 the current trading week. 

In this regard, if the price starts to develop a corrective rally, according to the Dow Theory, the USDCAD pair should advance to 1.35022 and up to 1.40761; this upward sequence would correspond to a valid correction of the same degree that the last bearish move developed by the pair since last mid-March.

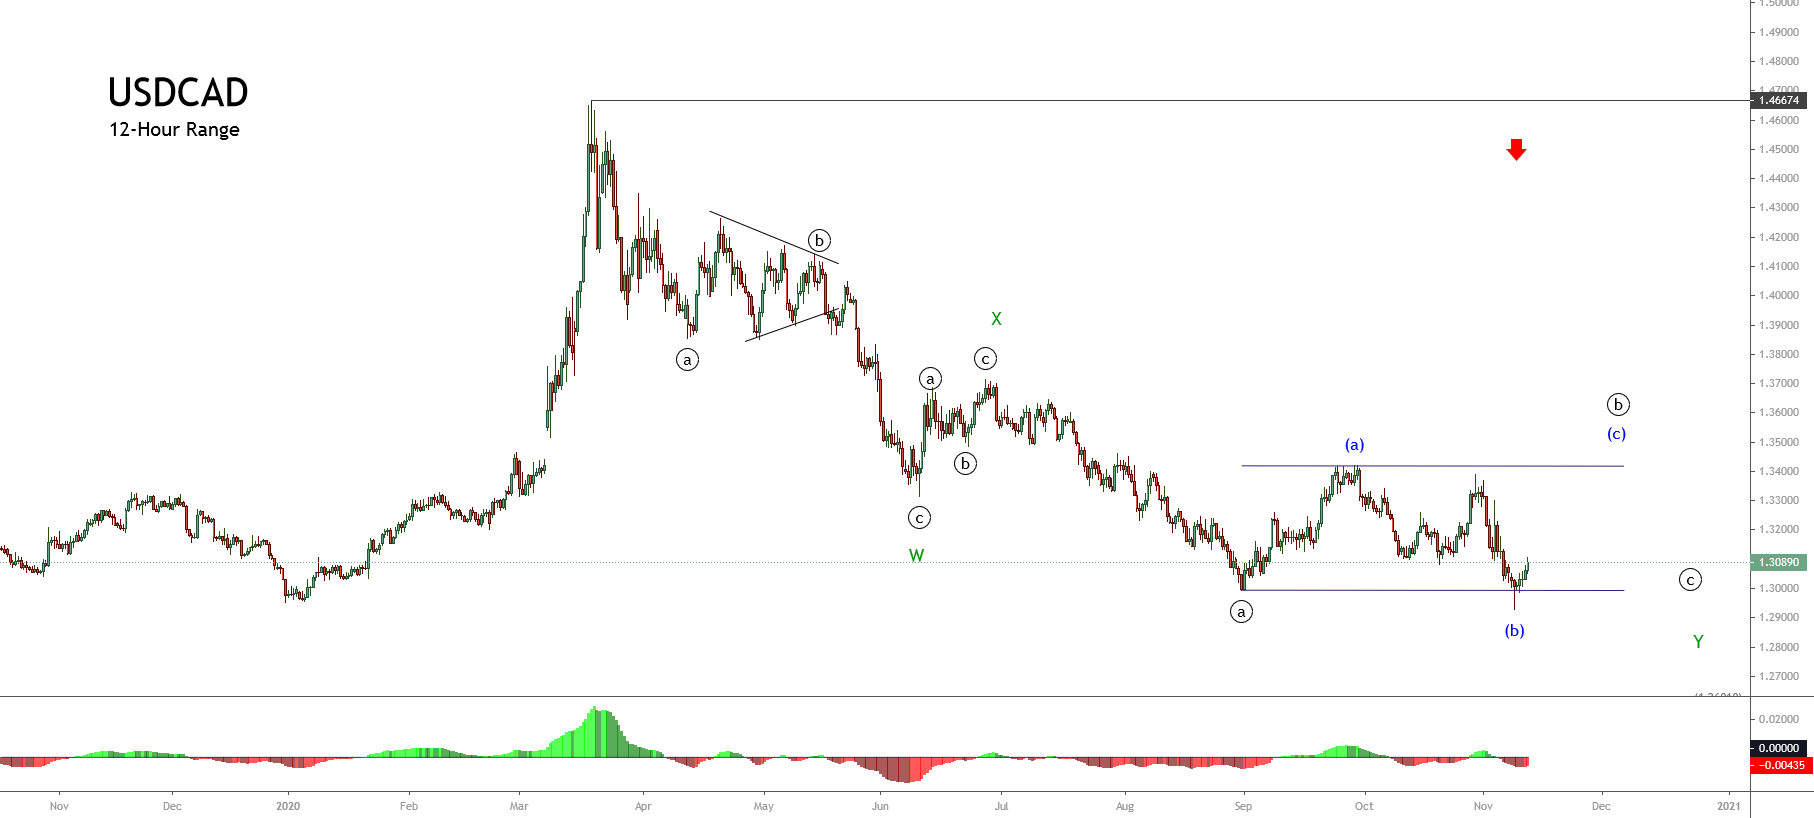
The mid-term Elliott wave view of USDCAD illustrated in the next 12-hour chart reveals an incomplete corrective sequence that looks like a double three pattern (3-3-3) of Minor degree labeled, in green, which began on March 18th at 1.46674.

Currently, the USDCAD develops its wave ((b)) of Minute degree identified in black, which belongs to wave Y in green. In this context, the wave ((b)) looks like an incomplete flat pattern (3-3-5), which subdivides into a 3-3-5 sequence. Moreover, the actual structural series suggests that the Loonie started to develop its wave (c) of the Minuette degree labeled in blue. 

Short-term Technical Outlook

The short-term Elliott wave view of the USDCAD unfolded in the following 8-hour chart, anticipates its progress in an incomplete flat pattern, which could be starting to advance on its wave (c) of Minuette degree labeled in blue.

If the Loonie find fresh buyers in a retracement to the demand zone between 1.30433 and 1.30086, and the price breaks and closes above 1.31473, then the price could confirm the potential rally that corresponds to wave (c) of Minute degree with a potential target in the supply zone between 1.33970 and 1.34592.

Lastly, the invalidation level for the intraday bullish scenario locates at 1.29283

Categories
Forex Signals

USDCAD Swing Failure BUY

Categories
Forex Signals

USDCAD Breakout Retest Buy

Categories
Forex Signals

USDCAD Breakout Retest Buy

Categories
Forex Signals

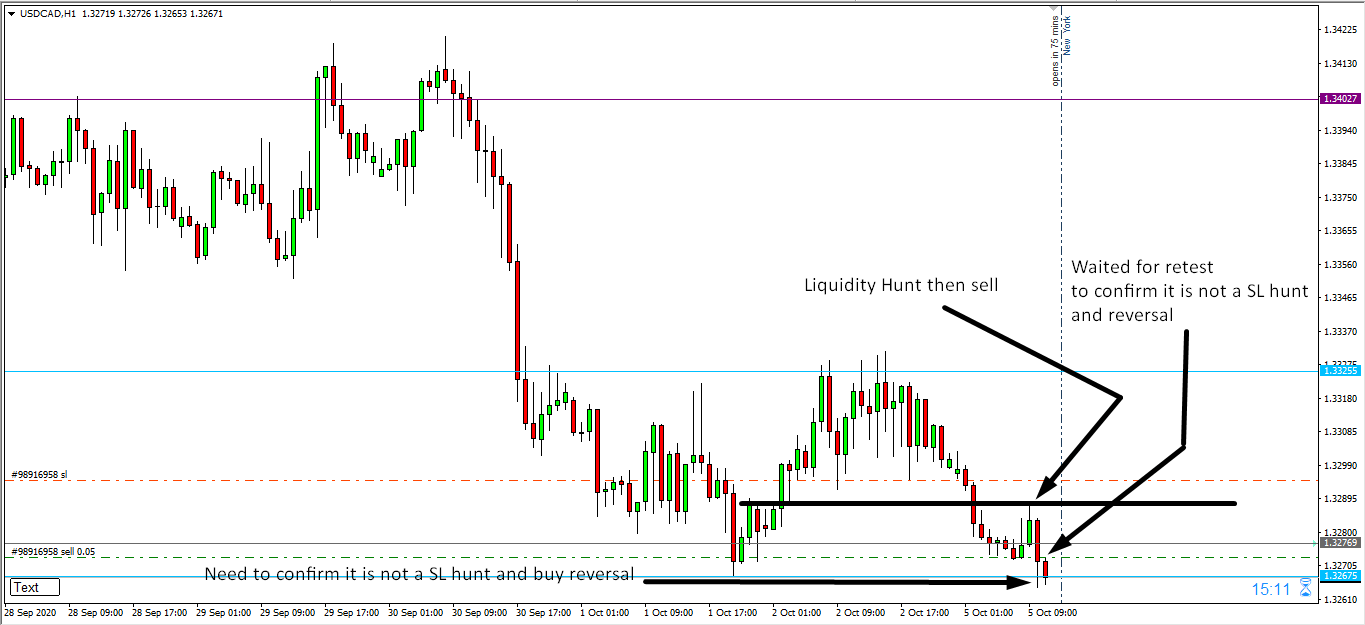
USDCAD Breakout Anticipation Sell

Flow Assessment

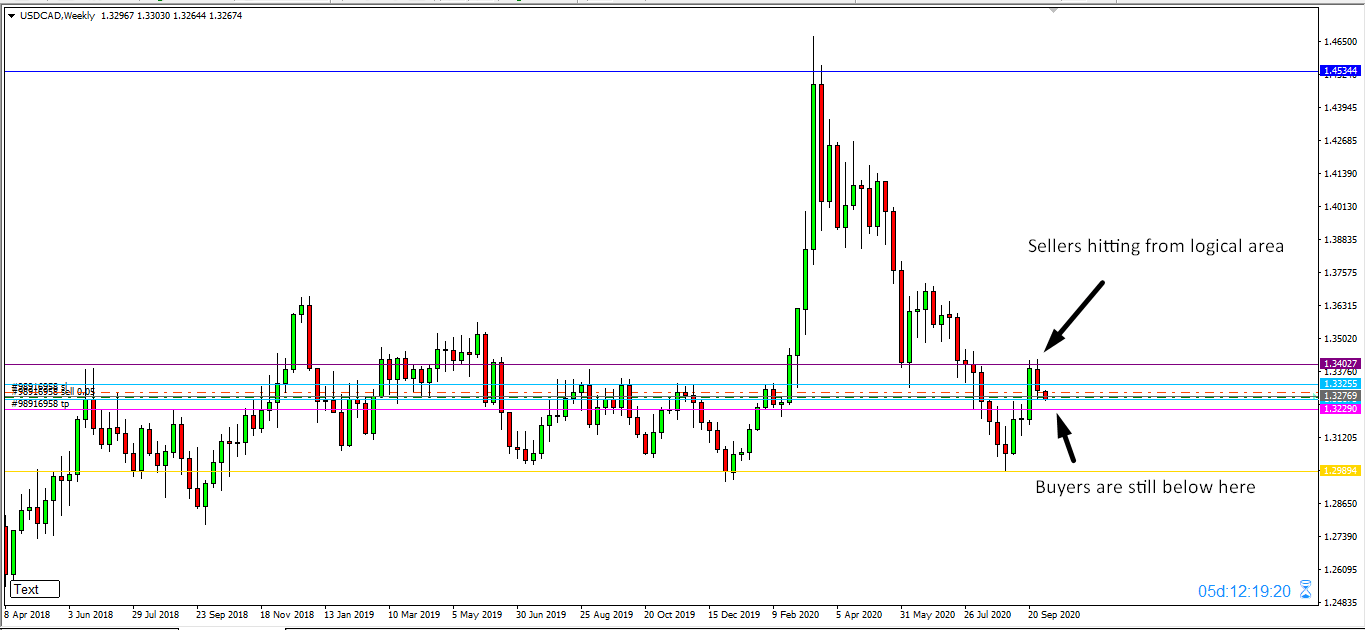
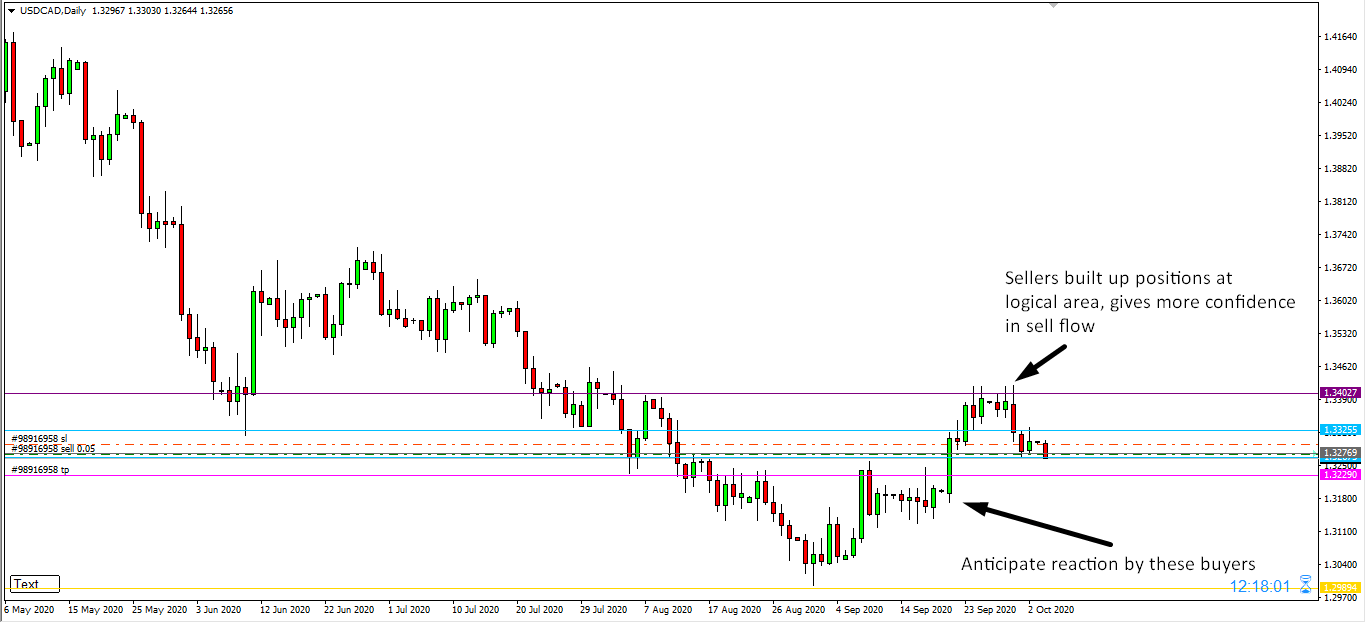
  • Daily sell flow is down
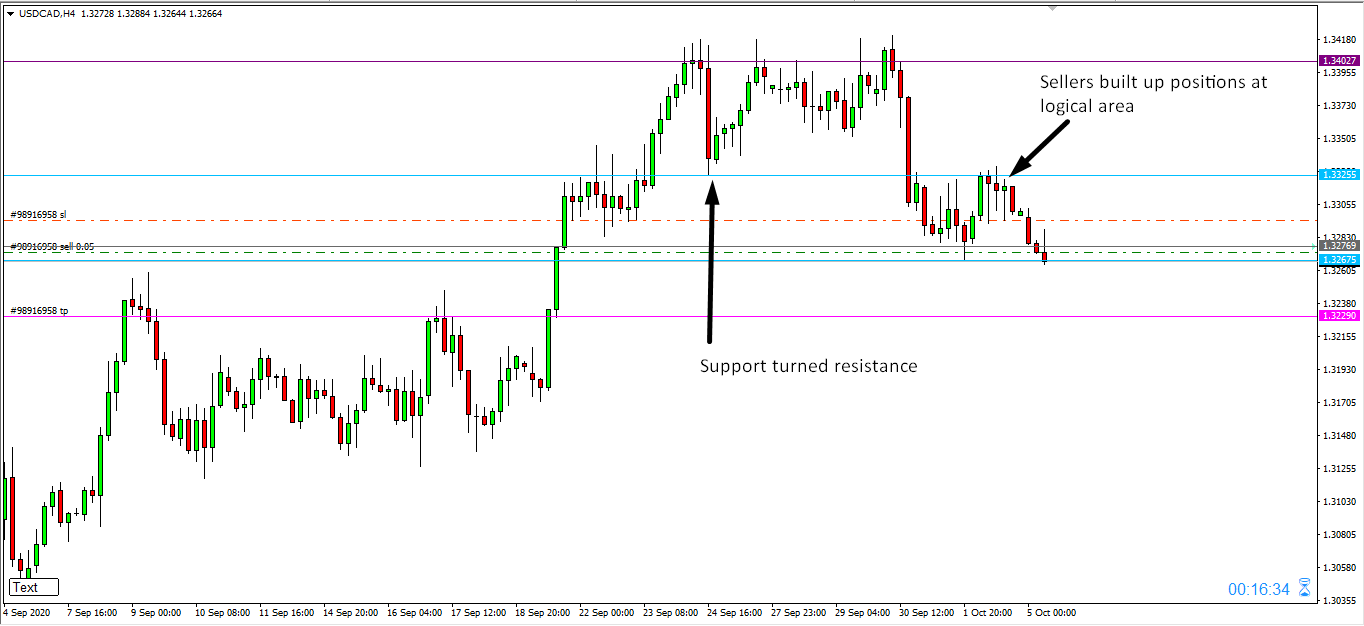
  • Sellers have built up positions on the H4 and penetrated lows in H1

Location Assessment

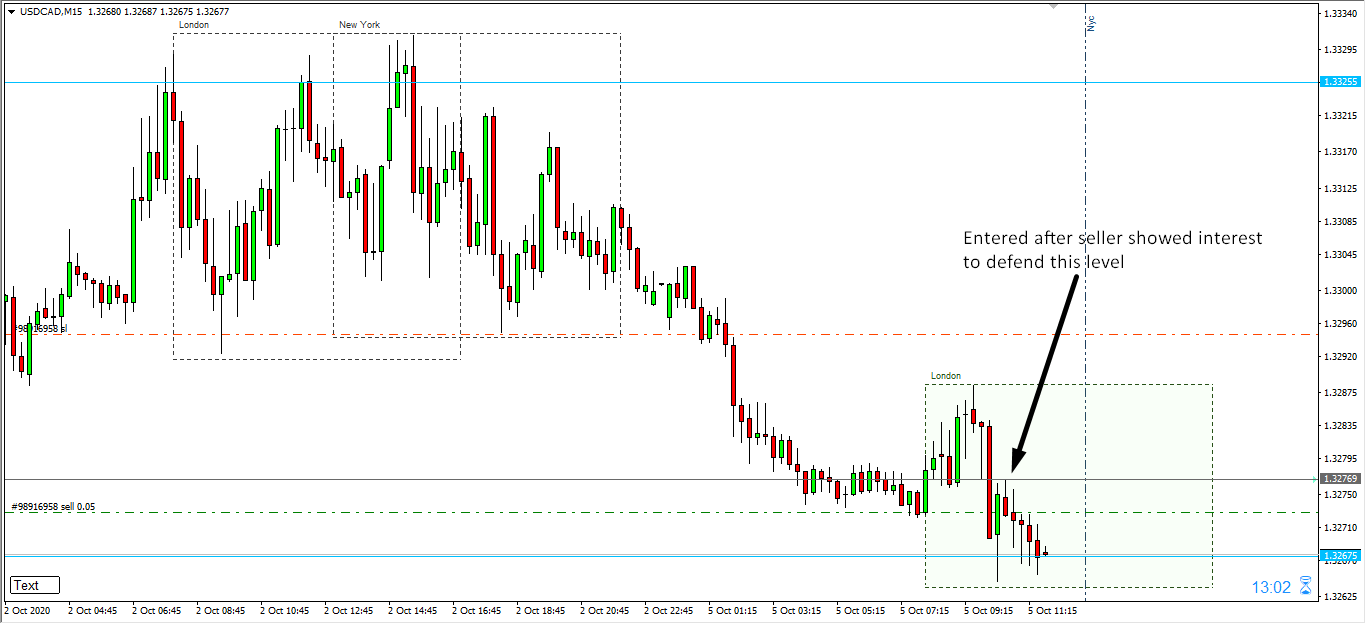
  • Price is at a M15 retest level after H1 sellers cleared the recent low
  • From the H4 perspective, there is space for the sell to perform until it reaches the next set of buyers (pink line in H4 picture above)

Momentum Assessment

  • We checked to see that the break of the H1 low was not a stop-loss hunt by waiting for the M15 retest and failure to make an equal high
  • Entry trigger activated after sellers showed interest to defend the M15 level

Entry Price – Sell 1.3271

Stop Loss – 1.3292

Take Profit – 1.3228

Risk to Reward – 1:2:05

Profit & Loss Per Standard Lot = -$157/ +$325

Profit & Loss Per Micro Lot = -$15.7/ +$32.5

Fellas, now you can check out forex trading signals via Forex Academy mobile app. Follow the links below.

iPhone Users: https://apps.apple.com/es/app/fasignals/id1521281368

Andriod Users: https://play.google.com/store/apps/details?id=academy.forex.thesignal&hl=en_US

Categories
Forex Market Analysis

Daily F.X. Analysis, September 24 – Top Trade Setups In Forex – U.S. Jobless Claims in Focus! 

The economic calendar is again busy with Federal Reserve events such as today, the Fed Chair Powell Testifies. Jerome Powell is expected to testify on the CARES Act before the House Financial Services Committee in Washington DC. Besides this, the eyes will be on the Existing Home Sales from the United States. Overall, the market is likely to exhibit corrections today.

Economic Events to Watch Today  


AUD/USD – Daily Analysis

The AUD/USD failed to stop its previous losing streak and dropped to a 2-months low around below the mid-0.7000 level mainly due to the risk-off market sentiment, triggered by the renewed concern about the second wave of coronavirus infections, which continued weighing on investors sentiment and undermined the perceived riskier Australian dollar. The broad-based U.S. dollar strength, supported by the combination of factors, also dragged the currency down across the ocean. At the moment, the AUD/USD is currently trading at 0.7033 and consolidating in the range between 0.7029 – 0.7083. 

The traders seem cautious to place any strong position ahead of the testimony by the Fed Chair Jerome Powell and Treasury Secretary Steven Mnuchin, which will influence the USD price dynamics and provide some fresh direction to the currency pair.

Worries that the coronavirus pandemic’s resurgence could ruin the global economic recovery keeps the market trading sentiment under pressure and weakened the perceived riskier Australian dollar. As per the latest report, the coronavirus COVID-19 cases continue to climb in Europe, U.K., and the U.S. Whereas, some E.U. countries are now facing the starting of the second wave coinciding with the onset of the flu season. That was witnessed after the World Health Organization’s regional director for Europe said that “We have a dire situation unfolding before us,” H further added that Europe’s number of weekly infections was higher now than at the first peak in March. 

At the US-China front, the long-lasting tussle between the United States and China remains on the play as State Mike Pompeo took help from France, Germany, and the U.K. to reject China’s claims of the South China Sea at the United Nations (U.N.). This also exerted downside pressure on the market trading sentiment and contributed to the currency pair losses. 

As a result, the broad-based U.S. dollar succeeded in extending its previous session gains and remained well bid on the day as investors turned to the safe-haven in the wake risk-off market sentiment. However, the U.S. dollar gains could be short-lived or temporary due to the worries that the U.S.’s economic recovery could be stopped because of the reappearance of coronavirus cases. Besides this, the gains in the U.S. dollar was further boosted after the hawkish comments by Chicago Fed President Charles Evans, that further quantitative easing may not provide additional support to the U.S. economy. However, the gains in the U.S. dollar kept the currency pair under pressure. Whereas, the dollar index, which pits the dollar against a bucket of 6-major currencies, stood at 94.336 on the day, close to a nine-week high.

Moving Ahead, the traders will keep their eyes on the U.S. economic docket, which will show the release of Initial Weekly Jobless Claims and New Home Sales data. Apart from this, the U.S. Federal Reserve (Fed) Chair Jerome Powell’s testimony will also be closely observed. Across the ocean, the market risk sentiment and developments surrounding the coronavirus will not lose their importance. 

Daily Technical Levels

 Support      Resistance  

0.7035       0.7147  

 0.6996      0.7218  

 0.6924      0.7258  

  Pivot Point: 0.7107  


AUD/USD– Trading Tip

The stronger U.S. dollar has also driven sharp selling in the AUD/USD pair as it trades at 0.7042 level today. The AUD/USD pair has formed three black crows patterns on a daily timeframe, suggesting odds of selling bias in the AUD/USD. However, the AUD/USD has closed a Doji candle at 0.7042 level, and we may see some bullish correction over the 0.7001 support level until the next resistance level of 0.7098 and 0.7152 level. 


USD/CAD– Daily Analysis

The USD/CAD currency pair extended its previous session bullish bias and kept gaining positive traction around above 1.3400 level, mainly due to the broad-based U.S. dollar strength. The bullish tone around the U.S. dollar was sponsored by the concerns over rising COVID-19 cases and fears of renewed lockdown measures, which kept the market trading sentiment under pressure and supported the greenback’s status as the global reserve currency. 

On the flip side, the currency pair bullish bias could also be attributed to the weaker crude oil prices, which undermined the demand for the loonie, a commodity-linked currency, and contributed to the pair gains. Currently, the USD/CAD pair is trading at 1.3396 and consolidating in the range between 1.3370 – 1.3412.

As we already mentioned that the equity market had been flashing red since the Asian session started. The reason could be associated with the major negative catalysts. Be it the concerns about the second wave of coronavirus diseases or the fears of renewed lockdown measures, not to forget the long-lasting US-China tussle, all these factors weigh on the market trading sentiment and helping the U.S. dollar to put the safe-have bids. Apart from this, the slowdown in Europe, alongside concerns expressed by U.S. Federal Reserve officials over the U.S. economy, pushed the equity market down. 

The broad-based U.S. dollar keeps its gaining streak and still reporting gains on the day amid market risk-off sentiment. However, the U.S. dollar gains could be short-lived or temporary as worries that the U.S.’s economic recovery could be stopped amid the resurgence of the second wave of coronavirus cases. Besides this, the U.S. dollar gains were further boosted by the hawkish comments by Chicago Fed President Charles Evans, suggesting that further quantitative easing may not provide additional support to the U.S. economy. However, the gains in the U.S. dollar kept the currency pair higher. Whereas, the dollar index, which pits the dollar against a bucket of 6-major currencies, stood at 94.336 on the day, close to a nine-week high.

Across the pond, the crude oil prices failed to stop its previous session, losing streak and remained pressed around below the mid-$39.00 marks. Besides, the possibilities of Libya resuming oil exports added further bearish pressures around the crude oil prices. Thus, the declines in crude oil prices undermined demand for the commodity-linked currency the loonie and contributed to the currency pair gains. 

Looking forward, the traders will keep their eyes on the U.S. Federal Reserve (Fed) Chair Jerome Powell’s testimony. Furthermore, the U.S. Jobless Claims and Housing data will also be key to watch. Whereas, the updates concerning the US-China relations and the U.S. stimulus package will not lose their importance.

 Daily Technical Levels

Support      Resistance

  1.3323      1.3418  

  1.3260      1.3450  

  1.3228      1.3513  

  Pivot Point: 1.3355  


USD/CAD– Trading Tip

The USD/CAD is trading with a bullish bias at 1.3402 level, having violated the ascending triangle pattern at 1.349 level, and now it’s heading further higher until the next resistance level of 1.3460. The MACD and three white soldiers pattern is suggesting chances of bullish bias in the pair. In contrast, the pair has also crossed over 50 periods EMA at 1.3254 level. Today we should consider taking a buying trade over 1.3349 level to target the 1.3462 level. 


USD/JPY – Daily Analysis

The USD/JPY pair was closed at 105.362 after placing a high of 105.494 and a low of 104.847. The pair USD/JPY extended its gains on Wednesday for the third consecutive day and peaked six previous days. The rising USD/JPY prices were due to the strong rebound of the U.S. dollar’s safe-haven status and upbeat market data.

On Wednesday, the U.S. dollar was strong due to Fed officials’ more hawkish comments that raised the U.S. dollar and helped it regain its safe-haven status. The strong bullish momentum in the USD/JPY pair was also supported by Japan’s weak PMI data on Wednesday.

At 05:30 GMT, the Flash manufacturing PMI from Japan for the month of September declined to 47.3 against the projected 48.0 and weighed on the Japanese Yen. The figures showed that Japan’s manufacturing sector viewed contraction in September that was negative for local currency but positive for the USD/JPY pair. At 09:30 GMT, All Industrial Activity in September remained flat at 1.3% from Japan.

On the U.S. front, the Housing Price Index for July advanced to 1.0% against the expectations of 0.4% and supported the U.S. dollar that helped the gains of USD?JPY pair on Wednesday. At 18:45 GMT, the highly awaited Flash Manufacturing PMI also rose to 53.5 against the anticipated 52.5 and supported the greenback that added further gains in the USD/JPY pair. However, the Flash Services PMMI remained flat with a projection of 54.5.

Meanwhile, the President of the Federal Reserve Bank of Cleveland, Loretta Mester, said on Wednesday that the U.S. economy had rebounded significantly from the losses caused by the pandemic induced lockdowns. However, she also said that the recovery was still narrow and was not sustainable. The Fed Vice Chair Randal K. Quarles said that the coronavirus event was an enormous economic shock in the first half of 2020. He also said that the recovery was underway, but a full recovery was far off as the risks remain on the downside.

Apart from this, the Fed Chair Jerome Powell, in his testimony, faced many questions regarding the next round of stimulus package. He replied that the difference between Democrats & Republicans over the package’s size remains and caused a delay. Powell also urged more spending to help the economy recover from the pandemic crisis. All these developments raised the U.S. dollar prices due to its safe-haven status and boosted the USD/JPY pair.

Moreover, the tensions between the U.S. and China also escalated after U.S. President Donald Trump blamed China and called for holding it accountable for the global spread of coronavirus. In response to this, Chinese President XI Jinping accused Trump of lying and insulting the platform of the U.N. He also said that he had no intension of having a cold war with any country. These harsh comments from both sides also raised uncertainty and helped the U.S. dollar to gain traction due to safe-haven nature and post gains in the USD/JPY pair on Wednesday.

Daily Technical Levels

Support      Resistance

  105.0000      105.6100  

  104.6400      105.8600  

  104.3900      106.2100  

  Pivot Point: 105.2500  


USD/JPY – Trading Tips

The USD/JPY is trading with a bullish bias to trade at 105.460 level, and the series for EMA are now extending at 105.550 level. On the lower side, the support stays at 104.840 level. The MACD is also in support of bullish bias amid a stronger U.S. dollar and reduced safe-haven appeal. Bullish crossover of 105.550 level may drive more buying until 106.258. The idea is to stay bearish below the 105.470 level today. Let’s wait for Jobless Claims from the U.S. to determine further trends. Good luck! 


Categories
Forex Signals

Investors Triggers Profit Taking In USD/CAD – Let’s Short for Quick Profit! 

The USD/CAD Currency Pair Hit The Fresh Session High Around 1.3500 Marks Due To Combination Of Factors. The USD/CAD pair was closed at 1.36295 after placing a high of 1.36317 and a low of 1.33969. Overall the movement of USD/CAD remained bullish throughout the day.

USD/CAD on Thursday rose from ashes like a phoenix after trading lower for past days due to general commodities weakness. The WTI crude oil dropped about 8% lower on Thursday and dragged commodity-linked Loonie with itself, which afterward pushed the USD/CAD pair higher.

The selling bias of crude oil was due to the fresh prediction of the long road towards economic recovery by the Federal Reserve, which exerted downside pressure on the oil market. Decreased crude oil prices pushed the currency pair USD/CAD in an upward direction to post daily gains.

On the other hand, the US dollar strength also added in the upward trend of USD/CAD after the better than expected US economic data and risk-off market sentiment. The reason behind the risk-off market sentiment was the gloomy outlook of the US economy from the Fed in its monetary policy meeting report on Wednesday. Fed promised to maintain the interest rates at its current level of 0-0.25% near zero until 2022.

On Thursday, the economic docket, the Unemployment Claims from last week, decreased to 1.542M from 1.550M of expectations and supported the US dollar. The PPI for May also reported an increase to 0.4% from the 0.1% of expectations and added support to the US dollar.

The strength of the US dollar from positive macroeconomic data and risk-off market sentiment gave a boost to its buying and raised its bars on the board against its rival currencies, including CAD. The heavy buying of the US dollar added in the upward trend of USD/CAD pair, and hence, the pair rose above 1.3600 level on Thursday.


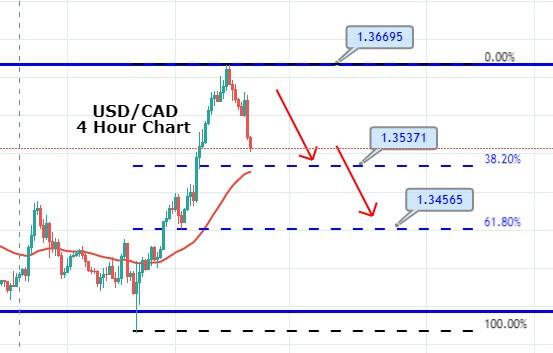
The USD/CAD prices are trading with a bearish bias of around 1.3580, falling from 1.3660 level. The MACD and RSI were in overbought range, and the pair has closed three black crows are driving bearish movement in the market. Let’s consider taking sell to target 38.2% Fibonacci retracement at 1.3570 level today. 

Entry Price – Sell 1.35903    

Stop Loss – 1.36303    

Take Profit – 1.35503    

Risk to Reward – 1

Profit & Loss Per Standard Lot = -$400/ +$400

Profit & Loss Per Micro Lot = -$40/ +$40

Categories
Forex Signals

Quick Up On USD/CAD Signal – Breakout, Fakeout! 

The USD/CAD pair was closed at 1.40160 after placing a high of 1.40424 and a low of 1.39000. Overall the movement of the USD/CAD pair remained bullish throughout the day. 

The USD/CAD pair posted gains on Monday after falling for the past 2 trading days. The decreased crude oil prices on Monday caused the CAD to outperform its rival currency US dollar and raised the USD/CAD pair.

In the past week, the WTI crude oil prices were supported by the heightened hopes of recovery in global energy demand amid the easing of coronavirus induced lockdowns from across the globe. 

The barrel of WTI crude oil rose almost 30% last week, which is the largest weekly gain of the year. However, the cautious market mood on Monday dragged down the WTI crude prices by 3.5% to 25.20$.


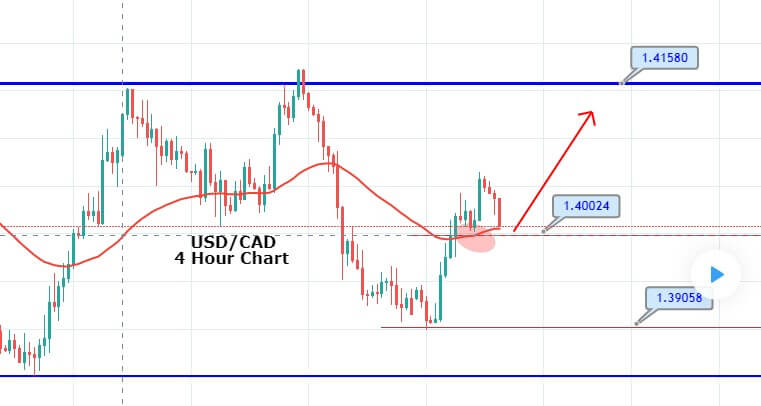
During the Asian session, bullish bias was dominating the USD/CAD prices as these lead the pair towards the next resistance level of 1.4100. On the 4 hour timeframe, the USD/CAD pair managed to crossover the 50 EMA and has closed bullish candles above the EMA support level of 1.4000. 

On the higher side, the USD/CAD prices may lead the pair towards the next resistance level of 1.4100, but currently, the pair is retracing back and it may test the support area of 1.4000 level. But I case, the pair manages to close below 1.4000 level, our signal will be at risk of hitting the stop loss. Let’s see how it goes. 

Entry Price: Buy at 1.40494    

Take Profit 1.40994    

Stop Loss 1.39994    

Risk/Reward 1.00

Profit & Loss Per Standard Lot = -$500/+$500

Profit & Loss Per Micro Lot = -$‭‭50/+$50

Categories
Forex Signals

USD/CAD Gain Support Over Double Bottom – Who’s Up for Bullish Trade?  

The USD/CAD pair slipped sharply to form the double bottom pattern around 1.3864 level on the 4-hour chart. The primary reason behind a sharp sell-off in the USD/CAD pair is the risk-on market sentiment, which is increasing demand for crude oil following the report of successful clinical trials of Gilead Sciences’ retroviral drug Remdesivir. The drug will be used to treat those infected by COVID-19, and investors are expecting the market will be back to its feet once this medicine gets success.

With this, demand for oil will be strong again, and due to which, Loonie will gain bullish bias, causing USD/CAD pair to drop. The US dollar draws further offers in the wake of less heaven demand and exert some pressure on the USD/CAD currency pair.


From the technical perspective, the USD/CAD pair’s failure to register any meaningful recovery further indicates that the near-term bearish pressure could not finish soon. Therefore, the range-bound trading action might still be classified as a consolidation phase before the next leg of the pair’s bearish move. Before we see further selling in the USD/CAD pair, the odds of bullish retracement will remain strong. The USD/CAD pair may drive the pair’s prices towards 23.6% or 38.2% Fibonacci retracement level of 1.3915 and 1.3945, respectively. 

Entry Price: Buy at 1.38889    

Take Profit .1.39389    

Stop Loss 1.38489    

Risk/Reward 1.25

Profit & Loss Per Standard Lot = -$400/ +$500

Profit & Loss Per Micro Lot = -$40/ +$50

Categories
Forex Signals

USDCAD – Watch this Key Support

Description

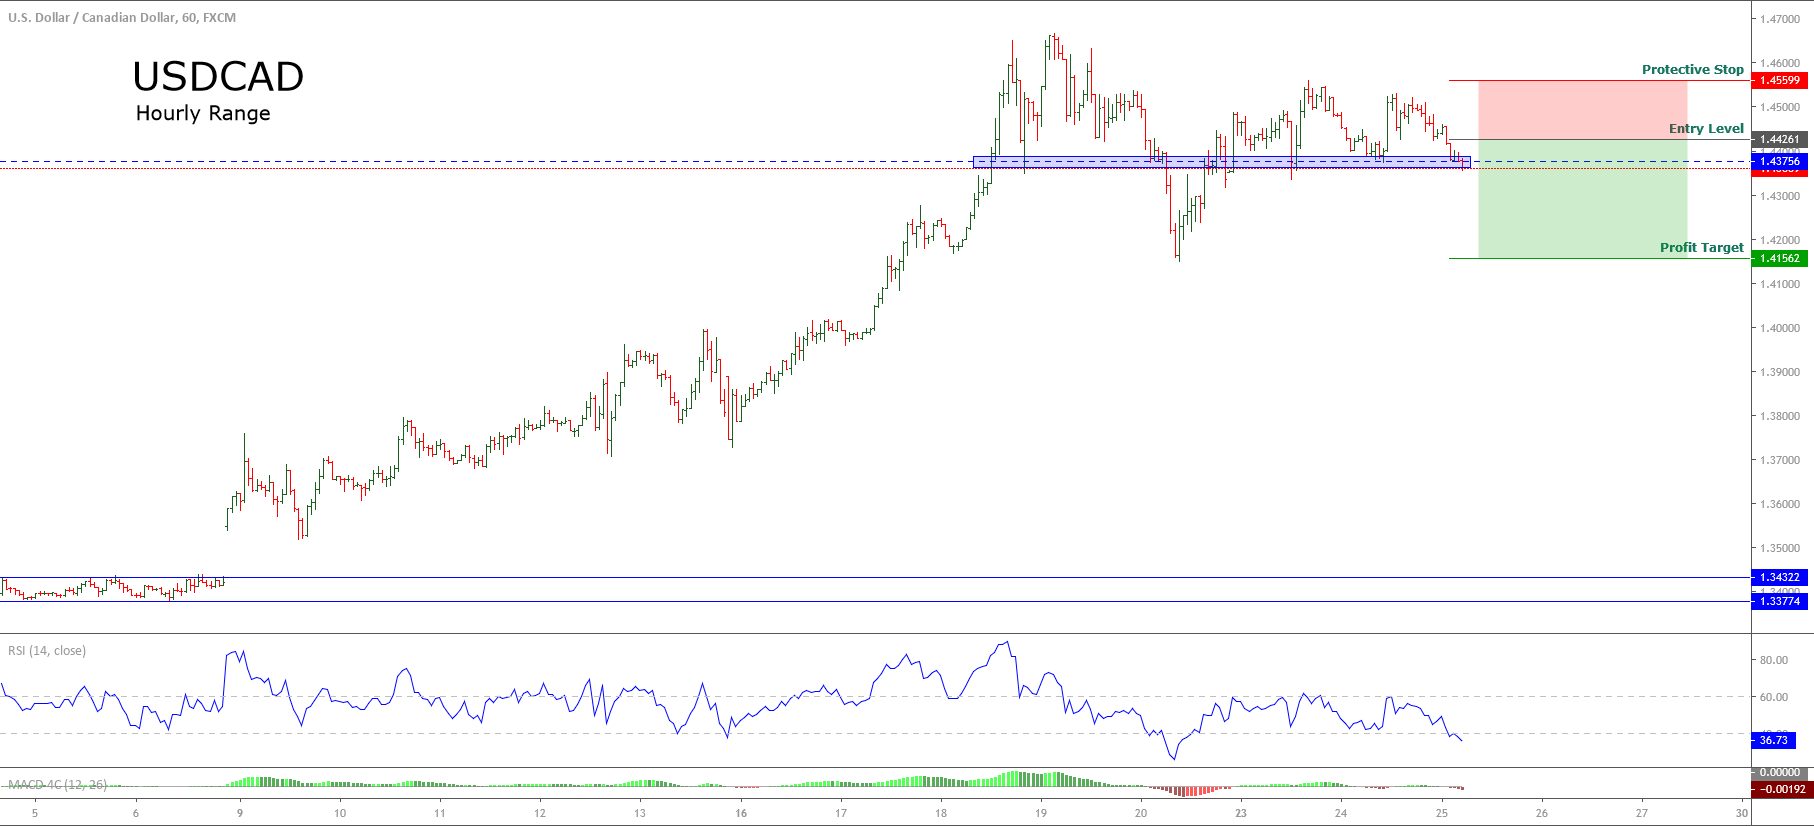
The USDCAD pair in its hourly chart shows the test of the 1.4375 level as short-term support, the three-times touch realized on the current trading week makes us suspect that the Loonie could see more drops soon.

For the short-term, we expect a limited bounce to 1.4426 from where the price could find fresh sellers waiting to activate their short positions with a potential profit target at 1,4156.

On the other hand, the RSI oscillator that moves below level 40 gives us the clue of the bearish bias, which supports our sell-side outlook.

The invalidation level of our bearish scenario locates at 1.4559.

Chart

Trading Plan Summary

Categories
Forex Assets

What Should You Know About USD/CAD Forex Pair?

Introduction

USDCAD is the short form for the US dollar against the Canadian dollar. USDCAD, just like the EURUSD, GBPUSD, AUDUSD, etc. is a major currency pair. In this pair, the US dollar is the base currency, and the Canadian dollar is the quote currency. Trading this currency pair is known as trading the “loonie” because it is the name for the Canadian one-dollar coin.

Understanding USD/CAD

The exchange price of USD/CAD is basically the value of 1 USD in terms of CAD. It is quoted as 1 US dollar per X* Canadian dollars. For example, if the value of USDCAD is 1.3300, it means that it takes 1.3300 Canadian dollars to buy one US dollar.

*X is the current market price of USDCAD

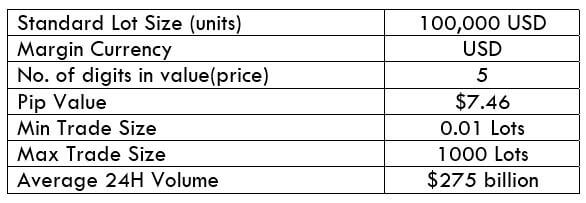
USD/CAD Specification

Spread

The difference between the bid price and the ask price mentioned by the broker is the spread. Typically, this differs from the type of account.

Spread on ECN: 0.7

Spread on STP: 1.2

Fees

There is a fee (commission) on every trade a trader takes. This again depends on the type of account registered by the user. There is no fee on the STP account, but a few pips on an ECN account.

Note: We are considering fees in terms of pips, not currency units.

Slippage

Sometimes a trader is executed at a different price from what he had intended. This variation in price is known as slippage. Slippage takes place when orders are executed as a market type, and it depends on the volatility of the currency pair and also the execution speed of the broker.

Trading Range in USD/CAD

Trading analysis is not all about predicting when the prices will rise and fall. Sometimes, even though a trader knows the prices are going to rise/fall, it might not be ideal to jump on the trade without the knowledge of volatility of the market. Volatility range plays a major role in managing the total cost of a trade. Hence, it is vital to know the minimum, average, and maximum pip movement in each timeframe to assess the trading costs.

Below is a table that depicts the minimum, average, and maximum volatility (pip movement) on different timeframes.

USD/CAD PIP RANGES

Procedure to assess Pip Ranges

  1. Add the ATR indicator to your chart
  2. Set the period to 1
  3. Add a 200-period SMA to this indicator
  4. Shrink the chart so you can assess a large time period
  5. Select your desired timeframe
  6. Measure the floor level and set this value as the min
  7. Measure the level of the 200-period SMA and set this as the average
  8. Measure the peak levels and set this as Max.

USD/CAD Cost as a Percent of the Trading Range

With the min, average, and max pip movement, the cost range is calculated in terms of percentage. This percentage has no unit and determines if the width of the cost. That is, if the percentage is high, the cost is high for the trade, and if the percentage is low, the cost is low too.

Below are two tables representing the range of cost for an ECN account and an STP account.

ECN Model Account

Spread = 0.7 | Slippage = 2 | Trading fee = 1

Total cost = Slippage + Spread + Trading Fee = 2 + 0.7 + 1 = 3.7

STP Model Account

Spread = 1.2 | Slippage = 2 | Trading fee = 0

Total cost = Slippage + Spread + Trading Fee = 2 + 1.2 + 0 = 3.2

The Ideal way to trade the USD/CAD

As mentioned earlier, the higher the percentage, the higher is the cost for a trade. Applying this idea to the above tables, it can clearly be inferred that the percentages are high on the minimum column. This means that the costs are high when the volatility of the currency pair is very feeble.

Similarly, the costs are considerably low when the volatility is quite high. However, this does not mean that trading during high volatility is the ideal way. This is because the volatility is quite risky to trade volatile markets. Therefore, one must trade during those times of day when the market volatility is around the mentioned average. The costs are decent enough, and the risk is maintained just fine.

Another point of consideration is that costs are reduced significantly when the slippage is made nil. This can be made possible by entering and exiting a trade by placing a pending/limit order instead of executing them by market.

Below is the same cost percentage table after making the slippage value to 0.

Now it is evident from the above table that slippage eats up a significant amount of cost on each trade. Hence, limit orders are the way to go.

Categories
Forex Market Analysis

Daily: New Episode of Trade War, Brexit Negotiations, U.S & South Korean Summit


NEWS COMMENTARY


U.S. President Donald Trump and South Korean leader Moon Jae-in will meet in New York on Monday to discuss how to move forward on a formal declaration of the end of the Korean War. Moon met with North Korean leader Kim Jong Un last week. “Chairman Kim expressed his wish to finish complete denuclearization at an early date and focus on economic development,” Moon said of his meeting with the North Korean leader in Pyongyang.

The Organization of the Petroleum Exporting Countries and Russia pushed back against a call last week by U.S. President Donald Trump to lower prices. “I do not influence prices,” Saudi Energy Minister Khalid al-Falih told reporters as OPEC and non-OPEC energy ministers gathered in Algiers. The group of oil producers is in discussion about rising output to counter falling Iranian supplies due to U.S. sanctions but made no formal recommendation for any additional supply boost at its Sunday meeting.

British Prime Minister Theresa May is under attack from several fronts over her Brexit plan. Members of her own party launched an alternative plan for leaving the European Union which would involve ditching her Chequers deal for a cleaner break with the bloc. The main opposition Labour Party are holding their annual conference where members will decide on whether to back a second referendum on the issue. There were also reports over the weekend of a possible snap election in November. Relations with the EU side, meanwhile, continue to be strained.


CHART ANALYSIS


OIL

Last week price continued its ranging move between support at 66.2-64.15 and resistance at 74.45-72.45. After having breached the ascending trend, price turned back to the support zone with a bounce from an ascending trend as shown on the daily chart below. As we expected, price is now “pin bar” reaching the main resistance zone with touching 72.45, we expect bullish momentum to build up towards the 74.45 level. and then wait for a bounce or a break to determine the next move


S&P 500

On the daily chart, the price has broken the key resistance level at 2875.58 and stayed above it to reinforce the bullish bias.

However, we should highlight significant reversal signs, including:

1. Elliot’s Wave 5 has formed;
2. AB=CD harmonic pattern in play.
3. A Wedge reversal pattern remains active.
4. RSI Divergence.

Thus, if price breaks through support at 2875.58 we should witness a correction towards 2797.82.


AUD/USD

On the daily chart, the Aussie is clearly reflecting a bearish bias as it descends down a channel that started forming since the beginning of this year; reaching support at 0.71 where some clear sign of reversal showed up.

We expect reversal/consolidation to develop further as:

1. Price has bounced from the support zone between 0.71-0.716.
2. An AB=CD harmonic pattern is rather suggestive.
3. A Wedge reversal pattern.
4. RSI divergence.

the price manages to stay above 0.7225,then it has the potential of reaching 0.733 and 0.745


USD/CAD

On the daily chart, we observe the Loonie to follow a descending channel since June this year, with a false 2 weeks reversal before continuing its way down.

As we expected before that the price fell further to 1.289 and meet the ascending trend line from March’s Low, coupled with the 200 Exponential Moving Average (EMA)

Now the price located at the key support of 1.289 besides the ascending trend line from the low of 2017. so, any bounce here would expose the price back to 1.312. and any break beneath these levels would continue the bearish bias to 1.272


USD/JPY

On the daily chart, as expected, price is moving upwards to the 113 target, leaving 112 as near-term support. We expect an extension towards the 113 area before resumption of the downside towards at least 109,75.


Categories
Forex Market Analysis

Weekly: Trade Tensions Continue; Italy “Crisis”; No Brexit Deal; FED to Raise Rates


NEWS COMMENTARY


US

Bets on Fed fund futures suggest that traders have already priced in the near-certainty of the next rate hike to occur this coming week. Yet the dollar reversed course, after last week posting the second trough in a descending peak-trough succession.

Also in the U.S., traders will get the opportunity to react to the latest data on consumer confidence, durable goods and gross domestic product.

OIL

A steady rise in U.S. oil output will gather pace in the next five years, OPEC said on Sunday, predicting that demand for the producer group’s crude will decline despite a growing appetite for energy fed by global economic expansion.

“Declining demand for OPEC crude is a result of strong non-OPEC supply in the 2017–2023 period, most notably from U.S. tight oil,” the Organization of the Petroleum Exporting Countries said in its long-term world oil outlook.

“The U.S. remains by far the most important source of medium-term supply growth, contributing … two-thirds of new supply, driven by surging tight oil output,” it said


EUR & GBP

The near term drag for the  single currency continues to be around the Italian debt. Recently, on August 31 to be more precise, the 2-year yield gilt on Italian bonds was as high as 1.465%, before plummeting to 0.63% after the presentation of the Italian budget prospect. It’s of no coincidence that the Euro rally in September coincided with a reduction of perceived short-term sovereign credit risk around Italy. If concerns around Italy are going to impact the Euro, it will be via another rise in short-term yields. We believe that there is no such a thing as a “crisis” surrounding Italian Credit’s situation; however, “news” do have the potential to print short-lived volatility to the markets.

The return of ‘hard Brexit’ fears resulting from the “surprisingly” fractious Salzburg summit obviously hit the British Pound hard at the end of the week. After Teresa May suggested that there would be a no deal Brexit, which of course causes a lot of fear. She stated that there are still a couple of points in the negotiation that divide the UK and the EU, but the spillover impact to the Euro was apparent as well. If odds of a disruptive exit from the EU increase, the uncertainty surrounding the impact to trade could be enough of a reason for the European Central Bank to eventually delay its monetary policy timeline for late next year.


AUD & NZD

While an easing of trade tensions between the United States and China may have been the catalysts behind last week’s rally in the Aussie and Kiwi, the possibility of renewed concerns could take the currencies lower early this week. This is because late Friday, China announced it was cancelling its meeting with the U.S., and wouldn’t resume negotiations until after the November U.S. mid-term elections.

The Australian Dollar, a proxy of China-related trades as well as gauge of risk sentiment, climbed to a three-week high last week. It also produced its biggest weekly advance in 14 months. Additionally, S&P Global Ratings revised its outlook on triple-A rated Australia to stable from negative on Friday, providing the Aussie with a further lift.

In its monetary policy minutes, the Reserve Bank of Australia (RBA) warned on risks to its outlook from U.S.-China trade tensions and weak wages, while reaffirming its next interest rate move would likely be a hike.

The RBA also said “Significant tensions” around trade policy are a “material risk” to the global outlook. Unemployment is expected to decline gradually toward 5 percent and wage growth is expected to increase gradually as spare capacity in the labor market is absorbed.

Although the Fed is widely expected to raise its benchmark interest rate on its next meeting, Australian and New Zealand Dollar traders will be primarily focused on the direction the Fed will chart ahead. Traders essentially want to know how aggressive the Fed will be in increasing rates in the future.

The 25-basis point increase to the federal funds rate is already priced into the market. The hike will push the funds target to 2 percent to 2.25 percent, where it last was more than 10 years ago.

Since the rate hike has already been factored into the dollar and the currencies, traders will be paying more attention to any information that shows how much more monetary tightening will be necessary to keep the economy (and inflation) healthy.

In New Zealand, the focus will be on business confidence and the interest rate and monetary policy decisions by the Reserve Bank of New Zealand (RBNZ). The Reserve Bank is widely expected to leave its benchmark interest rate at 1.75%.


CHART ANALYSIS


OIL

Last week price continued its ranging move between support at 66.2-64.15 and resistance at 74.45-72.45. After having breached the ascending trend, price turned back to the support zone with a bounce from an ascending trend as shown on the daily chart below. Price is now “pin bar” retesting this zone, as we expect bullish momentum to build up towards the 72.45-74.45 level.


S&P 500

On the daily chart, the price has broken the key resistance level at 2875.58 and stayed above it to reinforce the bullish bias.

However, we should highlight significant reversal signs, including:

1. Elliot’s Wave 5 has formed;
2. AB=CD harmonic pattern in play.
3. A Wedge reversal pattern remains active.
4. RSI Divergence.

Thus, if price breaks through support at 2875.58 we should witness a correction towards 2797.82.


AUD/USD

On the daily chart, the Aussie is clearly reflecting a bearish bias as it descends down a channel that started forming since the beginning of this year; reaching support at 0.71 where some clear sign of reversal showed up.

We expect reversal/consolidation to develop further as:

1. Price has bounced from the support zone between 0.71-0.716.
2. An AB=CD harmonic pattern is rather suggestive.
3. A Wedge reversal pattern.
4. RSI divergence.

the price manages to stay above 0.7225,then it has the potential of reaching 0.733 and 0.745


USD/CAD

On the daily chart, we observe the Loonie to follow a descending channel since June this year, with a false 2 weeks reversal before continuing its way down.

As we expected before that the price fell further to 1.289 and meet the ascending trend line from March’s Low, coupled with the 200 Exponential Moving Average (EMA)

Now the price located at the key support of 1.289 besides the ascending trend line from the low of 2017. so, any bounce here would expose the price back to 1.312. and any break beneath these levels would continue the bearish bias to 1.272


USD/JPY

On the daily chart, as expected, price is moving upwards to the 113 target, leaving 112 as near-term support. We expect an extension towards the 113 area before resumption of the downside towards at least 109,75.


Categories
Forex Market Analysis

Daily: Trade War Fears Fading; Strong Kiwi on NZ GDP Increase; U.K Retail Sales Printing Upward Momentum on the Pound


NEWS COMMENTARY


Markets extended their rally on Thursday as U.S.-China trade war fears were set aside and investors focused on bullish macroeconomic and corporate news.

Global markets appear to be shrugging off concerns over an escalating trade war between the U.S. and China

The British Pound got a strong boost following the surprisingly positive UK monthly retail sales figures, coming in to show 0.3% m/m growth in August as against a contraction of 0.2% anticipated. This coupled with some optimistic Brexit comments by the European Commission President Juncker and Irish Foreign Minister Simon Coveney remained supportive of the strong bid surrounding the cross.

In Europe, attention will be focused on an informal summit of European Union leaders in Austria on Thursday. Brexit and immigration are set to be the main points of discussion. U.K. Prime Minister Theresa May, under pressure at home and abroad to achieve a workable Brexit deal, has called for “goodwill” and flexibility from her EU counterparts. The future of the Irish/Northern Irish border remains a stumbling block in talks.

The New Zealand dollar jumped to three-week highs after strong domestic GDP data showed the country’s economy grew at the fastest pace in two years in the second quarter.

The Swiss National Bank (SNB) is maintaining its expansionary monetary policy, thereby stabilising price developments and supporting economic activity. Interest on sight deposits at the SNB remains at –0.75% and the target range for the three-month Libor is unchanged at between –1.25% and –0.25%. The SNB will remain active in the foreign exchange market as necessary, while taking the overall currency situation into consideration. Since the monetary policy assessment of June 2018, the Swiss franc has appreciated noticeably, against the major currencies as well as against emerging market currencies. The Swiss franc is highly valued, and the situation on the foreign exchange market is still fragile. The negative interest rate and the SNB’s willingness to intervene in the foreign exchange market as necessary remain essential in order to keep the attractiveness of Swiss franc investments low and thus ease pressure on the currency.


CHART ANALYSIS


OIL

Last week price continued its ranging move between support at 66.2-64.15 and resistance at 74.45-72.45. After having breached the ascending trend, price turned back to the support zone with a bounce from an ascending trend as shown on the daily chart below. Price is now “pin bar” retesting this zone, as we expect bullish momentum to build up towards the 72.45-74.45 level.


S&P 500

On the daily chart, the price has broken the key resistance level at 2875.58 and stayed above it to reinforce the bullish bias.

However, we should highlight significant reversal signs, including:

1. Elliot’s Wave 5 has formed;
2. AB=CD harmonic pattern in play.
3. A Wedge reversal pattern remains active.
4. RSI Divergence.

Thus, if price breaks through support at 2875.58 we should witness a correction towards 2797.82.


AUD/USD

On the daily chart, the Aussie is clearly reflecting a bearish bias as it descends down a channel that started forming since the beginning of this year; reaching support at 0.71 where some clear sign of reversal showed up.

We expect reversal/consolidation to develop further as:

1. Price has bounced from the support zone between 0.71-0.716.
2. An AB=CD harmonic pattern is rather suggestive.
3. A Wedge reversal pattern.
4. RSI divergence.

the price manages to stay above 0.7225,then it has the potential of reaching 0.733 and 0.745


USD/CAD

On the daily chart, we observe the Loonie to follow a descending channel since June this year, with a false 2 weeks reversal before continuing its way down.

We expect price to fall further to 1.289 and meet the ascending trend line from March’s Low, coupled with the 200 Exponential Moving Average (EMA)


USD/CHF

On the 4H chart, price is moving in a broadening wedge while breaking through the continuous Rectangle pattern at 0.9652. A correction has been already made to this level at the descending trend of the wedge. so, any reverse will take the price back to 0.956


USD/JPY

On the daily chart, price is moving upwards to the 113 target, leaving 112 as near-term support. We expect an extension towards the 113 area before resumption of the downside towards at least 109,75.


Categories
Forex Market Analysis

Daily -UK CPI Gives Sterling (short-lived?) Upward Momentum; NAFTA Talks Continues; European Summit Ahead


NEWS COMMENTARY


Trade war

Investors continue expectant on new developments over the U.S.-China trade war after the Trump administration said on Monday it will implement new tariffs of 10% on $200 billion of Chinese products on Sept. 24, with the tariffs to go up to 25% in January. China retaliated by threatening to implement duties on about $60 billion worth U.S. goods, as previously announced; which is lower than expected. Unless new information hits the wires, markets seem to have fully priced in the current status on the Trade War theme.

Housing Data Ahead

The focus on Wednesday’s economic calendar will be on home construction coming 12:30 GMT.

Housing starts are expected to  risen by 5.8% to an annual rate of 1.235 million in August.

OIL

Oil traded slightly lower on Wednesday as stockpile data from the American Petroleum Institute showed a 1.25 million barrels increase in weekly crude inventories.

Traders are waiting for the weekly government data from the Energy Information Administration with expectations for a draw of 2.741 million barrels.

UK CPI

Meanwhile sterling increased after the consumer price index came in 2.7% higher than expected 2.4%, with core CPI 2.1% v. 1.8% forecasted,  which is regarded by market participants as yet another reason for the BoE and its MPC peers to to expand their monetary policy normalization plan further with a new rate increase anytime soon.

Later on, according to Times, UK Prime Minister Theresa May is set to reject the improved offer by Chief EU Negotiator Michel Barnier for a solution on the Irish border.  Maintaining an open border between the Republic of Ireland and Northern Ireland (part of the UK) has been one of the thorniest issues in the Brexit negotiations. This could make the recent Sterling rally fade.

The report from the times comes a short time before European leaders including May convene for an unofficial summit in Salzburg, Austria, with Brexit being high on the agenda.

NAFTA

U.S. Trade Representative Robert Lighthizer and Canadian Foreign Minister Chrystia Freeland will meet later today in Washington as the two countries remain at odds over some key details on a deal. President Donald Trump has warned he would impose tariffs on Canada in the event of no deal being reached, while Congress remains unwilling to approve a Mexico-only pact.


CHART ANALYSIS


OIL

Last week price continued its ranging move between support at 66.2-64.15 and resistance at 74.45-72.45. After having breached the ascending trend, price turned back to the support zone with a bounce from an ascending trend as shown on the daily chart below. Price is now “pin bar” retesting this zone, as we expect bullish momentum to build up towards the 72.45-74.45 level.


S&P 500

On the daily chart, the price has broken the key resistance level at 2875.58 and stayed above it to reinforce the bullish bias.

However, we should highlight significant reversal signs, including:

1. Elliot’s Wave 5 has formed;
2. AB=CD harmonic pattern in play.
3. A Wedge reversal pattern remains active.
4. RSI Divergence.

Thus, if price breaks through support at 2875.58 we should witness a correction towards 2797.82.


AUD/USD

On the daily chart, the Aussie is clearly reflecting a bearish bias as it descends down a channel that started forming since the beginning of this year; reaching support at 0.71 where some clear sign of reversal showed up.

We expect reversal/consolidation to develop further as:

1. Price has bounced from the support zone between 0.71-0.716.
2. An AB=CD harmonic pattern is rather suggestive.
3. A Wedge reversal pattern.
4. RSI divergence.

the price manages to stay above 0.7225,then it has the potential of reaching 0.733 and 0.745


USD/CAD

On the daily chart, we observe the Loonie to follow a descending channel since June this year, with a false 2 weeks reversal before continuing its way down.

We expect price to fall further to 1.289 and meet the ascending trend line from March’s Low, coupled with the 200 Exponential Moving Average (EMA)


USD/CHF

On the 4H chart, price is moving in a broadening wedge while breaking through the continuous Rectangle pattern at 0.9652. A correction has been already made to this level at the descending trend of the wedge. so, any reverse will take the price back to 0.956


USD/JPY

On the daily chart, price is moving upwards to the 113 target, leaving 112 as near-term support. We expect an extension towards the 113 area before resumption of the downside towards at least 109,75.


Categories
Forex Market Analysis

Daily: Trade was Escalates; RBA Gives the Australian Dollar Upwards Momentum


NEWS COMMENTARY


U.S. President Donald Trump announced on Monday that the U.S. will put 10% tariffs on $200 billion in Chinese goods, which will go up to 25% at the end of the year.

Trump added that “if China takes retaliatory action against our farmers or other industries, we will immediately pursue phase three, which is tariffs on approximately $267 billion of additional imports.” “We have been very clear about the type of changes that need to be made, and we have given China every opportunity to treat us more fairly,” he said in the statement. “But, so far, China has been unwilling to change its practices.”


China said on Tuesday that it had no choice but to retaliate against new U.S. trade tariffs, raising the risk that U.S. President Donald Trump could soon impose duties on virtually all of the Chinese goods that America buys. The Chinese commerce ministry’s statement came hours after Trump said he was imposing 10 percent tariffs on about $200 billion worth of imports from China, and threatened duties on about $267 billion more if China retaliated against the U.S. action.

The brief statement gave no details on China’s plans, but Foreign Ministry spokesman Geng Shuang told a news briefing later that the U.S. steps have brought “new uncertainty” to talks between the two countries. “China has always emphasized that the only correct way to resolve the China-U.S. trade issue is via talks and consultations held on an equal, sincere and mutually respectful basis. But at this time, everything the United States does not give the impression of sincerity or goodwill,” he added. Geng said he would not comment on “hypotheticals” such as what measures Beijing might consider apart from tariffs on U.S. products, saying only that details would be released at the appropriate time.

The Aussie rise in today’s session was caused by the upbeat approach used by the RBA in the Minutes published earlier today, i.e., while there was no strong case for near-term adjustment in policy, the next move in the lending rate is more likely to be an increase. Furthermore, despite of persistent risks related to abroad uncertainty and the slow recovery in labor wages, the bank explicitly vowed for a stronger AUD as supportive of domestic growth. However, upward momentum is likely to be temporary due to another key economic indicator, the CPI, which print was also released at -0.6% v.-0.7% and 2.0% prior; which lessens pressure on the RBA to push for a faster monetary policy normalization.


CHART ANALYSIS


OIL

Last week, price continued its ranging move between support at 66.2-64.15 and resistance at 74.45-72.45. After having breached the ascending trend, price turned back to the support zone with a bounce from an ascending trend as shown on the daily chart below. Price is now “pin bar” retesting this zone, as we expect bullish momentum to build up towards the 72.45-74.45 level.


S&P 500

On the daily chart, the price has broken the key resistance level at 2875.58 and stayed above it to reinforce the bullish bias.

However, we should highlight significant reversal signs, including:

1. Elliot’s Wave 5 has formed;
2. AB=CD harmonic pattern in play.
3. A Wedge reversal pattern remains active.
4. RSI Divergence.

Thus, if price breaks through support at 2875.58 we should witness a correction towards 2797.82.


AUD/USD

On the daily chart, the Aussie is clearly reflecting a bearish bias as it descends down a channel that started forming since the beginning of this year; reaching support at 0.71 where some clear sign of reversal showed up.

We expect reversal/consolidation to develop further as:

1. Price has bounced from the support zone between 0.71-0.716.
2. An AB=CD harmonic pattern is rather suggestive.
3. A Wedge reversal pattern.
4. RSI divergence.

Consequently, if the price manages to stay above 0.7225, it has the potential of reaching 0.733 and 0.745.


USD/CAD

On the daily chart, we observe the Loonie to follow a descending channel since June this year, with a false 2 weeks reversal before continuing its way down.

We expect price to fall further to 1.289 and meet the ascending trend line from March’s Low, coupled with the 200 Exponential Moving Average (EMA)


USD/CHF

On the 4H chart, price is moving in a broadening wedge while breaking through the continuous Rectangle pattern at 0.9652. A correction may occur at this level again before digging down to the next support 0.956


USD/JPY

On the daily chart, price is moving upwards to the 113 target, leaving 112 as near-term support. We expect an extension towards the 113 area before resumption of the downside towards at least 109,75.


Categories
Forex Market Analysis

FOMC statement, Canadian growth, New Zealand data


news commentary


The meeting of the Federal Reserve’s will be the least surprising. They just raised interest rates in June; we know that the Fed probably won’t make any changes this month. However, the Fed will announce further tightening which is required because the labour market is healthy and economic activity is expanding at a solid rate. Inflation is on the rise, manufacturing and service-sector activity is accelerating so there’s no reason to postpone their plan to tighten again.

The weaker-than-expected Japan economic data are giving the bond prices a push higher. That movement has been triggered by the Bank of Japan decision to hold interest rate policy unchanged. While adding forward guidance that would maintain low-interest rates for an extended period. They also cut its inflation forecast.


Sources said that the White House was about to set higher tariffs on $200 billion in Chinese imports, maybe igniting a new round of trade conflicts.

Reports claim that President Donald Trump is thinking of putting tariffs of 25%, instead of 10%, in a statement that may come early on Wednesday.


Stronger-than-expected Canadian GDP growth led the Canadian dollar higher for the third day in a row. Besides Canada’s economy grew 0.5% in May


The New Zealand dollar failed to have a little breath because business confidence weakened, which followed by a decline in Q2 employment report.


chart analysis


US INDEX

On the daily chart, the price has bounced from the red resistance zone for the third time to shape the reversal triple top.

Price has recently formed another reversal pattern to assure the bearish bias with the wedge.

Followed by a break beneath an ascending trend on RSI, the index is settled down at the ascending trend line, if it’s broken, the price will have its way back to the support zone 93.2-92.6


AUD/USD

On the daily chart, the pair reached back the green support zone again to shape a double top pattern

Followed by divergence on RSI, our bullish view is still the same: if the price manages to still above the support area and the key level 0.7455, it will be heading towards the combination of levels of descending trend, ascending channel and resistance zone at 0.7655-0.774.


NZD/USD

On the daily chart, the price retested the green support zone 0.675-0.6695, followed by divergence in RSI.

An AB=CD harmonic pattern has been shaped to reinforce the bounce.

If the price could break above the key level at 0.6845, the price will be supposed to head back to the top of the descending channel with the resistance zone at 0.697-0.703 only if it manages to hold above the green zone


USD/CAD

On the daily chart,  the price has broken main support areas, as it closed beneath the key support 1.309, and beneath the ascending trend line

A wedge has been shaped and successfully confirmed after breaking it, besides a GARTLEY harmonic pattern to assure the bearish momentum

Followed by divergence on RSI, the price is expected to reach the next support 1.289


USD/JPY

On the daily chart, the price is located at a good long-buy position according to the support of 111.3, the retest of the broken descending trend, 23.6% Fibonacci level and the ascending channel.

Followed by engulfing candle, the price is expected to go further  back to the level 113.15


Categories
Forex Educational Library

Forex.Academy 2018-2019 Outlook – CAD Group


Summary


Forex Daily News: In this post, we analyse the Canadian Dollar group against their main currencies. As a summary, the second half of the year and 2019, we foresee a corrective movement in the Canadian currency, which could come supported for a correction in oil prices to, then, give way to a new rally. After this correction, our central vision for the Canadian Dollar is a new appreciation scenario.

Additionally, we observe that it is likely that GBP and EUR would show the best performance against the CAD; on the opposite side, the Japanese currency and the Swiss Franc could have the worst performance against the Canadian Dollar.


USDCAD

The USDCAD is developing a complex corrective structure of a second bullish impulsive wave. The corrective structure has a bearish bias, which could find support in the area between 1.29607 to 1.28371. The key level to watch out is 1.2884, this level should convert on a critical pivot level (HHL).


EURCAD

EURCAD cross in the short-term has a bearish bias, probably could see new lows in 1.50 zone. In the mid-term, the cross moves sideways as a complex corrective. In the long-term, we foresee that the EURCAD could find fresh lows in the area between 1.47822 to 1.45662, from where the cross could start a new rally as a fifth bullish wave. Invalidation level is at 1.4442.


GBPCAD

Probably the GBPCAD cross shows the clearest movement of the CAD Group. The price is moving in a bearish A-B-C sequence, which could find support at 1.6410 level, from where the price could create a new connector and then initiate a rally. The new bullish sequence has a target the area between 1.8533 and 1.9266. Invalidation level is at 1.5837.


CADJPY

The CADJPY cross has been commented in a previous analysis, and we maintain the main idea which consists in to seek only long positions with a long-term profit target in the area between 94.69 and 95.30. Is probably that the cross makes a retrace to the area between 85.45 to 83.73 from where we could find new opportunities to incorporate us into the trend. Invalidation level is located at 82.17.


CADCHF

In the CADCHF cross, the lemma is “Buy the Dips” or “Watch the Breakout.” CADCHF is running sideways in an upper degree consolidation structure. The key level to control is 0.7636, after the breakout of this level, we expect more upsides to the zone between 0.7992 and 0.8245. In case that the price makes a false breakdown to the area between 0.7394 and 0.7289, it could be an attractive opportunity to look for the long side. Invalidation level is at 0.7124.


NZDCAD

In the long-term, NZDCAD is running sideways and making lower highs. The long-term pivot level is at 0.8640. For this cross, we expect only short positions; if the price makes a bullish move, the potential movement is limited to the area between 0.9253 to 0.9461. The long-term target area is between 0.8401 to 0.8098.


AUDCAD

Probably the AUDCAD cross is the less attractive to trade. As we can see in the weekly chart, it is running sideways since the second half of 2013. The price is moving inside a bearish cycle, which could find support in the “long-term pivot level” at 0.8919, from where AUDCAD could start to bounce. The invalidation level for the bearish cycle is at 1.0397.


Forex Daily News: Finally, as a technical note, considering that the AUDCAD is mostly bearish, by correlation, the CAD should perform better than the AUD for the period foreseen.

Categories
Forex Market Analysis

Central Banks meetings, China conditions to negotiate


news commentary


At the beginning of the week, investors have something of the calm before the storm as they brace for monetary events risk.

The Bank of Japan is expected to hold rates unchanged on Tuesday, the BoJ may carry the most influence when it announces its latest monetary policy decision. This is because several reports have indicated that the central bank is considering a decrease in its stimulus program.  a shift in this policy will not only lead to a spike in Japanese bond yields but it will also have a global effect that will lead to further tightening in credit conditions. However, the latest inflation report indicates that the BoJ might not make any significant changes on this front and will instead try to calm markets.

The Federal Reserve is also likely to leave rates unmoved when it announces its decision on Wednesday, with economists saying that recent comments from President Donald Trump will have no impact on policy and the Fed will continue sending the message that more rate hikes are on the way.

On Thursday, the Bank of England is expected to raise rates for the first time since November, But according to the recent fall in inflation and continued Brexit uncertainty, they might deliver a hike and hint that it’s the only one expected for 2018.


On another hand, Chinese Foreign Minister Wang Yi said his country would be willing to resume trade negotiations with the U.S. if the Trump administration “took a less combative” approach to talks.

President Trump said on Twitter yesterday that he would be willing to ‘shut down’ the government if Democrats do not support funding plans for his wall along the border with Mexico. The tweet came after a meeting last week in the White House between Trump, House Speaker Paul Ryan and Senate Majority Leader Mitch McConnell to discuss how to avoid an Oct. 1 shutdown, a month before elections that will determine control of Congress.


chart analysis


US INDEX

On the daily chart, the price has bounced from the red resistance zone for the third time to shape the reversal triple top.

Price has recently formed another reversal pattern to assure the bearish bias with the wedge.

Followed by a break beneath an ascending trend on RSI, the index is settled down at the ascending trend line, if it’s broken, the price will have its way back to the support zone 93.2-92.6


AUD/USD

On the daily chart, the pair reached back the green support zone again to shape a double top pattern

Followed by divergence on RSI, our bullish view is still the same: if the price manages to still above the support area and the key level 0.7455, it will be heading towards the combination of levels of descending trend, ascending channel and resistance zone at 0.7655-0.774.


NZD/USD

On the daily chart, the price retested the green support zone 0.675-0.6695, followed by divergence in RSI.

An AB=CD harmonic pattern has been shaped to reinforce the bounce.

If the price could break above the key level at 0.6845, the price will be supposed to head back to the top of the descending channel with the resistance zone at 0.697-0.703 only if it manages to hold above the green zone


USD/CAD

On the daily chart,  the price has broken main support areas, as it closed beneath the key support 1.309, and beneath the ascending trend line

A wedge has been shaped and successfully confirmed after breaking it, besides a GARTLEY harmonic pattern to assure the bearish momentum

Followed by divergence on RSI, the price is expected to reach the next support 1.289


USD/JPY

On the daily chart, the price is located at a good long-buy position according to the support of 111.3, the retest of the broken descending trend, 23.6% Fibonacci level and the ascending channel.

All these factors may boost the price further to go back to the level 113.15 and more if the price witnesses a suitable price action from these levels.


Categories
Forex Market Analysis

Daily Market Update: Upbeat Data From Australia, UK CPI, Powell Set To Be Hawkish Again


 News Commentary


Fed Chairman Jerome Powell supported the Dollar by bullish comments, which affirmed expectations about the central bank’s possible interest rate moves this year.

In Congressional testimony on Tuesday and Wednesday, Powell said he believed the United States was in steady growth for years, and carefully played down the risks to the U.S. economy of an escalating trade conflict.

U.S. President Donald Trump’s top economic advisor, Larry Kudlow, said that he believed Chinese President Xi Jinping has blocked any progress on a deal to end the duelling in U.S. and Chinese tariffs.

“China could end U.S. tariffs by providing a more satisfactory approach” and “taking steps that other countries are also calling for”, Kudlow said.


The U.K. was pulled down yesterday on weak inflation data, with the CPI reading 2.4%, less than the expectation of 2.6%, causing market expectations for a BoE August rate hike to ease slightly from 77% to 68%


Earlier, the Australian economy added 50.9K jobs in June, better than the estimated forecast of 16.7K
More importantly, the full-time jobs rose by 41.2 K following a 20.6K drop registered in May. Meanwhile, the jobless rate came in at a seasonally adjusted rate of 5.4% as expected.


 Chart Analysis


US INDEX

On the daily chart, the price has returned to the red resistance zone with shaping before the reversal double top.

The price has formed another reversal pattern to assure the bearish bias with the wedge.

Followed by a break beneath an ascending trend on RSI, the index is supposed to make its way back to the support zone 93.2-92.6


AUD/USD

On the daily chart, the pair bounced back from the resistance 0.7455 to retest the green support zone again.

Followed by divergence on RSI, our bullish view is still the same: Heading towards the combination of levels of descending trend, ascending channel and resistance zone at 0.7655-0.774.


NZD/USD

On the daily chart, the price retested the green support zone 0.682-0.6775, followed by divergence in RSI.

An AB=CD harmonic pattern has been shaped to reinforce the bounce.

The price is supposed to head back to the top of the descending channel with the resistance zone at 0.697-0.703.


USD/CAD

On the daily chart, the price reached the support of 1.3085 with the ascending trend line from the low of April.

On the other hand, the price has shaped a GARTLEY harmonic pattern with a reversal wedge, bouncing from the 78.6% Fibonacci level, followed by a divergence in RSI.

So, If the price breaks above the resistance 1.3225, it would head back to 1.34.

If it breaks beneath the wedge and the support of 1.3085, it would head back to 1.289.


AUD/JPY

On the daily chart, as we expected before, the price has reached the red resistance zone at 83.9-85.95.

It’s a crucial area that if the price bounces back from, it will continue its sideways movement to the support zone 81.2-80.5.

If the price breaks above it, it will head new levels to the next resistance zone 85.5-85.95.


Categories
Forex Market Analysis

Daily Market Update: Euro CPI, Great Britain & Canadian GDP


News Commentary


The Euro CPI Flash Estimate is set to exceed the last reading at 1.9%, to reach the ECB target of 2.0%.

This could give much volatility to the Euro after the negative market reaction to the last ECB meeting.


In Great Britain, the focus will be on the final release of the Q1 UK GDP. There is a chance it may get revised up closer to the Bank of England forecast of 2.3% vs 2.1% actual.


According to a report by Reuters, Canada is set to announce financial aid for their steel industry and workers on Friday.

“Canada will hit back against U.S. tariffs on its steel and aluminium by offering affected companies and workers up to C$800 million ($603 million) in aid”, a source familiar with the matter said on Thursday.

This could shake the market and affect the US dollar badly, as all sides stick to tit for tat tariffs.


Chart Analysis


AUD/USD

On the daily chart, the price has reached the support zone of 0.7325-0.7365.

The pair is supposed to find some breath powered by divergence on RSI to reach the key resistance of 0.7515, where the descending trend from the high of February is located.


USD/JPY

On the daily chart, as we expected, the pair bounced from the descending trend from the high of 2017 and the key resistance of 111.1.

As you can see on the chart, the price is moving according to Elliot waves. By forming the A & B waves, we are waiting for the next move down to hit the C level which is located at the support of 106.9 and also to meet the ascending trend from the low of 2016.

So, a possible bounce has started and on its way.


USD/CAD

As we expected before, the price has reached the key resistance level of 1.334.

We can see the price has reversed from a very strong selling area according to many factors, including key resistance level, 78.6% Fibonacci, the upper level of the reversal wedge, forming the Gartley harmonic pattern, and overbought in RSI.

So, with this engulfing bar, the price will be led down to the support zone at 1.309-1.299.


CAD/JPY

On the daily chart, the price had a bearish rally from the key resistance of 86.95 to reach the support of 81.15, near the green support zone.

The pair bounces with an engulfing bar from the 78.6% Fibonacci level.

A Gartley harmonic pattern has been shaped at these same levels, with an oversold area on RSI.

All these factors enhance the bounce bias for the price to reach firstly the resistance at 85.5, then the retest at 86.95


Categories
Forex Market Analysis

Daily Market Update: RBNZ Left Interest Rates At 1.75%, BoC Governor Poloz Speech


News Commentary


Uncertainty remained after White House economic adviser Larry Kudlow told Fox Business Network later on Wednesday that Trump’s announced plan did not indicate a softened stance on China.

However, there are still tit-for-tat battles which are affecting the markets.


The Reserve Bank of New Zealand (RBNZ) maintained the Official Cash Rate (OCR) at 1.75%and has been forecasting no changes until late next year.

According to Governor Adrian Orr, inflation is likely to increase in the near term due to higher fuel prices. Beyond that, it is expected to gradually rise to the 2% annual target, resulting from capacity pressures.


The Bank of Canada Governor, Stephen Poloz, stated that the impact of the US trade fight and tighter mortgage rules will “figure prominently” in the Central Bank’s July’s interest rate decision.

He also approved market reactions to May data, flagging the hanging situation on NAFTA, but also kept an optimistic sentiment.


Chart Analysis


AUD/USD

On the daily chart, the price has reached the support zone of 0.7325-0.7365.

The pair is supposed to find some breath powered by divergence on RSI to reach the key resistance of 0.7515, where the descending trend from the high of February is located.


USD/CAD

As we expected before, the price has reached the key resistance level of 1.334.

As we can see, the price has reversed from a very strong selling area according to many factors, including key resistance level, 78.6% Fibonacci, the upper level of the reversal wedge, forming the Gartley harmonic pattern, and overbought in RSI.

So, any bounce there will lead the price down to the support zone at 1.309-1.299.


AUD/JPY

As we expected before, the price has reached the support zone 81.2-80.5 as the price is moving sideways.

So, the price is expected to retest the head of the pattern to again reach the levels 84-84.4.


Categories
Forex Market Analysis

Daily Market Update: RBNZ to Announce Official Cash Rate, Low ANZ Business Confidence


News Commentary


Trade tensions still weigh on the markets to cut the traders appetite to risk, to boost the safe havens like the Yen and the Swiss Franc.

However, following the trade adviser Peter Navarro, Trump signalled he may take a less confrontational approach, and that any measures would not just target China, to calm down concerns about the administration’s plans to hit Chinese investment in U.S. tech.


Jonathan Haskel, the Bank of England policymaker said there may be more slack in the UK economy, which would weaken the case for interest rate hikes.

He added that the central bank has scope to cut rates slightly in case of an economic downturn.


Disappointing data came from New Zealand after low ANZ business confidence index came in at -39. The last reading was -27.2.

A big move is awaiting for the NZD as the RBNZ will announce its official cash rate at 09:00 GMT. They are widely expected to not change the rate, to remain stable at 1.75%.

All eyes will be on rate statement with any clue to possible rate hike soon, any dovish sentiment will put more pressure on the currency.


Chart Analysis


USD INDEX

As we expected on the daily chart, the price had reached the key resistance at 95.5 and bounced back from it, powered by divergence on RSI.

The price also had shaped a reversal double top pattern.

So, the index is supposed to get back down to the support zone again of 93.2-92.6, then start its journey to the C wave.


AUD/USD

On the daily chart, the price has reached the support zone of 0.7325-0.7365.

The pair is supposed to find some breath powered by divergence on RSI to reach the key resistance of 0.7515, where the descending trend from the high of February is located.


USD/JPY

On the daily chart, as we expected, the pair bounced from the descending trend from the high of 2017 and the key resistance of 111.1.

As you can see on the chart, the price is moving according to Elliot waves. By forming the A & B waves, we are waiting for the next move down to hit the C level which is located at the support of 106.9 and also to meet the ascending trend from the low of 2016.

So, a possible bounce has started and on its way.


USD/CAD

As we expected before, the price has reached the key resistance level of 1.334.

As we can see the price has reversed from very strong selling area according to many factors, including key resistance level, 78.6% Fibonacci, the upper level of the reversal wedge, forming the Gartley harmonic pattern, and overbought in RSI.

So, the price is expected to go down to the support zone at 1.309-1.299.


NZD/USD

On the daily chart, the price has reached the crucial support zone of 0.682-0.6785, with bearish momentum.

Followed by divergence, if we see a price action there, then the price is expected to get back up again to retest the resistance zone at 0.698-0.703.

If the price breaks this zone, we could see a 0.667 level.


AUD/JPY

As we expected before, the price has reached the support zone 81.2-80.5 as the price is moving sideways.

So, the price is expected to retest the head of the pattern to again reach the levels of 84-84.4.


Categories
Forex Market Analysis

Weekly Market Update: Trade War Tensions, BoE Kept Interest Rates at Same Level, RBNZ to Announce Its Official Cash Rate

It has been a busy week for news, looking forward to seeing much volatility this week according to the consequences of the releases last week and the upcoming week’s data


News Commentary


USD

Tensions between the U.S. and China continue, as the two largest economies in the world faced a tit-for-tat over trade tariffs. Earlier this week, U.S. President Donald Trump threatened to impose tariffs on another $200 billion of Chinese goods. China could strike back at blue-chip firms including Caterpillar and Boeing who rely on China for revenue.

The dollar also eased following the release of soft U.S. manufacturing data which came in at 19.9, lower than the expected 28.9.

But demand for the dollar continued to be boosted after Federal Reserve Chairman Jerome Powell reiterated on Wednesday that the case for gradual rate hikes remains strong.

All eyes will be on Tuesday’s CB consumer confidence which is expected to reach 127.6, and Core Durable Goods Orders on Wednesday which is expected to reach 0.5%, and most importantly, the final GDP on Thursday with a forecast of 2.2%, same as the last one.


EUR

The European Union imposed tariffs on about $3.4 billion of U.S. imports on Friday, including motorcycles, orange juice and cranberry sauce. The tariffs have added to tensions as investors fear an outright global trade war between the U.S.and other major countries.

On the other hand, French and German business activity in June came in higher than expected, easing concerns of a slowdown in the Eurozone.
Good news for Greece is that the Eurozone creditors finally agreed a debt relief deal that will help Greece exit its bailout program.
Following late-night talks in Luxembourg, the Eurogroup agreed to hand Greece a final loan tranche of €15 billion.


GBP

The Pound strengthened after the Bank of England left interest rates steady, but the vote for a rate hike by the bank’s chief economist came with a surprise that supported the probability for the next hike in the August meeting.

The MPC voted 6-3 to hold rates flat, but the fact that there were three dissenting votes cast in favour of a rate hike today was a bit more hawkish than what was expected

All eyes will be on the current account on Friday with an expectation of -18.2B


NZD

New Zealand GDP growth dropped by 0.1% compared to the previous two quarters, coming in at just 0.5%, lower than the previous reading of 0.6%.

It’s a busy week for the New Zealand dollar with ANZ business confidence, which measures economic health with the last reading of -27.2.

The big event will be the official cash rate on Wednesday with the expectation to be left steady at 1.75%.


CAD

Disappointing inflation and retail sales from Canada damaged the loonie lower across the board, sending the odds of a July BoC rate hike to 55% from 68% earlier in the week. Meanwhile the odds of an August BoE hike rise to 70%.

All eyes will be on GDP on Friday with the last reading of 0.3%.


Chart Analysis


USD INDEX

As we expected on the daily chart, the price had reached the key resistance at 95.5 and bounced back from it, powered by divergence on RSI & B wave (Elliot waves).

So, the index is supposed to get back down again to the support zone 93.2-92.6, then start its journey to the C wave.


AUD/USD

On the daily chart, the price has reached the support of 0.7325, with a pin bar candle followed by engulfing one.

The pair is supposed to find some breath powered by divergence on RSI to reach the key resistance of 0.7515, where the descending trend from the high of February is located.


USD/JPY

On the daily chart, as we expected, the pair had broken the ascending channel followed by bouncing from the descending trend from the high of 2017 and the key resistance of 111.1.

The price also broke the support of 110.05 to reach the next support 108.15, to then get back up again from this level to retest the level at 110.05.

As you can see on the chart, the price is moving according to Elliot waves. By forming the A & B waves, we are waiting for the next move down to hit the C level which is located at the support of 106 and also to meet the ascending trend from the low of 2016.

So, a bounce has started and on its way.


AUD/NZD

On the daily chart, as we expected before, the price had made its way up to targets at the resistance zone of 1.0815-1.0865, boosted by a BAT harmonic pattern.

The price has already made its retracement as we expected it to.

Reaching the support zone and shaping the Gartley harmonic pattern, the price is supposed to continue its bullish movement up to the 1.1045 level after forming hammer & engulfing candles respectively.


USD/CAD

As we expected before, the price has reached the key resistance level of 1.334

As we can see the price is located at very strong selling area according to many factors, including key resistance level, 78.6% Fibonacci, the upper level of the reversal wedge, forming the Gartley harmonic pattern, and overbought in RSI.

So, any bounce there will lead the price down to the support zone at 1.309-1.299.


NZD/USD

On the daily chart, the price has reached a combination of support levels, with a support zone of 0.682-0.6785, an ascending trend line from the low of 2007, and finally with Bat harmonic pattern.

The price is expected to get back up again to retest the resistance zone at 0.698-0.703.


AUD/JPY

As we expected before, the price has reached the support zone 81.2-80.5 as the price is moving sideways.

So, with this engulfing candle, we expect the price to retest the head of the pattern to again reach the levels 84-84.4.


Categories
Forex Market Analysis

Daily Market Update: Trade Tensions Continue, OPEC Meeting


News Commentary


Tensions between the U.S. and its allies continue, as India joined China and the European Union in retaliation against steel and aluminium tariffs. As the biggest buyer of almonds, India raised its tariff on U.S. almonds by 20%

The European Union imposed tariffs on about $3.4 billion of U.S. imports on Friday, including motorcycles, orange juice and cranberry sauce. The tariffs have added to tensions as investors fear an outright global trade war between the U.S.and other major countries.

On the other hand, French and German business activity in June came in higher than expected, easing concerns of a slowdown in the Eurozone.
Good news for Greece is that the Eurozone creditors finally agreed a debt relief deal that will help Greece exit its bailout program.
Following late-night talks in Luxembourg, the Eurogroup agreed to hand Greece a final loan tranche of €15 billion.

The Organisation of the Petroleum Exporting Countries (OPEC) is gathering in Vienna amid calls from the United States, China and India to cool down the price of crude and prevent an oil deficit that would hurt the global economy.

Saudi Arabia and non-OPEC Russia have said a production increase of about 1 million barrels per day (bpd) or around 1 per cent of global supply had become a near-consensus proposal for the group and its allies.

Although a final decision may not arrive until Saturday when OPEC officials are scheduled to meet with their non-member allies who formed part of the 18-month accord to curb production by 1.8 million barrels per day.


Chart Analysis


NZD/USD

On the daily chart, the price has reached a combination of support levels, with a support zone of 0.682-0.6785, an ascending trend line from the low of 2007, and finally with a BAT harmonic pattern.

The price is expected to get back up again to retest the resistance zone at 0.698-0.703.


AUD/JPY

As we expected before, the price has reached the support zone 81.2-80.5 as it is moving sideways now.

So, with this engulfing candle, we expect the price to retest the head of the pattern to reach the levels of 84-84.4 again.


USD/JPY

On the daily chart, as we expected the pair had broken the ascending channel followed by bouncing from the descending trend from the high of 2017 and the key resistance of 111.1.

The price also broke the support of 110.05 to reach the next support 108.15, to then get back up again from this level to retest the level at 110.05.

As you can see on the chart, the price is moving according to Elliot waves. By forming the A & B waves, we are waiting for the next move down to hit the C level which is located at the support of 106 and also to meet the ascending trend from the low of 2016.

So, a bounce has started and on its way.


AUD/NZD

On the daily chart, as we expected before, the price had made its way up to targets at the resistance zone 1.0815-1.0865, boosted by a BAT harmonic pattern.

The price has already made its retracement as we expected it to.

Reaching the support zone and shaping the Gartley harmonic pattern, the price is supposed to continue its bullish movement up to the 1.1045 level after forming hammer & engulfing candles respectively.


USD/CAD

As we expected before, the price has reached the key resistance level 1.334.

As we can see the price is located at very strong selling area according to;- key resistance level, 78.6% Fibonacci, the upper level of the reversal wedge, forming the “Gartley” harmonic pattern, and overbought in RSI.

So, any bounce there will lead the price down to the support zone at 1.309-1.299.


Categories
Forex Market Analysis

Daily Market Update: Great Britain to Vote About Brexit, Market Reaction to Trade Tensions


News Commentary


Trade tensions between the U.S. and China still remain on investors minds as the two largest economies in the world faced over trade tariffs.

Stocks stumbled on Tuesday after U.S. President Donald Trump threatened to impose tariffs on another $200 billion of Chinese goods if China refused “to change its practices,” he said.

But currency markets had breathed a sigh of relief after Beijing signalled its tolerance of a stronger currency by fixing a stronger daily midpoint than expected. Safe-haven currencies such as the Swiss franc and the Japanese yen were still well-supported, though.

“Market volatility remains very low and the headline risks from trade concerns should push that higher,” said Hans Redeker, global head of currency strategy at Morgan Stanley.

Economists don’t expect the BoE to raise rates on Thursday, and some not optimistic about their forecasts for a rate rise in August, which would be only the central bank’s second increase since the 2008 financial crisis.

The House of Commons was to vote on the EU withdrawal bill, the government’s flagship piece of Brexit legislation, later in the day.

The government is seeking to defeat an attempt to give MPs a “meaningful vote” before Britain could leave the EU without a deal.

The vote is coming at a time of growing investor nervousness that Brexit negotiations could fail to reach an agreement.


Chart Analysis


US INDEX

As expected, after breaking the wedge reversal pattern, the price met the broken ascending trend from the high of 2017, meeting the broken ascending channel, heading the B level of the ABC Elliot waves. Divergence on RSI followed by breaking the upper line as shown.

According to Elliot, we can see a spike from that level to 97.9.


USD/JPY

On the daily chart, as we expected the pair had broken the ascending channel followed by bouncing from the descending trend from the high of 2017 and the key resistance of 111.1.

The price also broke the support of 110.05 to reach the next support 108.15, to then get back up again from this level to retest the level at 110.05.

As you can see on the chart, the price is moving according to Elliot waves. By forming the A & B waves, we are waiting for the next move down to hit the C level which is located at the support of 106 and also to meet the ascending trend from the low of 2016.

So, a bounce has started and on its way.


USD/CAD

On the daily chart, the price eventually broke the resistance zone of 1.309-1.299, followed by a break of the ascending trend line from the high of 2016, with an engulfing candle.

As we expected that, we need another confirmation bullish candle to assure the long bias, the price is expected to reach 1.34.


AUD/NZD

On the daily chart, as we expected before, the price had made its way up to targets at the resistance zone 1.0815-1.0865, boosted by a BAT harmonic pattern.

The price has already made its retracement as we expected it to.

Reaching the support zone and shaping the Gartley harmonic pattern, the price is supposed to continue its bullish movement up to the 1.1045 level after forming hammer & engulfing candles respectively.


Categories
Forex Market Analysis

Daily Market Update: US tariffs on China and its Consequences


News Commentary


Investors are reacting negatively to the escalating trade war between China and the US, and if the tit-for-tat tariffs continue, the euro could continue to head south. The US announced a 25 per cent tariff on $50 billion of Chinese goods on Friday. After China responded with an identical move on US imports, President Trump has now threatened to impose 10 per cent tariffs on some $200 billion in Chinese goods. Not surprisingly, China has threatened to retaliate to this latest move. Trump has vowed to take action on the $375 billion trade deficit that the US has with China, claiming that the latter is guilty of unfair trade practices. With the first of the US tariffs scheduled to take effect on July 6 and no signs that any side will blink first, the markets should be preparing for stormy weather ahead.

After the speech from ECB President Mario Draghi, in the eurozone, the current account surplus narrowed for a third straight month, dropping to EUR 28.4 billion. This fell short of the estimate of EUR 30.3 billion.

The US building permits have released with a decrease of 1.3M, lower than expectation 1.35M


Chart Analysis


US INDEX

As expected, After breaking the reversal pattern ‘wedge’, the price met the broken ascending trend from the high of 2017, meeting the broken ascending channel, heading the B level of the ABC Elliot waves. Divergence on RSI followed by breaking the upper line as shown.

According to Elliot, we can see a spike from that level to 97.9.


USD/JPY

On the daily chart, as we expected the pair had broken the ascending channel followed by bouncing from the descending trend from the high of 2017 and the key resistance of 111.1.

The price also broke the support of 110.05 to reach the next support 108.15, to then get back up again from this level to retest the level at 110.05.

As you can see on the chart, the price is moving according to Elliot waves. By forming the A & B waves, we are waiting for the next move down to hit the C level which is located at the support of 106 and also to meet the ascending trend from the low of 2016.

So, a bounce has started and on its way.


USD/CAD

On the daily chart, the price eventually broke the resistance zone of 1.309-1.299, followed by a break of the ascending trend line from the high of 2016, with an engulfing candle.

As we expected that, we need another confirmation bullish candle to assure the long bias, the price is expected to reach 1.34.


AUD/JPY

As we expected, the pair had formed a wedge which had been broken to reach the support zone 81.2-80.5, to make the price ranges in sideways between 80.5 & 84.4.

The price is about to have a bearish bias according to:

bouncing from the resistance zone 84.4-93.9, breaking continuous ‘flag’ patterns, bouncing from the moving average 200, and ABC Elliot waves

So, the price is expected to head for 76.25.


AUD/USD

As we expected, the price will have a strong bearish rally to the support of 0.7155 and this has been prepared according to five causes;-

the descending trend line from the high of February, breaking of the flag, the resistance zone, and eventually the B level of the ABC Elliott waves, and most importantly the break beneath the key support 0.7415.

So, the C wave is on its way after a possible retracement to the 0.7155 level


Categories
Forex Market Analysis

Daily Market Update: US tariffs, Divergence Between Central Banks


 News Commentary


Tariffs between the United States and China raised fears that an escalating trade war could weigh on global markets.

U.S. President Donald Trump announced tariffs on Friday on $50 billion of Chinese imports, with China retaliating immediately by slapping duties on American exports, which pushed the Yen higher as the safe haven flows away.

Oil prices dropped before OPEC meeting on Friday.

Investors are also estimating the impact of tightening monetary policy by central banks after the U.S. Federal Reserve increased the interest rate last week and the European Central Bank said it planned to end its bond-purchase program at the year-end.

This divergence between the two banks pushed the dollar higher in front of the whole basket of currencies.


Chart Analysis


US INDEX

After breaking the reversal pattern ‘wedge’, the price met the broken ascending trend from the high of 2017, meeting the broken ascending channel, heading the B level of the ABC Elliot waves. Divergence on RSI followed by breaking the upper line as shown.

According to Elliot, we can see a spike from that level to 97.9.


USD/JPY

On the daily chart, the pair had broken the ascending channel followed by bouncing from the descending trend from the high of 2017 and the key resistance of 111.1.

The price also broke the support of 110.05 to reach the next support 108.15, to then get back up again from this level to retest the level at 110.05.

As you can see on the chart, the price is moving according to Elliot waves. By forming the A & B waves, we are waiting for the next move down to hit the C level which is located at the support of 106 and also to meet the ascending trend from the low of 2016.

So, a bounce is expected to be on its way.


USD/CAD

On the daily chart, the price eventually broke the resistance zone of 1.309-1.299, followed by break the ascending trend line from the high of 2016, with an engulfing candle.

But we can also see that it touches the top of the “horn” & “wedge” patterns.

So, we only need another confirmation bullish candle to assure the long bias to reach 1.334.


AUD/JPY

As we expected, the pair had formed a wedge which had been broken to reach the support zone 81.2-80.5, to make the price ranges in sideways between 80.5 & 84.4.

The price is about to have a bearish bias according to:

bouncing from the resistance zone 84.4-93.9, forming continuous ‘flag’ patterns, bouncing from the moving average 200, and ABC Elliot waves

So, the price is expected to head for 76.25.


AUD/USD

As we expected, the price will have a strong bearish rally to the support of 0.7155 and this has been prepared according to five causes;-

the descending trend line from the high of February, breaking of the flag, the resistance zone, and eventually the B level of the ABC Elliott waves

so, the C wave is on its way after a possible retracement


Categories
Forex Market Analysis

Weekly Market Update: ECB Left Interest Rate, US-China Trade War, Great Britain Official Bank Rate

We had a busy last week with announcements from central banks (FED & ECB), also there was the conflict at the G7 summit, the consequences of Singapore summit.

So, we will discuss the upcoming results from all this data, along with the most important releases of the next week.


News Commentary


USD

The FED delivered the widely expected rate hike overnight, with a hawkish statement and economic projections. FOMC raised the Fed funds to 2.00%.

The Trump administration has slapped a 25% tariff on 818 Chinese goods, with a total value of up to $50B.

This action comes on top of the recent decision to impose steel and aluminium tariffs on many US allies, including Canada, Mexico and the European Union. Predictably, those countries countered with $20B in tariffs on US goods.

U.S. President Donald Trump and North Korean leader Kim Jong Un signed a ‘comprehensive’ deal at a historic summit aimed at the denuclearisation of the Korean peninsula.

Trump said the meeting in Singapore had gone “better than anybody could have expected” and he anticipated that the denuclearisation process would start “very, very quickly”, adding he had formed a “special bond” with Kim and the relationship with North Korea would be very different.


EUR

The regulator plans to complete the quantitative easing program in December 2018. The Central Bank left interest rates unchanged and said that it is not going to raise them until mid-2019. The speech by Mario Draghi, President of the European Central Bank, also hit the euro. The official said that the slowdown in the economic recovery in the Eurozone was not temporary, but also reached a global level. The ECB lowered the forecast for economic growth in the Eurozone from 2.4% to 2.1% this year.


GBP

Positive data came from Great Britain to enhance the sterling, with the retail sales reading 1.3%, higher than the expected 0.5%.

On Thursday the Bank of England is expected to leave all monetary policy levers untouched and the market will then look for clues on future moves from the MPC voting pattern and the subsequent press release. Governor Carney may also give his thoughts on UK Q2 GDP after this week’s data looks likely to weigh on second-quarter growth.


AUD

The Australian Dollar was trading as the weakest currency last week as it is pressured by its own data miss as well as weaker than expected China data. Australia employment rose 12k seasonally adjusted in May, below the consensus of 19.2k. The unemployment rate dropped to 5.4%, as participation rate also dropped to 65.5%.

All eyes will on the monetary policy meeting on Tuesday 1:30 GMT


Chart Analysis


US INDEX

After breaking the reversal pattern “wedge”, the price met the broken ascending trend from the high of 2017, meeting the broken ascending channel, heading the B level of the ABC Elliot waves, divergence on RSI followed by breaking the upper line as shown.

According to Elliot, we can see a spike from that level to 97.9.


USD/JPY

On the daily chart, the pair had broken the ascending channel followed by bouncing from the descending trend from the high of 2017 and the key resistance of 111.1.

The price also broke the support 110.05 to reach the next support 108.15 to get back up again from this level to retest the level at 110.05.

As you can see on the chart, the price is moving according to Elliot waves. By forming the A & B waves, we are waiting for the next move down to hit the C level which is located at the support of 106 and also to meet the ascending trend from the low of 2016.

So, a bounce is expected to be on its way.


USD/CAD

On the daily chart, the price eventually broke the resistance zone 1.309-1.299 followed by break the ascending tend line from the high of 2016, with an engulfing candle.

But also we can see that it touches the top of the “horn” & “wedge” patterns.

So, we only need another confirmation bullish candle to assure the long bias to reach 1.334.


AUD/USD

As we expected, the price will have a strong bearish rally to the support 0.7155. This has been prepared according to five causes;-

The descending trend line from the high of February, breaking of the flag, the resistance zone, and eventually the B level of the ABC Elliott waves

so, the C wave is on its way


 AUD/JPY

As we expected, the pair had formed a wedge which had been broken to reach the support zone 81.2-80.5, to make the price ranges sideways between 80.5 & 84.4.

The price is about to have a bearish bias according to:

bouncing from the resistance zone 84.4-93.9, forming continuous ‘flag’ patterns, bouncing from the moving average 200, and ABC Elliot waves

So, the price is expected to head for 76.25.


AUD/NZD

On the daily chart, as we expected before, the price had made its way up to targets at the resistance zone 1.0815-1.0865, boosted by a BAT harmonic pattern.

The price has already made its retracement as we expected it to.

Reaching the support zone and forming the Gartley harmonic pattern, the price is supposed to continue its bullish movement up to the 1.1045 level after any possible price action from these levels.


Categories
Forex Market Analysis

Daily Market Update: FED Decision To Rate Hike, ECB Meeting


News Commentary


The FED delivered the widely expected rate hike overnight, with a hawkish statement and economic projections. FOMC raised the Fed funds to 2.00%.

Greenbacks have been erased due to fresh concerns about the U.S.-China trade relations were seen weighing on the dollar, which is often sought in times of political tensions.

U.S. President Donald Trump will meet with his top trade advisors on Thursday to decide whether to activate threatened tariffs on billions of dollars in Chinese goods, a senior Trump administration official said.

The ECB rate decision and press conference is the biggest focus today with Eurozone inflation picked up again in May. The ECB should be much more comfortable to end the asset purchase program later this year.

Stopping the program right after September is certainly Euro positive.

The Australian Dollar is trading as the weakest currency today as it is pressured by its own data miss as well as weaker than expected China data. Australia employment rose 12k seasonally adjusted in May, below the consensus of 19.2k. The unemployment rate dropped to 5.4%, as participation rate also dropped to 65.5%.

From China, retail sales rose 8.5% in May, slowed from 9.4% and missed the expectation of 9.6%. Industrial production slowed to 5.8%, down from 7.0% and missed expectation of 7.0%.

Positive data came from Great Britain to enhance the sterling, with the retail sales reading 1.3%, higher than the expected 0.5%.


Chart Analysis


US INDEX

As we can see on the daily chart, the price had bounced from the key resistance level of 95.15. The price is expected to go down to meet the 92.6 level according to many reasons:

Breaking the reversal pattern “wedge”, meeting the broken ascending trend from the high of 2017, meeting the broken ascending channel, heading the B level of the ABC Elliot waves, divergence on RSI followed by breaking the upper line as shown.

According to Elliot, we can see a spike from that level to 97.9.


USD/JPY

On the daily chart, the pair had broken the ascending channel followed by bouncing from the descending trend from the high of 2017 and the key resistance of 111.1.

The price also broke the support 110.05 to reach the next support 108.15 to get back up again from this level to retest the level at 110.05.

As you can see on the chart, the price is moving according to Elliot waves. By forming the A & B waves, we are waiting for the next move down to hit the C level which is located at the support 106 and also to meet the ascending trend from the low of 2016.

So, a bounce is expected to be on its way.


AUD/JPY

On the daily chart, the pair had formed a wedge which had been broken to reach the support zone 81.2-80.5, to make the price ranges in sideways between 80.5 & 84.4.

The price is about to have a bearish bias according to:

reaching the resistance zone 84.4-93.9, forming continuous pattern “flag”, near the moving average 200, and ABC Elliot waves

So, watch for any price action in these levels to head for 76.25.


USD/CAD

The pair is about to take a bearish rally to the 1.274 level according to many reasons:

locating in the resistance zone 1.3-1.38, near the descending trend line from the high of 2016, shaping the reversal pattern “wedge”, and finally the harmonic pattern “Gartley.

So watch for any price action in these levels.


AUD/USD

On the daily chart, a reversal pattern wedge has been broken to reach 0.747 to form a flag pattern.

The price is expected to go up to the resistance zone, then it will have a strong bearish rally to the support 0.7155 according to five causes;-

the descending trend line from the high of February, the upper edge of the flag, the retest of the broken wedge, the resistance zone, and eventually the B level of the ABC Elliott waves


Categories
Forex Market Analysis

Daily Market Update: Market Is Waiting For FOMC and ECB Meeting


News Commentary


Trading is hesitant early on Wednesday as investors awaited further guidance from the Federal Reserve on future U.S. rate rises to shed some light on how many times interest rates may go up this year.

Investors have shifted their focus to the two-day Federal Open Market Committee (FOMC) meeting that starts Wednesday. With a rate hike almost fully priced in, markets are focusing on whether the Fed will signal hiking rates four times this year, rather than the three times as indicated earlier in the year.


The Euro rose to three-week highs against the dollar last week after hawkish ECB comments fueled speculation that the bank could signal its intention to start unwinding its bond purchasing program.

Tomorrow’s meeting will hold some extra news about when the ECB cuts its quantitative easing program.


The Bank of Japan will also review its monetary policy at a two-day meeting that ends on Friday, but will likely keep its policy intact.


Chart Analysis


AUD/JPY

On the daily chart, we can see that the price is moving sideways between the resistance zone 84.4-84.15 and the support zone 81.2-80.5.

The price has now entered the red resistance area with a possible bounce.

Also, watch the ascending channel which has formed to be considered as a flag pattern. The pattern boosts the original trend which is a down one.

So, any bounce now with price action will push the price to fall.


AUD/NZD

On the daily chart, as we expected before, the price had made its way up to targets at the resistance zone 1.0815-1.0865, boosted by a BAT harmonic pattern.

The price has already made its retracement as we expected it to.

Bouncing from the support zone and the broken descending trend from the high of 2017, the price is supposed to continue its bullish movement up to the 1.1045 level.

But the price may correct to the level 1.0755 to find support by the Gartley harmonic pattern.


USD/CAD

On the daily chart, as expected, the price made its way into the resistance zone of 1.289-1.298, almost reaching the key resistance at 1.309, with an approach from the descending trend line starting from the high of 2015, and the upper edge of the horn pattern.

The price is near the key resistance level 1.309, any bounce back from there would take the price firstly to the support level at 1.274.


AUD/USD

On the daily chart, the pair had a correction to the 0.758 level supported by the resistance level 0.766 and the descending line from the high of 2018.

The price has bounced from the 0.758 level near the edge of the ascending channel.

So if the price could break the resistance 0.766 and the descending line, it may reach 0.774 which is a level with a combination of the upper edge of the channel and the broken uptrend.


Categories
Forex Market Analysis

Daily Market Update: Market’s Reaction to US-North Korea Summit and Central Banks Meetings


News Commentary


U.S. President Donald Trump and North Korean leader Kim Jong Un signed a ‘comprehensive’ deal at a historic summit aimed at the denuclearisation of the Korean peninsula.

Trump said the meeting in Singapore had gone “better than anybody could have expected” and he anticipated that the denuclearisation process would start “very, very quickly”, adding he had formed a “special bond” with Kim and the relationship with North Korea would be very different.


On the other hand, Trump upset the Group of Seven’s efforts to show a united front, choosing to back out of a previous joint communique. The action drew criticism from Germany and France, and Trump called Canadian Prime Minister Justin Trudeau “very dishonest and weak.”

However, “markets are generally shrugging off the G7 trainwreck,” said Ray Attrill, head of Forex strategy at the National Australia Bank.

Instead, markets are looking ahead to a busy week.

Policy meetings of the U.S. Federal Reserve and the European Central Bank, as well as a Brexit bill vote in the British parliament, have the whole show.

The U.S. Federal Reserve is widely expected to raise interest rates this week while investors are focused on whether the central bank will hint at raising rates a total of four times in 2018.

All eyes will be also on the U.S. CPI at 12:30 GMT with expectations to remain steady at 0.2%.


The European Central Bank also meets to decide whether it could signal intentions to start unwinding its massive bond purchasing program.

Helping calm markets were comments from Italy’s new coalition government that it had no intention of leaving the Eurozone and planned to cut debt.


Chart Analysis


US INDEX

On the daily chart, the price had successfully broken the ascending trend from the high of 2017, along with the resistance level to eventually reach the key resistance of 95.15 to bounce back from there. The price shaped a reversal pattern (wedge) which closed with a break beneath it.

With divergence in RSI, the price is expected to have a correction to the key support at 92.6 which is located at the broken trend too, only if it breaks the support of 93.4.


USD/JPY

On the daily chart, the pair had broken the ascending channel followed by bouncing from the descending trend from the high of 2017 and the key resistance of 111.1.

The price also broke the support 110.05 to reach the next support 108.15 to get back up again from this level to retest the level at 110.05.

As you can see on the chart, the price is moving according to Elliot waves. By forming the A & B waves, we are waiting for the next move down to hit the C level which is located at the support 106.9.

So, any bounce now with price action will enhance the down run.


AUD/JPY

On the daily chart, we can see that the price is moving sideways between the resistance zone 84.4-84.15 and the support zone 81.2-80.5.

The price now has entered the red resistance area with a possible bounce.

Also, watch the ascending channel which has formed to be considered as a flag pattern. The pattern boosts the original trend which is a down one.

So, any bounce now with price action will push the price to fall.


AUD/NZD

On the daily chart, as we expected before, the price had made its way up to targets at the resistance zone 1.0815-1.0865, boosted by a BAT harmonic pattern.

The price has already made its retracement as we expected it to.

Bouncing from the support zone and the broken descending trend from the high of 2017, the price is supposed to continue its bullish movement up to the 1.1045 level.

But the price may correct to the level 1.0755 to find support by the Gartley harmonic pattern.


USD/CAD

On the daily chart, as expected, the price made its way into the resistance zone of 1.289-1.298, almost reaching the key resistance at 1.309, with an approach from the descending trend line starting from the high of 2015, and the upper edge of the horn pattern.

The price has already bounced beneath the key resistance and the resistance zone and got back above it again, but it couldn’t go much further to form a pinbar, to take the price firstly to the support level at 1.274.


AUD/USD

On the daily chart, the pair had a correction to the 0.758 level supported by the resistance level 0.766 and the descending line from the high of 2018.

The price has bounced from the 0.758 level near the edge of the ascending channel.

So if the price could break the resistance 0.766 and the descending line, it may reach 0.774 which is a level with a combination of the upper edge of the channel and the broken uptrend.


NZD/USD

On the daily chart, as we expected before, the pair had bounced from the ascending trend, along with breaking a descending trend, to reach our target at the resistance zone at 0.697-0.702.

According to the BAT-shaped harmonic pattern we expected, the price has already reached our first target and is expected to reach the B point at the next resistance zone of 0.7155-0.7185.

The price may have a little retracement before hitting this target.


Categories
Forex Market Analysis

Weekly Market Update: G7 & US-North Korea Summit, Central Banks Meetings


News Commentary


We have a busy week coming up. What will follow the consequences of the G7 summit, and what news will be released regarding the US-North Korea summit. We also have the Federal Central Bank meeting (FOMC), the European Central Bank meeting, and the Bank of Japan meeting who all have to decide their rates and give hints about the economic polices.


US

U.S. President Donald Trump threatened to stop trading with countries that do not reduce barriers to American exports.

Trump said on Saturday that he had instructed his representatives not to endorse the G7 communique and that his administration was considering imposing tariffs on automobiles, further raising the spectre of a trade war that has unnerved Washington’s top allies.

U.S. President Donald Trump and North Korean leader Kim Jong Un are expected to land in Singapore on Sunday within hours of each other in advance of a historic summit over the reclusive country’s arsenal of nuclear weapons.

The unprecedented meeting comes after weeks of sometimes-contentious discussions and was briefly cancelled amid North Korean outrage over messaging from some U.S. advisers.

The Federal Reserve is almost certain to raise interest rates by a quarter point for a second time this year at the conclusion of its two-day policy meeting at 18:00 GMT on Wednesday.


EUR

The Euro strengthened on rising bets that the European Central Bank (ECB) may soon announce it will start shooting off its massive bond purchase program.

The central bank’s chief economist Peter Praet, a close ally of President Mario Draghi, said the ECB would discuss next week whether to end bond purchases later this year.

Some reports said that at its next policy meeting this week, the ECB could declare on when its quantitative easing program would end.

“The market will start to focus on the ECB from now on. Politics in Italy and Spain will play second fiddle as we now have new governments in both countries,” said Kazushige Kaida, head of foreign exchange at State Street Bank.


AUD

The RBA Board decided to leave the cash rate unchanged at 1.50%.

“The recent data on the Australian economy has been consistent with the Bank’s central forecast for GDP growth to pick up, to average a bit above 3% in 2018 and 2019. Business conditions are positive and non-mining business investment is increasing. Higher levels of public infrastructure investment are also supporting the economy. Stronger growth in exports is expected. One continuing source of uncertainty is the outlook for household consumption. Household income has been growing slowly, and debt levels are high” declared media section of the RBA.

The Australian dollar was supported by GDP growth numbers, which rose 1% in the first quarter of 2018, beating the estimated 0.8%. On an annualised basis, growth was 3.1%, above both the expected 2.8% and the previous quarter’s 2.4% gain.


JPY

The Bank of Japan (BoJ) is seen keeping policy on hold at the conclusion of its two-day rate review on Friday, including a pledge to keep short-term interest rates at minus 0.1%.

BoJ Governor Haruhiko Kuroda will hold a press conference afterwards to discuss the decision.

Kuroda has previously said the central bank will telegraph to markets how it plans to exit from ultra-easy policy when conditions for hitting its price goal become robust.


Chart Analysis


US INDEX

On the daily chart, the price had successfully broken the ascending trend from the high of 2017, along with the resistance level to eventually reach the key resistance 95.15 to bounce back from there. The price shaped a reversal pattern (wedge) which closed with a break beneath it.

With divergence in RSI, the price is expected to have a correction to the key support at 92.6 which is located at the broken trend too.


USD/JPY

On the daily chart, the pair had broken the ascending channel followed by bouncing from the descending trend from the high of 2017 and the key resistance of 111.1.

The price also broke the support 110.05 to reach the next support 108.15 to get back up again from this level to retest the level at 110.05.

As you can see on the chart, the price is moving according to Elliot waves. By forming the A & B waves, we are waiting for the next move down to hit the C level which is located at the support 106.9.

So, any bounce now with price action will enhance the down run.


AUD/JPY

On the daily chart, we can see that the price is moving sideways between the resistance zone 84.4-84.15 and the support zone 81.2-80.5.

The price has now entered the red resistance area with a possible bounce.

Also, watch the ascending channel which has formed to be considered as a flag pattern. The pattern boosts the original trend which is a down one

So, any bounce now with price action will push the price to fall.


AUD/NZD

On the daily chart, as we expected before, the price had made its way up to targets at the resistance zone 1.0815-1.0865, boosted by a BAT harmonic pattern.

The price has already made its retracement as we expected it too.

Bouncing from the support zone and the uptrend from the low of April, and the broken descending trend from the high of 2017, the price is supposed to continue its bullish movement up to the 1.1045 level.


USD/CAD

On the daily chart, as expected, the price made its way into the resistance zone of 1.289-1.298, almost reaching the key resistance at 1.309, with an approach from the descending trend line starting from the high of 2015, and the upper edge of the horn pattern.

The price has already bounced beneath the key resistance and the resistance zone and got back above it again, but it couldn’t go much further to form a pinbar, to take the price firstly to the support level at 1.274.


AUD/USD

On the daily chart, the price had a false break beneath the support zone 0.75-0.7535 with a pin bar. That enhances the AB=CD harmonic pattern, with breaking a descending channel. The pair rose with an engulfing candle above the support zone.

Along with divergence in RSI, the price is ready for the next move up to 0.774 which is a level with a combination of the lower trend line from the high of 2018 and the broken uptrend.

The price may have a little retracement before heading this target.


NZD/USD

On the daily chart, as we expected before, the pair had bounced from the ascending trend with an engulfing candle, along with breaking a descending trend, to reach our target at the resistance zone at 0.697-0.702.

According to the BAT-shaped harmonic pattern we expected, the price has already reached our first target and is expected to reach the B point at the next resistance zone of 0.7155-0.7185.

The price may have a little retracement before heading this target.


Categories
Forex Market Analysis

Daily Market Update: G7 Summit


News Commentary


All eyes will be on the upcoming G-7 meeting in Quebec as the summit comes at a time of escalating trade tensions between the U.S and some of its major trading partners. Last week, all finance ministers from six members of the G-7 criticised the US Treasury Secretary Steve Mnuchin. The trouble started last week, when the Trump administration imposed tariffs on Canada, Mexico and the European Union. Mexico and Canada are hugely dependent on American demand for their products, which is why over the last few months they’ve shown willingness to grant the US more favourable conditions within the North America Free Trade Area (Nafta). The trade tension is sure to dominate the summit, if these leaders cannot reach an equivalent point, investors could dump their risks to head for safe-haven assets.


On the other hand, there’s a release of big date for Canada, at 12:30 GMT. There’s  Employment Change with a forecast of 19.1K, and Unemployment Rate with a forecast of 5.8%. These figures could give the Canadian some fresh air.


Chart Analysis


US INDEX

On the daily chart, the price had successfully broken the ascending trend from the high of 2017, along with the resistance level to eventually reach the key resistance 95.15 to bounce back from there. The price shaped a reversal pattern (wedge) which closed with a break beneath it.

With divergence in RSI, the price is expected to have a correction to the key support at 92.6 which is located at the broken trend too.


USD/JPY

On the daily chart, the pair had broken the ascending channel followed by bouncing from the descending trend from the high of 2017 and the key resistance of 111.1.

The price also broke the support 110.05 to reach the next support 108.15 to get back up again from this level to retest the level at 110.05.

As you can see on the chart, the price is moving according to Elliot waves. By forming the A & B waves, we are waiting for the next move down to hit the C level which is located at the support 106.9.

So, any bounce now with price action will enhance the down run.


AUD/JPY

On the daily chart, we can see that the price is moving sideways between the resistance zone 84.4-84.15 and the support zone 81.2-80.5.

The price now has entered the red resistance area with a possible bounce.

Also, watch the ascending channel which has formed to be considered as a flag pattern. The pattern boosts the original trend which is a down one

So, any bounce now with price action will push the price to fall


AUD/NZD

On the daily chart, as we expected before, the price had made its way up to targets at the resistance zone 1.0815-1.0865, boosted by a BAT harmonic pattern.

The price has already made its retracement as we expected it too.

Bouncing from the support zone and the uptrend from the low of April, and the broken descending trend from the high of 2017, the price is supposed to continue its bullish movement up to the 1.1045 level.


USD/CAD

On the daily chart, as expected, the price made its way into the resistance zone of 1.289-1.298, almost reaching the key resistance at 1.309, with an approach from the descending trend line starting from the high of 2015, and the upper edge of the horn pattern.

The price has already bounced beneath the key resistance and the resistance zone and got back above it again, but it couldn’t go much further to form a pinbar, to take the price firstly to the support level at 1.274.


AUD/USD

On the daily chart, the price had a false break beneath the support zone 0.75-0.7535 with a pin bar. That enhances the AB=CD harmonic pattern, with breaking a descending channel. The pair rose with an engulfing candle above the support zone.

Along with divergence in RSI, the price is ready for the next move up to 0.774 which is a level with a combination of the lower trend line from the high of 2018 and the broken uptrend.

The price may have a little retracement before hitting this target


NZD/USD

On the daily chart, as we expected before, the pair had bounced from the ascending trend with an engulfing candle, along with breaking a descending trend, to reach our target at the resistance zone at 0.697-0.702.

According to the BAT-shaped harmonic pattern we expected, the price has already reached our first target and is expected to reach the B point at the next resistance zone of 0.7155-0.7185.

The price may have a little retracement before hitting this target


Categories
Forex Market Analysis

Daily Market Update: RBA Left Rate Unchanged, Great Britain Services PMI Rose


News Commentary


Sterling

Sterling was boosted by data showing that the British economy is exhibiting signs of recovering from its recent slowdown, reviving expectations that the Bank of England might raise interest rates in August. Services PMI rose to 54.0, higher than the expected 52.9.

RBA

The RBA Board decided to leave the cash rate unchanged at 1.50%.

“The recent data on the Australian economy has been consistent with the Bank’s central forecast for GDP growth to pick up, to average a bit above 3% in 2018 and 2019. Business conditions are positive and non-mining business investment is increasing. Higher levels of public infrastructure investment are also supporting the economy. Stronger growth in exports is expected. One continuing source of uncertainty is the outlook for household consumption. Household income has been growing slowly, and debt levels are high” declared media section of the RBA.

US

All eyes will be on the US ISM Non-Manufacturing PMI at 02:00 GMT with a forecast of 57.9.


 Chart Analysis


US INDEX

On the daily chart, the price had successfully broken the ascending trend from the high of 2017, along with the resistance level to eventually reach the key resistance 95.15 to bounce back from there. The price shaped a reversal pattern (wedge) which closed with a break beneath it.

With divergence in RSI, the price is expected to have a correction to the key support at 92.6 which is located at the broken trend too.


USD/CAD

On the daily chart, as expected, the price made its way into the resistance zone of 1.289-1.298, almost reaching the key resistance at 1.309, with an approach from the descending trend line starting from the high of 2015, and the upper edge of the horn pattern.

The price has already bounced beneath the key resistance and the resistance zone and got back above it again, but it couldn’t go much further to form a pinbar, to take the price firstly to the support level at 1.274.


AUD/USD

On the daily chart, the price had a false break beneath the support zone 0.75-0.7535 with a pin bar. That enhances the AB=CD harmonic pattern, with breaking a descending channel. The pair rose with an engulfing candle above the support zone.

Along with divergence in RSI, the price is ready for the next move up to 0.774 which is a level with a combination of the lower trend line from the high of 2018 and the broken uptrend.


Categories
Forex Market Analysis

Daily Market Update: Positive Data for the Australian Dollar and Sterling


News Commentary


The Australian dollar opens the week higher as it has risen by stronger than expected retail sales today. The reading came in at 0.4% which was higher than the expected 0.3%.


Sterling also was helped by Construction PMI which released with 52.5. That was more than the forecasted 52, to give the pound a little breath.


The euro pushed higher as concerns over the political situation in Italy calmed after the anti-establishment parties reached a deal on a proposed coalition government, which deactivate fears that repeat elections could give a mandate for the country to exit the eurozone.


Trade tensions are on fire again after finance ministers from the world’s leading economies criticised America’s new tariffs on steel and aluminium imports at a G7 meeting in Canada over the weekend.


Also, trade talks between the U.S. and China on trade ended without a breakthrough, raising the danger that negotiations could collapse.


Chart Analysis


US INDEX

On the daily chart, the price had successfully broken the ascending trend from the high of 2017, along with the resistance level to eventually reach the key resistance of 95.15 to bounce back from there.

The price shaped a reversal pattern (wedge) which closed with a break beneath it.

With forming divergence in RSI, the price is expected to have a correction to the key support at 92.6 which is located the broken trend too.


NZD/USD

On the daily chart, as we expected before, the pair had bounced from the ascending trend with an engulfing candle, along with breaking a descending trend, to reach our target at the resistance zone at 0.697-0.702.

According to the BAT-shaped harmonic pattern we expected, the price has already reached our first target and is expected to reach the B point at the next resistance zone of 0.7155-0.7185.


USD/CAD

On the daily chart, as we expected the price had made its way into the resistance zone of 1.289-1.298, almost reaching the key resistance at 1.309, with an approach from the descending trend line starting from the high of 2015, and the upper edge of the horn pattern.

The price has already bounced beneath the key resistance and the resistance zone and got back above it again, but it couldn’t go much further to form a pinbar, to take the price firstly to the support level at 1.274.


AUD/USD

On the daily chart, the price had a false break beneath the support zone 0.75-0.7535 with a pin bar.

That enhances the AB=CD harmonic pattern, with breaking a descending channel.

The pair rose with an engulfing candle above the support zone.

Along with divergence in RSI, the price is ready for the next move up to 0.774 which is a level with a combination of the lower trend line from the high of 2018 and the broken uptrend.


Categories
Forex Market Analysis

Weekly Market Update: RBA Rate Statement, EU Politics, US-China Conflict


News Commentary


US

Investors have been watching the May jobs report closely on Friday for any clues on future monetary policy as maximum employment is one of the Federal Reserve’s key objectives.

All data came positive as Non-Farm Employment Change released with 223K, higher than the expected 189K, and Unemployment Rate decreased by 3.8%. ISM Manufacturing PMI came in at 58.7, better than the forecasted 58.3.

The news has featured that the U.S.-North Korea summit is back on track. North Korea and the US are starting the preparations for the June 12 summit between Kim Jong-un and Donald Trump.

Separately, Trump contacted the Japanese prime minister, Shinzo Abe. He “affirmed the shared imperative of achieving the complete and permanent dismantlement of North Korea’s nuclear, chemical, and biological weapons and ballistic missile programs,” The White House claimed. And they would meet before the Kim-Trump summit.

China warned the United States on Sunday that any agreements reached on trade and business between the two countries will be void if Washington implements tariffs and other trade measures, as the two ended their latest round of talks in Beijing.

That came after U.S. Commerce Secretary Wilbur Ross met Chinese Vice Premier Liu He in Beijing over the weekend.

The world’s two largest economies have threatened each other with tens of billions of dollars’ worth of tariffs in recent months, leading to worries that Washington and Beijing may engage in a full-scale trade war that could damage global growth and oil markets.


EUR

The Euro gained on Thursday as Italian parties renewed attempts to form a government, to calm down the concerns about the wider impact of a political crisis in Europe’s third-largest economy.

The two anti-establishment parties have made many efforts to form a coalition government, rather than force Italy into holding elections for the second time this year in September.

The CPI flash estimate enhanced the regains of the Euro after a reading of 1.9%, which was more than the forecast of 1.6%, along with the core reading of 1.1 %, which was more than the forecast of 1.0%.

Besides, economists have concluded that the ECB will begin hiking rates in the middle of next year.

All eyes will be on the Draghi speech on Tuesday to note any views for the economy and the growth.


CAD

The Bank of Canada Governor, Stephen Poloz, left rates on hold for a third straight decision on Wednesday at 1.25%, but gave a hawkish statement for the economy and removed some cautious language.

The central bank also clarified that recent economic data bolsters its April outlook for a 2% growth in the first half of 2018.

GDP rose to 0.3%, which was higher than the expected 0.2%. That would reinforce the optimism bias for the BOC.

Canada is waiting for some big data this week. Firstly with the trade balance on Wednesday, the last reading was -4.1B, and the unemployment rate on Friday, the last release was 5.8%.


AUD

Australia reported worse than expected Capex data. Private capital expenditures rose only 0.4% in the first quarter against 1.0% estimated and 0.2% from the fourth quarter of last year.

The Australian dollar is also waiting for many events this week. Retail sales on Monday, GDP on Wednesday, and trade balance on Thursday to give an outlook to the economic growth.

All eyes will be on the RBA statement rate on Tuesday, which the RBA is expected to keep rates stable at 1.5%


Chart Analysis


US INDEX

On the daily chart, the price had successfully broken the ascending trend from the high of 2017, along with the resistance level to eventually reach the key resistance 95.15 to bounce back from there.

The price shaped a reversal pattern (wedge) which closed with a break beneath it.

With forming divergence in RSI, the price is expected to have a correction to the key support at 92.6 which is located the broken trend too.


NZD/USD

On the daily chart, as we expected before, the pair had bounced from the ascending trend with an engulfing candle, along with breaking a descending one, to reach our target at the resistance zone at 0.697-0.702.

According to the Bat-shaped harmonic pattern, the price is expected to reach the B point at the next resistance zone 0.7155-0.7185.

The price may face a little retracement before going up to the mentioned targets.


USD/CAD

On the daily chart, as we expected the price had made its way into the resistance zone of 1.289-1.298, almost reaching the key resistance at 1.309, with an approach from the descending trend line starting from the high of 2015, and the upper edge of the horn pattern.

The price has already bounced beneath the key resistance and the resistance zone and got back again above it, but it couldn’t go much further to form a pinbar, to take the price firstly to the support level at 1.274.


AUD/USD

On the daily chart, the price had a false break beneath the support zone 0.75-0.7535 with a pin bar.

That enhances the AB=CD harmonic pattern, with breaking a descending channel.

The pair rose with an engulfing candle from the support zone.

Along with divergence in RSI, the price is ready for the next move up to 0.774 which is a level with a combination of the lower trend line from the high of 2018 and the broken uptrend.


AUD/JPY

On the daily chart, as we expected, the price reached the resistance zone at 84-84.35.

The price couldn’t break through this area to bounce back.

It reached the support levels at 81.25-80.5 (as we expected) to pull back up again boosted by the ascending trend from the low of March.

As the pair is currently moving sideways. The price is expected to retest the resistance zone again.


AUD/NZD

On the daily chart, as we expected before, the price had made its way up to targets at the resistance zone 1.0815-1.0865, boosted by a BAT harmonic pattern.

The price is going to have a little retracement at these levels to continue its bullish movement up to the 1.1045 level.


Categories
Forex Market Analysis

Weekly Market Update: FOMC & ECB Meetings


News Commentary


We are looking forward to another busy calendar week for most assets, followed by many important readings and announcements from central banks, to see how this will affect each currency.


EUR

The German Final CPI results were not unexpected. The indicator dropped to 0.0% marking a 3-month low. The Eurozone Final CPI went to 1.2%, down from 1.3% last month. The Eurozone Final Core CPI dropped from 1.0% to 0.7. The German indicator posted a sharp drop of -8.2 for a second straight month, the first declines since July 2016. The low reading certainly doesn’t show much optimism. The ECB will have to stay with its stimulus policy program in their meeting on Thursday.


The EUR has another battle with Italy’s new leader’s elections who may propose new deficit spending that appears to tighten the EU Growth.

Further details on the formation of the new Italian government between the League and Five Star movement will be a key market focus for EUR fixed income markets.


US

The dollar found momentum as the bond yields on 10-year U.S. Treasury raised to 3.025%, the highest level in three weeks. A rise above the high of 3.035% reached on April 25 would take it to its highest since early 2014.

U.S. bond yields were enhanced by signs of trade tensions between the U.S. and China calming down after U.S. President Donald Trump promised to help Chinese technology company ZTE.

This also affected the Dow and S&P 500 who both passed the previous peak, which came almost a month earlier in what could be an indication of an ending of the correction.

All eyes will be on the FOMC meeting on Wednesday to show any hint about how many rate hikes may come this year.


GBP

The UK Average Earnings Index came in below expectations with 2.6%. This may put more pressure on sterling which will make traders concerned about any rate hike soon.

Besides, inflation fell faster than the BoE forecasted in February.

Policymakers think the effects of Brexit on sterling are likely to ease slightly faster than expected, so they now plan that inflation will return to the 2 percent target in two years, despite the delay of the next rate rise.

In the UK, the inflation report on Tuesday is expected to ease the fading impact of the GBP lowering.

With also CPI on Wednesday, there are expectations of the same as the last reading of 2.5%.

Following on Thursday will be retail sales with a forecast of 0.8%, and second estimate on GDP on Friday with an expectation of 0.1%.

All eyes will be on BOE governor Carney’s speech on Thursday and Friday, noting about an upcoming rate hike.


CAD

Inflation in Canada has been higher in recent months and rose to 2.3% in March.

Economic CPI stabilised at the forecast of 0.3%, with core retail sales falling to 0.2%.

Negotiations about the North American Free Trade Agreement (NAFTA) have reached a dilemma with no meetings scheduled among the top leaders, ahead of the month-end.

Trump’s economic adviser Kudlow linked between NAFTA and China, indicating that an agreement on NAFTA would show that the US can avoid a trade conflict with China. The NAFTA agreement would also show Trump’s tactics, and if there is trade conflict with China, then it is China’s fault.


 AUD

The Australian Employment Change for April was better than expected with 22.6K, which crossed over the 19.8K estimate.

On the other hand, the Unemployment Rate rose for the fifth time since July 2017, reaching 5.6%.

The lower wage price index put more pressure on the Australian dollar with a reading less than expected of 0.5%.

All eyes will be on RBA governor Lowe’s speech to declare any notes about inflation,  growth and the outlook for the economy.


JPY

The announcement that North Korea suspended negotiations with South Korea on the denuclearisation has affected the Japanese yen as a “safe haven” of the financial market.

Japan GDP ended the expansion streak for eight straight quarters of growth. Japan GDP contracted -0.2% QoQ in Q1, less than the expectation of 0.0% QoQ. On an annualised basis, GDP contracted -0.6% versus the expectation of -0.1%.


CHART ANALYSIS


US INDEX

On the daily chart, the price has bounced from the lower trend line from the high of 2017.

The price is near the key resistance of 94.15 which bounced with a pin bar.

A bat harmonic pattern boosts the continuation of the bearish momentum.

Divergent on RSI assured this possible downfall.

If the price could break beneath the key support level 92.6, it may reach 91.1 again.


 AUD/USD

On the daily chart, the price had a false break beneath the support zone 0.75-0.7535. That enhances the harmonic pattern AB=CD. The pair had made a price action (pin bar) in this false break to boost the bullish bias. The pair is moving onto the support zone now. Along with divergence in RSI and breaking the lower trend line as shown, the price is ready for the next move up to 0.7635 then 0.7715.


 USD/CAD

On the daily chart, the price had made its way into the resistance zone of 1.2925-1.3, with an approach from the descending trend line starting from the high of 2015. The price reversed from these levels, breaking beneath the key 1.28 support level and then, returning to it. If the daily candle closes under this level again, it will prompt the price to be bearish to the support zone 1.252-1.243.


 AUD/JPY

On the daily chart, we can see that the price bounced from the support area of 80.35-81.2.

A well-noticed head & shoulders reversal pattern is shaped. The price is on the second shoulder with a breaking of the lower trend line as shown.

Followed by oversold on RSI and the breaking of the lower trend line, the price is expected to get back up again to the resistance area 84-84.35.


USD/JPY

The price is located at a very strong short-selling area, rebounding from the descending trend line from the high of 2018. Besides the broken uptrend line from the low of 2011, also reaching the top edge of the upward channel along with forming an AB=CD harmonic pattern with divergence on RSI. The price is also about to shape a double top pattern. We will wait for a bounce from these levels and break beneath the upward channel to go short to our targets of 108.1 then 104.8.


Categories
Forex Market Analysis

Daily Market Update: Canadian CPI


News Commentary


Canadian Inflation and retail sales numbers on Friday could fuel expectations of a rate hike if they point to strong readings. Inflation in Canada has been higher in recent months and rose to 2.3% in March.

Economic CPI forecast to reach 0.3% with core retail sales to be 0.5%.

However, Negotiations about the North American Free Trade Agreement (NAFTA) have reached a dilemma with no meetings scheduled among the top leaders, ahead of the month-end.

Trump’s economic adviser Kudlow linked between NAFTA and China, indicating that an agreement on NAFTA would show that the US can avoid a trade conflict with China. The NAFTA agreement would also show Trump’s tactics, and if there is trade conflict with China, then it is China’s fault.


On the other side, inflation fell faster than the BoE forecasted in February.

Policymakers think the effects of sterling’s Brexit are likely to ease a slightly faster than expected, so they now plan that inflation will return to the 2 percent target in two years, despite the delay of the next rate rise.


The Australian Employment Change for April was better than expected with 22.6K, which crossed over the 19.8K estimate.

On the other hand, the Unemployment Rate rose for the fifth time since July 2017, reaching 5.6%.


Charts Analysis


AUD/USD

On the daily chart, the price had a false break beneath the support zone 0.75-0.7535. That enhances the harmonic pattern AB=CD. The pair had made a price action (pin bar) in this false break to boost the bullish bias. The pair is moving onto the support zone now. Along with divergence in RSI and breaking the lower trend line as shown, the price is ready for the next move up to 0.7635 then 0.7715.


USD/CAD

On the daily chart, the price had made its way into the resistance zone of 1.2925-1.3, with an approach from the descending trend line starting from the high of 2015. The price reversed from these levels, breaking beneath the key 1.28 support level and returning to it. If the daily candle closes under this level again, it will prompt the price to be bearish to the support zone 1.252-1.243.


AUD/JPY

On the daily chart, we can see that the price bounced from the support area of 80.35-81.2.

A well-noticed head & shoulders reversal pattern is shaped. The price is on the second shoulder with a breaking of the lower trend line as shown.

Followed by oversold on RSI and the breaking of the lower trend line, the price is expected to get back up again to the resistance area 84-84.35.


Categories
Forex Market Analysis

Daily market update: eyes on Canada CPI

News

Traders are going to focus on Canada CPI, which indicates much about inflation level. The forecast estimates are  0.4% while the previous result was 0.6%. Two days ago the bank of Canada released its overnight rate, and it remained at 1.25%,  fulfilling all economists expectations.

Inflation in Canada is close to 2% as temporary factors that have been weighing on this factor have largely dissipated.

On the other hand, The Swiss franc reached 1.20 euro for the first time since the Swiss National Bank removed its cap on the currency, with growing satisfaction of the nation’s policymakers who have been struggling an overvalued exchange rate for the past decade.

Speaking about the troubles between USA & Syria, Russian Missiles Alarm Israel, adding to a risk of a Next Syria Crisis. Russia warned that there would be consequences. Only one of them was spelled out: The Kremlin said it may supply its Syrian ally with state-of-the-art air defenses. All of these circumstances may enhance safe haven assets

USD/CAD

On the daily chart, the price has reached supply area (1.243-1.252). which is also 61.8% Fibonacci. The price formed a flag that is considered a continuation pattern. As its RSI reached an oversold zone, and with doji & engulfing candles showing up, the price is expected to move up to the first target at 1.292.

EUR/CAD

On the daily chart, the price has broken the down trend line from its 2018  lows. Now, the pair broke the descending trend line connecting its recent highs and bounced from the support zone between 1.566-1.553. This breakthrough might drive it to 1.61 level, the last March 2018 top.

CAD/JPY

On the daily chart, the price couldn’t go further up. after rebounding from the main resistance at 85.55. It’s a combination between demand level & 50% Fibonacci

After reaching the overbought area in RSI and forming pin bar, the price is expected to go down to retest 83.5


© Forex.Academy

Categories
Forex Market Analysis

CAD slides in the aftermath of the BoC statement

In today’s meeting, Bank of Canada (BoC) left its interest rate unchanged, in line with expectations. It seems that overall approach of the BoC is wait-and-see, especially with respect to future hikes.

The statement notes that policy accommodation will still be needed in order to keep inflation on target while the Bank will continue to monitor economy’s sensitivity to higher interest rates.  In regards to projections, the Bank has cut Q1 GDP forecast to 1.3% from 2.5%, sees Q2 GDP at 2.5% while raising potential output growth to 1.8% in 2018-2020 period and 1.9% in 2021. In addition, the 2018 growth has been trimmed to 2.0% from 2.2% while for 2019 growth is boosted to 2.1% from the original 1.6%.

USD/CAD rose on the headline from 1.2550 to 1.2630 as the CAD hawks were not impressed with the content of the report. However, be caution since the price has already retreated 30 pips or so. As it can be seen in the chart below, the pair has moved way above  H1 100MA and touched 200 MA. In addition to the 200MA resistance on the hourly chart, the price has almost reached 38.2% Fibonacci retracement of the big leg down. If it is able to close above 1.26 tonight, we expect another leg higher to test at least 50% or even key 61.8% Fibonacci level. The diagonal trend line, currently at 1.2730, will also act as an obstacle for bulls.


All in all, our advice is to wait for the price to settle down before entering any trade.

Categories
Forex Market Analysis

EZ Economic Sentiment Plunges To Its Lowest Level Since 2016

Hot Topics:

  • EZ Economic Sentiment plunges to the lowest level since 2016.
  • Pound falls after unemployment rate release.
  • Dow continues advancing with all eyes on the 25,000 pts level.
  • Expecting the Crude Oil Inventories data release.
  • Limited down movement before BoC MP decision.


EZ Economic Sentiment plunges to the lowest level since 2016.

The Eurozone ZEW Economic Sentiment in March dropped to 1.9, the lowest level since July 2016. The ZEW President Achim Wambach said, “The reason for this downturn in expectations can mainly be found in the international trade conflict with the United States and the current situation in the Syrian war.” 

Once the sentiment data was released, the common currency reacted dropping 0.25%. As we have envisioned, the Euro dropped from the blue box.

In the European stocks market, the German index DAX 30 continued its rally closing the session with a gain of 0.99%. The index is moving in an ascending channel; the price could still reach new highs until the 12,702 – 12825 area before starting a potential corrective move.

At the same time, the Dollar Index climbed from 88.94, the 3 weeks lowest level, advancing to its short-term pivot of 89.36. The price still is bouncing from the Potential Reversal Zone (PRZ). Invalidation level is in 88.52 level.


Pound falls after unemployment rate release.

The unemployment rate in March fell 4.2%, the lowest level in more than four decades. The GBPUSD pair plunged 0.31% from the highest level of the year. On the technical side, the pound has made a false breakout reaching 1.4376 and falling sharply below 1.43. We are now expecting a setup as a 1-2-3 pattern before we look to sell the pair.


Dow continues advancing with all eyes on the 25,000 pts level.

In the middle of the big companies earnings release, Dow Jones continued advancing, breaking up our key resistance level of 24,625 closing the session with gains of 0.59%. Our central vision is bullish with the target placed at the 25,407 level.

As result of the market risk on sentiment, the USDJPY has moved above our invalidation level (106.61), bouncing in the Potential Continuation Section (PCS); closing the session at 107.0, maintaining the bullish bias with the target placed at 108.41 level.


Expecting the Crude Oil Inventories data release.

Today, the weekly Crude Oil Inventory data released by the EIA is expected. On the technical side, the price is making a bullish channel in five movements. We estimate that Crude Oil could reach the 67.86 – 68.75 area where sellers could enter in action with their targets placed at 64 $/barrel.


Limited falls before BoC MP decision.

The most expected release for this session is the interest rate decision from the Bank of Canada. The analysts’ consensus expects that the BoC will keep its rate unchanged at 1.25%. Our vision is that the loonie could make a new low to the 1.2499 level, where it could find new buyers with their target at 1.274.

Categories
Forex Market Analysis

What kind of trigger could boost the Dollar?

Hot Topics:

  • What kind of trigger could boost the Dollar?
  • Will the Eurozone continue to bring weaker economic data?
  • Could the UK CPI have reached their peak?
  • Fear of a new war or do we expect a new bearish leg?
  • A new higher high in oils is expected before it starts a corrective move.
  • Downward continuation limited before the BoC decision.

What kind of trigger could boost the Dollar?

The recent tensions originated by the strike made between the US, UK, and France on Syria and the reactions of Russia condemning the act could continue to increase the volatility in the markets. Another triggering factor could be the one originated by the US Retail Sales, which fell in February -0.1%. In March the analysts’ consensus is expecting an increase near to 0.4%. In technical terms, the greenback is still in a range and could be making a bottom formation. The control levels are 88.66 to 89.16. Invalidation level is below 88.1.


Will the Eurozone continue to bring weaker economic data?

This week the Germany and Eurozone ZEW economic sentiment reports were released. Particularly, the level of confidence fell to 13.4 in February from 29.3 reported in January. Probably it could be produced by a stational factor, like the weather conditions (winter time). In the panoramic chart, we are watching the current structure, as a corrective formation that could reach new lows in the 1.196 – 1.20 area. The invalidation level is above 1.2476.


Could the UK CPI have reached their peak?

In the last months, the British CPI apparently reached their peak, with a CPI of 3.1% (YoY) reported in the past year in November. Then in December and January, it achieved a 3.0%, but in February in line with other activity indicators, it has shown a decrease in the economic activity. It is probable that at these levels we are witnessing a stabilisation of the economic activity. In the same way, on the chart, we are watching a potential top pattern as a mother wave that could initiate a new bearish cycle with a target at the base of the sideways channel. The invalidation level is above 1.4345.


Fear of a new war or do we expect a new bearish leg?

The Japanese currency is moving in an ascending diagonal pattern in search for its long-term 108 level resistance. Despite the US attacks against Syria, the price continues moving according to our vision. We expect to find sellers once the price strikes the 108.2 – 108.4 area,  starting a new bearish leg.

The correlation between the Nikkei 225 and the USDJPY pair, bring us a clue about the moves that it could make. The first scenario is a breakout above 21,957 pts for a bullish continuation move, drawing the 22,764 – 23,050 area as a target. In the second scenario, if the price moves making a new bearish leg, we expect that move to reach the 20,660 zone, making a “mother wave”  and starting a new bullish cycle.


A new higher high in oils is expected before it starts a corrective move.

Last week the oils, Brent and WTI, reached their highest levels since 2014. For inverse correlation and as it was envisioned by us on January 12th, the Crude Oil VIX ETF reached the Potential Reversal Zone, where it might start a bullish cycle. In practical terms, once the WTI reaches the 67.8 – 68.7 area, it is likely that it begins a corrective move.


And concerning Brent Oil, we could see it at a new high, to 72.9 level,  before it starts a falling move.

Falls continuation is limited before the BoC decision.

Next Wednesday 18th the Bank of Canada (BoC) Monetary Policy Meeting will take place. The analysts’ consensus expects that the decision will maintain the interest rate at 1.25%. The price is making a downward cycle since March 19th, and our vision is that the Loonie might fall to the area between 1.245 – 1.254, where it could start an upward move, at least up to 1.274. The invalidation level for the ascending movement is 1.225.


Categories
Forex Market Analysis

Dolar Index closes bearish helped by mixed CPI data

Hot Topics:

  • Dolar Index closes bearish helped by mixed CPI data.
  • EUR-USD is losing momentum.
  • Manufacturing Production (YoY) falls, and pound closes slightly upward.
  • BoJ – Kuroda keeps the promise of monetary policy.
  • Crude Oil climbs to the highest level since 2014.

Dolar Index closes bearish helped by mixed CPI data.

The index of the greenback yesterday closed down 0.04%, finding support at level 89.03 weighed down by mixed inflation data. On the one hand, Core CPI (YoY) rose to 2.1% in March from 1.8% registered in February. On the other side, the Consumer Price Index CPI (MoM) fell to -0.1% in March, while in February it recorded an advance of 0.2%. We continue to observe the lateral range in which the price is with a bearish bias. (Click on the chart for full resolution).


EUR-USD is losing momentum.

The pair of the single currency is losing momentum, in the fourth consecutive trading session, the euro advanced 0.10% finding resistance at 1.2395. In an interview with Reuters, the ECB lawmaker Ardo Hansson said that the ECB “needs to be patient and eliminate its stimulus very gradually.”

Although the ECB has kept the interest rate at low levels and has maintained its policy of buying bonds, lawmakers are debating that it is time to start cutting this policy. ECB legislator Ewald Nowotny, meanwhile, said he would have “no problem” in raising the deposit rate from -0.4% to -0.2% as a means to normalise monetary policy.

In this macroeconomic context, the euro is reaching a key area in the range 1.2412 – 1.245. Should not exceed the level 1.2476, the pair could make a new bearish leg. In the long term, we still have our eyes on 1.26 as the end zone of the EUR / USD bullish cycle.

Manufacturing Production (YoY) falls, and pound closes slightly upward.

Manufacturing Production (YoY) fell to 2.5% in February well below the consensus that estimated an advance of 3.3%. The sector that was most affected was the construction sector with a decline of 1.6% in February. The National Statistics Office attributes to a large extent these low figures to the effect of severe weather.

On the technical side, we are observing a possible corrective process that could begin to be developed from area 1.42 – 1.425 with a potential level of invalidation in over 1.4345 coinciding with the highest level of the year.


BoJ – Kuroda keeps the promise of monetary policy.

The Governor of the Bank of Japan, Haruhiko Kuroda, reiterated his optimistic view on the expansion of Japan’s economy, affirming that “With the improvement of the product gap and the medium to long-term inflation expectations observed, we expect that inflation will accelerate as a trend and go to 2 percent. ”

On a technical level, on the one hand, the USD-JPY is still in a limited lateral range between 106.64 and 107.49, the predominant bias is bullish and increases its probability of strength as it closes above 108. The level The invalidation of the bullish sequence is 105.66.

On the other hand, by a positive correlation concerning USDJPY, we see in the Nikkei 225 Index within a long-term bearish pattern developing an ascending diagonal formation, which in case of exceeding 21,957 could lead to exceeding 22,500 pts.


Crude Oil climbs to the highest level since 2014.

First, it was the turn of the Brent oil; now it is the turn of the Crude oil that has climbed to the highest levels since 2014, reaching 67.36 US $ / Barrel, while the Brent oil climbed to new highs reaching $72.69.

For the Brent Oil, although the trend is bullish, the closest resistance is $72.91, while the level of invalidation of the bullish cycle is below $67.

As with the Brent Oil, the Crude Oil is in a free climb up to $ 70.7 as long as it remains above the $64 level.

On the opposite side, by inverse correlation, the Loonie remains in free fall with a target at the base of the bullish channel, the impact zone could be between 1.2456 to 1.235.