Categories
Forex Assets

The Fundamentals of the Canadian Dollar (CAD)

The Canadian dollar, which is also known as the CAD, may not date back long in time like some other currencies (e.g. the British pound), yet its history is equally fascinating. Although the CAD is relatively young, it is now believed to be the seventh most traded currency in the world. Back in 1941, an important decision was made in the Province of Canada, a then-new British colony in North America, to make their currency a one-tenth value of the United States’ Golden Eagle $10 coin. This change meant that the two currencies were connected more tightly and that the value of the CAD depended on the worth of the USD. As Canada did not have a central bank for some time, the printing of money was a duty performed by several private banks.

As Canada kept growing, new Canadian territories slowly started to adopt the CAD – Nova Scotia in 1871 and Newfoundland in 1949. The currency was pegged to the USD quite a few times throughout history: 1841—1933, 1940—1950, and 1962—1970. Despite the peg, Canada always demonstrated the air of independence, and this was particularly noticeable during the Great Depression when the Canadian government decided to move towards having their own monetary policy and central bank. Hoping to protect itself from the economic downfall that was particularly prominent in the US, Canada was pushed into making their own central banking institution and take over control of their currency. The CAD is nowadays also referred to as a loonie, which is the name of a bird that is printed on the C$1 coin, which incidentally inspired the derivation of the name toonie used for the C$2 coin. Aside from C$, some similar variations that include the dollar symbol are used as well so as to make a difference from other dollar-denominated currencies, notably CA$ and Can$.

Bank of Canada

For almost one entire century, Canada managed to go without a central bank with 10 private banks handling the issuance of the CAD. Nevertheless, the benefit of printing money was never intended for the government of Canada to reap, but the banks alone. One of the biggest banks at the time, the Bank of Montreal, grew to become a more dominant institution that acted as a central bank. This bank was, however, an independent player whose goals were not necessarily aligned with Canada’s needs, especially since there was an overall lack of autonomy and vision. After the Great Depression, Canada became aware of the need to become more separate from the USD, which brought forth the creation of their own central bank.

In 1935, the Canadian government did take necessary action and established the Bank of Canada, which then took on the responsibility of running the currency. The Bank of Canada (BOC) now holds meetings eight times a year to discuss matters pertaining to their goals of maintaining price stability. Unlike other central banks, such as the Federal Open Market Committee (FOMC) in the United States, the BOC has a single mandate, which has proved to be quite limiting for enacting monetary policy. Some other single-mandate central banks, e.g. the European Central Bank (ECB), do not deal with maximizing employment and GDP growth. As the ECB is only concerned with price stability, they are often unable to provide the assistance Europe requires. Canada, however, appears to be handling this issue much better, which could be potentially attributed to its laws.

The CAD Currency Basket

The BOC in fact seems to be acting as a dual-mandate central bank, which has been supported by their actions during some periods of crisis in the past. The new Governor of the Bank of Canada and the Chair of the Board of Directors, Mr. Tiff Macklem, was appointed in June this year, at a rather difficult time when many Canadian citizens and companies requested support in order to withstand the COVID-19 pandemic. Owing to his expertise in financial markets, the new Governor is believed to be able to assist the central bank to weather the current economic crisis. 

Canadian Economy

Canada is one of the largest economies, currently believed to be ranking in the top 10 economies in the world. Canada thrives on oil, mining, and logging, as these are the country’s biggest industries, which make the CAD heavily based on commodities. Canada still has strong ties with the United States, which is also its largest trading partner, and this relationship appears to impact the Canadian economy whenever there are changes in the US. Considering the fact that more than 50% of imports in Canada come from the US, any impediments in the US economy are likely to cause the same slowdown in Canada. In addition to the two economies being so closely intertwined, the CAD acts as the reserved currency for many Caribbean islands. What is more, one can even pay for all goods and services with this currency in some of the islands in this region.  

Major Correlations

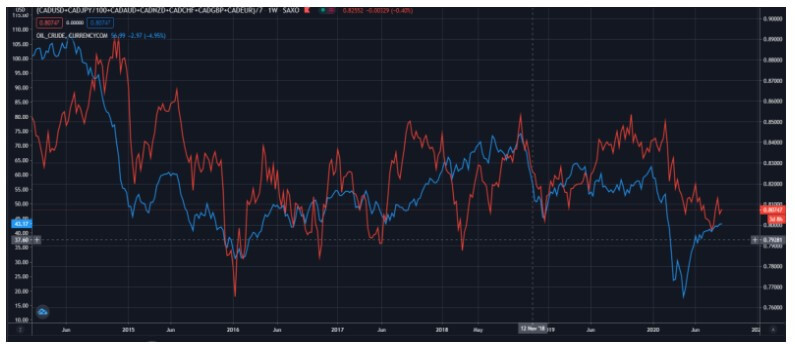
Due to the strength of the Canadian economy largely stemming from oil, mining, and logging industries, the CAD has established some of its major correlations with the related commodities. The correlation between the CAD and oil, for example, has always been one of the more prominent ones although its nature and degree keep changing. In the past, traders have witnessed quite a high correlation between the two, which entails that once the oil goes down, so will the CAD during the same period of time. Information concerning such strong correlations can help traders assess the currency and come to an important conclusion that may help their trading. Nonetheless, as we can see from the chart below, these correlations are neither strong nor relevant 100% of the time, so the CAD and oil do not necessarily reveal any similar or dissimilar tendencies at all times. However, due to their historically prominent correlation, traders interested in the CAD should most definitely obtain information on what is currently happening with oil, what some of its previous tendencies were, and where it will likely move in the future.

CAD basket vs. Oil (blue line)

Economic Reports

As the Canadian economy greatly resembles that of the United States, the same reports are going to apply: quarterly GDP reports, monthly employment reports, monthly retail sales, monthly producer and consumer price index (PPI and CPI) as well as a trade deficit. Any trader keen on trading the CAD can potentially rely on its knowledge and understanding of the US economy, as the Canadian economy largely models that of the United States. 

Most Traded Pairs

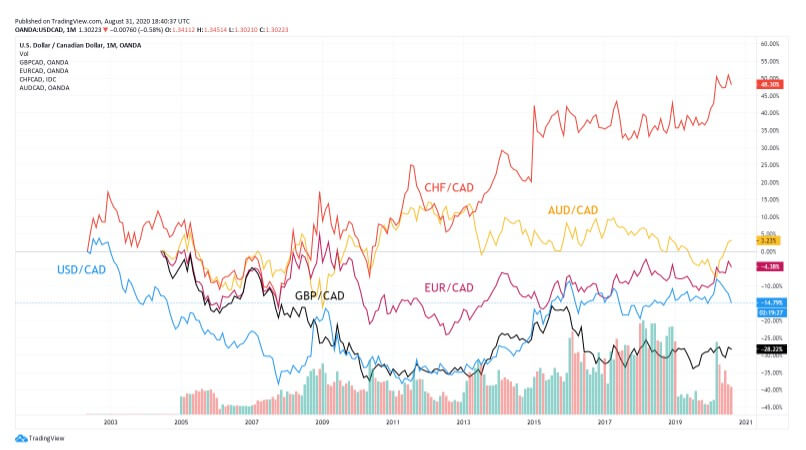
The most-traded CAD-based crosses include USD/CAD, EUR/CAD, GBP/CAD, and CAD/CHF. In terms of volume and liquidity, the number one currency pair is USD/CAD, which is said to make more than 50% of all CAD transactions. The remaining four currencies fall behind on both volume and liquidity, which is an extremely important piece of information for traders. Understanding the nature of these pairs particularly comes to prominence during some news announcements, which often trigger lighter spreads and greater volatility. The EUR/CAD and GBP/CAD currency pairs both have decent volume, while most other crosses involving the CAD could be considered as more exotic. The AUD/CAD, for example, is an unusual pair primarily due to the vast geographic distance and the low quantity of trade between the two countries, which immediately leads to lower liquidity levels and greater width of the spreads. While trading the CAD, in general as well as in the face of any news events, the safest crosses are believed to be USD/CAD, EUR/CAD, and GBP/CAD.

Most Traded CAD crosses vs. AUD/CAD

Trading the CAD

Due to the fact that the Canadian economy is so heavily reliant on commodities, it is most likely to perform best during economic expansion. Any period of global growth involving a high demand for materials such as copper, steel, oil, etc. is assumed to be bullish for commodity-based currencies. Therefore, the CAD, too, is generally likely to be bullish during economic growth. Although this reaction of the CAD to the rising market may not always be true in 100% of cases, it is going to hold true for the majority of cases. Any time the price of commodities appears to be dropping, traders can ten assume that there is little demand for commodities such as copper, steel, or oil for example. Whenever the economy seems to be in recession, the CAD can be expected to underperform, experiencing difficulties.

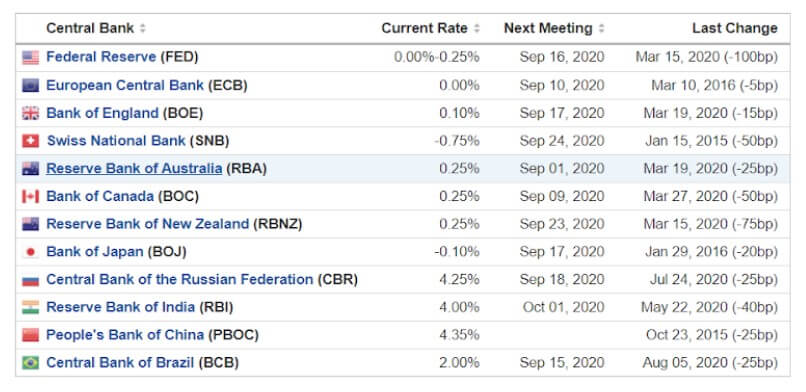
In terms of interest rates, at 0.25%, Canada appears to have set neither the highest nor the lowest rates. While placed in the middle at the moment, Canadian interest rates are generally said to vary according to CPI and PPI inflation reports. As the Canadian economy greatly influences the state of commodities, traders can expect any rise in commodities to lead to a rise in inflation in Canada, causing the country’s central bank to increase interest rates. As we discussed before, the price of commodities will also affect the CAD and vice versa. In terms of trade deficits, Canada seems to be doing well in particular due to its large quantity of exports leading to a trade surplus. Currently, Canada plans to keep on offering quantitative easing programs in order to alleviate the impact of the COVID-19 pandemic. Nonetheless, the Canadian economy seems to be recovering, especially after the coronavirus restrictions started to ease although GDP is projected to shrink by 7.8% in 2020.

Central Bank Interest Rates

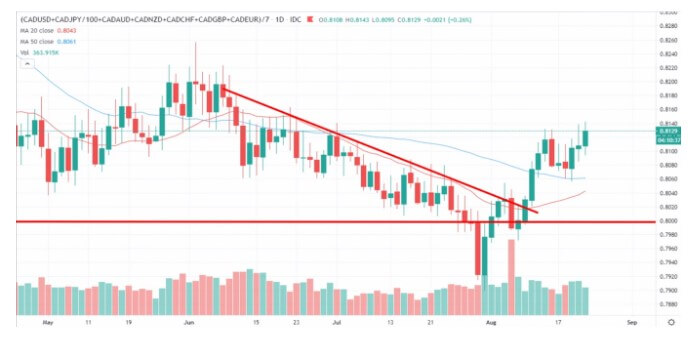
Recent Trends (until September 2020)

The CAD appears to have exhibited the greatest number of trend changes among all major currencies in the past few weeks. Going steady on the downwards trend line, the CAD broke the pattern through a reversal, followed by a bullish movement for three days straight, with the chart ending in a form of a pull-back. The nature of the continuation of this pullback may bring some lucrative opportunities, for example, should a reversal occur. Some market analysts state that they would prefer going on the upside than going bearish when it comes to the CAD at this time. It is interesting to know that professional traders believe that CAD has one of the best charts at the moment. Preceded by a clear change of trend and quite a few up-and-down movements, we may still not be able to see a true breakout, although the bullish reversal pattern is quite apparent at the end of the chart. This currency has been rather weak for a long period of time, but experts seem to believe that the CAD is finally going to start to go up in the near future. Just this past week, the CAD had a few important news events and economic reports come out, such as the Governor’s speech and the GDP report. Compared to other currencies, the CAD appears to be doing really well at the time, currently placed among the strongest currencies.

Categories
Forex Assets

Analysing The Costs Involved While Trading The CAD/INR Exotic Currency Pair

Introduction

The CAD/INR pair is considered an exotic currency pair where CAD is the Canadian Dollar, while the INR is the Indian Rupee. This article will cover the basic elements of the CAD/INR pair that you should know before you start trading the pair.

In this pair, the CAD is the base currency, while the INR is the quote currency. Therefore, the price attached to the CAD/INR pair is the amount of INR that can be bought by 1 CAD. For example, if the price of CAD/INR is 55.059, it means that for every 1 CAD, you can get 55.059 INR.

CAD/INR Specification

Spread

The price at which you can buy a currency pair is different from the price at which you can sell the same pair. This difference is the spread. The spread is considered a source of revenue for brokers and a trading cost for forex traders. The spread for the CAD/INR pair is as follows.

ECN: 39 pips | STP: 44 pips

Fees

The trading fee is the commission you pay your forex broker for every trade you make. STP accounts usually have no trading fees, while the fees charged on ECN accounts vary from broker to broker.

Slippage

Slippage represents the difference between the price at which you place a trade and the price at which your broker will execute the trade. Market volatility and the broker’s efficiency determine the amount of slippage.

Trading Range in the CAD/INR Pair

The trading range in forex helps a trader analyze the extent of a currency pair’s fluctuation during a specific timeframe. As measured in pips, this fluctuation can help determine the volatility of the pair and the expected gains or losses. For example, if in the 4-hour timeframe the CAD/INR pair has a volatility of 30 pips, a trader can expect to either gain or lose $54 since the value of 1 pip is $1.8

The table below shows the minimum, average, and maximum volatility of CAD/INR across different timeframes.

The Procedure to assess Pip Ranges

  1. Add the ATR indicator to your chart
  2. Set the period to 1
  3. Add a 200-period SMA to this indicator
  4. Shrink the chart so you can determine a larger period
  5. Select your desired timeframe
  6. Measure the floor level and set this value as the min
  7. Measure the level of the 200-period SMA and set this as the average
  8. Measure the peak levels and set this as Max.

CAD/INR Cost as a Percentage of the Trading Range

The knowledge of the potential costs when trading helps determine the trading strategies to be used. Cost as a percentage of the trading range will help us understand how trading costs vary with volatility under different timeframes.

Total cost = Slippage + Spread + Trading Fee

The tables below show the analyses of percentage costs in both ECN and STP accounts.

ECN Model Account

Spread = 39 | Slippage = 2 | Trading fee = 1

Total cost = 42

STP Model Account

Spread = 44 | Slippage = 2 | Trading fee = 0

Total cost = 46

The Ideal Timeframe to Trade CAD/INR

Depending on your forex trading style, you can use the above analysis to coincide with your trade of the CAD/INR pair with moments of lower trading costs. The 1-hour timeframe for the STP and the ECN accounts has the highest trading costs of 779.66% and 711.86% of the trading range, respectively. Also, notice that the highest costs coincide with the lowest volatility of 3.1 pips.

Trading longer timeframes like the 1-week and the 1-month timeframes are associated with lower costs. However, trading when the CAD/INR pair’s volatility is above average has a lower cost. Another way of reducing trading costs is by using the limit order types, which eliminates the slippage costs. Here’s how it works.

Total cost = Slippage + Spread + Trading fee

= 0 + 39 + 1 = 40

When limit orders are used, the slippage cost becomes zero. Consequently, the trading costs are significantly reduced, with the highest trading cost dropping from 711.86% to 677.97% of the trading range.

Categories
Forex Assets

Costs Involved While Trading The CAD/RON Forex Exotic Pair

Introduction

The CAD/RON is an exotic currency pair where CAD is the Canadian Dollar, and RON is the Romanian Leu. This article will explain some basic elements about the CAD/RON you ought to know before you start trading this pair. The CAD is the base currency, and RON is the quote currency in the CAD/RON exotic pair.

Thus, the CAD/RON pair’s price represents the amount of RON that you can buy using 1 CAD. If the pair’s current price is 3.1292, it means that you can use 1CAD to purchase 3.1292 RON.

CAD/RON Specification 

Spread

When trading forex, the spread represents the difference between the price at which a currency pair can be bought (bid price) and the price it can be sold at (ask price).

The spread for the CAD/RON pair is: ECN: 35 pips | STP: 39 pips

Fees

The STP accounts have no trading fees attached. Trading fees for the ECN accounts vary depending on your choice of forex broker.

Slippage

When trading in the forex market, sometimes the price you request on an order tends to be different from the price your broker executes the trade. This difference is known as slippage, and it depends on the broker’s speed of execution and market volatility.

Trading Range in the CAD/RON Pair

To ensure that proper risk management measures are taken, forex traders should know how much a currency pair fluctuates within a given timeframe. Trading range analysis can help forex traders to determine the volatility associated with trading a particular currency pair. This volatility is measured in terms of pips. If the CAD/RON pair has a volatility of 10 pips within the 1-hour timeframe, then a forex trader can be expected to gain or lose $32 since the value of 1 pip of CAD/RON is $3.2

Below is a table showing the minimum, average, and maximum volatility of CAD/RON across different timeframes.

The Procedure to assess Pip Ranges

  1. Add the ATR indicator to your chart
  2. Set the period to 1
  3. Add a 200-period SMA to this indicator
  4. Shrink the chart so you can determine a larger period
  5. Select your desired timeframe
  6. Measure the floor level and set this value as the min
  7. Measure the level of the 200-period SMA and set this as the average
  8. Measure the peak levels and set this as Max.

CAD/RON Cost as a Percentage of the Trading Range

When trading forex, the costs you can expect to incur include; brokers’ fees, slippage, and spread.

Total cost = Slippage + Spread + Trading Fee

The tables below show the analyses of percentage costs in both ECN and STP accounts.

ECN Model Account

Spread = 35 | Slippage = 2 | Trading fee = 1

Total cost = 38

STP Model Account

Spread = 39 | Slippage = 2 | Trading fee = 0

Total cost = 41

The Ideal Timeframe to Trade CAD/RON

From the above cost analysis, we can observe that the cost of trading the CAD/RON pair varies across different timeframes depending on the volatility. For both the STP and the ECN accounts, the 1-hour timeframe carries the highest costs at 694.92% and 644.07%, respectively. These higher costs are associated with the low volatility of 0.1 pips observed during the 1-hour timeframe.

We can also notice that the trading costs drop significantly when the volatility across all timeframes is above average. Therefore, for intraday forex traders, placing trades when the volatility is above average might be a better way of reducing the trading costs associated with the CAD/RON pair. On the other hand, longer-term traders of the pair enjoy lesser trading costs.

One way for traders to reduce their trading costs is to use limit order types. These forex order types eliminate the effects of slippage, thus make the associated slippage costs zero. Below are costs for a trader using limit orders.

ECN Model Account (Using Limit Orders)

Total cost = Slippage + Spread + Trading fee

= 0 + 35 + 1 = 36

As you can see, the trading costs are significantly reduced when limit orders are employed. The highest trading costs dropped from 644.07% to 610.17% of the trading range.

Categories
Forex Assets

Costs Involved While Trading The ‘CAD/TWD’ Forex Exotic Currency Pair

Introduction

The CAD/TWD is an exotic currency pair where CAD is the Canadian Dollar, and the TWD is referred to as the Taiwan New Dollar. In this pair, CAD is the base currency, and the TWD is the quote currency, which means that the exchange rate for the pair shows the quantity of TWD that can be bought by 1 CAD. In this case, if the exchange rate for the pair is 21.864, then 1 CAD buys 21.864 TWD.

CAD/TWD Specification

Spread

In the forex market, the spread is considered a cost to the trader. It is the difference between the ‘bid’ and the ‘ask’ price. Here are the spread charges for ECN and STP brokers for CAD/TWD pair.

ECN: 29 pips | STP: 34 pips

Slippage

When trading forex, slippage occurs when the execution price is below or above the price at opening the trade. The primary causes of slippage are the brokers’ speed of execution and market volatility.

Trading Range in the CAD/TWD Pair

The trading range in forex is used to analyze the volatility of a currency pair across different timeframes. This analysis gives the trader a rough estimate of how much they stand to gain or lose by trading that pair over a given timeframe. For example, say the volatility of the CAD/TWD pair at the 1-hour timeframe is 20 pips. Then, a trader can anticipate to either profit or lose $91.4

The trading range for the CAD/TWD pair is shown below.

The Procedure to assess Pip Ranges

  1. Add the ATR indicator to your chart
  2. Set the period to 1
  3. Add a 200-period SMA to this indicator
  4. Shrink the chart so you can determine a larger period
  5. Select your desired timeframe
  6. Measure the floor level and set this value as the min
  7. Measure the level of the 200-period SMA and set this as the average
  8. Measure the peak levels and set this as Max.

CAD/TWD Cost as a Percentage of the Trading Range

For us to understand the trading costs associated with the volatility, we will determine the total cost for both ECN and STP accounts as a ratio of the above volatility.

ECN Model Account

Spread = 29 | Slippage = 2 | Trading fee = 1

Total cost = 32

STP Model Account

Spread = 34 | Slippage = 2 | Trading fee = 0

Total cost = 36

The Ideal Timeframe to Trade CAD/TWD

From the above analyses, we can conclude that it is costlier trading the CAD/TWD pair on shorter timeframes when volatility is low. Longer timeframes, i.e., the weekly and the monthly timeframes, have lesser trading costs. Therefore, it would be more profitable trading the CAD/TWD pair over longer timeframes.

However, for intraday traders, opening positions when the volatility is above the average will reduce the trading costs. More so, using forex limit orders instead of market orders will reduce the trading costs by eliminating the costs associated with slippage. Here’s an example.

ECN Account Using Limit Model Account

Total cost = Slippage + Spread + Trading fee

= 0 + 29 + 1 = 30

You can notice that using the limit orders significantly reduces the cost as a percentage of the trading range.

Categories
Forex Assets

Analyzing The CAD/JPY Forex Asset Class

Introduction

CADJPY is the abbreviation for the currency pair, the Canadian dollar against the Japanese yen. This pair is one of the most extensively traded cross currency pairs. In CADJPY, CAD is referred to as the base currency and JPY as the quote currency.

Understanding CAD/JPY

The value of CADJPY is the value of JPY, which is required to purchase one CAD. It is quoted as 1 CAD per X JPY. For example, if the current market price of this pair is 82.651, then these many units of Japanese yen are needed to buy one Canadian dollar.

Spread

The bid price is the price used to sell a currency, and ask price is the price used to buy a currency. There is always a difference between the two prices. This difference is called the spread. It varies from broker to broker and also the type of their execution model.

ECN: 1.1 | STP: 2

Fees

Similar to stockbrokers, there are forex brokers who charge a few pips of fee on each position a trader opens and closes. This fee is no different from the commission brokers levy. On STP accounts, the fee is nil, while on ECN accounts, it is between 6-10 pips depending on the broker one is using.

Slippage

Slippage in trading is the difference between the price requested by the trader and the price he actually received. The two factors responsible for slippage are,

  • The volatility of the market
  • Broker’s execution speed

Trading Range in CAD/JPY

A trading range is a tabular representation of the number of pips a currency pair moved in a given timeframe. It represents the minimum, average as well as the maximum pip movement in six different timeframes. These values prove to be important for assessing one’s risk on a trade. For example, if the minimum pip movement in CADJPY on the 4H timeframe is ten pips, then a trader can expect to lose $917 in about 4H.

Procedure to assess Pip Ranges

  1. Add the ATR indicator to your chart
  2. Set the period to 1
  3. Add a 200-period SMA to this indicator
  4. Shrink the chart so you can determine a large period
  5. Select your desired timeframe
  6. Measure the floor level and set this value as the min
  7. Measure the level of the 200-period SMA and set this as the average
  8. Measure the peak levels and set this as Max.

CAD/JPY Cost as a Percent of the Trading Range

As already mentioned, there is a fee for every trade you take. And knowing the percent fee on the trades you are taking is important, as it depends on the volatility of the market and the timeframe you are trading.

Below is a representation of the total cost variation on trade in terms of percentages. Since costs on ECN accounts are different from STP accounts, we have two separate tables for this concept.

ECN Model Account

Spread = 1.1 | Slippage = 2 |Trading fee = 1

Total cost = Slippage + Spread + Trading Fee = 2 + 1.1 + 1 = 4.1

STP Model Account

Spread = 2 | Slippage = 2 | Trading fee = 0

Total cost = Slippage + Spread + Trading Fee = 2 + 2 + 0 = 4

The Ideal way to trade the CAD/JPY

Before getting right into it, let us comprehend the above tables. The higher the values of the percentages, the higher are the costs on the trade. It is pretty evident from the table that, percentage values are on the higher side in the min column and comparatively lower in the max column. This means that the costs are high when the volatility of the market is low and vice versa. Also, the trades that are taken based on a long term perspective, the costs are considerably low.

One may trade the high volatility markets to minimize your costs, or trade during low volatility by paying high costs. However, it is ideal to enter during those times of the day when the volatility is close to the average values. During these times, one can expect comparatively low costs with enough volatility as well.

On a further note, another simple and effective way to reduce costs is by trading using limit orders. This entry method will take slippage out of the total costs and bring down its value considerably. An example of the same is given below.

Spread = 2 | Slippage = 0 | Trading fee = 0

Total cost = Slippage + Spread + Trading Fee = 2 + 0 + 0 = 2

Categories
Forex Assets

Fundamentals Of CAD/CHF Forex Currency Pair

Introduction

CAD/CHF is a currency pair where two currencies, namely, the Canadian dollar and the Swiss franc, are involved. It is a cross-currency pair. Here, CAD is called the based currency, and CHF is called the quote currency.

Understanding CAD/CHF

The current market price of CADCHF tells the value of CHF equivalent to one CAD. It is represented as 1 CAD per X CHF. For example, if the value of CADCHF in the market is 0.7372, then one must pay 0.7372 Swiss francs to buy one Canadian dollar.

Spread

In simple terms, the spread is the difference between the bid price and the ask price set by the brokers. It is not a fixed value and differs from time to time and broker to broker. It also varies based on the type of execution model.

ECN: 1 | STP: 2

Fees

The fee is the commission that is levied by the broker on each trade a trader takes. This, too, like the spread, differs from broker to broker and the type of their execution model. Fee on ECN accounts is 6-10 pips, while it is nil on STP accounts.

Slippage

Slippage is the difference between the trader’s executed price and the price he actually received from the broker. There is always this difference due to the volatility of the market and the broker’s trade execution speed. Note that slippage only happens on market orders.

Trading Range in CAD/CHF

Apart from analyzing the direction of the market, one must predetermine their risk and reward based on the volatility and the timeframe. Knowing how much a trader will gain or lose in a given time frame is a vital trade management tool. And below is a table through which one can determine their profit/loss that can be made in a specified timeframe. For example, the average pip movement on the 1H timeframe is 6.8. So, a trader can expect to be in a profit of $68.34 or in a loss of the same amount.

Procedure to assess Pip Ranges

  1. Add the ATR indicator to your chart
  2. Set the period to 1
  3. Add a 200-period SMA to this indicator
  4. Shrink the chart so you can assess a large time period
  5. Select your desired timeframe
  6. Measure the floor level and set this value as the min
  7. Measure the level of the 200-period SMA and set this as the average
  8. Measure the peak levels and set this as Max.

CAD/CHF Cost as a Percent of the Trading Range

An application to the above volatility table is to find the cost differences on trades by considering the volatility and the total cost on a trade. Below is the table that illustrates the variation in cost on a trade, in terms of percentage. The comprehension of it is discussed in the subsequent topic.

ECN Model Account

Spread = 1 | Slippage = 2 |Trading fee = 1

Total cost = Slippage + Spread + Trading Fee = 2 + 1 + 1 = 4

STP Model Account

Spread = 2 | Slippage = 2 | Trading fee = 0

Total cost = Slippage + Spread + Trading Fee = 2 + 2 + 0 = 2

The Ideal way to trade the CAD/CHF

The higher the magnitude of the percentage, the higher is the cost of the trade.

The values in the table are least in the min column and highest in the max column. This simply means that the costs are high when the volatility of the market is low and vice versa.

In the average column, the values are not as low as in the max column, and not as high as in the max column. The volatility here is moderate too. Hence, this becomes our ideal time of the day to trade in the market.

To sum it up, one must trade during those times of the day when the volatility is more or less near the average values. This will ensure decent volatility as well as minimal costs.

There is another simple technique to reduce costs on trade. When trades are executed using limit order instead of market orders, the slippage becomes nil. So, this brings down the total cost of the trade by a significant value.

Categories
Forex Assets

Understanding The AUD/CAD Forex Currency Pair

Introduction

AUDCAD is the abbreviation for the currency pair, the Australian dollar, and the Canadian dollar. It is a cross-currency pair. One can expect great volatility and liquidity in the market during the Australian session. AUD is the base currency, and CAD is the quote currency.

Understanding AUD/CAD

The value of AUDCAD is the number of Canadian dollars required to buy one Australian dollar. It is quoted as 1 AUD per X CAD. For example, if the value of this pair is 0.9013, then 0.9013 CAD is needed to purchase one AUD.

AUD/CAD Specification

Spread

Spread in trading is the difference between the bid price and the ask price set by the broker. This pip difference is how brokers generate revenue. The spread always varies from broker to broker and the type of account model.

ECN: 1 | STP: 1.9

Fees

Apart from spreads, brokers charge a few pips of fee or commission on each trade you take. This exists only ECN accounts, as a fee on STP accounts is nil.

Slippage

Due to the delay in the broker’s execution speed and volatility of the market, a trader doesn’t get the exact price he intended. This difference in prices is referred to as slippage. It typically varies from 0.5 pips to 5 pips.

Trading Range in AUD/CAD

The trading range is the representation of the minimum, average, and maximum volatility in the market in a given timeframe. This proves to be useful in determining the profit/loss that can be made in a specific amount of time. One can determine this simply by finding the product of the pip movement on the required timeframe and the pip value (mentioned in the specification table).

Procedure to assess Pip Ranges

  1. Add the ATR indicator to your chart
  2. Set the period to 1
  3. Add a 200-period SMA to this indicator
  4. Shrink the chart so you can assess a large time period
  5. Select your desired timeframe
  6. Measure the floor level and set this value as the min
  7. Measure the level of the 200-period SMA and set this as the average
  8. Measure the peak levels and set this as Max.

AUD/CAD Cost as a Percent of the Trading Range

The cost of trade is an essential point of consideration in trading. Cost is that factor that is not fixed and varies on different variables. For example, when the volatility changes, the costs change. The same is the case with timeframes as well. Below is a table that illustrates the variation in the costs on a trade for different timeframes and volatilities.

ECN Model Account

Spread = 1 | Slippage = 2 |Trading fee = 1

Total cost = Slippage + Spread + Trading Fee = 2 + 1 + 1 = 4

STP Model Account

Spread = 1.9 | Slippage = 2 | Trading fee = 0

Total cost = Slippage + Spread + Trading Fee = 2 + 1.9 + 0 = 3.9

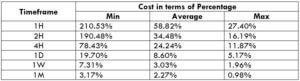
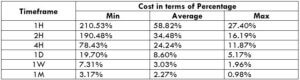
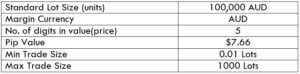
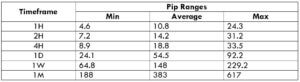
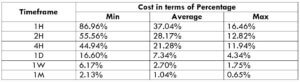
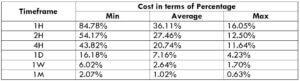
The Ideal way to trade the AUD/CAD

Comprehending the above tables is simple. The higher the magnitude of the costs, the higher is the total cost that has to be paid on a trade and vice versa. In the table, the percentages are on the higher side in the min column and lower in the max column. Hence, it can be concluded that the costs are higher when the volatility is low and vice versa. However, it isn’t ideal to trade in these situations. It is rather preferred to enter the market when the volatility is around the average values because the costs are affordable, and the volatility is as needed.

Moreover, it is recommended to design strategies such that limit orders are put to use. This shall completely eliminate the slippage on the trade. And with the elimination of slippage, the total cost would significantly reduce as well.

Categories
Forex Assets

What Should You Know Before Trading The NZD/CAD Currency Pair

Introduction

NZDCAD is the abbreviation for the currency pair New Zealand dollar against the Canadian dollar. It is referred to as a cross-currency pair. Here, NZD is the base currency, and CAD is the quote currency. In this article, we shall be going over everything you need to know about this currency. Firstly, let’s get started by understanding what the value of NZDCAD depicts.

Understanding NZD/CAD

Comprehending the value of a currency pair is simple. The value of NZDCAD determines the Canadian dollars that must be paid to buy one New Zealand dollar. It quoted as 1 NZD per X CAD. For example, if the current value of NZDCAD is 0.86595, then 0.86595 CAD is required to purchase one NZD.

NZD/CAD Specification

Spread

Spread is the primary way through which brokers make revenue. They have a different price for buying and selling. The difference between these prices is called the spread. It varies from broker to broker and their execution type.

ECN: 1 | STP: 1.8

Fees

For every execution, there is a fee levied by the broker. This fee is also referred to as the commission on a trade. It is nil on STP accounts. And on ECN accounts, it is usually within 6 to 10 pips.

Slippage

Slippage is the variation in the price executed by you and the price you actually received. It happens on market orders. Slippage depends on two factors:

  • The volatility of the market
  • Broker’s execution speed

Trading Range in NZD/CAD

The trading range is a tabular representation of the pip movement in a currency pair in various timeframes. These values help in assessing the risk-on trade as it determines the minimum, average, and maximum profit that can be made on a trade.

Procedure to assess Pip Ranges

  1. Add the ATR indicator to your chart
  2. Set the period to 1
  3. Add a 200-period SMA to this indicator
  4. Shrink the chart so you can assess a large time period
  5. Select your desired timeframe
  6. Measure the floor level and set this value as the min
  7. Measure the level of the 200-period SMA and set this as the average
  8. Measure the peak levels and set this as Max.

NZD/CAD Cost as a Percent of the Trading Range

Cost a percentage of the trading range is an excellent application of the above table. By manipulating the values with the total cost, the variations in costs in different at different volatilities and timeframes can be calculated. For this, the ratio between the total cost and pip movement is found out and represented in percentage.

ECN Model Account 

Spread = 1 | Slippage = 2 |Trading fee = 1

Total cost = Slippage + Spread + Trading Fee = 2 + 1 + 1 = 4

STP Model Account

Spread = 1.8 | Slippage = 2 | Trading fee = 0

Total cost = Slippage + Spread + Trading Fee = 2 + 1.8 + 0 = 3.8

Comprehending the above tables

There are two variables here, namely, timeframe and volatility. By varying these two, the variation in the total cost is examined. Note that the higher the percentage, the higher is the cost on a trade and vice versa. From this, we can make out that the prices are high when the volatility is low. And prices are low when volatility is high. Also, as the timeframe widens, the cost decreases.

The Ideal way to trade the NZD/CAD

It is not ideal to trade when the volatility is high, as it is risky. It is also not the best choice to trade when the volatility is low, as the costs are high. So, to keep a balance between both volatility and cost, it is ideal to trade when the pip movement of the pair is around the average values.

Talking about timeframes, trading the 4H or the Daily would be great, as the cost is bearable, and the trade wouldn’t take too long to perform as well.

Another simple hack to reduce cost is by trading using limit/pending orders instead of market orders. This will significantly reduce costs on a trade because the slippage on the trade becomes 0. It is observed that the cost reduces by about 50% of the original value. Below is a table representing the cost percentage when the slippage is made zero.

Categories
Forex Assets

Exploring The Basics Of GBP/CAD Forex Pair

Introduction

GBPCAD pronounced as ‘pound cad” is minor/cross currency pair in forex. GBP refers to Great Britain Pound, and CAD refers to the Canadian Dollar. Since GBP is on the left, it becomes base currency, and CAD on the right becomes the quote currency.

Understanding GBP/CAD

The current market price has of GBPCAD is not similar to the prices in the stock market. The value of GBPCAD represents the value of CAD equivalent to one GBP. It is simply quoted as 1 GBP per X CAD. For example, if the value of GBPCAD is 1.7192, then 1.7192 Canadian dollars are required to purchase one pound.

GBP/CAD Specification

Spread

Spread is the difference between the bid price and the ask price in the market. These values are controlled by the brokers. So, it differs from broker to broker as well as the type of account.

ECN: 0.8 | STP: 1.9

Fees

There is a small levied by the broker on every trade a trader takes. There are a few pips of fee on ECN accounts, while the fee is nil on STP accounts. The fee is usually between 6 to 10 pips.

Slippage

Slippage is the difference between the trader’s demanded price and the real executed price. Slippage happens when orders are executed by the market price. It happens solely due to the volatility of the market and the broker’s execution speed.

Trading Range in GBP/CAD

A trading range is the representation of the pip movement of GBPCAD in different timeframes. These values are helpful in getting a rough idea of the profit/loss that can be made from the trade in a given timeframe. For example, if the min pip movement on the 1H timeframe is 3 pips, then a trader can expect to gain/lose at least $22.38 when one standard lot is traded.

Procedure to assess Pip Ranges

  1. Add the ATR indicator to your chart
  2. Set the period to 1
  3. Add a 200-period SMA to this indicator
  4. Shrink the chart so you can assess a large time period
  5. Select your desired timeframe
  6. Measure the floor level and set this value as the min
  7. Measure the level of the 200-period SMA and set this as the average
  8. Measure the peak levels and set this as Max.

GBP/CAD Cost as a Percent of the Trading Range

Now that we know how much profit/loss can be made within a given time frame let us also calculate the cost on each trade by considering the volatility and timeframe. For this, the ratio between the total cost and volatility calculated and expressed in percentages. The magnitude of these percentages will then be used to determine the timeframe with marginal costs.

ECN Model Account 

Spread = 0.8 | Slippage = 2 |Trading fee = 1

Total cost = Slippage + Spread + Trading Fee = 2 + 0.8 + 1 = 3.8

STP Model Account

Spread = 1.9 | Slippage = 2 | Trading fee = 0

Total cost = Slippage + Spread + Trading Fee = 2 + 1.9 + 0 = 3.9

The Ideal way to trade the GBP/CAD

From the above two tables, it can be ascertained that the percentages largest on the min column, moderate on the average column, and least on the max column. The higher the value of percentages, the higher is the cost of the trade. So with this, we can conclude that the costs are high during low volatility, and low during high volatility. Similarly, the costs are high on lower timeframes and considerably low on higher timeframes. Hence, to keep volatility and cost at a balance, it ideal to trade when the pip movement in the market is around the average values.

Market orders bring in an additional cost in the trade. To eliminate this, one can trade using limit orders. This will set the slippage value to 0, and eventually, reduce the total cost on the trade by a significant amount. An example supporting the statement is illustrated below.

Total cost = Spread + trading fee + slippage = 0.8 +1 + 0 = 1.8

Categories
Forex Assets

Everything About EUR/CAD Currency Pair

Introduction

EURCAD is the abbreviation for the currency pair Euro area’s euro and the Canadian dollar. This is a cross-currency pair, as it does not involve the US dollar. In EURCAD, EUR is the base currency, and CAD is the quote currency. The price of this pair basically tells the value of CAD w.r.t EUR.

Understanding EUR/CAD

The current market price of EURCAD determines the required Canadian dollars to purchase one euro. It is quoted as 1 EUR per X CAD. For example, if the CMP of EURCAD is 1.4700, it is as good as saying that 1.4700 CAD is needed to buy one EUR.

EUR/CAD Specification

Spread

The algebraic difference between the bid price and the ask price set by the broker is known as the spread. Spread varies from time to time and broker to broker. The approximate spread value on an ECN account is 0.8, and on an STP account is 1.8.

Fees

For every position that a trader opens, there is some fee associated with it. And it depends on the type of account model. It is seen that there is no fee on STP accounts and a few pips on ECN accounts.

Slippage

Slippage is terminology in trading, which, by definition, is the difference between the trader’s wished price and the real executed price. That is, the trader does not get the exact price he had intended for. There is some variation due to the volatility of the market and the broker’s execution speed. It usually varies from 0.5 to 5 pips on these minor currency pairs. The slippage is typically lesser on major currency pairs.

Trading Range in EUR/CAD

The trading range is an illustration of the minimum, average, and maximum pip movement in EURCAD. It determines the volatility of the market. The volatility of the market is a vital piece of information in trading, as one can assess the time that can be taken on each trade. And by applying more variables to it, one can determine the cost varies on the trade as well.

Procedure to assess Pip Ranges

  1. Add the ATR indicator to your chart
  2. Set the period to 1
  3. Add a 200-period SMA to this indicator
  4. Shrink the chart so you can assess a large time period
  5. Select your desired timeframe
  6. Measure the floor level and set this value as the min
  7. Measure the level of the 200-period SMA and set this as the average
  8. Measure the peak levels and set this as Max.

EUR/CAD Cost as a Percent of the Trading Range

Cost as a percent of the trading range is a simple yet very effective application of the above volatility table. There is a cost on every trade you take. The total cost of a trade is the sum of slippage, spread, and trading fee. This total cost is divided by the volatility values and is expressed in terms of a percentage. And the percentage values are used to figure out the best times of the day to enter and exit a trade with marginal cost.

ECN Model Account 

Spread = 0.8 | Slippage = 2 | Trading fee = 1

Total cost = Slippage + Spread + Trading Fee = 2 + 0.8 + 1 = 3.8

STP Model Account

Spread = 1.8 | Slippage = 2 | Trading fee = 0

Total cost = Slippage + Spread + Trading Fee = 2 + 1.8 + 0 = 3.8

The Ideal way to trade the EUR/GBP

To determine the ideal way of trading the EURCAD, let us first comprehend what the percentage means.

High percentage => High cost

Low percentage => Low cost

Min column => Low volatility

Max column => High volatility

From the table, we can infer that the percentages are high in the min column and low for the max column. So,

Min column => High percentage

Thus, Low volatility => High cost

Max column => Low percentage

Thus, High volatility => Low cost

It is not ideal during low volatility as costs are high. Also, trading during high volatility is not a good idea as it is quite risky. Hence, to have a balance between both volatility and cost, it is ideal to trade when the pip movement on the currency pair is at the average values.

Another simple hack to reduce the costs is to trade using limit orders instead of market orders. Doing so, the slippage will be automatically cut off from the trade, and the total cost will significantly reduce.

Categories
Forex Assets

What Should You Know About USD/CAD Forex Pair?

Introduction

USDCAD is the short form for the US dollar against the Canadian dollar. USDCAD, just like the EURUSD, GBPUSD, AUDUSD, etc. is a major currency pair. In this pair, the US dollar is the base currency, and the Canadian dollar is the quote currency. Trading this currency pair is known as trading the “loonie” because it is the name for the Canadian one-dollar coin.

Understanding USD/CAD

The exchange price of USD/CAD is basically the value of 1 USD in terms of CAD. It is quoted as 1 US dollar per X* Canadian dollars. For example, if the value of USDCAD is 1.3300, it means that it takes 1.3300 Canadian dollars to buy one US dollar.

*X is the current market price of USDCAD

USD/CAD Specification

Spread

The difference between the bid price and the ask price mentioned by the broker is the spread. Typically, this differs from the type of account.

Spread on ECN: 0.7

Spread on STP: 1.2

Fees

There is a fee (commission) on every trade a trader takes. This again depends on the type of account registered by the user. There is no fee on the STP account, but a few pips on an ECN account.

Note: We are considering fees in terms of pips, not currency units.

Slippage

Sometimes a trader is executed at a different price from what he had intended. This variation in price is known as slippage. Slippage takes place when orders are executed as a market type, and it depends on the volatility of the currency pair and also the execution speed of the broker.

Trading Range in USD/CAD

Trading analysis is not all about predicting when the prices will rise and fall. Sometimes, even though a trader knows the prices are going to rise/fall, it might not be ideal to jump on the trade without the knowledge of volatility of the market. Volatility range plays a major role in managing the total cost of a trade. Hence, it is vital to know the minimum, average, and maximum pip movement in each timeframe to assess the trading costs.

Below is a table that depicts the minimum, average, and maximum volatility (pip movement) on different timeframes.

USD/CAD PIP RANGES

Procedure to assess Pip Ranges

  1. Add the ATR indicator to your chart
  2. Set the period to 1
  3. Add a 200-period SMA to this indicator
  4. Shrink the chart so you can assess a large time period
  5. Select your desired timeframe
  6. Measure the floor level and set this value as the min
  7. Measure the level of the 200-period SMA and set this as the average
  8. Measure the peak levels and set this as Max.

USD/CAD Cost as a Percent of the Trading Range

With the min, average, and max pip movement, the cost range is calculated in terms of percentage. This percentage has no unit and determines if the width of the cost. That is, if the percentage is high, the cost is high for the trade, and if the percentage is low, the cost is low too.

Below are two tables representing the range of cost for an ECN account and an STP account.

ECN Model Account

Spread = 0.7 | Slippage = 2 | Trading fee = 1

Total cost = Slippage + Spread + Trading Fee = 2 + 0.7 + 1 = 3.7

STP Model Account

Spread = 1.2 | Slippage = 2 | Trading fee = 0

Total cost = Slippage + Spread + Trading Fee = 2 + 1.2 + 0 = 3.2

The Ideal way to trade the USD/CAD

As mentioned earlier, the higher the percentage, the higher is the cost for a trade. Applying this idea to the above tables, it can clearly be inferred that the percentages are high on the minimum column. This means that the costs are high when the volatility of the currency pair is very feeble.

Similarly, the costs are considerably low when the volatility is quite high. However, this does not mean that trading during high volatility is the ideal way. This is because the volatility is quite risky to trade volatile markets. Therefore, one must trade during those times of day when the market volatility is around the mentioned average. The costs are decent enough, and the risk is maintained just fine.

Another point of consideration is that costs are reduced significantly when the slippage is made nil. This can be made possible by entering and exiting a trade by placing a pending/limit order instead of executing them by market.

Below is the same cost percentage table after making the slippage value to 0.

Now it is evident from the above table that slippage eats up a significant amount of cost on each trade. Hence, limit orders are the way to go.