Categories
Forex Assets

AUD/ZAR – Analysing The Costs Involved While Trading This Forex Exotic Pair

Introduction

The AUD/ZAR is an exotic currency pair in the forex market. AUD is the Australian Dollar while ZAR is the South African Rand. Trading the AUD/ZAR pair is expected to attract higher volatility than trading major forex currency pairs.

The AUD is the base currency in this exotic pair, while the ZAR is the quote currency. It means that the price associated with the AUD/ZAR pair represents the amount of ZAR that you can buy with 1 AUD. Let’s say that the price of AUD/ZAR is 11.5077; it means that with 1 AUD, you can buy 11.5077 ZAR.

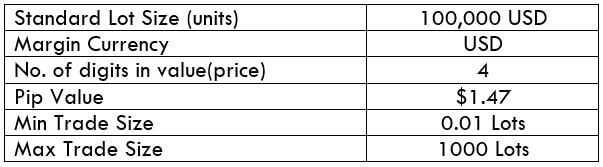
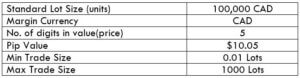
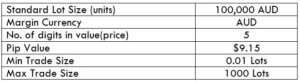
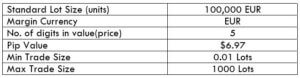
AUD/ZAR Specification

Spread

At any given moment, forex brokers display the “bid” and “ask” price, which represents the price at which you can buy or sell a currency pair. The spread is the difference between these two. The spread for the AUD/ZAR pair is – ECN: 7 pips | STP: 12 pips

Fees

Forex traders with ECN type accounts can sometimes be charged commissions by their forex brokers whenever they open a position. The fees vary with the broker and the size of the position. STP accounts are typically not charged commissions.

Slippage

The price at which we place our trades isn’t always the price at which the broker executes these trades. The difference between the two prices is called slippage in forex trading. It can be because of extreme market volatility or broker inefficiency.

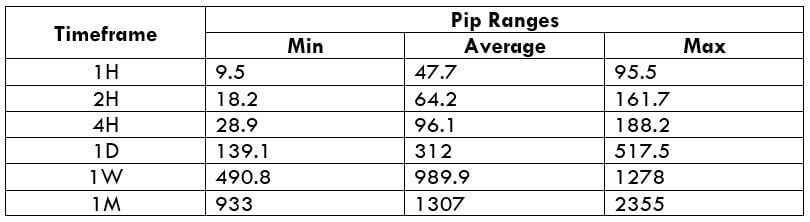
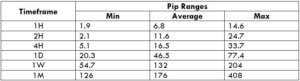
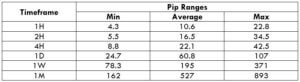
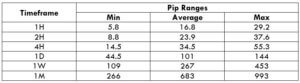
Trading Range in the AUD/ZAR Pair

The trading range refers to the pip movement of a currency pair throughout a trading day. The pip movement can be analyzed across different timeframes to determine the volatility of the pair.

The Procedure to assess Pip Ranges

  1. Add the ATR indicator to your chart
  2. Set the period to 1
  3. Add a 200-period SMA to this indicator
  4. Shrink the chart so you can determine a larger period
  5. Select your desired timeframe
  6. Measure the floor level and set this value as the min
  7. Measure the level of the 200-period SMA and set this as the average
  8. Measure the peak levels and set this as Max.

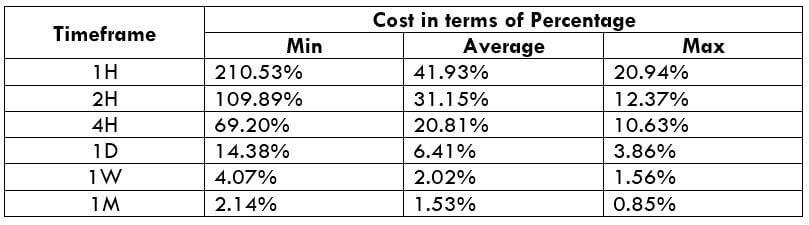
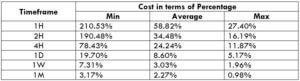
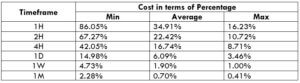
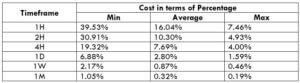
AUD/ZAR Cost as a Percentage of the Trading Range

We can compare the total cost of trading a particular currency pair alongside the volatility of that pair. This will help us determine the total trading costs of the pair across different timeframes and find out the optimal trading periods.

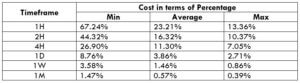
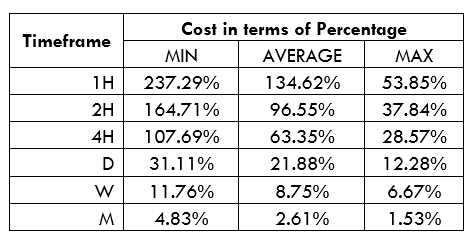
ECN Model Account Cost

Spread = 7 | Slippage = 2 | Trading fee = 1 | Total = 10

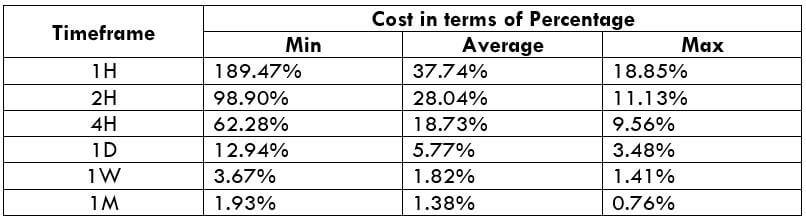
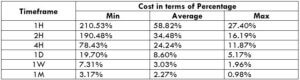
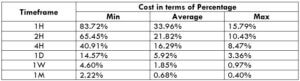
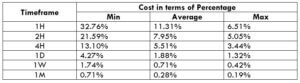
STP Model Account Cost

Spread = 12 | Slippage = 2 | Trading fee = 0 | Total cost = 14

The Ideal Timeframe to Trade the AUD/ZAR

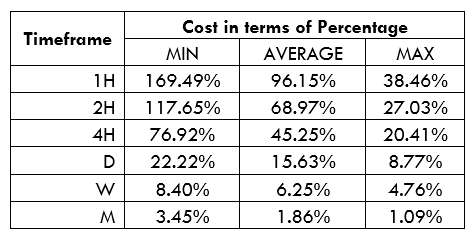
From the analysis of the trading range and the costs in terms of Percentage, we notice that low volatilities attract the highest costs. Since lower timeframes have the least volatilities, it means that trading costs are higher in lower timeframes.

We can say that the ideal timeframe to trade the AUD/ZAR pair is when the volatility is approaching the ‘Maximum”. Traders interested in this pair can also choose to use forex pending orders instead of market orders. With pending orders, you get to eliminate the costs associated with slippage.

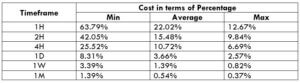
Here’s an example with the ECN account when slippage is 0.

Total cost = Slippage + Spread + Trading fee = 0 + 7 + 1 = 8

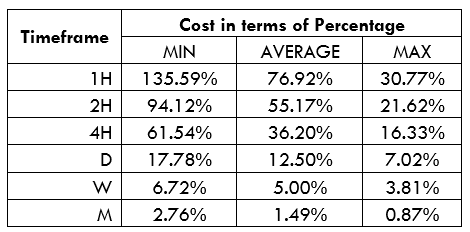
Eliminating the slippage cost has helped reduce the trading costs of the AUD/ZAR pair across all timeframes. The highest cost in the ECN type account has been reduced from 169.49% to 135.59%.

Categories
Forex Basic Strategies

Pro Scalping Technique By Combining Stochastic With Bollinger Bands

Introduction

Scalping is a trading strategy that helps traders to take advantage of minor price movements on lower timeframes. It is one of the quite popular ways of trading the Forex market. There are many successful scalpers who make a lot of money by scalping the minor price moves. To be a scalper, we must be emotionally intelligent and have the ability to make quick decisions.

Scalpers place anywhere from 0 to a few hundred trades in a single day. Ideally, smaller movements in price are easier to catch compared to the longer moves. Typically while day trading, if the win/loss ratio is less than 50 percent, traders still make money. On the other hand, in scalping, it is critical to win most of the trades. Otherwise, we will end up on the losing side.

Stochastic Oscillator

Stochastic is a wonderful indicator developed by George C. Lane in late 1950. This indicator doesn’t follow the price or volume like other popular indicators in the market.  Instead, it follows the speed and momentum of the changes that occur in price before the trend formation. Stochastic is a range bounded indicator, and it oscillates between the 0 and 100 levels.

Typically, a reading above 80-level is referred to as the overbought signal, and a reading below the 20-level indicates an oversold signal. The Stochastic indicator consists of two lines, where one reflects the actual value of the indicator for each session, and another reflects its three-day simple moving average. The intersection of these lines indicates the reversal in price action.

Bollinger Bands

Bollinger Bands is a technical indicator developed by John Bollinger in the 1980s. It is a leading indicator, and it consists of two bands and a centerline. Out of the two bands, one stays above the price action, and the other stays below. Both of these bands contract and expand depending on the market’s volatility. When price action hits the lower band, it indicates a buy trade, and when it hits the upper band, it indicates a sell trade.

The Strategy

The strategy we are going to discuss is one of the most basic but effective scalping strategies ever used in the market. The idea is to apply both indicators (Bollinger Band & Stochastic) on the price chart. When the price action hits the lower Bollinger band, and the Stochastic is at the oversold area, it is an indication for us to go long. Conversely, when the price action hits the upper Bollinger band and if the Stochastic is at the overbought area, we can go short.

In the chart below, we can see that our strategy has generated a few buy/sell signals in the EUR/AUD Forex pair. The price action was in an overall uptrend. When both of the indicators gave us the signal, we took both buy and sell entries accordingly. In the chart below, the buy trades have given us some good profits, but in the sell trades, the profit was comparatively less. Always remember that these things are quite common in scalping. If you are an aggressive scalper, trade both buy sell signals. But if you are a trader who prefers to scalp the market with the trend, follow the next strategy.

Scalping The Market By Following The Trend

Buy Example

The chart below represents an uptrend in the EUR/AUD Forex pair. As you can see, by following our strategy, this pair has given us three buy signals, and all the trades were quite healthy and have performed well in the market. If you scalp the market by following the trend, it is easy to make big gains. For scalping, it is required to put smaller stops. Hence, always go for 4 to 5 pip stop-loss and 10 to 15 pip target. You can also exit your positions when the price hits the upper Bollinger band.

Sell Example

The below 3-minute chart of the GBP/JPY forex pair represents a couple of sell trades. As you can see, all the sell trades in this pair performed very well. We can also observe that every time the price action prints a brand new lower low. We took all the five selling trades on a single trading day, an all of them hit the take-profit range. So if we scalp the market by following the trend, it will be quite easy to make some profits from the market. The red arrows on the Stochastic and Bollinger Band indicators represent the sell signals.

Scalping The Ranges

Just like the trends, it is easy to scalp the ranges as well. In fact, the ranges are even easier to scalp than the trend because the support and resistance lines of the range offer extra signals for us. For ranges, all you need to do is to hit the sell when price action hits the top of the range and hit buy when prices hit the range bottom. If you add the Bollinger Bands and Stochastic indicator, the signals generated by the market will be stronger.

The chart below indicates a couple of buy/sell signals in the GBP/JPY 3-minute Forex chart. As you can see, we have gone long when prices hit the bottom of the range, combined with our strategy. The same applies to the sell-side. We have gone short when the price action hits the top of the range while respecting our strategy rules.

Conclusion

Scalping trading involves entering a trade for a shorter period of time to take advantage of small price fluctuations. When you enter a trade, it is advisable to risk lesser money and place as many trades as you can. We must have control over our inner greed and aim for smaller targets. In the beginning, it will be difficult for you to scalp the market as the smaller timeframes move way faster. You need to train your eyes a bit to understand the lower timeframes properly. Always try to scalp with a bigger trading account because the trading commissions can quickly eat up the smaller accounts.

Categories
Forex Assets

USD/DKK – Analyzing the Exotic Forex Pair

Introduction

USD/DKK is the abbreviation for the US Dollar against the Danish Krone. This pair is considered as an exotic currency pair that typically presents high volatility and low trading volume. The US Dollar is the base currency, and the Danish Krone is the quote currency.

Understanding USD/DKK

The value of USD/DKK represents the value of DKK that is equivalent to one US Dollar. It is quoted as 1 USD per X DKK. So, if the current value of this pair is 6.9868, then these many Danish Krones are required to purchase one US Dollar.

Spread

Spread is the difference between the bid and the ask price of a currency pair. It is the primary way through which brokers generate revenue. It varies from broker to broker and also the model of execution.

ECN: 14 pips | STP: 15 pips

Fees

The fee is simply the commission that you pay on each trade you take.

Fee on ECN – 3-6

Fee on STP – 0

Slippage

Slippage is the difference between the price which was intended by the client and the price he got from the broker. This difference changes with the market’s volatility and the broker’s execution speed. Slippage on exotic pairs is typically high.

Trading Range in USD/DKK

As it is pretty evident from the table, the trading range is an illustration of the pip movement in a currency pair in different timeframes. These values help us determine the minimum, average, and maximum profit or loss that can be incurred in a trade during a specified time frame. Another application for this table is discussed in the next topic.

Procedure to assess Pip Ranges

  1. Add the ATR indicator to your chart
  2. Set the period to 1
  3. Add a 200-period SMA to this indicator
  4. Shrink the chart so you can determine an extensive period
  5. Select your desired timeframe
  6. Measure the floor level and set this value as the min
  7. Measure the level of the 200-period SMA and set this as the average
  8. Measure the peak levels and set this as Max.

USD/DKK Cost as a Percent of the Trading Range

Cost as a percent of the trading range is an application to the above volatility table. The below two tables depict the total cost variation in different volatilities and timeframes for ECN and STP accounts.

Note: The percentages are obtained by finding the ratio between the total cost and the pip movement values in the above table.

ECN Model Account

Spread = 14 | Slippage = 3 |Trading fee = 3

Total cost = Slippage + Spread + Trading Fee = 3 + 14 + 3 = 20

STP Model Account

Spread = 15 | Slippage = 3 | Trading fee = 0

Total cost = Slippage + Spread + Trading Fee = 3 + 15 + 0 = 18

The Ideal way to trade the USD/DKK

What do the percentage values mean? Comprehending the above tables is simple. The higher the magnitude of the percentage, the higher are the costs for that particular volatility and timeframe. Similarly, lower percentage values mean that the costs are low.

Trading during high volatilities or when the cost is high is not ideal. So, to ensure an equilibrium between the two, it is best to enter the market during those times when the volatility is around the mid values illustrated in the volatility table.

Apart from this, one can reduce their total costs significantly by placing orders using limit/pending orders instead of market orders. This will altogether remove the slippage factor on the total cost and bring down its value by a high number.

As already mentioned, exotic currency pairs are highly volatile and have low trading volume. This results in higher costs on the trade. Hence, if you really want to trade this pair, it is recommended to follow the above-mentioned mentioned techniques to reduce costs by a considerable amount. Cheers!

Categories
Forex Assets

Fundamentals Of CAD/CHF Forex Currency Pair

Introduction

CAD/CHF is a currency pair where two currencies, namely, the Canadian dollar and the Swiss franc, are involved. It is a cross-currency pair. Here, CAD is called the based currency, and CHF is called the quote currency.

Understanding CAD/CHF

The current market price of CADCHF tells the value of CHF equivalent to one CAD. It is represented as 1 CAD per X CHF. For example, if the value of CADCHF in the market is 0.7372, then one must pay 0.7372 Swiss francs to buy one Canadian dollar.

Spread

In simple terms, the spread is the difference between the bid price and the ask price set by the brokers. It is not a fixed value and differs from time to time and broker to broker. It also varies based on the type of execution model.

ECN: 1 | STP: 2

Fees

The fee is the commission that is levied by the broker on each trade a trader takes. This, too, like the spread, differs from broker to broker and the type of their execution model. Fee on ECN accounts is 6-10 pips, while it is nil on STP accounts.

Slippage

Slippage is the difference between the trader’s executed price and the price he actually received from the broker. There is always this difference due to the volatility of the market and the broker’s trade execution speed. Note that slippage only happens on market orders.

Trading Range in CAD/CHF

Apart from analyzing the direction of the market, one must predetermine their risk and reward based on the volatility and the timeframe. Knowing how much a trader will gain or lose in a given time frame is a vital trade management tool. And below is a table through which one can determine their profit/loss that can be made in a specified timeframe. For example, the average pip movement on the 1H timeframe is 6.8. So, a trader can expect to be in a profit of $68.34 or in a loss of the same amount.

Procedure to assess Pip Ranges

  1. Add the ATR indicator to your chart
  2. Set the period to 1
  3. Add a 200-period SMA to this indicator
  4. Shrink the chart so you can assess a large time period
  5. Select your desired timeframe
  6. Measure the floor level and set this value as the min
  7. Measure the level of the 200-period SMA and set this as the average
  8. Measure the peak levels and set this as Max.

CAD/CHF Cost as a Percent of the Trading Range

An application to the above volatility table is to find the cost differences on trades by considering the volatility and the total cost on a trade. Below is the table that illustrates the variation in cost on a trade, in terms of percentage. The comprehension of it is discussed in the subsequent topic.

ECN Model Account

Spread = 1 | Slippage = 2 |Trading fee = 1

Total cost = Slippage + Spread + Trading Fee = 2 + 1 + 1 = 4

STP Model Account

Spread = 2 | Slippage = 2 | Trading fee = 0

Total cost = Slippage + Spread + Trading Fee = 2 + 2 + 0 = 2

The Ideal way to trade the CAD/CHF

The higher the magnitude of the percentage, the higher is the cost of the trade.

The values in the table are least in the min column and highest in the max column. This simply means that the costs are high when the volatility of the market is low and vice versa.

In the average column, the values are not as low as in the max column, and not as high as in the max column. The volatility here is moderate too. Hence, this becomes our ideal time of the day to trade in the market.

To sum it up, one must trade during those times of the day when the volatility is more or less near the average values. This will ensure decent volatility as well as minimal costs.

There is another simple technique to reduce costs on trade. When trades are executed using limit order instead of market orders, the slippage becomes nil. So, this brings down the total cost of the trade by a significant value.

Categories
Forex Assets

What Should Know About The AUD/JPY Currency Pair?

Introduction

AUDJPY is the abbreviation for the Australian dollar and the Japanese yen. It commonly referred to as “Aussie yen.” It is one of the cross-currency pairs in the forex market. AUD, being on the left, is termed as the base currency and JPY as the quote currency.

Understanding AUD/JPY

The market price of AUDJPY corresponds to the value of JPY that needs to be paid to buy one AUD. It is quoted as 1 AUD per X JPY. For example, if the value of AUDJPY is 74.571, then these many units of the yen are to be produced to purchase one Australian dollar.

AUD/JPY Specification

Spread

Spread is the medium through which brokers generate their revenue. They set different prices for buying a currency and selling a currency. The difference amount becomes their profit margin. The spread usually changes from time to time and varies on the type of execution model.

ECN: 0.7 | STP: 1.6

Fees

Apart from spreads, one needs to pay a charge for every execution a trader makes. It is essentially the commission levied by the broker on each trade. As a matter of fact, there is no fee on STP accounts. But, on ECN accounts, there is a fee of few pips.

Slippage

Going by the definition, slippage is the difference between the price executed by the trader and the price he actually received. It could be in favor of the trader or against him. It all depends on the broker’s execution speed and the change in the volatility of the market.

Trading Range in AUD/JPY

A trading range is a tabular representation of the minimum, average, and the maximum pip movement in a currency pair on different timeframes. These values help in determining the profit that can be made or loss one must bear in a given time frame. And this can be found out by simply finding the product between the pip movement and the value per pip ($9.15).

Procedure to assess Pip Ranges

  1. Add the ATR indicator to your chart
  2. Set the period to 1
  3. Add a 200-period SMA to this indicator
  4. Shrink the chart so you can determine a large time period
  5. Select your desired timeframe
  6. Measure the floor level and set this value as the min
  7. Measure the level of the 200-period SMA and set this as the average
  8. Measure the peak levels and set this as Max.

AUD/JPY Cost as a Percent of the Trading Range

Cost as a percent of the trading range is an illustration of the cost variation by considering the total cost and the volatility of the market in different timeframes. These values are expressed in a ratio that is converted to percentages. And the magnitude of these percentages helps in determining the cost variation in each trade.

ECN Model Account

Spread = 0.7 | Slippage = 2 |Trading fee = 1

Total cost = Slippage + Spread + Trading Fee = 2 + 0.7 + 1 = 3.7

STP Model Account

Spread = 1.6 | Slippage = 2 | Trading fee = 0

Total cost = Slippage + Spread + Trading Fee = 2 + 1.6 + 0 = 3.6

The Ideal way to trade the AUD/JPY

Though Forex is a 24/7 market, it is not ideal to enter any time in the market. There are certain times when you must enter the market, which can help reduce costs significantly. Let us determine that using the above tables.

Note that the higher the magnitude of the percentage, the higher is the cost of the trade. From the table, it can be ascertained that the values are high in the minimum column, implying that the costs are high when the volatility of the market is low. Similarly, the costs are low when the volatility is high. However, it is not ideal to trade during these times. To ensure optimum volatility and affordable cost, one must trade during those times when the volatility is around the average range.

Furthermore, there is another way through which you can reduce your costs. Trading using limit orders instead of the market orders brings down the total cost significantly, as the slippage becomes zero. The decline in the costs on the trade when slippage is made zero is shown below.

Categories
Forex Assets

Understanding The EUR/AUD Forex Currency Pair

Introduction

EURAUD is a minor/cross currency pair traded in the forex market. EURAUD is the abbreviation for the euro area’s euro and the Australian dollar. The left currency, EUR is the base currency and the one on the right, AUD is the quote currency. The price of EURAUD basically tells the value of the Australian dollar.

Understanding EUR/AUD

The exchange rate of EURAUD shows the Australian dollars required to purchase one euro. It is quoted as 1EUR per X AUD. For example, if the value of EURAUD is 1.5995, it means that these many units of AUD are to be possessed by the trader to buy one unit of EUR.

EUR/AUD Specification

Spread

Spread is the way through which brokers make money. It is merely the difference between the bid price and the ask price set by the broker. These prices are often different from broker to broker. The spread differs based on the volatility of the market as well. The approximate spread on an ECN account and an STP account is given below.

ECN: 0.9 | STP: 1.7

Fees

For every trade a trader takes, there is some fee associated with it. And this fee is charged only by ECN type brokers. Typically, there is no fee on STP type brokers. The fee range is usually between 6 pips and 10 pips.

Slippage

A trader can place trades using either market order or using a limit order. In the case of market orders, the trader doesn’t get the exact price at which he executed the trade. The real price he received is different. This difference in the price is referred to as slippage.

Trading Range in EUR/AUD

As a professional trader, it is vital to know how many pips the currency pair moves in each timeframe. It gives the trader an idea of how long he must wait for his trade to perform. Traders can also assess their profit/loss in a given time frame. For example, if a trader takes a trade by analyzing the 1H timeframe, and the min market volatility is three pips, then he can expect to win or lose at least $20.91 (3 pips x $6.97 value per pip).

Procedure to assess Pip Ranges

  1. Add the ATR indicator to your chart
  2. Set the period to 1
  3. Add a 200-period SMA to this indicator
  4. Shrink the chart so you can assess a large time period
  5. Select your desired timeframe
  6. Measure the floor level and set this value as the min
  7. Measure the level of the 200-period SMA and set this as the average
  8. Measure the peak levels and set this as Max.

EUR/AUD Cost as a Percent of the Trading Range

Apart from knowing the potential profit/loss from the volatility of the market in different timeframes, one can also determine the cost variation by considering the volatility and the timeframe. For this, the ratio between total cost and volatility is taken into account. It is then expressed in terms of percentage. The magnitude of the percentage determines the cost of each trade.

ECN Model Account

Spread = 0.9 | Slippage = 2 | Trading fee = 1

Total cost = Slippage + Spread + Trading Fee = 2 + 0.9 + 1 = 3.9

STP Model Account

Spread = 1.6 | Slippage = 2 | Trading fee = 0

Total cost = Slippage + Spread + Trading Fee = 2 + 1.7 + 0 = 3.7

The Ideal way to trade the EUR/AUD

Now that we’ve got the values from the above table, here is our ideal way to trade the EUR/AUD.

The higher the magnitude of the percentages, the higher is the cost of the trade on that particular timeframe. Comprehending this to the above table, it is seen that the percentages are highest and lowest on the min and max columns, respectively. This, in turn, implies that the costs are high when the volatility of the market is feeble. And the costs are low when the volatility is high. So, it is ideal to trade on any timeframe, given the volatility of the market is above average volatility. This will ensure the fairly high volatility with affordable costs.

Furthermore, the costs can be made much lower by placing limit orders instead of market orders because this will reduce the slippage on the trade to zero. As an example, the cost percentage table is given by ignoring the slippage value.

Thus, comparing the two tables, it is evident that the costs have reduced by 50%.

Categories
Forex Course

9. Understanding The Concept Of ‘Pip’ In Detail

Introduction

‘Pip,’ the word sounds pretty familiar, right? Well, that’s because this is a fundamental term when it comes to trading in the forex market. Pip forms the base for reading the price changes in the currencies. Hence, understanding this lesson is very important. So, let’s begin by defining what a pip is.

What is a pip?

Pip is a unit of movement in currency pairs. It basically tells, by how many values the price of the currency pair has changed. A pip is the same for all the pairs except for the currencies paired with JPY. One pip for every JPY pairs is 0.01 while it is 0.0001 for the rest. Hence, the fourth decimal place in the price of the currency pair represents a pip for non-JPY pairs, and the second decimal place in the price represents a pip for JPY pairs. Now, let us comprehend this with an example.

Let’s say the current market price of EURUSD is 1.1000. We say a currency price has moved by one pip when the price rises to 1.1001. Similarly, when the price goes up to 1.1008, we say the price has moved to by 8 pips (w.r.t 1.1000). Taking it further, if the price goes up even higher until 1.1010, we say the market has risen by 10 pips. From these three examples, we can come up with the formula for pip as follows:

Pip = current market price – initial price under consideration (For long position)

Pip = initial price under consideration – current market price (For short position)

Let’ say the CMP of USDCAD is 1.3230. Later, the price shoots to1.3293. Let us calculate how many pips have this pair increased.

Pip = 1.3293 – 1.3230

Pip = 0.0063

Hence, the currency has risen by 63 pips.

Pips extended

The change in the value of the price on the fourth decimal point represents the pip change between 0-9.

The change in the value of the price on the third decimal point represents the pip change between 10 and 99.

The change in the value of the price on the second decimal point represents the pip change between 100 and 999.

The change in the value of the price on the first decimal point represents the pip change between 1000 and 9999.

Let us understand this by an example. Let’s say the current market price of a currency pair is 0.5829.

Here, 9 indicates 9 pips,

2 indicates 20 pips,

8 indicates 800 pips, and

5 indicates 5000 pips.

What is Pip a value?

The pip value adds value to the pip by determining its ‘worth’ in terms of the base currency. Pip value for a currency pair can be calculated using the below formula.

Pip value = change in the value of counter currency * exchange rate ratio

Example: Let’s say the price of GBPUSD is 1.2450. That is, 1 GBP is equal to 1.2450 USD. Now, if price moved by one pip, i.e., to 1.245. The pip value for this can be calculated as follows.

Pip value = 0.0001 USD * (1 GBP/1.2450 USD)

Pip value = 0.00008032 GBP

Hence, by trading one unit GBPUSD, you will make 0.00008032 GBP. Similarly, trading 100,000 units of this pair, you will get 8.032 GBP.

What is Pipette?

Apart from pips, brokers represent quotes in pipettes, as well. An increase in the decimal place of a pip will get you the pipette value. So, the 5th decimal and 3rd decimal place represents pipettes for non-JPY pairs and JPY pairs, respectively.

For example, if the price of EURUSD increases from 1.21001 to 1.21002, we say the price has risen by 2 pipettes.

That’s all about Pips. If you have any more questions, let us know by commenting below. Don’t forget to check your learning by answering the below questions.

[wp_quiz id=”44951″]