Categories
Forex Basic Strategies Forex Trading Strategies

Why You Should Spend More Time Working on Strategies

Time, something that forex trading needs a lot of, and there are a lot of different things that you can be spending your time on. So much so that you are most likely leaving certain things out. For many, that thing would be the creation of their strategy. Either you are spending too much time on other things, or you simply just want to get started with your trading. Either way, you won’t be spending enough time on your strategy, getting it right and so this can lead to some negative results. Today, we are going to be looking at some of the reasons why you should be spending just a little more time on your strategy.

Create It

The first step for any strategy is to simply create it. Depending on the strategy it can take a different amount of time to create. Some will take a few hours, others may even take a few days to create. You need to look at what you are planning to trade, when you are planning to trade it, and also how much free time you have, as this will affect the type of strategy that you can use. You need to take your time when creating it, do not rush it, the last thing that you want is a half-complete strategy, you won’t get any success from that. So take as long as you need in order to ensure that your strategy is working and is suitable for the current trading conditions.

Learn It Inside Out

There is absolutely no point in only learning the bare bones of the strategy that you are planning on using. Instead, you need to learn everything that there is to know about it, for a number of different reasons. You need to know what the training rules are in order to know when you should be putting on trades and when you should be avoiding trades. Knowing which market conditions work well for it and which ones do not. You need to learn the limitations and what the strengths are of the strategy. Ensure that the first thing that you do is learn what there is to know about it before you even consider starting to put on trades.

Learn How to Adapt It

Let’s be honest, sometimes a strategy works brilliantly, the markets are working for you and each trade that you put on is doing well, but that isn’t going to last forever. It never will because the markets will always be changing. Due to this, you need to have a good understanding of how you can adapt the strategy that you are using. In order to do this, you will need to spend a little extra time looking at different contingencies. If you do not do this, then as soon as the markets change, you will struggle to make profitable trades as you do not know how to adapt the strategy and so stick to the older rules that were previously working before. So spend that extra time on your strategy to work out how you can make small and subtle changes to keep up with the ever-changing markets.

Learn More Than One Strategy

There will be times during our trading career when we believe that we have learned all that there is to learn when it comes to the strategy that we are using. That is great, but that doesn’t mean that there is nothing else for you to learn. Your strategy may work well in certain conditions, but it won’t work in all of them. So in order to combat this, we need to start thinking about learning a second strategy too. This will give you a lot more variation in your trading. It will give you better insights into how you can trade and will also let you trade when your other strategy would not work well. You never know, it may also help you to learn a little bit more about the strategy that you are already using or to look at it from a different point of view, giving you the opportunity to improve it further than you thought you could.

Never Stop Learning

We have covered this a little bit above, but the fact is that you will never actually stop learning about your strategy or even new strategies. You should never get into the mindset that you are always able to learn more and always able to improve. As soon as you begin to get complacent, that is where the problems often start. Never sit back and believe that you know it all, consider looking into new aspects of trading which could then give you better insight into your own strategies.

Stay Vigilant

You will need to remain vigilant on things like your trading rules. We have set those rules for a reason. They are there to give us an idea of when we should be trading, what we should be trading, and when we should be getting out of trades. The rules are there to be followed and so we should stick to them as much as we can. When we go against those rules then we are placing what would be considered bad trades. We need to spend that little extra time making sure that we are placing the right trade, it may add an extra few seconds or minutes to each trade but the overall results will be worth it, ember, those rules are there for a reason.

Always Adapting

Once your strategy has been created, that is not the end. You will always need to continue to adapt and change little parts of it. The market conditions will be constantly changing, and so you will need to adapt to it. Most strategies have the capabilities of working within different trading conditions, changing parts to better suit them. You will only be able to do this by knowing the strategy inside out and by spending a little extra time to work out what it is that you need to change in order to adapt it and how you can maintain the strategy’s profitability.

So those are some of the reasons why you should be spending a little more time working on our strategies. You don’t have to stick to one once you believe you have mastered it, but you should also remember that you have never learned everything that there is to know about the strategy that you are using. Spend some time developing it, but then also make sure that you spend some time following it too.

Categories
Forex Trading Strategies

Scalping Strategies In Detail: How to Choose Assets, Instructions, and More

There’s so much to know about scalping strategies. Scalping can provide fast, unlimited profits, but does come with risk. Knowing how to choose the instrument of negotiation is a matter of utmost importance, not only for a scalper, but in the life of a scalper there is the situation of fighting for every point of profit, and a sudden change in prices can lead to a significant loss.

Basic requirements for a better currency pair for scalping:

The narrowest and most floating spread possible. This condition is fair for highly liquid pairs and large transaction volumes: GBP/USD, EUR/USD. To be able to compare the differentials of the different currency pairs that the broker offers us, we can make the data useful from the MyFxBook portal.

Moderate volatility. Liquidity and volatility have a kind of reverse correlation. It is difficult to buy/sell a currency pair with high volatility. And vice versa, high-liquidity currency pairs have low volatility. It is very important to maintain balance, the volatility calculator can help you to do so. According to the calculator, the best currency pair for scalping is EUR/USD.

For night scalping (flat), you can trade the pair with relatively low volatility USD/CAD, AUD/USD. I want to emphasize that the meaning of the best currency pair for scalping is subjective. Price movements depend as much on external macroeconomic factors as on foreign exchange manipulations by large investors (market makers). For this reason, depending on the time, different pairs of major currency pairs or cross pairs can become the best for scalping. So, there are some tips on how you can select the best pair for scalping:

You must feel comfortable when you operate. Find your own trading style and the most suitable currency pair, investing all the time you need in training in a demo account.

Be flexible. Today you get positive results by trading in one currency pair, tomorrow, in another currency pair.

Manage foreign exchange risks. In addition to the general rules on the volume of open positions, there is one more rule regarding scalping: you should not open transactions for the two increasing currency pairs at the same time. While it can double your profits, it also doubles your potential risks, as both pairs can be reversed at the same time.

There are no recommendations on the best indicators and technical tools for scalping. Everything is individual here. Someone is satisfied with the standard MT4 indicators, someone installs unique authoring tools. Trading performance does not depend as much on the tools as on the ability to use them.

Forex Scalping Strategies: Examples

The use of scalping on Forex means that a Forex trader is under an “obligation” to monitor intensively trades and open positions. The strategies described below are based on technical indicators but are used as complementary tools for intuition and practical experience. Therefore, before you start using these strategies in a real account, practice them over and over again until they are fully automatic. And remember that there are no perfect strategies and the suggested ideas are just the basics. Don’t be afraid to experiment by adding something of your own, create something of your own, unique based on this basis!

How to Install Scalping Strategy Patterns on MT4: The trading systems described below mean that using combined indicators that are not included in MT4 and other platforms as standards. These indicators are loaded and you can find them in the “Custom Indicators” tab, the loaded pattern is located in the “Graphics / Patterns” tab. Depending on the type of operating system, folder names may differ. 

Classic Scalping 

This strategy is based on very basic technical tools, are 4, and are combined in a pattern: two simple moving averages, RSI and MACD. The strategy is classic, based on the principle: “Don’t reinvent the wheel, learn to feel the market”. The recommended time frame is M5. The 1-minute interval will send many false signals, but you can try looking for signals in non-standard time frames of 5 to 15 minutes. Recommended pairs: EUR/JPY, EUR/GBP: are the most effective trading signals for them.

Advantage of Beginner Strategy: Train standard indicator application skills, improve your attention (looking for multiple conditions that are met at the same time).

Configuration of the indicators:

  1. МАCD: MACD SMA (9), lento ЕМА (26), Fast ЕМА (12), applies to Close.
  2. RSI: Period (26). Base levels can be maintained: (50). Apply to Close.
  3. EМА (Exponential Moving Average): Period (20), Apply to Close. Change 0
  4. LWМА (linearly weighted ), is a moving average: Period (10), Apply to Close. Change 0

The best time for currency scalping is the European session, at this time these pairs are trading more actively, so the liquidity in the market is the highest.

Conditions for opening to a long position:

  1. МACD has been below zero level for some time, then draw a graph above zero.
  2. RSI in the same range of sails penetrates level 50 from the bottom up.
  3. LWМА (orange line) is above EMA (blue line). The perfect condition is when LWMА in the same interval penetrates EMA from the bottom up.

The trade will open in the next candle after the main condition is met, MACD intersection at level zero. The rest of the signals in this case are confirmation signals, but you should not enter an operation unless all conditions are met. We place a stop at the level of 5 points (you can a little more, depending on volatility). The estimated earnings are 5 points regardless of spread coverage. By reaching the target, the transaction can be secured by trailing or closing. The second option is more acceptable. During the release of important news, this strategy does not work.

Conditions for opening a short position:

  1. МACD has been above zero for some time, and then draws a graph below zero.
  2. RSI in the same range of sails penetrates level 50 from top to bottom.
  3. LWМА, represented by an orange line, is below the EMA, represented by a blue line. A perfect choice would be if LWMA in the same range penetrates EMA from top to bottom.

Market entry is similar: as soon as the MACD penetrates level zero, an operation can be opened.

You shouldn’t have a big win. The strategy suggests winning just a few points. Signals appear almost every day, so you can not limit more than one or two currency pairs. If you have managed to resume the beginning of the trend, you can increase the size of the target benefit.

Credit: Investopedia

Scalping In A Saturated Market

This scalping strategy aims to resume the moment of maximum saturation of the market. That is such a state when the trend is already ending and there is an inertial movement of price just before the reversal.

The strategy uses the Laguerre Volume indicator, which helps you identify the moment of saturation of the market volume. Its developer, John Ehlers, originally worked with equipment designed for space signal processing in the 1970s. As he was a proponent of cycle theory, the indicator was developed on the basis of this theory. It was eventually modified by a French mathematician Laguerre.

The indicator is efficient for signaling the start and end of micro-trends. I’m not suggesting you try to understand the indicator’s calculation formula unless you are an expert in mathematics and programming. Just download your ready pattern here. This strategy will suit perfectly those who are just starting scalping, as the M15 time frame allows you to estimate the signal without haste and gives you more time to make a decision. The currency pair is USD/CAD, traded when the market operates unchanged after saturation.

Advantage of the beginner strategy: it is a simple strategy that does not require high concentration and emotional stress on the part of a trader.

Laguerre Volume configurations: gamma = 0.618, the number of bars analyzed = 5000, Levels: 1; 0.75; 0.5; 0.25; 0. The gamma value is used to calculate the indicator levels. The higher the value, the smoother the line will be. The value of 0.618 in this case is the optimal balance between smoothing and lag.

Conditions for opening to a long position:

  1. Trading takes place during the night period of the flat from 00:00 to 07:00 ЕЕТ. After active trading during the European session, there is the attenuation phase with inertial price movements.
  2. Laguerre Volume first crosses level zero and then reaches level 1.
  3. During the increase of the indicator to level 1, there is an increasing candle with the body that is not less than 3 points.
  4. You can enter an operation in the next candle by covering it with a stop loss at a distance of 8-10 points. The target profit is 5 points, after that, you can completely close the position or part of it, moving the stop to the entry-level or leaving the position open by protecting it with a trailing stop.

Conditions for opening a short position:

  1. Trading takes place from 00:00 to 07:00 ЕЕТ.
  2. Laguerre Volume first crosses level zero and then reaches level 1.
  3. During the increase of the indicator to level 1, there is a candle that falls with the body that is not less than 3 points.
  4. The principle of opening the transaction is similar.

Laguerre volume does not always increase in the interval from 0 to 1 ideally straight. Sometimes, there are setbacks, and then, it resumes by rising. That is why, if the indicator reaches, for example, the level 0.9 and is reversed, it is better not to open a transaction. The straighter the indicator’s path to target level 1, the more accurate the signal is. You should not open an operation if the indicator tests the level twice, as shown in the figure above. You can test the strategy in pairs, including Australian and New Zealand dollars, other currency pairs should not be traded with this strategy.

“Scalping by Trend” Strategy

Unlike other trading systems, this trading approach suggests entering a number of trades at the beginning of the trend. In theory, one could put a single input and maintain it until the trend is reversed, but scalping also involves taking profits from setbacks/corrections. And also, this strategy will allow you to win money with short trends.

The strategy uses the following indicators: Classic Stochastic and Awesome Oscillator (Awesome Oscillator)», learn more about the principle of calculation and application here. Two moving averages analyze the trend line in the one-hour time frame.

Advantage of the beginner strategy: it is a good example of how you can make money with scalping additionally using a longer time frame. The pair will be GBPUSD, the main trading interval is M5, the auxiliary is H1. Trading takes place in the European session. 

Configuration of the indicators:

  1. Awesome Oscillator: all settings are default.
  2. SMA 1: Period 50, represented by a red line, is applicable to close.
  3. SMA 2: Period 200, represented by a blue line, is also applicable to close.
  4. Stochastic: %К – 14, %D – 7, Slowing down – 7, Sliding method – Simple, Levels – 20 and 80 (basic).

Conditions for opening to a long position:

  1. Chart analysis with time frame H1. The direction of both slides: up. The red slip should be above the blue.
  2. Analysis of the graph with time frame M5. Stochastic is in an area that we call oversold, this happens when it is between levels 0 and 20, and in the signal, candle leaves it. Awesome Oscillator draws a column of green, always below level 0.
  3. The more vertically the stochastic exits the oversold zone, the more accurate the signal is. After all, conditions match in the next candle, you can open a transaction. The target benefit is 10-15 points, the stop can be placed the same or a little more.

Conditions for opening a short position:

  1. Chart analysis with time frame H1. The direction of both slides: downward. The red slip should be below the blue.
  2. Analysis of the chart with time frame M5. Stochastic will be in the area we call overbought when it is between levels 80 to 100, and in the signal, a candle comes out of it. Awesome Oscillator always draws a column of red above level 0.
  3. The condition of opening the transaction is similar. If the trend is constant, you can open a series of transactions.

Scalping By Levels

Level trading suggests two scenarios: breaking the channel limit with the start of the new trend or rebounding from the limit (support/resistance level) and returning to the middle of the channel, that is, to the equilibrium level. This is a perfect scenario. In reality, everything we have set out here may be something different:

The channel boundary break may be an inertial price movement and may not start a new trend, the price may return to the channel after a brief movement.

Movement within the channel can also be chaotic. After a rebound from the limit, the price fails to reach the mean (let alone the opposite limit) and is reversed.

For an intraday channel strategy, these are all risks. But not for the scalping that allows you to make profits both from the channel break and from price swings within the channel. The psychological levels, in this case, serve as an objective reference that helps you to assume at least approximately the potential reversal points within the channel.

The strategy suggests building a “Slip Envelope” where the price will return. Stochastic will identify the probability of channel boundary break, internal levels are created based on Fibonacci levels. Stochastic in this case will be a complementary tool, moving averages and levels with coefficients of 61.8; 161.8; 261.8; 361.8 are combined in a single MavEn indicator, which you can download through this link. The moving averages in the indicator are constructed by adding 3 LWMA with periods (30, 50, 100), which shall be weighted by the closing price.

Advantage of beginner strategy: an excellent combination of scalping and channel strategy.

Time Frame – М5 (5 minutes), torque – EUR/USD. MavEn configuration unchanged. Stochastic configurations: %К – 14, %D – 3, Slowing down – 3, Prices – Low/High, Sliding method – Simple. The levels are standard (20, 80).

Conditions for opening a long position:

  1. The candle closes below the red line.
  2. Whenever we find the price below the red line, the oscillator drops to the oversold zone (below level 20).
  3. Both the price and the stochastic must be below the red line for more than 10 candles.
  4. The price goes up above the red line.
  5. After the candle closes above the red line, we open an operation with a stop at a distance of about 10 points. We leave the market when the orange line is reached (Fibonacci level 61.8).

Conditions for opening a short position:

  1. The candle closes above the red line.
  2. While the price is above the red line, the oscillator goes up to the overbought zone (above level 80).
  3. Both the price and the stochastic must be above the red line for more than 10 candles.
  4. The price drops below the red line.

The conditions for exit from the market are similar. Other lines are auxiliary, but, if they begin to indicate a reversal and the profit has already covered the spread, we close the deal and wait when the price exceeds the limit for the next time. If the price for a long time is between the red and blue lines (8-10 candles and more) or outside the red line, we do not enter the market.

Categories
Beginners Forex Education Forex Basic Strategies

How to Get Better Results Out of Your Forex Strategies

Some many strategies are developed but all traders have one in common, the element that separates them from the pack (most starters lose). These traders have tested their strategies to the bone which gives them a really good chance to have profits at the end of the year. So, yes, they are slow turtles, actually, they are not racing at all. That element is called persistence, it is present in so many ways and many aspects of trading. Each of the trader’s eras requires persistence which ultimately improves your overall trading skills. Now, here is how to improve results with just this one element, even though we could argue there are many, we believe this one is the one that cannot go away if you want to see the results every year. 

Strategies that Work

It would take many pages to describe how you can improve a strategy classified as a reversal, swing trading, scalping, channel breakouts, deviation probability, and so on. You can even mix strategies based on the market conditions or mix the theories to create a “diversified” decision. At the end of the day, backtesting results will judge if that strategy combo is working or not. Strategies that work are the ones that are tested out and give good results over and over in the long term. It is great we have demo accounts so we can test as much as we like, yet we need to be persistent in this endeavor to find the right combo. And this is how most traders start, testing their first strategies. The first and the best way to improve your strategy is by analyzing the test results from the excel table, myfxbook, or any other journaling tool.

The stats are a good giveaway of what is good and bad with your strategy. The P/L line is not always the most important, pay attention to other markers such as the drawdown, profit factor, Sharpe Ratio, and other, trade-specific stats, such as Risk to Reward ratio, how much money you risk per trade, and so on. The amount of attention and work you invest in this stage will equal how much your strategy is improved. However, do not spend a year on one project just to conclude it does not work, take a hit and abandon ship. Persist. There is so much to explore out there. 

The Iron Mind Strategy

All that work you have done is paying off, your strategy works consistently in your backtests. Forward tests confirm you can make good money, all you have to do is go live. And disaster strikes. Feeling broken or mad? Does not matter, to make it in this game you need to persist. At this point, if your strategy works mathematically, there is one factor that could ruin your nicely developed system. Your psychology probably failed. The system never had a chance to do its thing because you kept interfering. 

We would advise you to start with indicators since they are strict, unlike our minds. Especially on very important trading parts such as risk management. We can get emotional, we might be tired, drunk, or something else, If we let our physical and psychological state interfere with our trading we cannot get persistent results. And there is that word again. 

Indicators are an easy solution for this, but it might not be enough, we have to accept the strategy could be better if we interfere less and let the tools work. The extent of how many indicators and tools you have in your strategy depends on you. It still might not matter because beginner traders think they can do better. Some traders drop the indicators once they become experienced reading the charts, some keep them forever and look out for better ones. 

Keeping the Mind Open

Traders can put the badges on once they overcome psychological issues. The strategies they have are finally doing what they do in the backtests year after year. With these, they can become pros, using their own money or having investors. However, traders will need to improve on what they already have. They need to be persistent still because at some point the market will change, the same way forex is different today than 10 years ago. Of course, your strategy could work great, even though it was based on the old market conditions, but this is not always the case. Very successful traders could “lose their mojo”, and this happens even to veterans in the industry.

If your strategy is indicator-based, lookout for new versions or adaptation of the same. If you use some moving average, try out a step version of the same. Did you know inverse Bollinger bands indicator can also be a great type of moving average? Improving the strategy requires keeping an open mind about ideas, similar or completely different. Each strategy has something unique, when browsing strategies pay attention to the trading plan, there might be a rule that could benefit your strategy if applied.

Find Good Resources

Exploring the world of forex is very interesting, you never know if some forum from the depth of the search list might be what you are looking for. Interestingly it is mostly the community portals where people share their ideas and creations that are the best sources. If you thought a good source is some popular tv station, you are wrong. Even the websites on the first search result page are more of the same. It is like they are cloned. Know you need to dig deeper unless you like conventional ideas that do not get you anywhere. Presenters on tv are bad traders, they just sound smart with the lines and tools understandable to the masses. We all know better, even beginners who went through babypips’ school know the analysis is much deeper, from a technical standpoint. 

Their fundamental analysis also is not what you need. Rarely ever some information from the TV is useful for trading. If you want to really have insights into what is going on with the markets, pay attention to dedicated research channels. They are present on social media like YouTube and Twitter. For example, The Rich Dad Channel is hosted by well-known investor and bestseller author Robert Kiyosaki. The channel is full of fundamental insights about the markets and politics inevitably connected to the USD, EUR, and other currencies. What is great about the channel is that Robert hosts pros who are specialized in certain markets, who in turn have their own channels. You get the idea this is great for exploring other channels of your interest knowing you won’t stumble on shallow analysis TV stations. 

Connect with Other Traders

Introverts rarely do this however, when you are really stuck and do not get the results you want, consult with other traders. Forums are a good way to go with this but do not expect someone to hold your hand. More often than not someone has already asked the same question. Still, if you have some new problem worth sharing, you will be amazed at how many smart trades are there who could help. Sometimes it is just words that you might need, not pointers or indicators. If you ever become interested to become a pro trader, try to apply with a prop firm that organizes trader community events. This is a rare value that is very helpful for your strategies and your mindset. 

Categories
Forex Basic Strategies

WARNING: You’re Losing Money by Not Using this Forex Strategy

What if there is a solution to keep your account afloat no matter the strategy you are using? Would you follow it to the letter? Well, such strategies already exist, the issue is beginner traders cannot resist not to stray away from it. Ridiculous as it sounds, most traders lose because they start gambling instead of trading, even though they have something that already works. Apply this strategy and it would be very hard to blow an account. 

Money Management (“Oh no, that again”)…

You will find many strategies online, ready to be implemented. However, rarely you will find information about how big your trade or position should be. It is a risk management strategy. Yeah, the thing “no one” wants to listen, it is not as cool as some pimped indicator you can plug in. It is the same rule you need to follow when on a diet. You can eat this and this much every day. The desire to eat forbidden food may get the best of you, but if you persist, positive results are unavoidable. 

The brain just wants excitement…

Except in trading, you feel the gambling desire. The idea you can double your account tomorrow is very exciting and lucrative. The truth is it may happen, it can happen more than once. The feeling gets you moving. Unfortunately, everything will end badly. Excitement will be replaced with rage or depression. This game has no good ending unless you cash out and never return after a successful account doubling. But again, you will have to stop thinking about doing it once more, the idea of getting rich quickly. 

Fundamental, technical, it does not matter…

Fundamental analysis, all the news, and events that you think might get the price of some asset going are answering the question of when and in which direction. Technical analysis does this but more strictly. Money Management answers the how much question. No analysis will help you if the Money Management plan does not exist. Spend so much time developing a good entry and exit strategy, all is for nothing without this boring MM plan. Luckily, once you set it up, it is done, just follow it. Oh, yeah, you have to follow it to the letter. 

Your strategy should work…

Finding new ways to trade is great. However, now you know that a strategy needs optimal capital allocation for each trade. If you do not spend much time finding indicators and like to draw support and resistance, Fibonacci, and so on, that strategy is good too. The good news is money management makes any strategy work, essentially it is this thoughtful position sizing that drives your account value up and down. The even better news is that once rounded up, money management does not require you to work on it, just repeat the same for every trade you do. 

Easy MM with Ratios…

Ratios are easy to set up. Once you understand the Stop Loss and Take Profit idea, try to go with the generally accepted approach of having at least a 2 to 1 ratio. This just means your TP is two times away from the trade entry price than the SL. Where to place TP and SL is something we have discussed a lot before, but initially, you can take any channel-type indicator that measures volatility. Place TP at the top or bottom of it, depending on which direction you are trading. SL point is easy to place now, just halve the TP distance for a 2 to 1 ratio. 

Easy MM with Price Action pivots…

Simply said, pivots are price tops and bottoms you see on the chart. These extremes are used to place support and resistance lines, especially if they are repeatedly appearing at the same price levels. These lines are easy picks for your SL positioning, and if you follow the ratio rule TP is also defined. You can experiment with your ratios, extending them to 3:1 or higher. Now when you know how to protect and capture profits at the basic level, the only thing that remains is how much money to put into every trade.

How much to put into a trade…

Technical traders like indicators and indicators are really good at precisely telling you how much to invest. Volatility indicators usually produce a number to tell how something is volatile. You can try and open fixed-size trades. For example, if you have a $10000 account always open $500 positions. That can be 5% per trade. However, when an asset is really moving, more than others and more at that particular time, that 5% can suddenly become a serious loss, even with a proper SL. Of course, we can simplify things. Currencies or assets that are more volatile, such as the GBP, are not going to follow the same 5% trade saying rule. Simply have it to 2.5%. If you see chart candles that are higher than usual, do the same. Now if we really want to get nerdy and precise as technical traders, we can use volatility indicators to calculate precisely how much to invest. One such indicator is now a standard issue on many trading platforms, the ATR indicator.

Strategy example with Keltner Channel…

The picture below contains two indicators, the mentioned Keltner channel and a simple volatility indicator using the TradingView platform. The strategy uses the Keltner channel to set the SL level, at the bottom for long trades and the top for short. Since the channel can be used for breakouts and reversal trading, and it also shrinks if the volatility is getting lower, we have a universal tool for placing SL and TP. Mix in the ratio rule and the position sizing rule and your Money Management is all set. The green vertical line is our long entry moment. We enter a trade when the price breaks out of the channel AND the volatility indicator is rising, but also we consider if the price has broken previous resistance marked with a red horizontal line. The middle channel line is our SL and TP is twice as far from the market with the green arrow.

As you can see, our TP was hit almost at the top of this small trend. Now, the price action went into consolidation, new support and resistance levels are formed until we notice a new breakout of the Keltner channel. It was a short trade that pierced the support line but failed to make the way to the TP level, we were stopped at the SL. Even though we have 1 win and 1 loss, we are still in the money since the TP to SL ratio was 2 to 1. If we fail again, only then we are at breakeven. Testing your strategy, you will aim to be better than 50%, right? Because 50-50 is just coin-flipping. Even then you will be profitable just because you have a money management plan in place. Now you can do the fun stuff. Find a winning strategy of your own.

Sources of knowledge…

On your way to finding a winning strategy suitable to your lifestyle and psychology is fun, it is like finding parts of a money-making machine. On this very website is a whole library of strategies, concepts, and indicators. Of course, consider tweeter and youtube but also dedicated forums where people share ideas. You will notice that something could blend into your strategy. The best part is you do not have to worry about losing. Even if you are very bad, Money Management will give you many more chances to slowly get it right. It is one universal thing that can be used in many other markets.

Categories
Crypto Forex Basic Strategies

Do Forex/Stock Day Trading Strategies Apply to Cryptocurrencies?

The short answer to this question is yes, absolutely, however, you will need to adapt for it to be so. Let’s dive into how.

① Common Ground

Did I make money whenever I had the chance?

This is your number one question that you would ask no matter the market. When you derive some strategies from the stock/forex market, you do want to see tangible results. 

Crypto is unique but there are also some universalities. 

You need a plan because we cannot just flip a coin and decide what to do next. We need a clear idea of how we are going to approach and exit the market so that we can correct any mistakes.

→ Solution: When you come up with a plan, you must stick to it. Also, check your totals and see if your overall percentage of trades puts you in the winning or losing group.

② Community

Forex and stock community spirit tends to be quite strong. The same is true for the crypto people. Especially since it is a relatively new market, many individuals want to take the opportunity and give their projections of the future. Unfortunately, as most of these forecasts are incorrect, the only thing traders get is a false sense of support. What is more, these posts and announcements often create a major hype, causing many crypto traders to forsake common sense and their judgment even when things start to turn sour.

→ Solution: Let go of groupthink and start practicing independence and individuality. 

③ Testing

You do not want to follow any advice too piously, especially if it proves not to work for you. 

How will you know what works? You will test every strategy and idea you find interesting.

Most successful traders had to hit rock bottom to realize what they can do better. Still, you can avoid this scenario if you take time to record your trades and ponder on the ways to make your returns higher.

→ Solution: Like in the forex/stock market, you need tests to be able to improve and learn from your mistakes. 

④ Money & Risk Management

Money management is key for long-term success. Without it, we are all just playing the lottery. 

Crypto is amazing because, once you limit your downside, the upside can be infinite.

→ Solution: Set your risk at 5% maximum of your entire portfolio.

⑤ Algorithm 

Traders claim to have successfully used the same algorithm they applied in forex trading for trading crypto. Still, you can trade cryptocurrencies without an algorithm. What you cannot do, however, is avoid money management.

Crypto is known to move 25% to the positive and then 25% to the negative in only one week (late and early 2020 rallies for example). As the moves can be quite extreme, you need the protection that money management brings.

→ Solution: While you need to be active to catch the big moves, do not forget that you will lose everything without proper money management. Algorithms are optional.

⑥ Scaling out

If you want to earn smart money, you will apply the scaling out strategy. You never want to go all in.

→ Solution: Take a portion of your money off and close positions. Overleveraging can lead to terrible losses in a market that moves as much as this one.

⑦ Holding & Holding

You want to play both offense and defense. Choose your long-term and short-term investment plans to fully use what the crypto market has to offer. Remember that the possibilities are infinite with proper money and risk management. 

We noticed how some stocks that generally do not do so well can go up substantially when the S&P 500 does. Similarly, altcoins are known to go up when bitcoin does, and this usually happens at a much higher rate. That is why it’s wise to allocate a small portion of your money (less than 1/5) and invest in these other coins.

→ Solution: Set 30% of your finances for short-term (more aggressive) investments and use the remaining 70% for your long-term strategy.

⑧ Spread out

Like in other markets, you will benefit from branching out. What this means is that you do not need to trade only one cryptocurrency. Rather spread out to ensure a higher return.

For example, you can have the majority of investment in stablecoins as a protection in case everything else falls apart. Your second layer of protection could be bitcoin or XRP or, preferably, both. Then, 5-20% could go into different altcoins. As there are different ideas on which are the best, you can just take your favorites and invest a little of your money there as well. Your final layer should be your longshots or the coins you use for your long-term strategy.

You can always use interesting investing research portals such as stransberryinvestor.com. There is solid research done on crypto and stocks and a very good benchmarking tool that grades crypto assets. These are based on core evaluations on each coin, useful to gauge the market in-depth, underneath the charts. The picture below is a snapshot of the benchmark table. These are free resources but you will have to register your account. Note that you should understand the project behind the coin. 

→ Solution: Trade different coins to ensure maximum growth, profitability, and protection. 

⑨ Entry

There is no one ideal piece of advice on where you should enter the market. As with forex and stocks, we can rely on different tools to find entry signals. For trading cryptocurrencies, you can always use “Trailing Buy” and even accommodate it depending on how the price moves.

In the image above, the price went low and there is a chance of it going even lower, so we want to move the red line further down.

If the price moves up, we are not going to make any changes in terms of the position of the red line. 

→ Solution: To get the signal to enter the trade, move the trailing line down only if the price goes lower than it is right now (i.e. if it breaks down upon the candle close). When the price finally hits the trailing stop, that is your sign to buy. 

⑩ Exit

You need to have a defined exit strategy for any outcome- whether a trade has gone well or bad. 

Like in any other market, you need to align your exit point with your overall strategy and be consistent with what you do. We cannot make any changes in the middle of a trade.

Your exit strategy may vary depending on the type of trade. As cryptocurrencies are great for holding, your exit will then largely depend on your idea of how long that trade should last.

→ Solution: Always have a projection of how far you want to go and where you want to take your money off. Be disciplined to ensure you know that your approach is working out for you. 

⑪ Psychology

Since many are affected by the craze over cryptocurrencies, you may experience the fear of mission our (FOMO). The rules regarding trading psychology are all the same, regardless of whether you are trading stocks or currencies. This means that any strategy you want to use cannot be perfected until you have control of what you are doing.

→ Solution: Complete a personality test and see how your traits might interfere with your plans for growth in this market. 

⑫ Similarities and Differences

Fiat may as well one day be completely replaced by crypto. Still, until that time comes, we must know that crypto largely depends on supply and demand – like stocks and unlike forex. 

That is why any strategy we wish to take from these two markets requires testing to see if it is going to help or hinder trading cryptocurrencies. 

→ Solution: Although forex/stock strategies can generally work with crypto, we need to be careful with our choices.

Categories
Forex Basic Strategies

Two Ways To Trade The ‘Descending Top’ Chart Pattern Like A Pro

Introduction

The Descending Top is a technical chart pattern that frequently appears on the Forex price charts. Each peak of the price in this pattern is lower than its previous peak. The descending top chart pattern’s appearance indicates a downtrend in the market, and we must only look for sell trades at that point.

This pattern can be recognized when the first peak is lower than the second peak and the second peak is lower than the third peak. For instance, if the first peak is at 88.00, and the price drops down to 83.00, then the second peak at 85.00, and drop to 80.00, and if the next peak is below 85.00, we can see the descending top pattern forming on the chart, and we should then looks out for selling trade in an underlying asset.

If the next peak is higher than the previous peak, instead of being lower, the pattern gets invalidated, and the market goes up, or it will consolidate. We will often witness the descending top pattern on lower timeframes, and we should not be expecting this pattern to form on the higher timeframes. The reason is that in a higher timeframe, the pullback is very less, and even the trend soon comes to an end.

To identify the pattern, we must spot two tops on the price chart, which are descending, and then we must draw a line to connect these tops.

Descending Tops – Trading Strategies

Now that we know what a descending top pattern is, we will see how to combine it with other technical tools to trade this pattern.

Channel Trading

The first step is to identify the descending top pattern on the price chart. After that, identify the bottom between the two tops and draw a horizontal support line. Then wait for the break below the support line to enter a trade. Place the stop loss below the second top of the pattern and ride the trade. As we know, we cannot stay in a trade forever. We have to close our trade at some point. To close the trade, wait for the price to break the channel.

Example 1

As you can see in the image below, we have identified the descending top pattern in the EUR/USD 5 minute chart.

As you can see, when price action printed the pattern, we started preparing to take sell trades, and when the price broke below the most recent support area, it was a sure sign for us to go short. As we took the sell trade, the price immediately came back to retest the support area. Here, we choose to scale our trade at the support line and go for the brand new lower low.

Initially, our trade goes to a 1.1255 area, and we were looking for more profit in the trade. The trade failed to print the lower low furthermore, and it broke above the channel at around 1.274. Here, we choose to close our trade as that was a sign of the trend getting reversed. The Forex market is all about probabilities. We cannot expect the price to do what we want it to do. Instead, follow the rules of the game. When the market gives less profit, accept it, and don’t try to break the rules.

Descending Top Breakout Trading Strategy

As we know, the descending top is a pattern that gives the selling trades. But in this strategy, we will show you how to use it to take the buy trades. To enter a buying trade, we should wait for the price action to break above the descending top trend line. Your stop-loss order must be placed below the last bottom of the chart. Stay in the trade as long as price action prints the brand new higher high and exit your whole position when the prices break below the upper trend line.

The image below represents the descending top pattern on the price chart, and also it represents our entry, exit, and stop-loss in this pair. As you can see, when the price action prints the descending top pattern, it immediately goes down, and it prints the lower low.

In this one, we were looking for the breakout above the descending top chart pattern, and when the breakout happened, we were all set to take the buy trade. After our buy entry, price action prints a brand new higher high aggressively. When it gave the reversal signal, we choose to close our whole position, and the stops below the entry should be good enough.

Strategy Roundup

The descending top is a chart pattern that gave us potential selling trades. Trading this pattern is quite reliable, and when it gives the trading opportunity, we must trust it and go big. To identify this pattern, we must spot a price top, followed by a lower top. Take an entry below the most recent higher low and go for the brand new lower low and place the stop loss just above the entry. If you desire a safe trade, choose to place the stop loss above the first top.

We hope you find this educational article informative.  Let us know if you have any questions in the comments below. Cheers!

Categories
Forex Basic Strategies

Social Trading: What are the Advantages and Disadvantages?

Social trade is a fairly new concept in Forex retail and its popularity has been growing considerably in recent years. Let’s see the pros and cons of this trading modality that is very similar to social networks.

The concept that drives social trading, especially in Forex, is that the process offers online traders the opportunity to obtain information about operations and strategies of other traders and thus use the knowledge and experience of other professionals in combination with their own experience.

Social trading works very much like the most popular social networks, such as Facebook and Twitter, where individuals communicate directly with each other continuously from wherever they are. And, as with other social networks, there are advantages and disadvantages in their use.

Advantages of Social Trading

One of the reasons for the success of social commerce is that it is easy. By monitoring the activity of other traders, novice or intermediate-level operators can base their movements on the professional decisions of more experienced traders; there is no need to conduct its own fundamental or technical analysis. It’s like when you have the answers to a test before the date and even taking a look at the test questions!

With social trading, Forex traders can have an immediate association with many other traders in an environment where it is possible to interact with each other, discuss points of view and then copy the most successful trades. At the same time, the beginner and the more experienced traders can learn how elite operators get to the decisions they make, what strategies they use, and which ones work better than others in their efforts to make profits, while at the same time limiting the risks to your entire portfolio.

Another important advantage of Social Forex Trading is that, when trading as a member of a community rather than as an individual, it is often easier to avoid personal biases that often result in loss of positions. As part of the package, it becomes much easier to observe the change in market activity from a more impartial perspective. For example, a transaction that starts showing losses can trigger emotional reactions in a trader that can often lead to wrong decisions. When operators work together as a unit, it is easier to discuss and analyze market activity as it develops and make more wise decisions.

Finally, the opening to the public of transactions through social trading has made Forex trading no longer an instrument that is normally restricted to the best brokers and multinational banks. And, since all transactions placed on a social trading platform are copied directly, no one can intervene in such transactions, generating more transparency.

Disadvantages of Social Trading

Social trading provides an exchange of information for individual and retail investors. And although this seems an advantage, it can also become a disadvantage. This is because there is only a small number of successful traders in this market, by using social trading networks an operator can follow the wrong trader and end up losing instead of increasing their profits.

Copy Trading represents a greater threat, as even novice traders, without the prior knowledge of Forex, are allowed to replicate the commercial behavior of successful traders. Therefore, they basically become helpless in case the “leader” fails.

The execution of trades, based on collective wisdom, remains an impressive proposition – in the beginning. However, some initial successes might even deny the danger that you will become totally dependent on others. You may be able to generate huge benefits by integrating other ideas into your own game plan. However, there is no guarantee that these strategies will work infallibly in the long term.

Choosing the Right Platform

One of the main disadvantages of social trading is that it is still relatively difficult for an operator to select the right social platform. Etoro, Zulutrade, and Signaltrader, (to name a few) are the main Social trading platforms of Forex. There is no shortage of social platforms and this makes it difficult to choose. And, even though social trading operations are not a scam, there are scam platforms that do not comply with the rules and there are some social trading scammers willing to cheat and an unsuspecting trader can be easily surprised. Some of them even end up claiming that they offer the best signals for you. Therefore, it is very important for you to choose your platform carefully. Choosing the right trading platform is key, but it is complicated, and you need to be informed and alert enough to tell the good from the bad.

Copy Trading represents a greater threat, as even novice traders, without the prior knowledge of Forex, are allowed to replicate the commercial behavior of successful traders. Therefore, they basically become helpless in case the “leader” fails.

We can’t just fall into the hands of dishonest racers. Traders should also be careful when choosing the individuals they want to follow, as there are people with little confidence. Defining several indispensable criteria before opening a trading account helps traders select the best operators to follow from a list that may include hundreds of them.

There are several social trading networks that offer different features, many of which are not fully understood by a novice Forex trader. Some networks reward their operators not only for the benefits they get but also for their low-risk management approach. This makes traders in these types of companies more aware of the risk than operators in other networks that reward only for profit and may encourage risk-taking in the process. This approach might not be a good start for novice operators.

In addition, traders who have just started trading may not fully understand the ramifications of various social trading networks. To take an example, there are social trade networks that place a limit on the amount that a trader can assign to 20 or 30%, which is certainly an advantage as this forces the trader to spread his risk. On the other hand, an operator can be allowed to run a risk of up to 100% in a single operation, and can technically lose everything in a single move.

Future of the Market

Last but not least, the presence of too many traders without prior knowledge is not advisable for the market itself. As in that case, (the market) runs the serious risk of running out of “leaders” in the long run. Only a continuous recycling of ideas will help to prevent a “substantive” future.

In Conclusion

There are advantages and disadvantages in all types of investment and this also applies to social trading. The key to success in any enterprise is knowledge; the more the trader knows about how a particular financial instrument works, the lower the risk you run and your chances of winning will increase substantially.

Categories
Forex Basic Strategies

What is the Best Trading Position? Part IV – How Much Can Traders Win?

We showed how to manage your risk in the last three articles of this series. Today, we are embarking on another journey, teaching you how to manage your money like a professional, wealthy trader. The problem with most traders is that everyone is anxious about how much money they can lose, never thinking about whether there is a win limit too. That is where we are heading in this article – learning about our maximums.

Is the More Always the Merrier?

First of all, where does your money come from? Is it from the pure quantity of items you own or what you get to do with them? You may have an abundance of assets with a remarkable track record of winning trades, but what are they worth if they sit there collecting the dust? Think what the wealthiest people do – they always find a way to liquidate their assets because, otherwise, there is no point in any of the efforts made.

When is Enough Actually Enough?

We have all seen quite a few examples of people who seem to lack boundaries. We witness this behavior in casinos when the initial investment gets multiplied several times, but the lucky individual eventually returns home with empty pockets. We get to see such an unbalanced approach in the world of trading as well, having traders stay in trades too long without taking necessary precautions. It usually happens with those impressive trades where you get to buy something for a price that rises well above what anyone could ever expect. The idea of earning in one trade what you get to earn in an entire year is very exciting, isn’t it? Still, it is also very unfortunate to know the statistics of people who fail to ride these winning trades with a sense of precaution too.

How should I manage my wins?

First and foremost, learn how to scale out – take a portion of your trade off the table, put it into your trading account, and keep the rest running accordingly. You can use the ATR indicator to know exactly when you should take the initial profit. For example, if you are a forex trader and the ATR of the currency pair you are trading is 90, you will need 90 pips before you get to take any additional action. 

We will even go one step further and give you the exact formula you can use in trading to manage your trades:

Calculate your risk based on parts 2 &3 of this series.

Divide your risk (number of pips you are risking) into two halves (for MT4 TP partial closing limitation purposes).

Make two half trades with that new number.

Place the stop loss properly on both trades.

Set the ATR where you want to take the initial profit on one of the two trades.

After it closes automatically, move your stop loss to the break-even point (where you entered the trade).

Keep the second trade position running, trends may prolong for days.

How Does Scaling Work in Real Trading?

In the NZD/CHF daily chart below, you can see that the ATR equals 60. This information tells us that the stop loss is going to be 90 (please, read the second article of this series if you do not understand why) and that our take-profit point is going to be 90. After finalizing all risk-related calculations, we also know that the value per pip equals 11.11 for our 50,000 USD account. To scale out, we are going to need to cut this value in half, so we get 5.55. Now we should insert all of the necessary information. The only thing we mustn’t do is check up on the trades all the time because we do want to avoid emotional reactions, urges to make changes, or exit the trades prematurely. 

The moment the price hits your take-profit level, we are going to move our stop loss (90) to the break-even point, knowing that the first half of the trade is a winner you can no longer lose. At this point, you can make use of some other tools, such as Heiken Ashi, exit indicators, and trailing stops, among others, to assist with your trade. These tools can be of great help with your second trade for as long as it runs, especially since knowing when to exit is one of the crucial elements of professional trading. 

What is the Best Return I Can Get?

In the stock market, for example, a 10—11% return per year is considered to be a really good result because it mirrors the stock market average. If you can increase this percentage in time, you will become one of the few elite traders who are able to achieve such returns. If you are considering a specific benchmark to hit, this may as well be a great reference because these trading skills are always in high demand. Warren Buffett for example, one of the most prominent figures on the investment scene in America, makes a 20% return per year while some of the most affluent figures in the forex market willingly give exorbitant amounts of money to their advisors just to get a 13% yearly return.

As usual, we are leaving you with a task that you should complete based on the past few lessons you learned here:

How would you apply the scaling out strategy based on the EUR/USD monthly chart provided below?

What we really want you to know is that this approach helps you know that you are safe and that a portion of your investment is safe too. Many traders never scale out and years may go by before they face the consequences of their actions. You do not have to be the winner only; be a smart winner too. It really doesn’t matter what you trade (gold, corn, stocks, or forex, among others) because all smart traders share this one key skill that is so easy to apply. Accompanied by other trading skills, scaling in and out is the one way you can avoid the casino scenario and ensure the best trading position. Lastly, even if you encounter an unfavorable period or take a loss at some point in your trade, be patient and refrain from reacting impulsively because your stable and consistent approach to trading will even out any transient imbalance in the end. 

Part V to be posted tomorrow. Stay tuned!

Categories
Forex Basic Strategies

Profitable Forex Strategies That Nobody Tells You About

There are a lot of factors that can make or break your chances of success in the forex market, from the amount of money you risk to your general knowledge of what moves the markets, and everything in between. One of the most crucial keys to success is to trade with a solid trading strategy that has been tested and proven to actually bring in profits over a period of time. 

Forex traders typically base their strategies on two different types of data. Fundamental strategies consider economic data and data that is affected by businesses, while technical analysts use indicators and study historical price data. Trading strategies consider data based on their chosen method and then provide traders with techniques that tell them when to enter or exit the market in order to make a profit. Your trading strategy will guide you and ensure that your trading decisions are structured and based on as much fact as possible to increase your chances of making money. 

If you search for trading strategies online, you’ll find a long list of options. The choices can honestly be overwhelming for beginners, as there are so many different factors to consider when choosing a strategy. There is no one-size-fits-all method, as every forex trader has different needs and thinks from a different perspective. So which strategy should you choose? Below, we will break down three of the best trading strategies out there so that you can decide for yourself based on your own personal preferences. Keep in mind that many veteran traders might not tell you about these choices, as many professionals prefer to keep beginners out of the loop when it comes to top-rated trading secrets for success. After all, it is a competitive industry.

Not Sure Which Trading Platform to Use? Try MetaTrader 5

MetaTrader 5, or MT5, is one of the most popular trading platforms out there, right alongside its predecessor MT4.  MetaQuotes developed this platform to offer more financial instruments, trading tools, and resources. Here are a few of the highlights that influence our love for this timeless trading platform:

  • Provides access to a wide variety of forex, stocks, CFDs, and futures
  • Offers a navigable interface with 21 timeframes and 6 pending order types
  • Supports robotic and algorithmic trading
  • Allows hedging and netting
  • Supports 36 technical indicators, 44 analytical objects, and an unlimited number of charts
  • Built-in economic calendar for quick access to important news data
  • Can be accessed through a web browser, desktop version, or on mobile devices and tablets

When compared to other options out there, MT5 truly offers more services and resources to traders, making it a great tool for success if it is incorporated into your trading routine. If you do plan to use it, you can find many video tutorials on YouTube that will teach you how to use the platform efficiently. The best way to use the MT5 platform is to open an account through a broker that offers it so that you can trade on MT5 for free, as licensing fees can be expensive. 

Using Trading Signals

A trading signal is a suggestion to enter a trade that is typically delivered to the trader through a phone or email alert. The suggestions come from expert traders that have personally analyzed the market based on their own ideal sets of data so that you don’t have to. This concept is especially helpful for beginners that may not completely understand the market or for traders that just don’t have the time to sit around analyzing charts and data all day long. Many traders consider signals to be a shortcut to success that takes away from the overall time spent trading, as long as a profitable signal provider has been chosen. 

Experts that create trading signals do so to help other traders, but there is usually a cost of these services. Keep in mind that some signals are free, while most cost money, but you shouldn’t blindly trust every signal provider that’s out there because scammers are involved in the market. Before choosing a provider, you should read online reviews about their services and take a look at their overall reputation, especially if it is a paid provider. 

One-on-One Training Sessions

Some traders overlook the benefits of personal one-on-one training sessions with professionals for a few different reasons. One of the most common reasons is that these sessions usually cost money, although some brokers will offer you free sessions if you make a large enough deposit with them. It’s true that there are many free resources available online, but you should stop to consider some of the benefits of one-on-one training:

  • You’ll be mentored by a veteran trader that knows the market inside and out.
  • You can ask personal questions and receive professional-grade advice.
  • Your coach will teach you basics, market fundamentals, and everything you need to know.
  • Your mentor can suggest profitable trading strategies you might not have heard about once they learn about your personal trading style.
  • You’ll learn to use technical indicators and how to effectively analyze the market for trends and directions.
  • This is one of the best ways to get hands-on practice in a live market environment.
  • You’ll receive tips that can help you to achieve profits on the same level as expert forex traders.

The Bottom Line

If you want to get the same results as a professional trader, you’ll need to trade like one. The three professional-grade strategies we’ve outlined above can help you get off to the right start in the financial markets, as long as you take the time to practice them effectively.

Categories
Beginners Forex Education Forex Basic Strategies

Always Test Your Forex Trading Strategies! Here’s Why…

Coming up with a new trading plan can be exciting. It can make you want to jump straight into the markets and use it to make you some lovely money, but should you be jumping in now? Have you actually tested the strategy out and can you be sure that it actually works? The only way you will find out the answers to those questions are if you thoroughly test it out.

Testing the strategies that you come up with can actually be seen as far more important than actually coming up with it. This is mainly due to the fact that anyone, even someone with no knowledge of trading could actually come up with a strategy. This doesn’t mean that it will be a  good one or one that will actually work, but they will be able to come up with one. This is where the testing comes in, this is where you can differentiate between the good strategies and the bad ones, but it also offers far more opportunities than that.

So why do we test? We test for the simple reason of wanting to make sure it works. We do not want to get into a live trading situation nowhere we put a strategy into practice just to find that it falls apart or doesn’t actually function as a strategy. The strategy needs to have entry criteria, and exit criteria, and some risk management built into it, if any of those parts fail, so will the entire strategy.

We can test them in a number of ways, the best and most prevalent way of doing it is via a demo account, this account will mimic the trading conditions as closely as they can to live ones. This allows you to try out your strategy on something that could almost be considered a live trading scenario. If your strategy is successful here, then there is a good chance that it could be on the live markets too. It should be noted, that being successful for one or two trades is not enough, it needs to be consistently tested for at least a few months to know the full extent of how good the strategy is.

Let’s say you are testing a strategy and everything is going perfectly, this does not mean it will on a live account. While the conditions are similar, there are some distinct differences such as commissions and slippage, these do not exist on a demo account. So if you are taking small profits to be sure to take this into consideration. 

There are also backtesting facilities available these take your strategy and will apply them to the last years of trading to see how it would have performed in the conditions that had occurred in the past. This can give you a small indication of how successful it could be in the future. This is not a 100% accurate testing method but can be used as a viability indicator.

So you found an issue, that is the whole point of testing. This gives you the opportunity to resolve that issue and then test again. This cycle should continue until you are 100% happy with the strategy, only at that time should you troy and deploy it onto the live markets.

Even with a strategy that works perfectly on a demo account, you need to stay disciplined, expect some losses, and always analyse and adapt the strategy as it needs. No strategy is full proof, they always need adapting and changing so be sure to stay on top of it and continue testing as the years go by.

Categories
Forex Basic Strategies

Are You Switching Up Your Forex Trading Strategies?

Having multiple strategies can be a result of one failing in a certain market environment. Traders then try to fill up holes the original strategy had with another strategy adapted to new market conditions. According to some experts, having additional strategies is always beneficial, having more weapons in your arsenal is good.

Another common argument is that markets always change in many ways, one strategy will sooner or later start to fail. The global economy itself is cyclic, not to count all the other things mixed in. However, what if we instead of changing strategies just move into the market where the conditions are right, suitable for the original strategy? Basically, it is the same thing – adapting to changes. This concept then sets another question, how to recognize the market is not suitable for our strategy, when is the moment we need to switch strategies, to find other markets, currency pair, or assets?

There is no simple answer to this question since every strategy is different to some extent, and there are more strategies than traders. Developing a strategy that works only in specific conditions is a specialized strategy, their drawback is not only a tight schedule but also a limitation to a few of the markets available for trading. If you are familiar with automated trading scripts, you will see they are mostly designed for one or a few other currency pairs. This is because they are tested back and forth only on a limited historical/future period and only adapted to that currency pair specifics. At the moment of their public release, these strategies or scripts will run well probably. If they are not updated their performance will drop. 

We see a lot of content on the internet about having more strategies, adapting, experimenting with indicators, rules, and settings. Building your system should never stop. However, most of the traders fail not because they are not good at the technical or fundamental analysis, but money management and psychology. It is common to see traders overoptimize their systems to new conditions. Then change them again once they do not work as intended. If they are very thorough with their testing, as they should be, the operational time of their strategies is low compared to the optimization time. After all, some traders may question is it worth it to maintain and develop multiple strategies for new conditions perpetually?

Notice we have added trader’s mindset and money management into the mix that makes a strategy. According to some popular trading education resources, it is advised to be flexible. Being flexible also means not only using tools and indicators to decide but also your experience, your skill analyzing the price action. Additionally, absorb a hit or two trading with an inadequate strategy with sound money management. In other words, you have to trade and know how to trade in so many ways. Well, in our book this is just going to mess everything up. No trader is universal, traders will shape their trading ways as they see fit, and could be successful in many ways.

Technical traders will like indicator systems and have crisp money management based on them. They will have the edge as they do not have to deal with doubt, hesitation, overtrading, and other common mistakes. Price action traders with a minimalistic approach recognize historical patterns from experience and base their decisions on that. Fundamental traders take a long-term approach and people adept with coding could even indulge in making trading robots. Switching strategies and how a trader approaches trading is contradictory to their personalities and their trading cannon. 

Optionally, traders could develop a universal system. This strategy may work only in specific conditions, limiting their performance, however, there is no limitation to other markets. For example, trend following strategies would need trends, volume, but they fail in ranging conditions. Now traders know what to avoid. If a ranging market or consolidation is imminent, stop all trades and find other currency pairs or assets. Specialized strategies cannot switch to other pairs without additional tweaks. Whatsmore, their effectiveness may be short-lived if the intended pair starts different price action. Traders will now have to consider whether developing such strategies is better for them than universal strategies. 

Trying new things always carries more knowledge traders use to combine amazing indicators, strategies, and trading styles. Consider if your failures lie in your strategies or if your money management and psychology are out of place. According to many professionals, traders struggle with the latter. Be sure that if you have many strategies it is not a product of bad money management or many trading psychological issues one could have. There is no better strategy you can make without the two most important pillars. 

Some proprietary company traders even go far enough to say good money management and a random decision strategy beats the best strategies without good risk or money management. Considering this, maybe a better headline question would be “Are you changing your mind often while trading your strategies?”

There are certain times you may be put under pressure to trade, for whatever reasons, hopefully not out of desperation. It is quite normal to switch timeframes and rules. For example, trend following strategies does not have great odds when the whole forex is not active. Professional traders create a rule for these periods, money management rules. They lower their positions and if forex is almost dead, they do not trade at all. Now, switching to other strategies that work in quiet environments are likely to be reversal strategies. Sometimes they might not be adaptable to a trader’s lifestyle, especially if they require more screening time. Curious and “out of the box” thinkers could go into other possibilities and find a good automated trading solution that works great in these conditions. Forex has a place for everyone and everything, but only rewards those persistent to find the solution. 

A trader who has universal strategies that work with little adaptation to different markets like forex, precious metals, indexes, and crypto, using the same good risk management principles is a complete trader. Getting to this point is the hard work of testing, frustration, losing, and trying again. Mastering one strategy takes a long time, probably a few years. Sometimes it is normal to give up on that one if you do not have results, provided everything else is good. Those years are not wasted. More often than not, traders that have moved into other trading styles use some elements from previous work, sometimes even coming back to their old strategies that needed just a bit of knowledge and experience from another perspective. It is eureka for most of these traders, however, know such people are rare, and only they come to the top. 

As a final piece of advice, search out for other strategy resources, and experienced people. You will find out each may bring up some ideas or tools that you could use in your current system. Strategies that are not into your style of trading are also useful as they may hide some rules or money management principles you could carry over. Creative traders will enjoy this process of discovery and implementation but never forget that playing with tools is fun, money management and psychology concepts are not, yet all professional traders spent a lot of time developing them. For more info about adaptable universal strategies, risk management, and psychology, check out our previous articles.

Categories
Forex Basic Strategies

Walk Forward: Optimise Your Trading System to Boost Your Earnings

Before you start talking about optimizing a trading system, it’s important to know what these systems are based on or why you should work with them. In this article, we’ll talk about one of the most popular trading tests that exist today. It is the walk-forward test.

What Is the Optimization of a Trading System?

We have all asked ourselves the question of what optimisation is. The optimization of a trading system is based on the study of history of past premises or events. This is done in order to get a number of values to render our system cost-effective. In other words, it is based on carrying out a relevant study about the best results that have occurred in the past, this seeking to obtain a range of possible positive results for the market in which one is working.

Since optimization is based on finding possible numbers or values that approximate or resemble possible current values, it is necessary to take into account that you must have prior market information or valid premises. When you want to perform an optimization of a trading system, it is necessary to take into account the type of objective function you are working with. This is because, for each type of objective function, its values are different.

The objective function with which you are working can be framed in any of the ratios to evaluate systems. All these ratios are based on different ways of working, from here arises the difference between the values that can be given. For example, an objective function may be for the system to have the maximum net gain possible or the minimum possible loss. Depending on this, the parameters of our system can be different.

Ratios for Evaluating Systems

The ratios for evaluating systems are based on the ways you can look for a gain. These give you an assessment of the risk there may be, how profitable it may be, the duration and profitability of profits, among others. To optimize a trading system, you need to be clear about the ratio to maximize or the one you want to prioritize. Thus, when performing the optimization you will look for the results obtained in previous periods and guide you in the possible values to which you can decline.

There are several types of ratios to evaluate the system, I explain three in this article:

Net Profit Ratio

This is one of the most elementary proportions, you can understand it simply as the profitability of the system. This profit is calculated in relation to the initial investment. It’s one of the simplest ways to calculate. However, it is necessary to assess certain circumstances to see whether this system is profitable in the market being operated. In some cases, this system only works within a limited time. Later, you start to generate higher losses, which compared to profits can be disposable.

You should also evaluate the number of trades you can make a profit on, as there may also be a limited number of trades in which you will receive a profit (minimum 150 trades in my case but it varies depending on the type of system). After this, you can only generate losses from your capital.

Ratio through the Drawdown

Many people use Drawdown to opt-out of a trading system. Drawdown is based on the number of consecutive losses in your trading strategy. That is, it is evaluated from the highest point that could be obtained previously, to the lowest point obtained before generating another high point. It is important to note that optimization, in these cases, should have a good margin of error and not fall into over-optimization.

R Squared

The use of R2 or the coefficient of determination for statistical models whose main objective is the prediction of future results based on other related information. The R2 value is a number between 0 and 1 and describes how well a regression line fits a data set. When the value of R2 is close to 1, this indicates that the regression line fits the data very well, while a value of R2 close to 0 is an indication that the regression line is not adjustable in any way to the data. The higher the value of R2, the better the capital curve of the trading system. A very high R2 value should result in a profitable trading system with little drawdown.

The Backtest

This word is very important when performing the optimization of a trading system, since its result will depend on the study of optimization trading. Simply put, doing a backtest is performing and evaluating a history of operations. With this, you get a percentage of hits, the amount of drawdown or net profit, among others. These data are used as results to enter future parameters, seeking to obtain a benefit. The backtest needs to be done with certain variants. The more variants that emerge, the more backtest you’ll have to do until you hit a closed result, but be very careful with over-optimisation.

What is Over-Optimisation?

In the optimization of a trading system, we look for the possible values that can be generated in the future. This is done by evaluating an earlier historical and a number of previous variants. The over optimization is to play with the marked cards. It is to set the parameters for the best past results. When many backtests are performed, the result gets closer to a point of non-existent perfection. That is, a point where there are no faults or margins of error. When this happens, it is because of a saturation of the variants.

This saturation is called over-optimization. It is one of the factors to which one must be very careful when optimizing a trading system. Because when you over-optimize a system, the perfect result, it’s just a big value error. To prevent you from entering an over-optimized, it is advisable to do an optimization with few parameters to optimize. By entering many parameters, you can fall into over optimization. In my case, in fact, I try not to optimize anything.

What is Walk Forward Optimization?

This is one of the most robust optimization systems available today. This is because it performs a complete optimization, but a little late and complex. Thanks to its system being a bit complex, if you have a considerable historical, your results can become numerous. In other words, the more historical you have, the more results you can get.

What makes the Walk Forward so good, if it gives numerous results? The Walk Forward is considered to be one of the most robust optimizers as it optimizes through historical intervals. This amount of results can be reduced. However, be careful not to over-optimize. The optimization using the Walk forward system is performed by analyzing short intervals in the history of market operations. That is to say, when you have a history of 10 years, for example, you take the first three years (1, 2, and 3) of history, they are optimized and you get the backtest.

After this, it is taken from the last year of the first optimization, until the subsequent two years, including the first backtest. In other words, in the second optimization the years 3, 4, and 5 would be taken, together with the first backtest. This will be done with all the following years until the last backtest. Which will be the result of continuous optimization throughout the history. This constant and repetitive optimization is what is considered as the Walk Forward and, thanks to its level of complexity, is considered as one of the most robust. However, it usually gives very accurate results, within the margin of error.

For what purpose is optimization with walk forward used in trading systems? The function with which this type of optimization is performed is based on the verification of the system for the future. In the same way, you can implement it to obtain possible values that generate a profit. All this is done with a series of premises. That is, you must do it with a history of operations. By doing so, you can get an idea about the market in the future. In this way, you will be able to observe if it can be productive to apply the trading strategy that you are evaluating. In certain cases, you will check that the profitability of the system or ratio is only temporary.

A Correct Optimization

As you know, you should avoid over-optimization, as this does not generate more than losses. One of the points you should look at when performing an optimization of a trading system is to avoid single or isolated values. Imagine creating a strategy based on an average of 20 periods that works perfectly. But when you look at their results with an average of 19 or 21, it’s a complete disaster. Doesn’t sound very reliable, does it?

I don’t mean that your trading strategy works well with any parameter you use. But what we’re looking for are robust systems, and if any sensitive change causes results to be altered abruptly, what we have is not a robust system. Keep in mind that the market can make drastic and abrupt changes. Therefore, it is recommended that you make several optimizations at considerable intervals of time. This ensures that the values obtained the first time, remain constant. If not, the market may make a change, and you should engage with that change.

How to Use the Walk-Forward Test?

In my case, I don’t use it to optimize my trading systems. I use it as a test to evaluate its robustness since when we apply it we are seeing different periods outside the sample. In this way, we obtain more information on how it can behave in the future and on the consistency of the strategy. In the end, as you can see, it’s about having the possibilities in our favor with winning strategies, and this test is throwing information about our strategies. As I always say, don’t look for perfect strategies, look for real strategies.

My recommendation is that you study the test and if it is useful incorporate it into your methodology. For me, it is one of those tests that is worth it along with that of Monte Carlo.

Categories
Forex Basic Strategies

What Are the Best Forex Strategies of All Time?

It is not every day that you come across a strategy that has been used for many years, or at least not one that can be considered as a successful one. More often than not, a strategy will work for a short amount of time, maybe days, weeks, or months, but at some point in time, that strategy will stop working. Maybe the market conditions have changed, or maybe it was just luck to begin with. Whatever the reason, there is a good chance that without any changes or adaptations, a strategy will begin to struggle.

There are however a number of strategies, that at least a form of them has survived the dangers of time, they have been successfully used over a long period of time, years, in fact, there will need to be some adaptations as things change, but the principle behind them will remain the same. So let’s take a look at what some of these long-lasting strategies are, maybe one of them could be the right thing for you.

Support and Resistance Strategies

Support and resistance trading is one of the most widely used trading styles and strategies due to its simplicity and its ability to work in ranging markets, a condition that a lot of other strategies don’t work in. The strategy is pretty simple, you are looking at the support and resistance levels, they act as a block for the price, the market will be moving higher and lower between these markers, so as soon as it hits the lower support leave you will place a buy trade and as soon as it hits the higher resistance level you will place a sell trade. It is also one of the simplest strategies to chart, you can draw the lines based on previous prices and there are plenty of different indicators out there that will automatically do it for you too. 

The support and resistance levels can also be used to work out the current sentiment and trader preferences within the markets, as well as show you when to enter or not enter the markets. Having a good visual representation of when the markets change position and where it is reversing and bouncing between will give you a good idea of what the markets may do in order to help you analyse other potential strategies too.

Trend Trading Strategies

This is quite a simple strategy in the fact that you are there to trade the market trends, when the price is moving up you will buy and when the price is trading down you will sell, some people only like to buy and some only like to sell. The strategy simply requires you to identify which direction the market is moving in and then trade that same direction. The RSI indicator is a form of trend trading that has been used for a long time and will continue to be used for a long time to come. It’s very simple. When the RSI reaches above 70 or below 30 then it may represent a potential reversal. You will then set some take profit and stop losses at the support and resistance levels in order to close out the trades, this strategy can be incredibly rewarding and very simple to do, as long as the market conditions suit it though.

Fibonacci Trading Strategies

You may well have heard of Fibonacci at some point in your trading career, it is a well-known strategy and is based on a famous mathematician from Italy. This strategy is often seen as a medium to long-term strategy and it is used as a way of following the support and resistance levels that are repeating themselves. Markets are often trending and the Fibonacci style of trading does well in these sorts of trending markets. The trading system works by trading long (to buy) when the price retraces at the Fibonacci support levels when the markets are on the way up, and when the price retraces on a Fibonacci resistance level when the markets are going downwards. It can be a very reliable and profitable strategy, but it can take a bit of time to get used to.

Scalping Trading Strategies

Scalping is a type of trading that is growing in popularity, the idea of scalping is that you are looking for smaller trades, and lots of them in order to make your profits. The strategy aims to make little bits of profits from small changes in the price, both up or down. You are able to increase your profits by simply trading more and increasing the number of trades the account is taking. The lower the timeframe the more trades you will need to win, the higher the timeframe the less you will need to win in order to remain profitable. Successful scalpers will have much higher winning ratios of trades, the one benefit to scalping is that it can be profitable in ranging markets as well as trending ones, so if you get the hang of it, you will potentially be able to make money whatever the markets are doing.

Candlestick Trading Strategies

If you look at the person next to you, they will most likely have their charts set to candlestick mode, this is afterall by far the most popular style of trading chart. There are of course other styles of charts, but these candlestick charts offer a lot more ways to analyse the markets when compared to the others. Candlesticks basically show the price movement over a certain period of time, from a small time frame like 1 minute all the way up to monthly candles. They can be analysed to look at price movements, potential reversals, trends, and breakouts, they can be seen to demonstrate and indicate many different trading phenomena. Learning what the different candles mean can be extremely valuable to a trader and can be an opportunity to make a lot of profits if you are able to successfully read them.

So those are some of the different trading styles that you are able to use and that have withstood the test of time. All five of them have been used for many years and will continue to be used for many more to come, so if you are looking for a strategy that you can keep going for a long time, one of these five would be a good place for you to start.

Categories
Forex Basic Strategies

The Secrets Behind Successfully Playing the Percentages Game

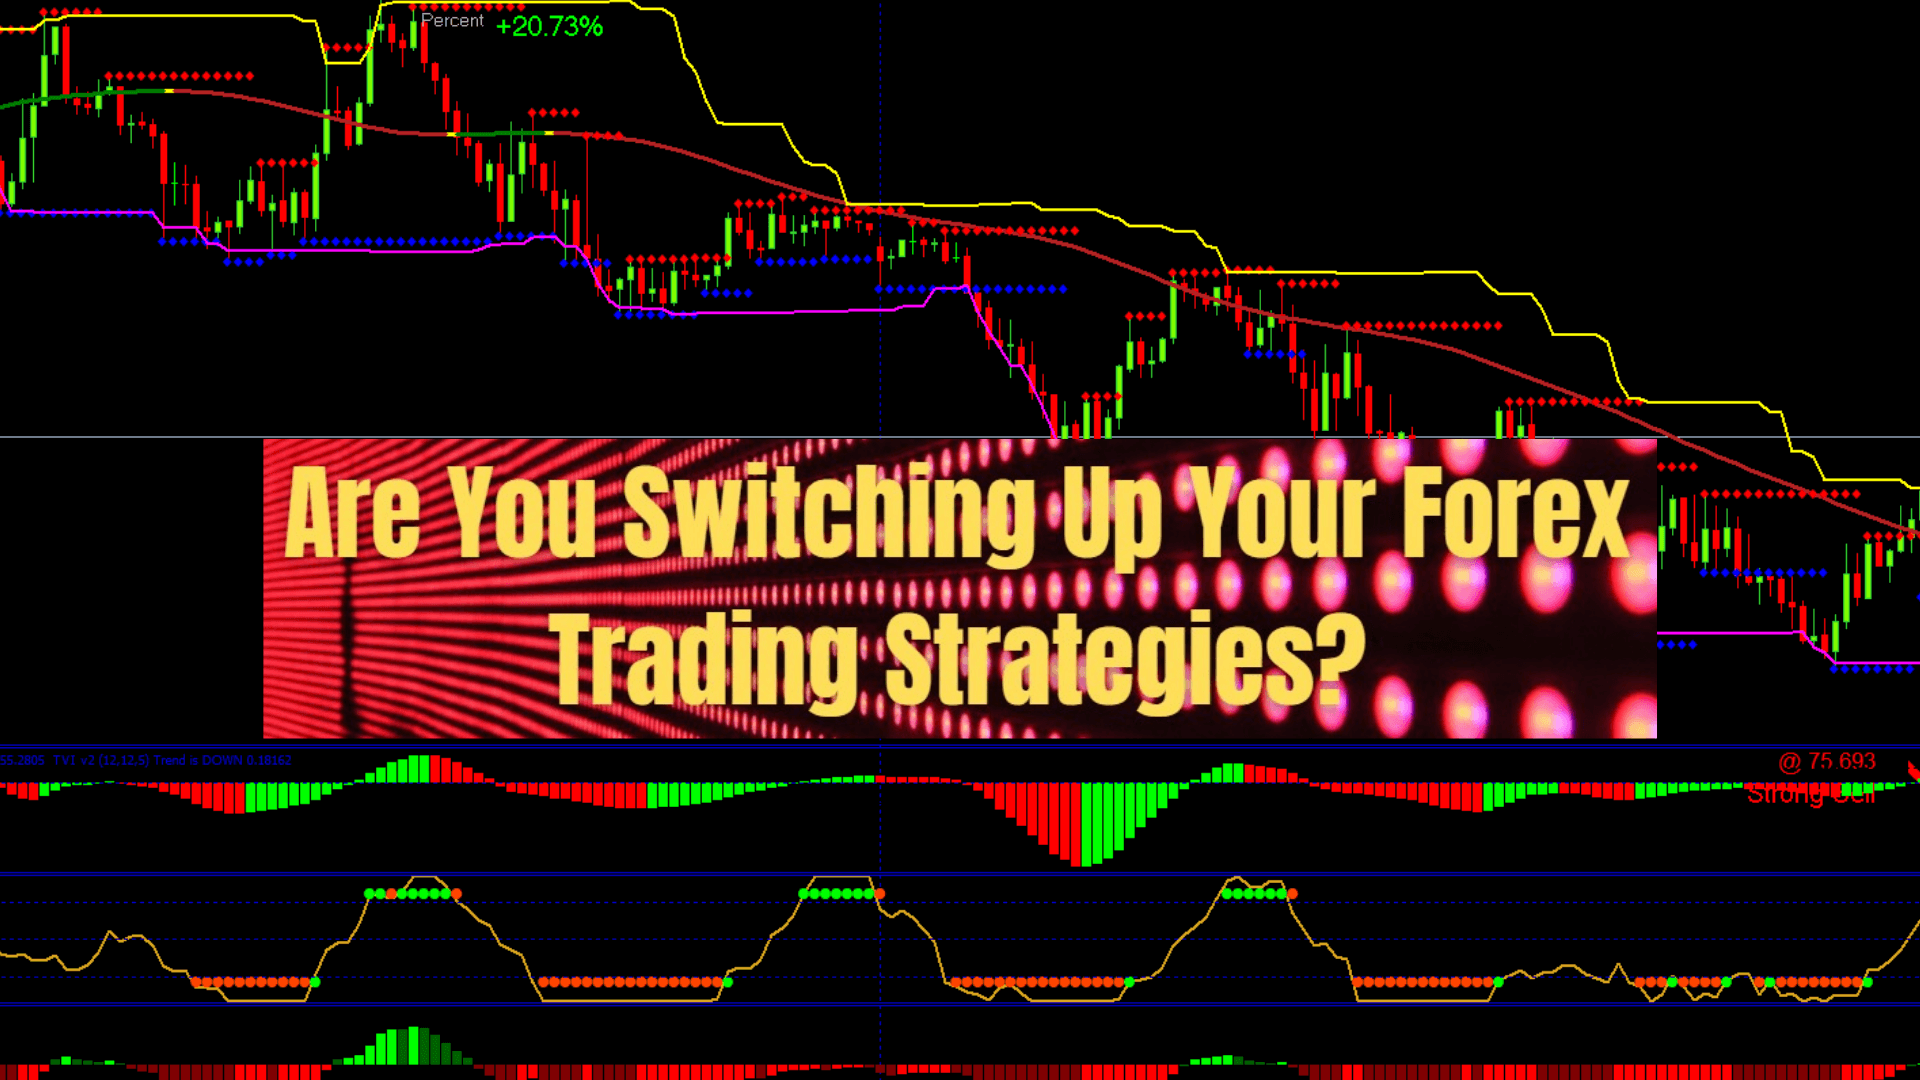
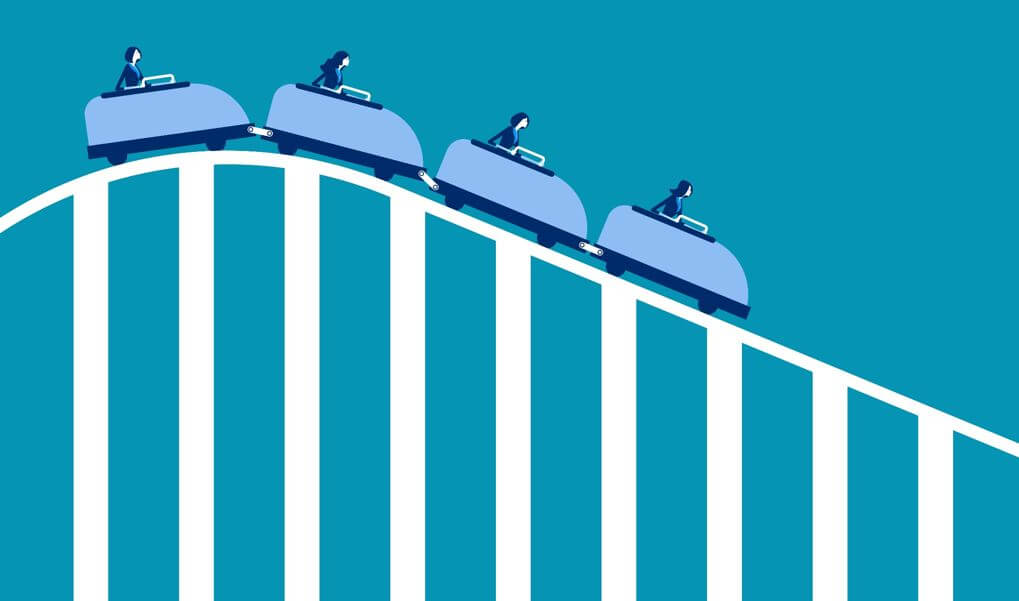
The devil is in the details, they say, so sometimes it’s important to take a step back and look at the big picture – something that is surely as true in forex trading as it is in other aspects of your life. It just might be these details that allow you to succeed in profiting while playing the percentages game.

It doesn’t matter what kind of trader you are, whether you love Fibonacci or Japanese candlestick patterns or if you have concocted your own system; it doesn’t matter if you trade on the one-minute chart or the daily chart; it doesn’t even matter if you’re a chart watcher or if you log in for fifteen minutes every couple of days – in all these scenarios there is one rule that applies to everyone. And that rule is that you will win some trades and lose others.

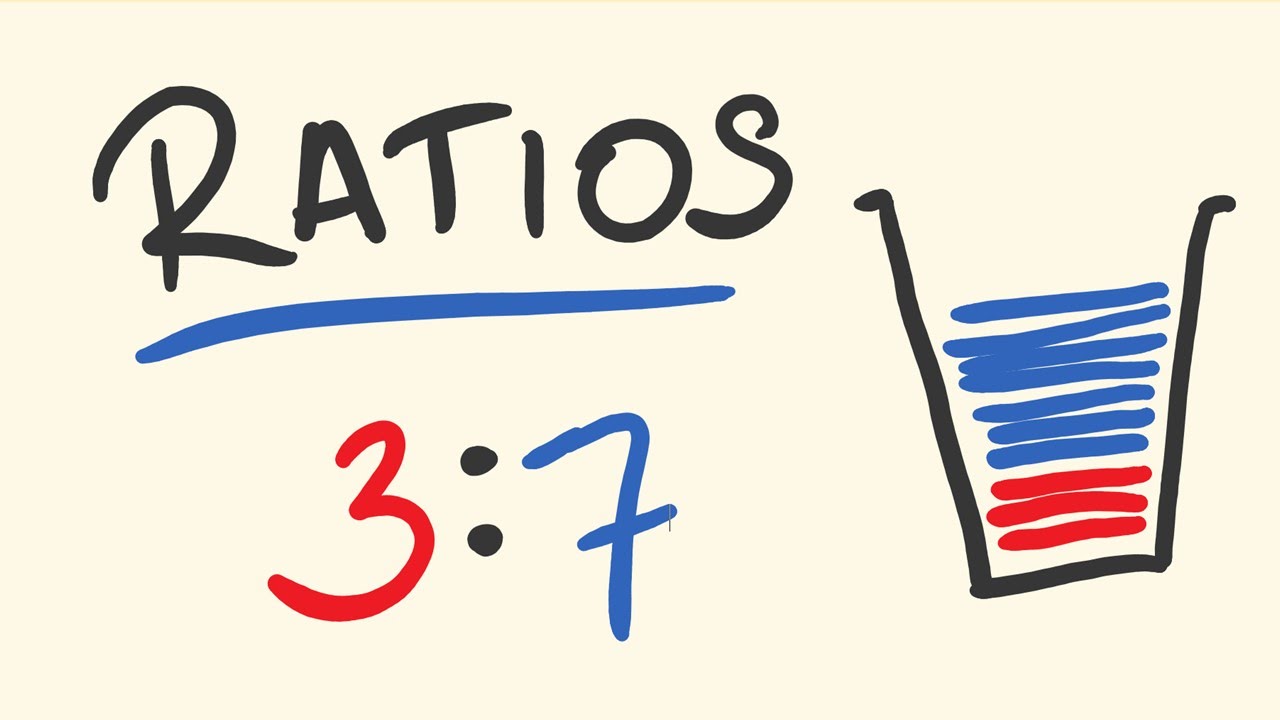
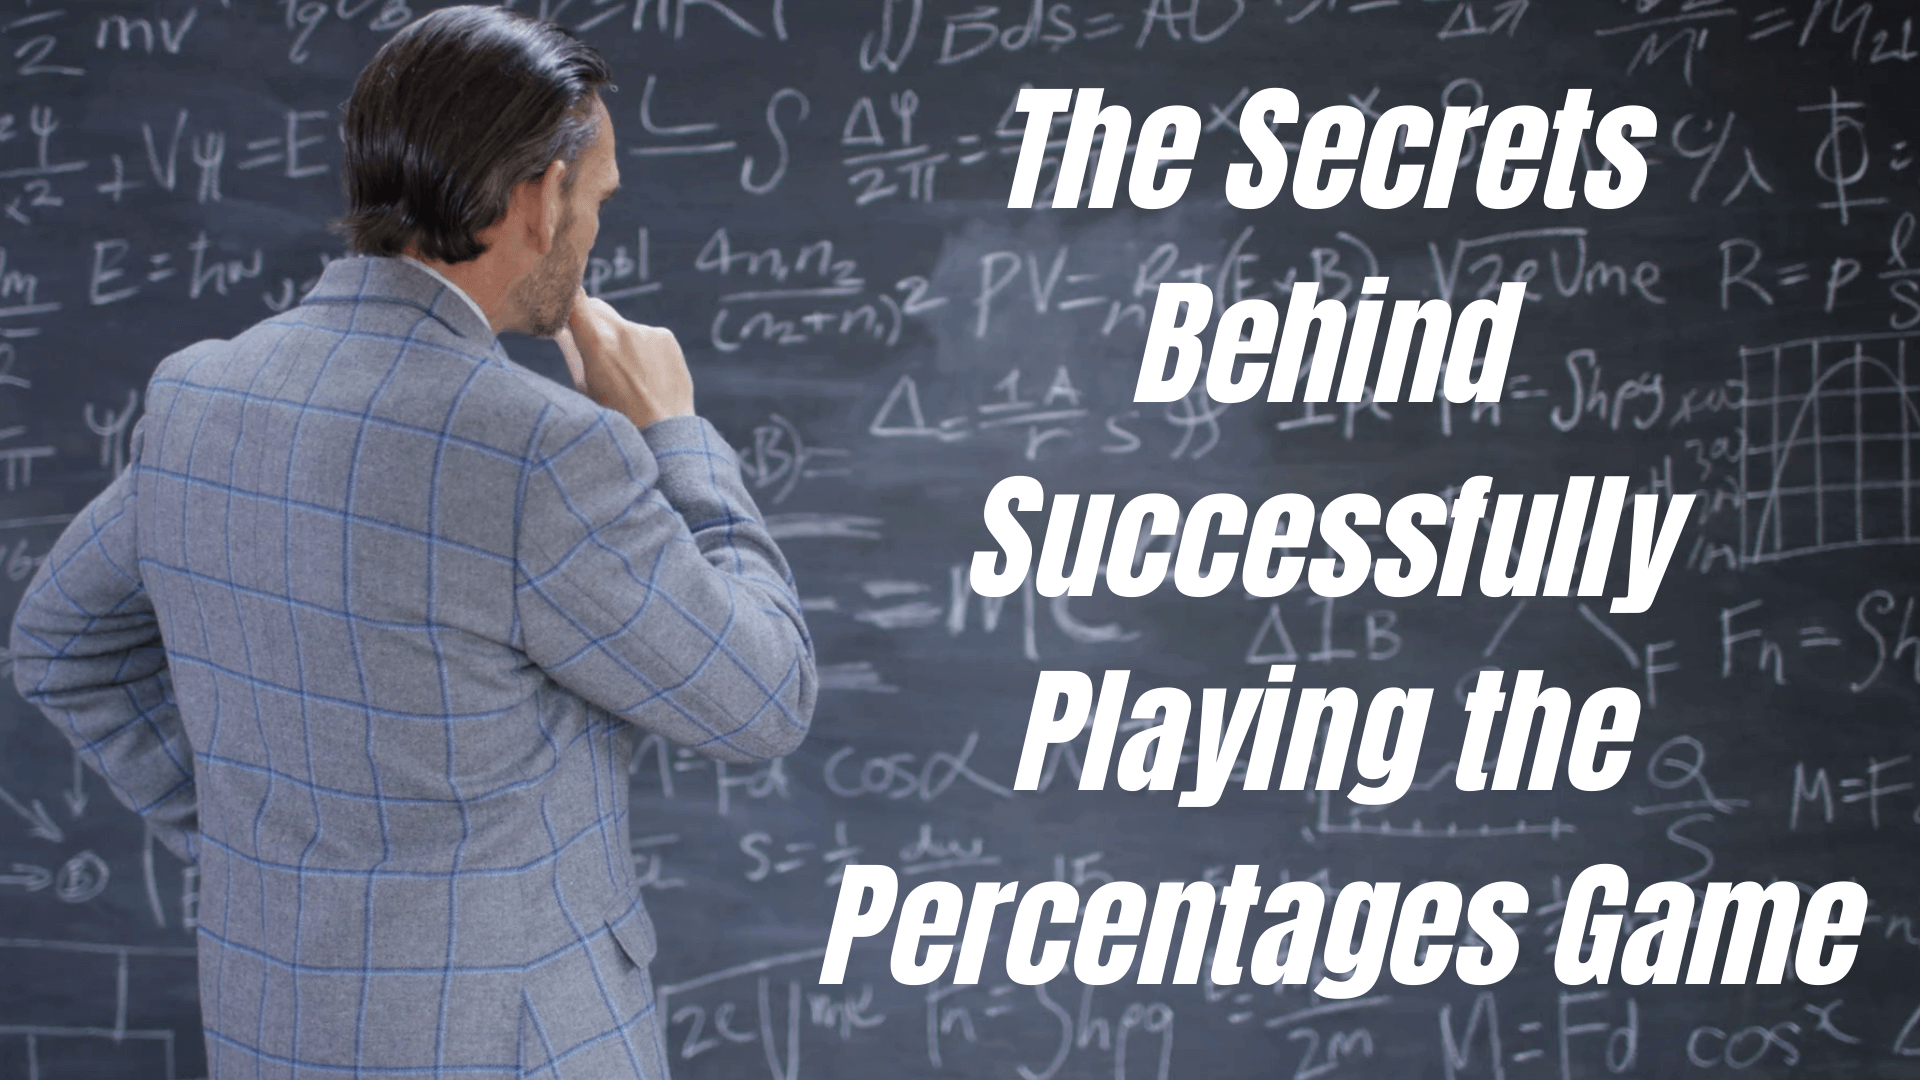
High-Percentage Trading

So, if you’re smart enough to take a step back and look at the big picture, you will realize that the name of the game is minimizing your losses (and not just bad trades but how much you lose when you do lose) and maximizing your gains (making sure that when you do win, you win big enough to reliably and consistently make money from trading). Sure, that sounds simple enough doesn’t it? But let’s put it like this, say you make ten trades over a given period, and out of those ten, you win on six and lose four. Well, you’re winning more often than you’re losing but are your wins outweighing your losses? But how do you get that down to three losses out of ten and how do you make sure your losses are small while maximizing your wins? If you can work that out, it’ll set you apart from the hundreds of thousands or even millions of unsuccessful traders out there – that’s what sets the pros apart from the amateurs.

But here’s the catch. Every time you go into a trade, you are convinced it’s a good one. Even if you’ve done your homework, put in the research, done the technical analysis or even if you just have a great feeling about this one – you never know in advance which trades are going to be the losers. If you did, you wouldn’t enter them and you’d probably be a millionaire almost overnight. Let’s put it like this, if you ask any trader out there right now if they can win every trade they enter, they’re going to answer that, of course, you can’t. Nobody wins every trade. But then if you ask the same trader how they feel about the trade they’re currently in, they’ll tell you they’re sure this one will be a winner.

Beginner Woes

We’ve all been there when we started out. We’ve watched video tutorials, learned about a few basic indicators, picked out a strategy online and we think we’ve learned so much. But a little knowledge is a dangerous thing. In forex trading, it can be deadly. We jump in and we inevitably get burned. We didn’t understand risk, we didn’t understand how to manage our money, we probably didn’t even understand some elemental basics, like how you can get burned when the price gaps below your stop. We probably got caught up in our own emotions or the adrenaline kick of trading and we got humbled by our losses.

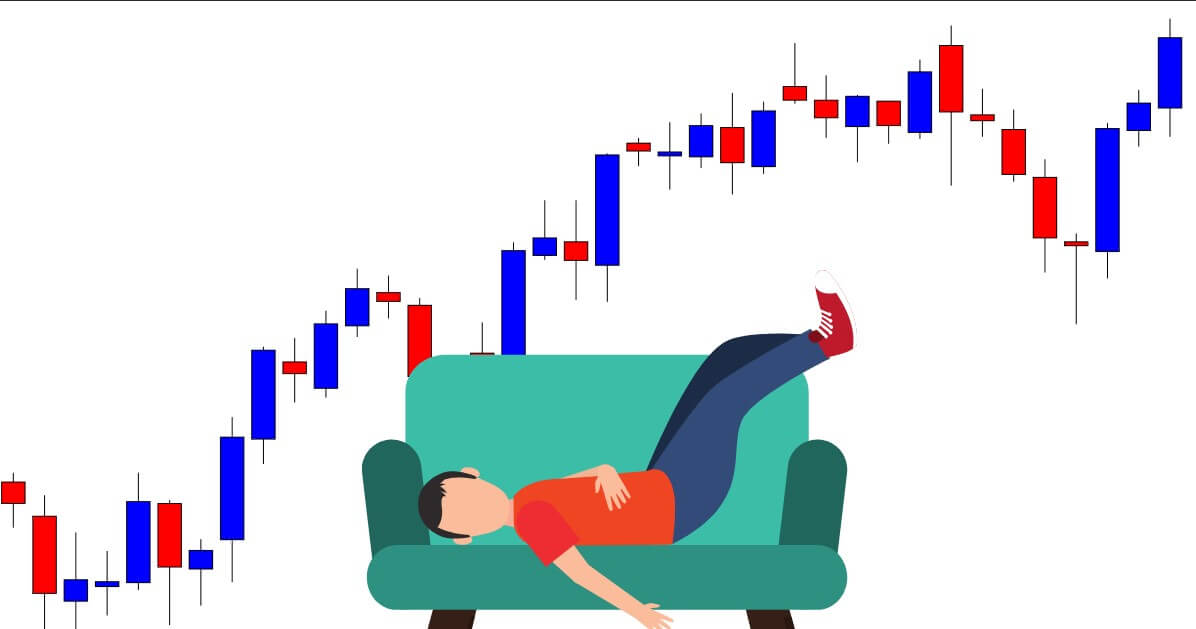
The forex markets are open 24 hours a day for five and a half days per week – that gives you a lot of time to show how little you know and how many mistakes you can make. In short, it’s a lot of time to make an idiot of yourself. You can easily start trading out of boredom. Lots of people become hooked on the adrenaline of trading and end up entering bad trades. Adrenaline is deadly for forex traders. You need to be in control of those impulses and watch out for those times when your brain is calling out for stimulus. Introverts have the opposite problem – they will spend all their time second-guessing every move. Probably to the point that they will miss a bunch of good trades (which doesn’t, by the way, guarantee that the trades they eventually enter will be winners).

There are so many common mistakes people make that it is worth listing a few of the main ones because some of you reading this will still be making them:

  • Trading without a plan and without knowing or assessing the risks before you enter a trade;
  • Breaking the rules of your plan (be careful with this one because, at the moment, your brain will be able to come up with any one of a million justifications that will seem sensible and rational at the time);
  • Getting attached to or over-focusing on one particular currency pair – sometimes when you think you’ve found a winning combination you stick with it well past its use-by date;
  • Staking more and more on the next trade in the hope that it will win big enough to recover your past mistakes;
  • Failing to incorporate lessons learned into your trading and repeating past mistakes.

Trading by the Numbers

And that’s the crux of high percentage trading. Every component of your system needs to be well designed so that every trade is well planned out to minimize the number of losing trades and, when those trades do crop up, to minimize how much they set you back. The flipside is that you are also working to ensure that when you do win, the wins are handsome enough to outweigh the winners. And this needs to be deliberate and systematic enough that you can rely on it almost automatically so that it overrules your own psychological and emotional state.

If you want to improve the winning percentage of your trades and apply a high-percentage trading strategy, there is really only one approach. You have to design your trading system in such a way to eliminate the mistakes and traps amateur traders fall into.

So, how do you do that?

You could do a survey of successful, experienced traders out there and ask them what are their top five strategies for improving the percentages of their trading. And you would get a bunch of different answers out there – from the psychological and philosophical to the technical and procedural. But every last one of them would have on their list some version of the below components. Every successful trading system will incorporate these four things to ensure it maximizes its wins and cuts back on losses: timing (when to trade and when not to); currency pair selection (knowing which pair to trade, when and why); trade management; and risk management. If your system incorporates these four things and does so in a rigorous, well-planned, thoroughly tested manner, you are well on your way to avoiding the pitfalls that burn so many amateur traders.

Timing

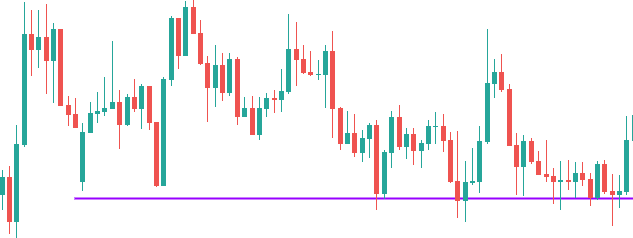
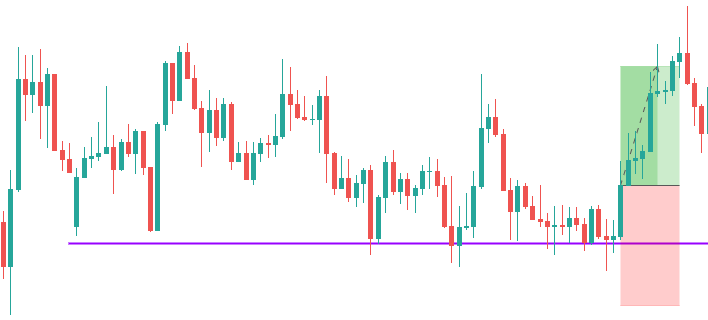
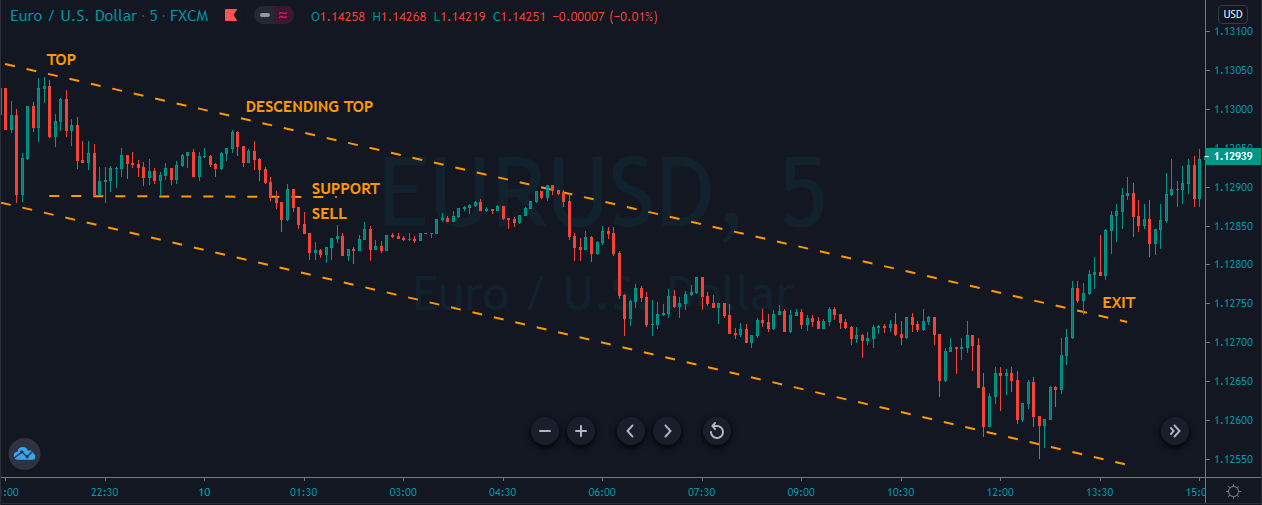
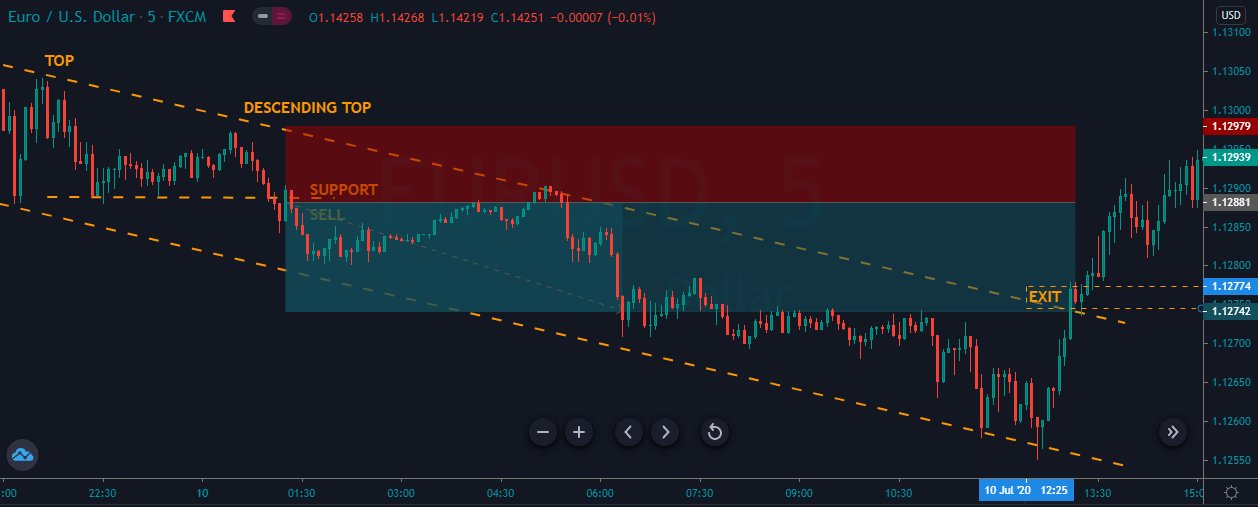
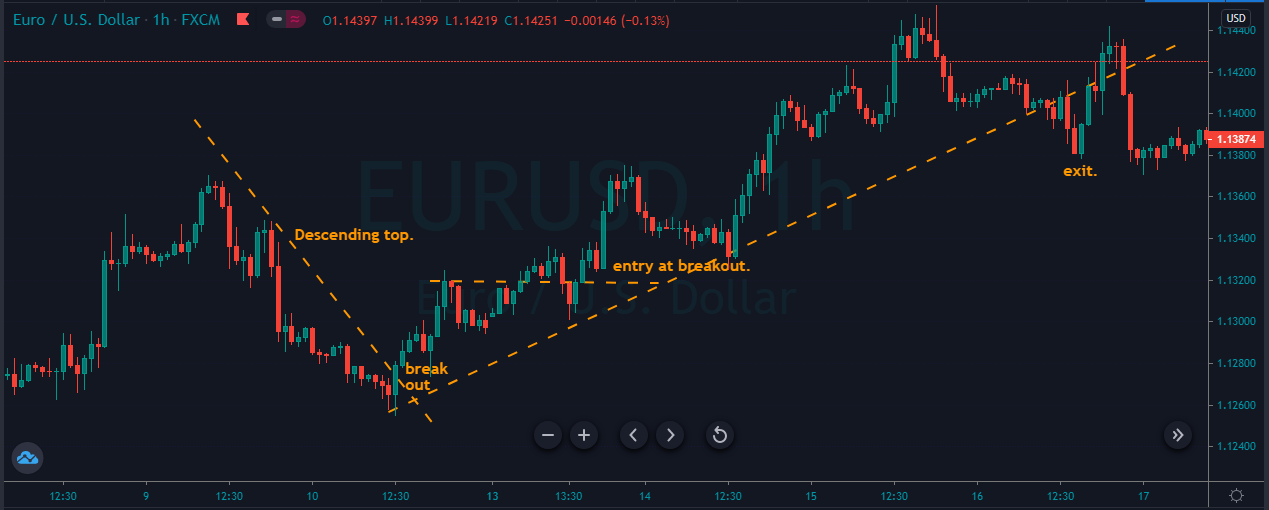
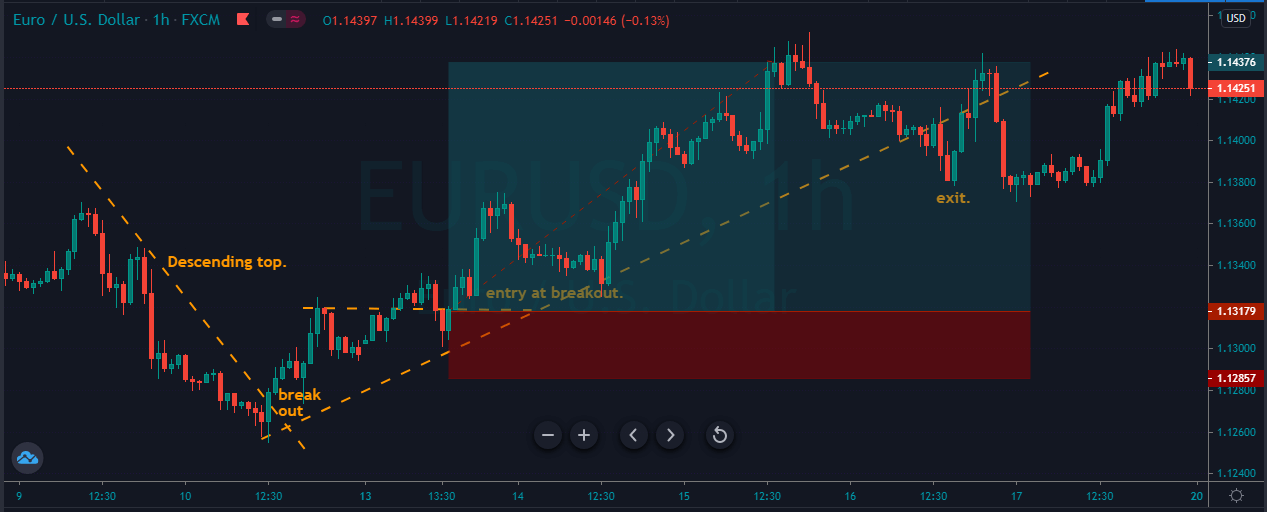
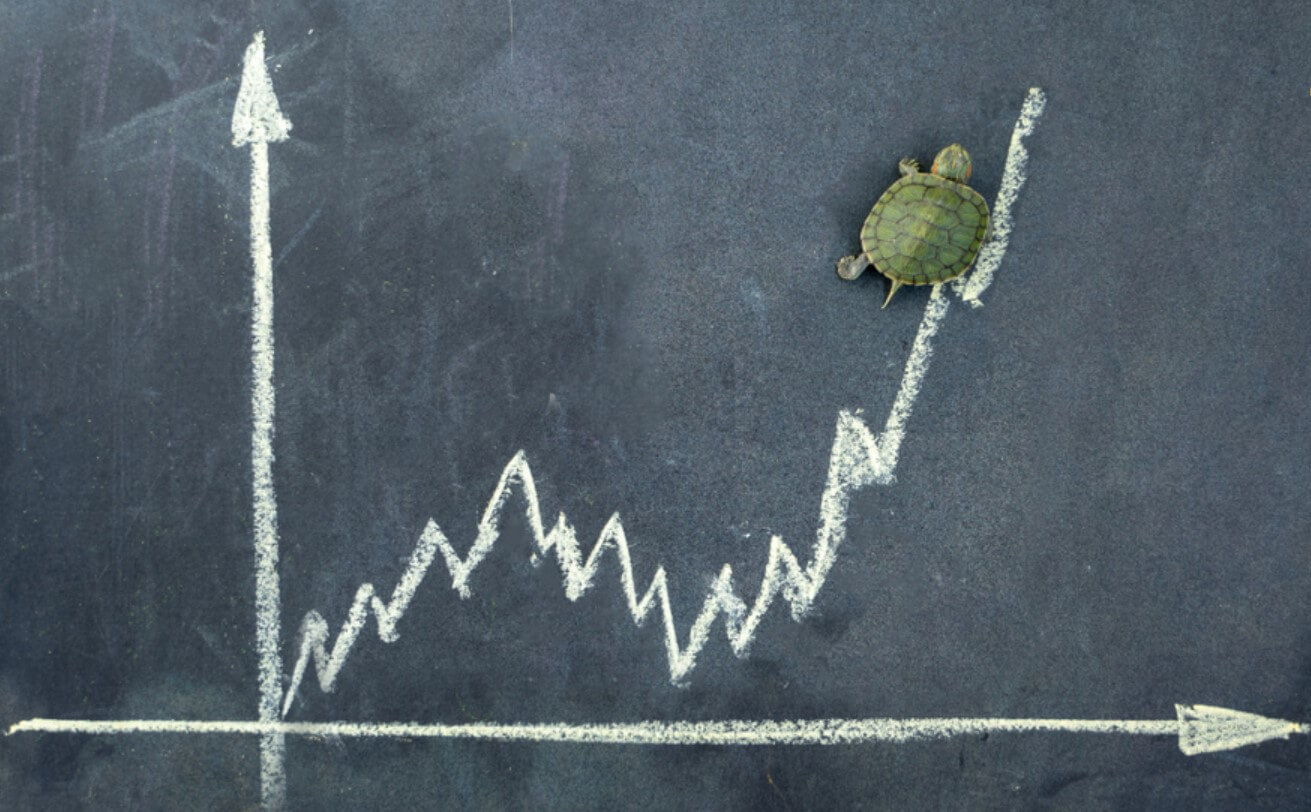
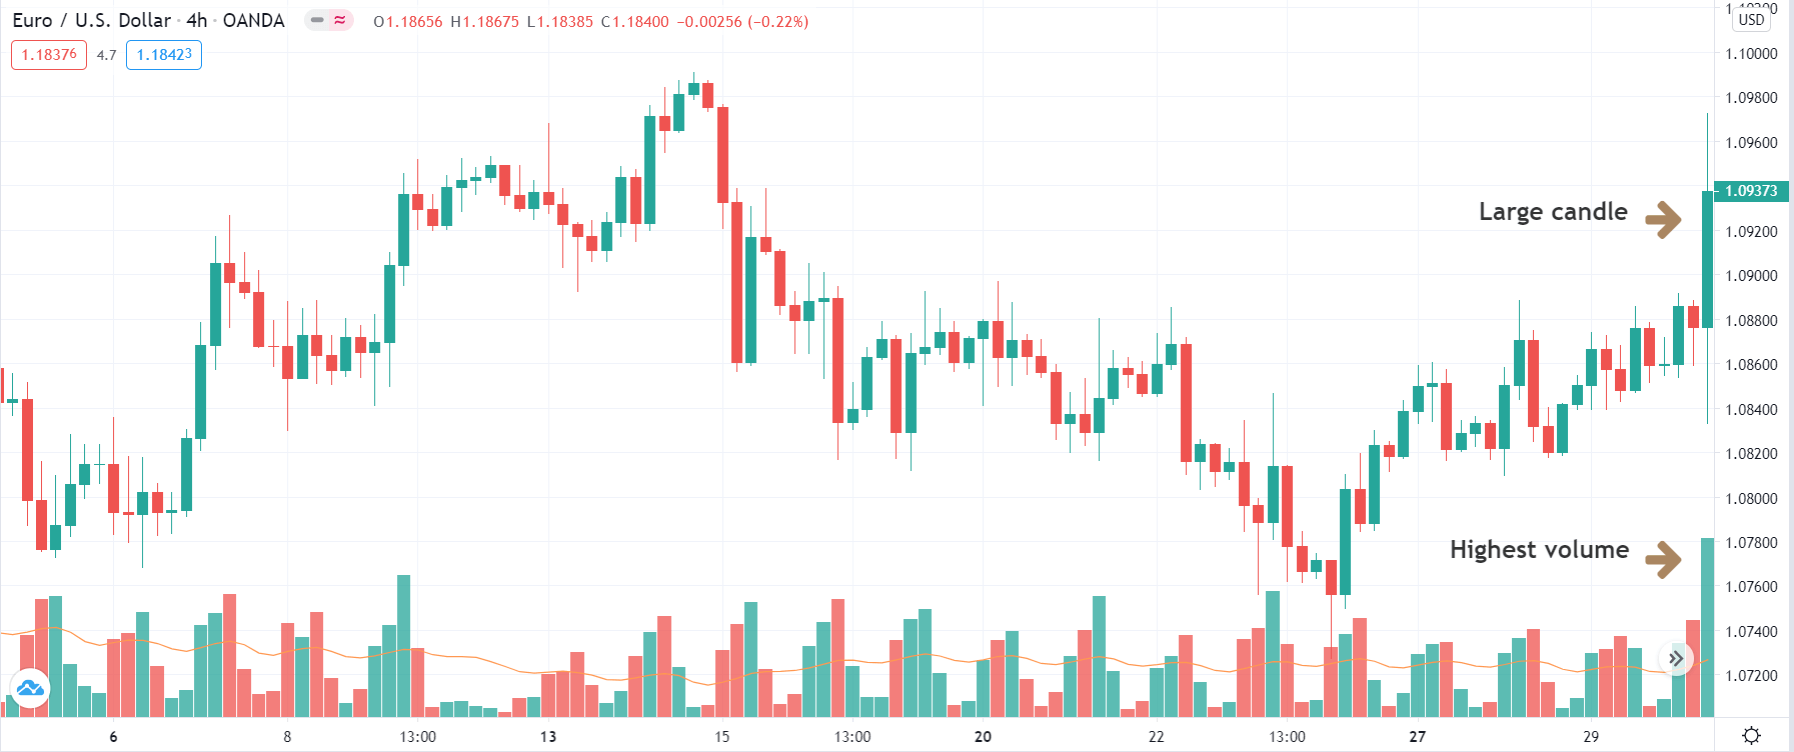
Planning your trades to coincide with those times when there are energy and movement in the market (and, conversely, avoiding those times when the market is flat) is one of the key skills in forex trading but also one of the most difficult to master.

It can’t be repeated enough that knowing when not to trade is just as important as knowing when to trade – also known as you can’t lose if you don’t play. When the market lacks strength and momentum for reliable trends to emerge, it is too random for consistent trading. In short, it is too unpredictable and you will get caught out without even knowing why it happened. Using a set of skills and tools that you have thoroughly tested in advance and that you know inside out is key to identifying those times when volume and volatility are on your side. And when they are not.

Even in a regular 24-hour cycle, there will be times when it is a good idea to trade and times when it is a bad idea. The world is a global place now and forex trading is a global activity. People who are just starting out are simply not tuned into this and think that the 24-hour cycle means that they can trade whenever is convenient for them. If you want to rise above that, at the very least you need to have these facts buried somewhere in your trading brain so that everything you do is done with an awareness of that. Because at certain times there will be a higher volume of trading and volume means liquidity.

With a higher level of liquidity, the market will be less erratic and more predictable. So you need to know which times of the day are better for volume and liquidity because those times will be your sweet spots for trading. The best of these are the overlaps between the sessions and, of those, the best one is easily the overlap between the European Session and the American session. That is usually the time of day at which the markets are most liquid because European markets are still open and American markets are just coming online.

Conversely, there are also times during a 24-hour cycle when it is a bad idea to trade. Think of these times as areas to avoid – almost at all costs – because the volume of trading will turn them into choppy and unpredictable nightmares. These times are the early and late Asian session, as well as the Sunday night session.

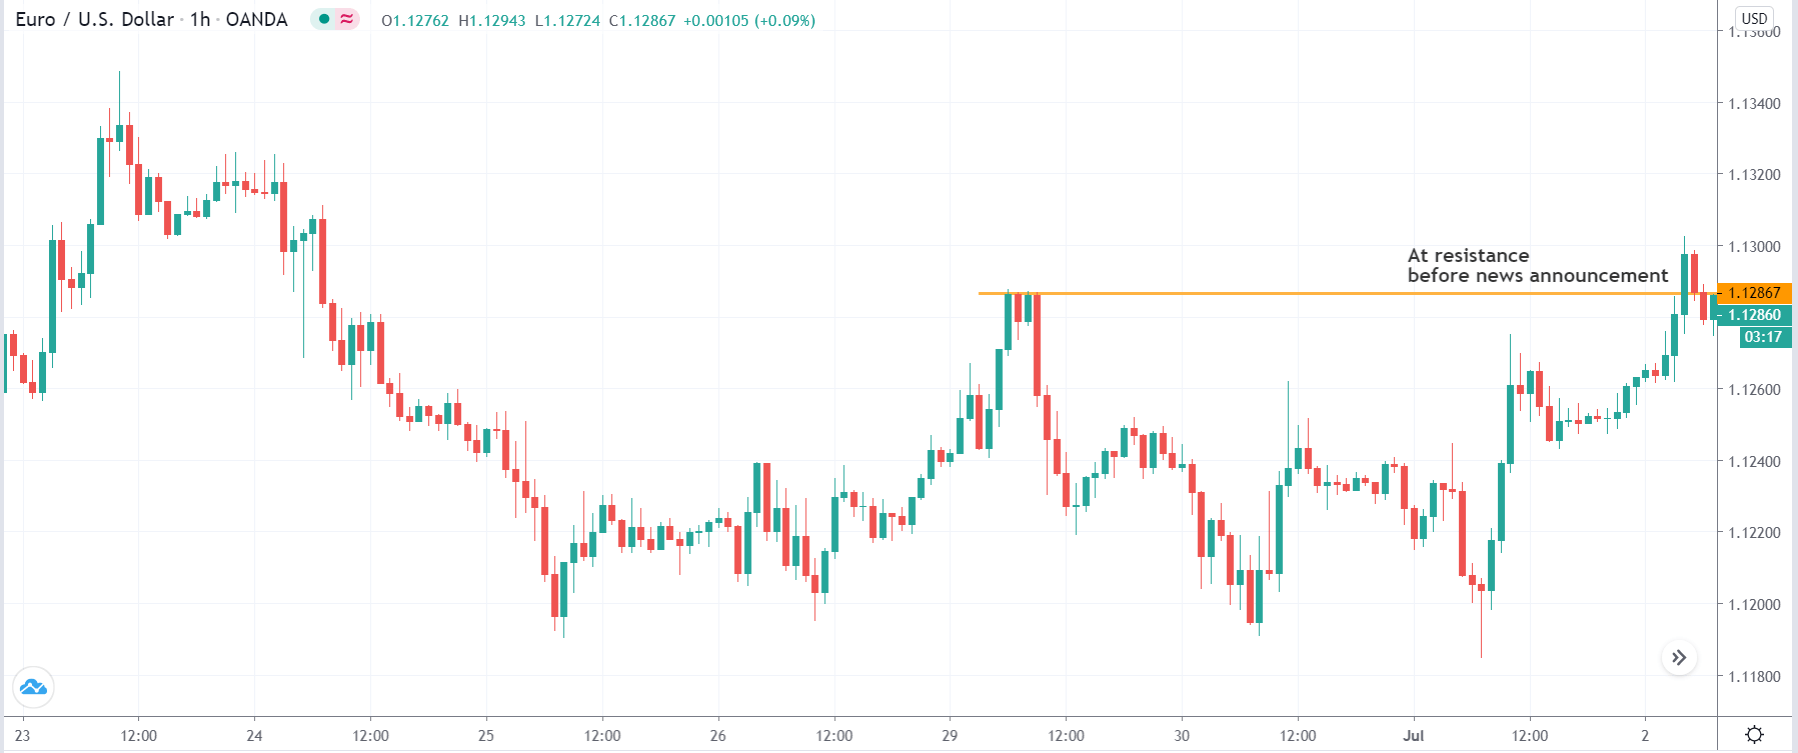
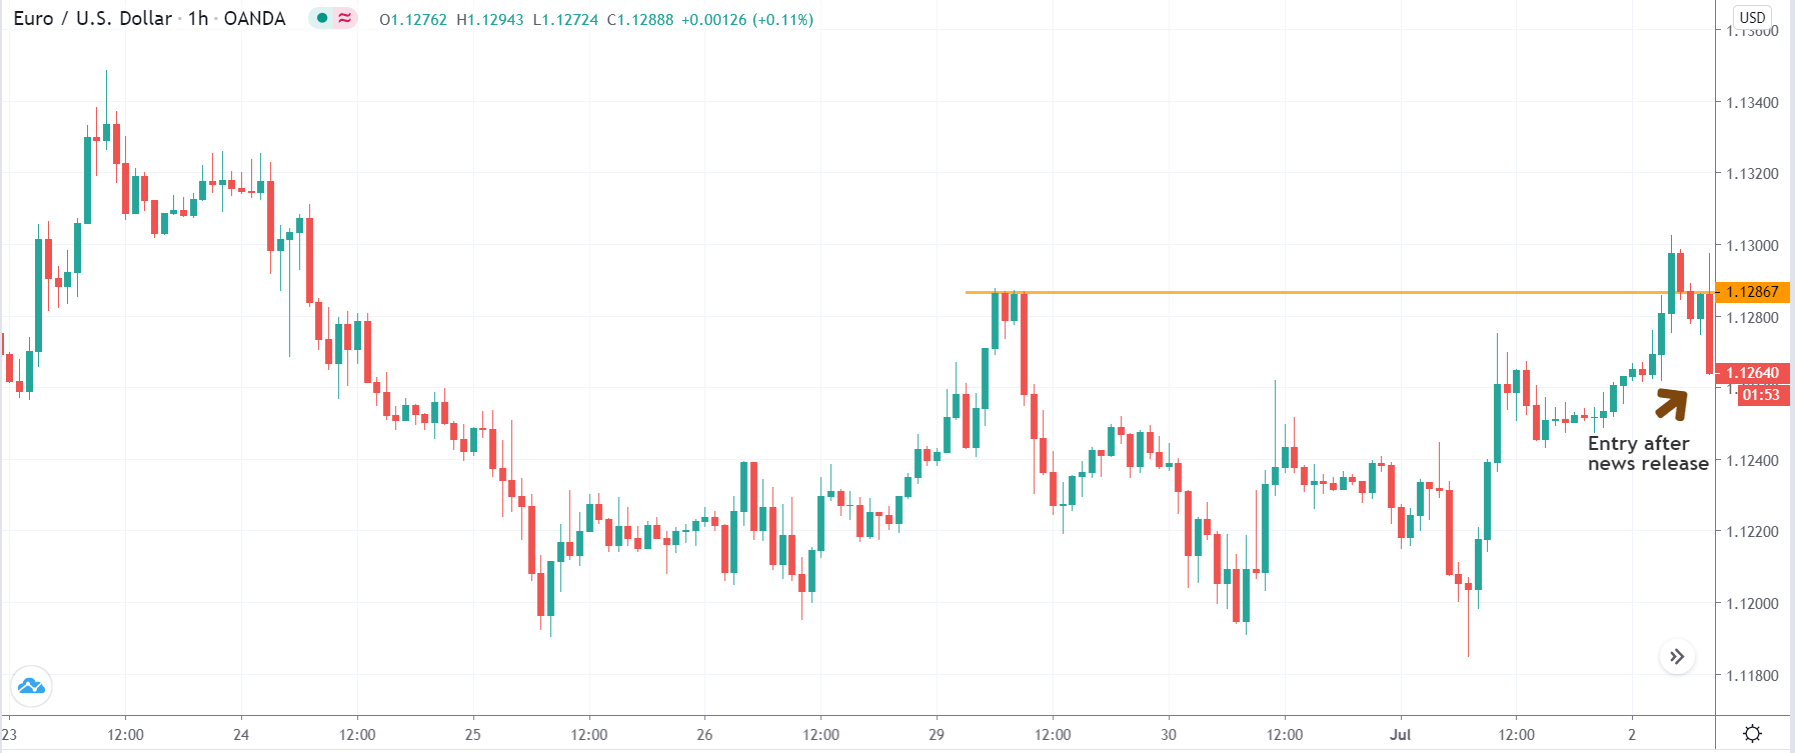
Of course, you’ve got to remember that these are low energy periods on an ordinary day. This could change if there is a significant news event that crops up during the run-in to these periods that turn up the volume on them because everybody jumps in to take advantage of the news that’s just been announced.

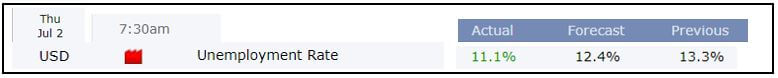
Which brings us neatly to the other critical item on your timing checklist: the news cycle. You need to get on top of the regular news cycle for the currencies you’re trading. This needs to become part of your trading day and part of your research and analysis. You can’t possibly account for unexpected news events – that’s why they’re unexpected – but you do need to be dialed into when the regular news events come around and have a good sense of how they’re going to affect the currency pairs you’re looking at.

These regular news events include announcements by central banks, national GDP reports, and other economic announcements by governments and the major financial institutions. The good thing with these kinds of news events is that there is a regularity to them, which means that you can go in and cross-reference past events with price movements. This is a useful activity to invest some time into because it will give you a better sense of how these announcements impact the markets so you can be better prepared for the next time they come around.

The best way to keep track of upcoming news events of this kind is to have a calendar set up with alerts giving you plenty of notice for each event. If you do this, you can update and modify this calendar as you incorporate new events and new currency pairs, which means it will evolve over time and become a better and better guide to timing your trading. The other thing to remember is that news events will affect the relationship between currency pairs, so if you are looking at, say, CAD vs. NZD, you need to be on top of the news events affecting both of these currencies. And in addition to that, you should probably keep an eye on USD and EUR news too because some of the bigger news events might ripple out to affect other currencies.

The final piece of the timing puzzle is a combination of discipline and psychology. If you know in advance that you are prone to idle chart-gazing, you might be one of those people who’s going to want to avoid being logged into your system during times when you know liquidity will be low. The danger you are trying to evade here is the temptation to trade out of pure boredom. You know it happens and it can happen to you. You stare at the screen, watching those little candlesticks take shape and your brain starts to convince you that a particular trade might be a good idea. This is the absolute worst thing you can do – as you well know – so a good way to cut down the chance of it happening at all is to help yourself exert some self-control by avoiding those times of day when you know trading volumes are going to be low.

Choosing Your Targets

Once you have organized your timing, built up a calendar of regular news events, worked it around your lifestyle and schedule, you are ready to start picking out what pairs to trade at any given time. Trading the correct pair of currencies at the correct time is a key way to improve your win/loss ratios. It can’t be overstated that the best pair to trade is where one currency is going up the most and the other is going down the most. If you’re focusing on a currency pair where both currencies are static, you’re doing it so wrong it is now time to go all the way back to the drawing board.

So part of your trading routine has to be identifying the relative strength and weakness of currency pairs during a given trading window. How often you go through this process is down to you and should be tailored to your specific trading style but we recommend that you go through this analysis at a minimum of twice a week. This will give you a watchlist of currencies to zero in on during the trading window and you can even set alerts for possible entry points.

The only thing you can base this on, ultimately, is how the currencies have performed over the recent period. There are no crystal balls so you will have to stay on top of the recent performance of the currencies you are trading and evaluate their relative strengths and weaknesses. One way of doing this is to look at currency baskets and apply that approach to your trading. You will need to be aware, however, of how these baskets are weighted because that will also affect the information they’re giving you. The most famous currency basket is, of course, the dollar index (USDX), which combines six of the majors and rates them against the dollar. But, you do need to know that the USDX is very heavily euro-weighted, with the other currencies very much taking a backseat. So, USD vs. CHF movements, for example, will not really affect the USDX since the Swiss franc is only weighted in at three and a half percent (the euro, by contrast, makes up around 58 percent of the index).

Once you have identified the currencies that you are confident will be relatively strongest and weakest during the trading window, you will have generated a watchlist to focus on. Combined with your trading schedule and news event calendar, you have now narrowed the field to a few currency pairs, and the times at which trading them will be optimal. This is already so many steps beyond how amateur traders approach trading and frees you up to concentrate your system on finding the right setup for these pairs.
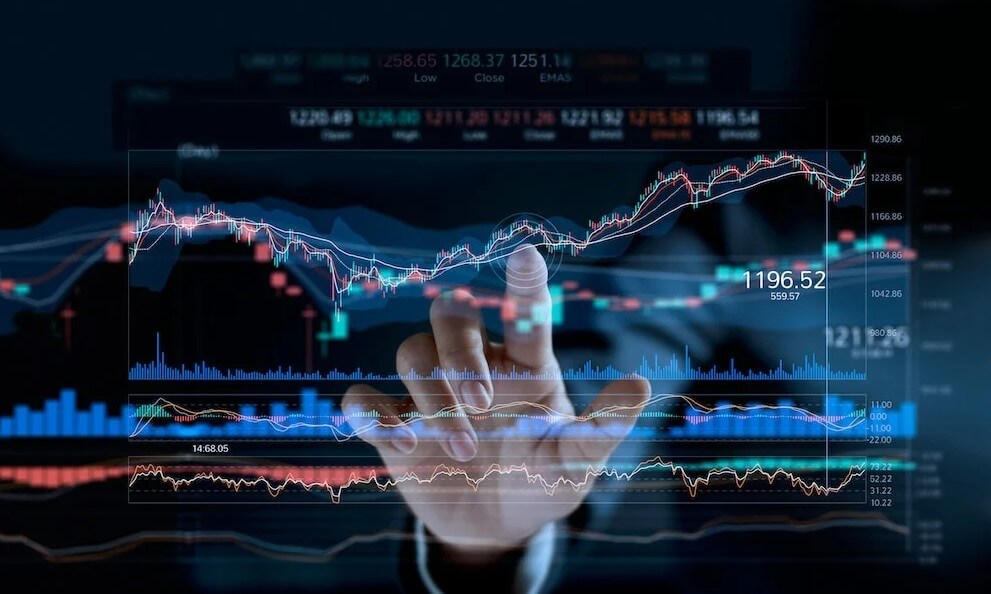
Chart Setup

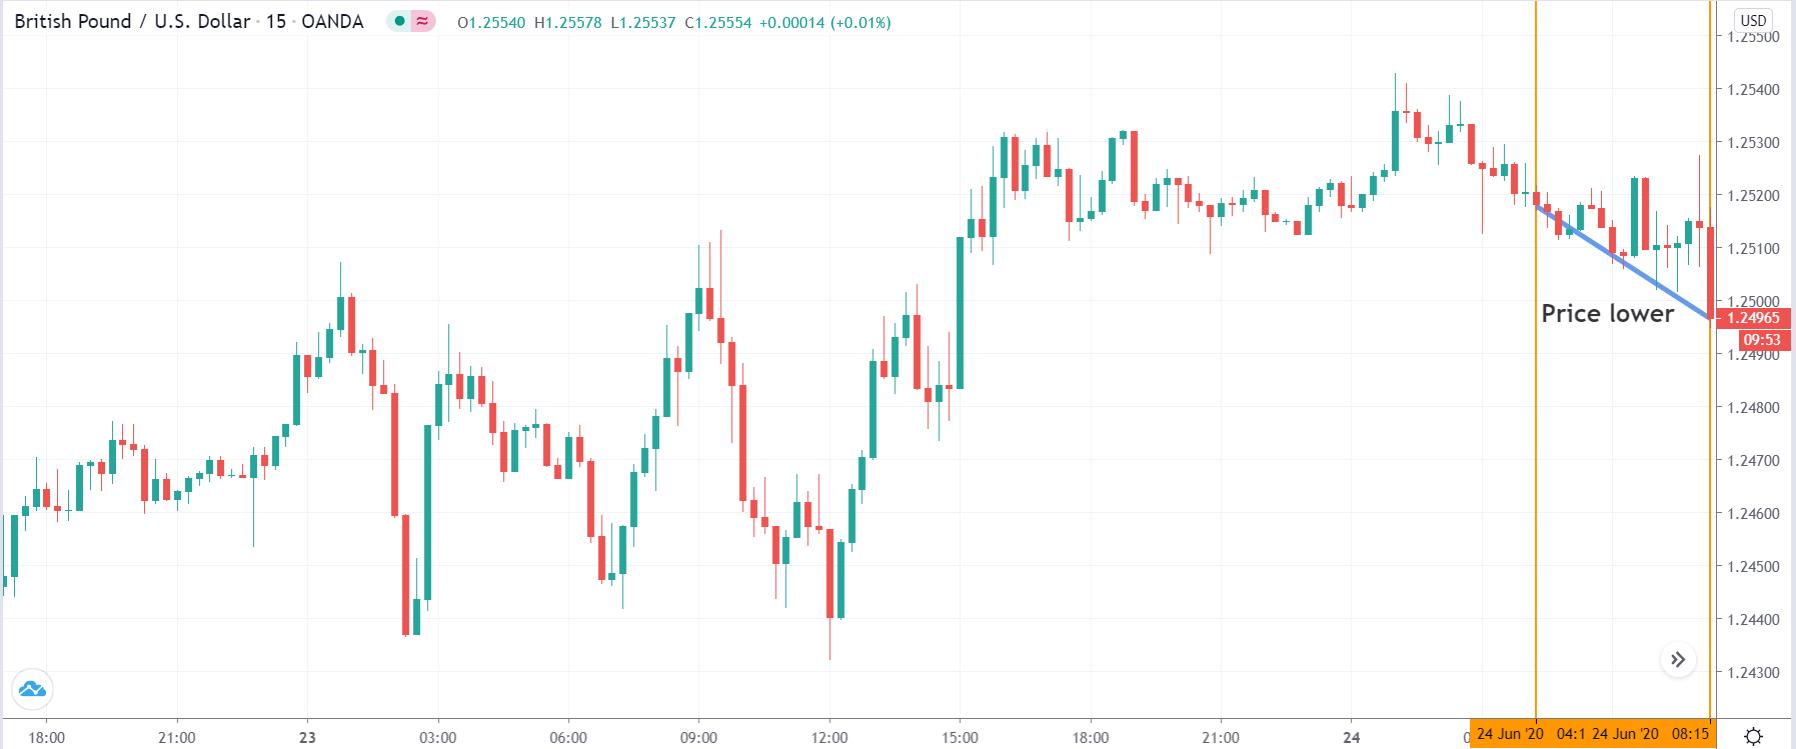
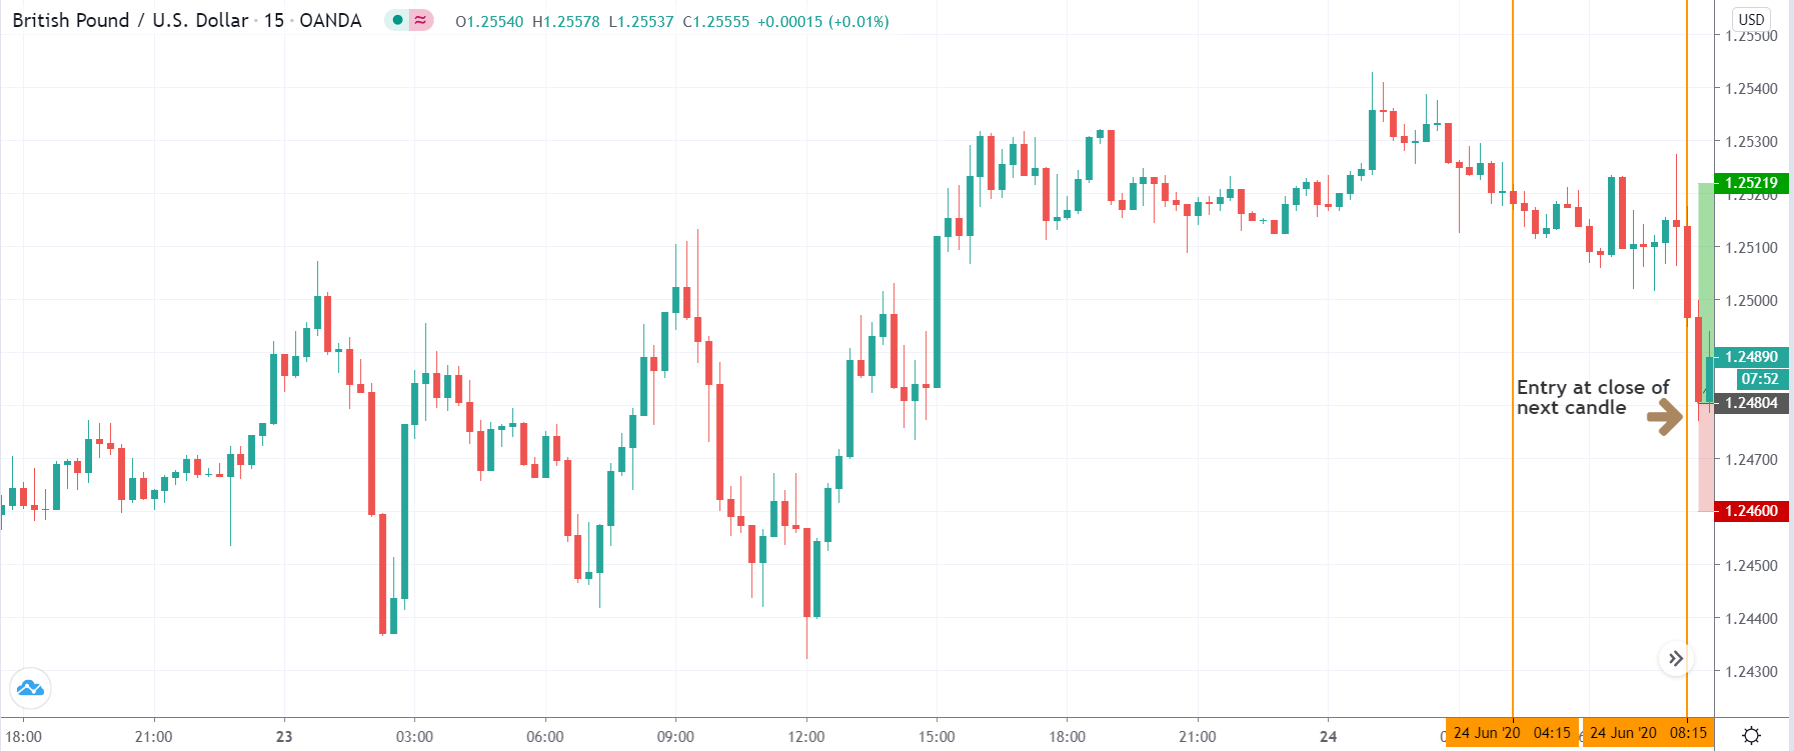
This is where the fun begins. You’ve invested your time into identifying when to trade those pairs that you have determined are going to be the strongest and weakest in relative terms, now it is time to put your technical analysis skills to work. Boiled down to its most fundamental meaning, technical analysis is the set of tools, indicators, and procedures you have developed to help you identify a trade entry point. This is the part most inexperienced traders jump straight into, completely ignoring everything else we’ve been discussing here. The area where beginners and amateurs tend to flounder is that they ignore the rules of their own setup.

A setup is, after all, basically a checklist of conditions that have to be met before you (and the system you have developed) say it is ok to trade. The reason you have a checklist in the first place is that you want to cut down on all those things that are going to lead you time and again into losing trades: guesswork, emotional responses, rash decisions. If you can eliminate these and instead follow a system that you have tested and tweaked over time and that you are confident will churn out a positive ratio of wins vs. losses, then you are well on your way to becoming a successful trader.

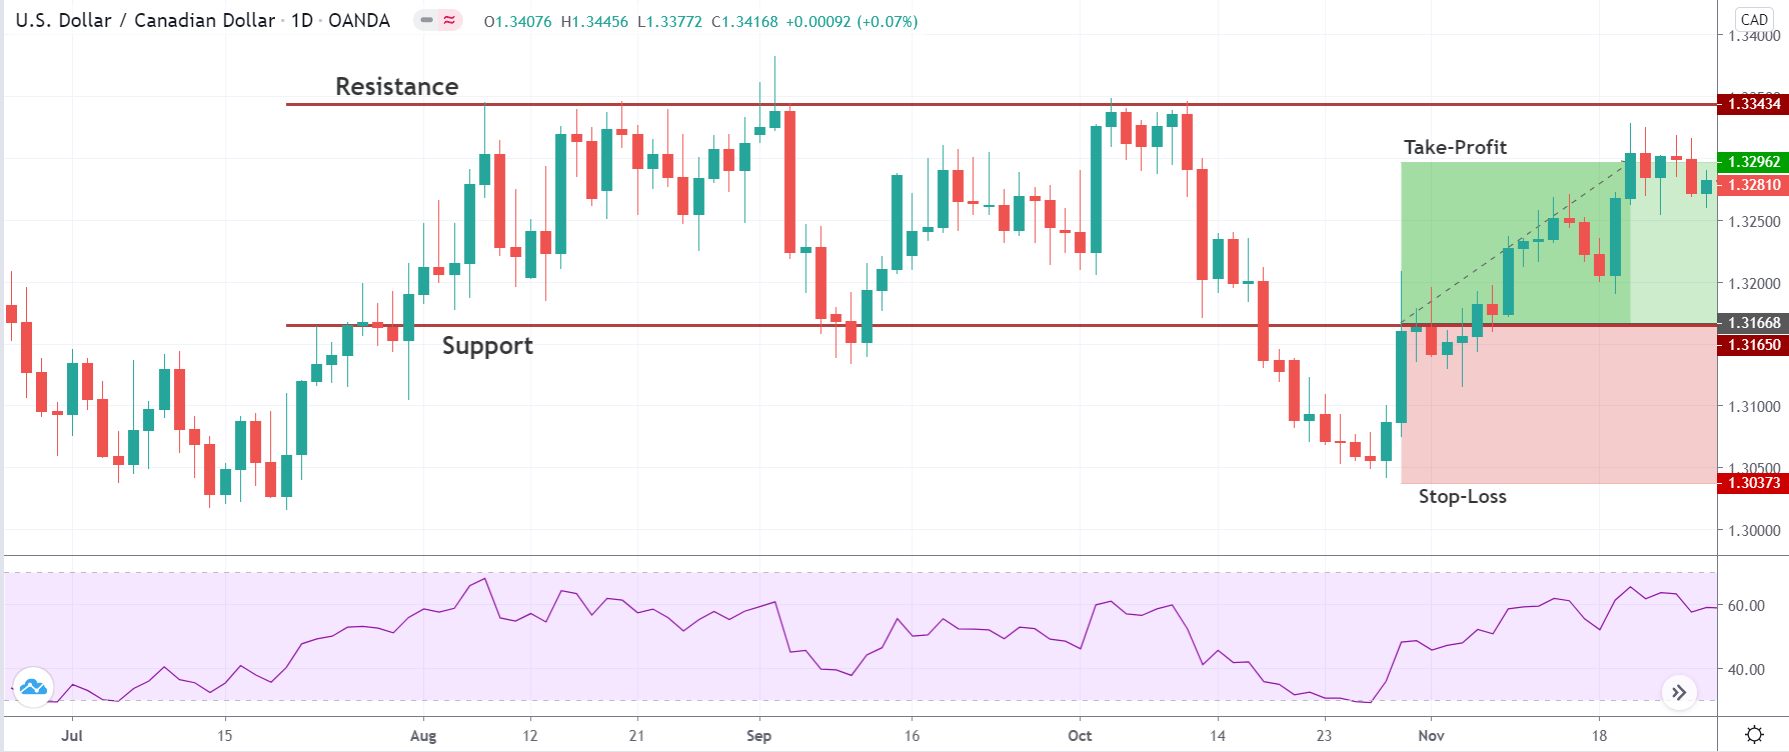
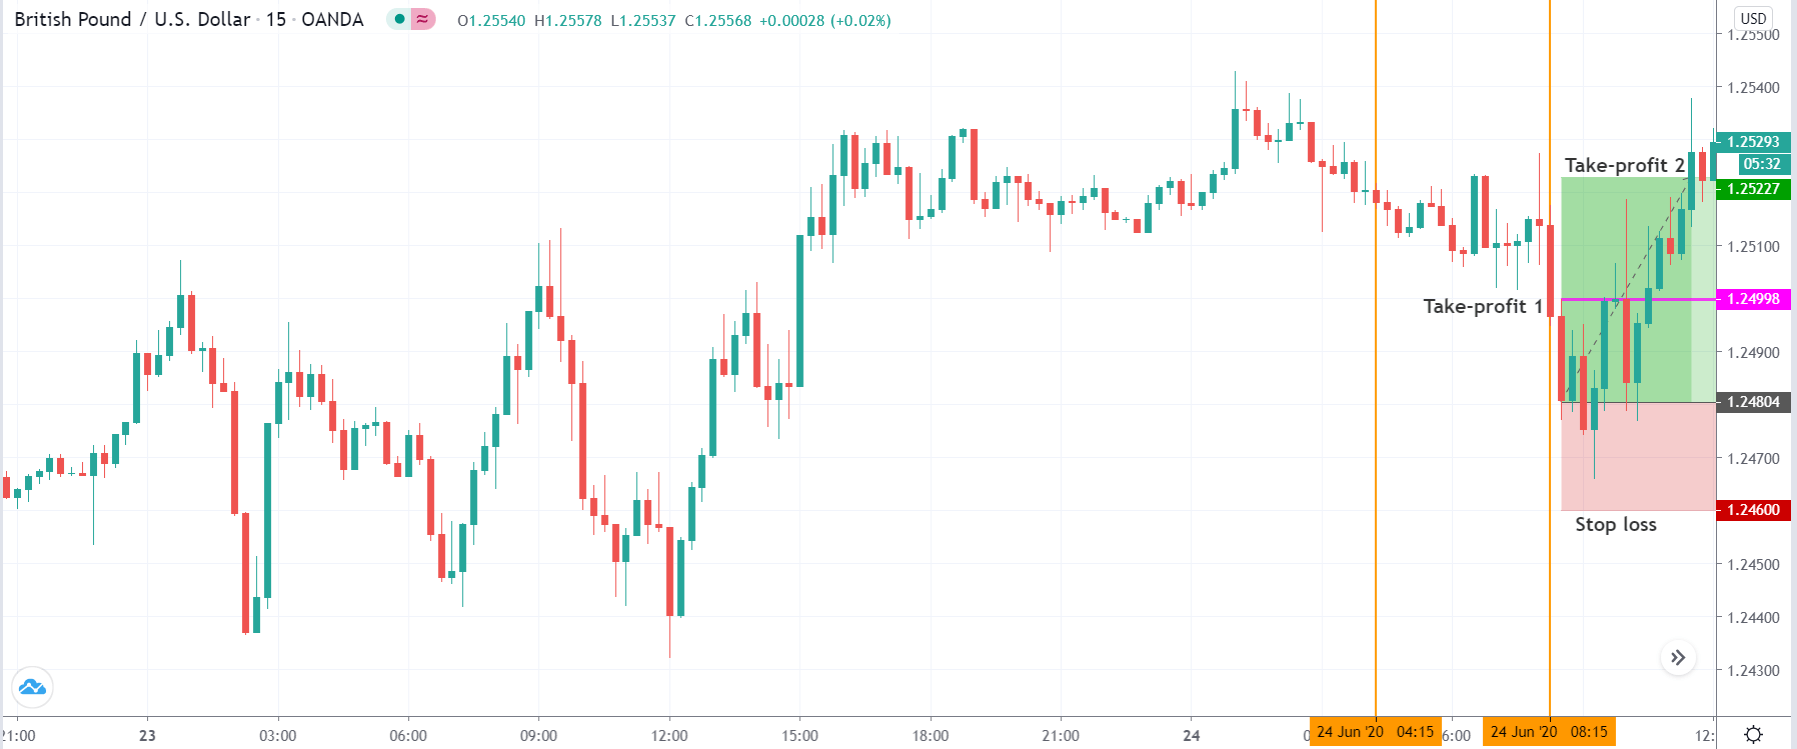
Conversely, you need to be able to stay in those trades that are going your way for as long as possible in order to make sure you are getting as much out of them as you can. This is trade management and it is crucial to your success as a trader.

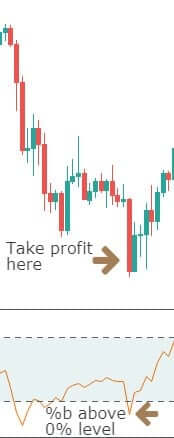
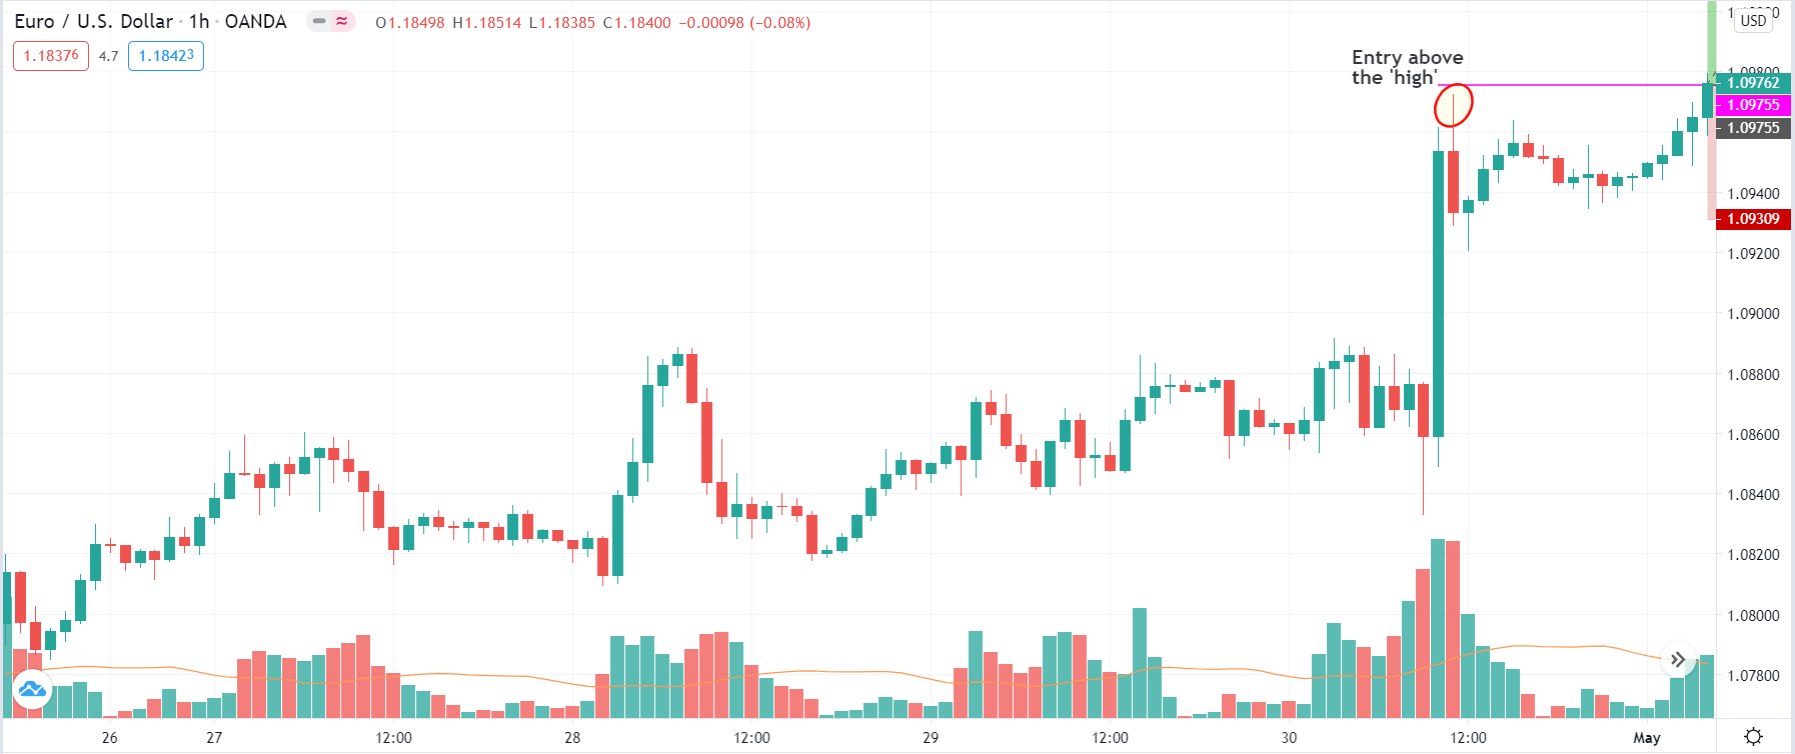
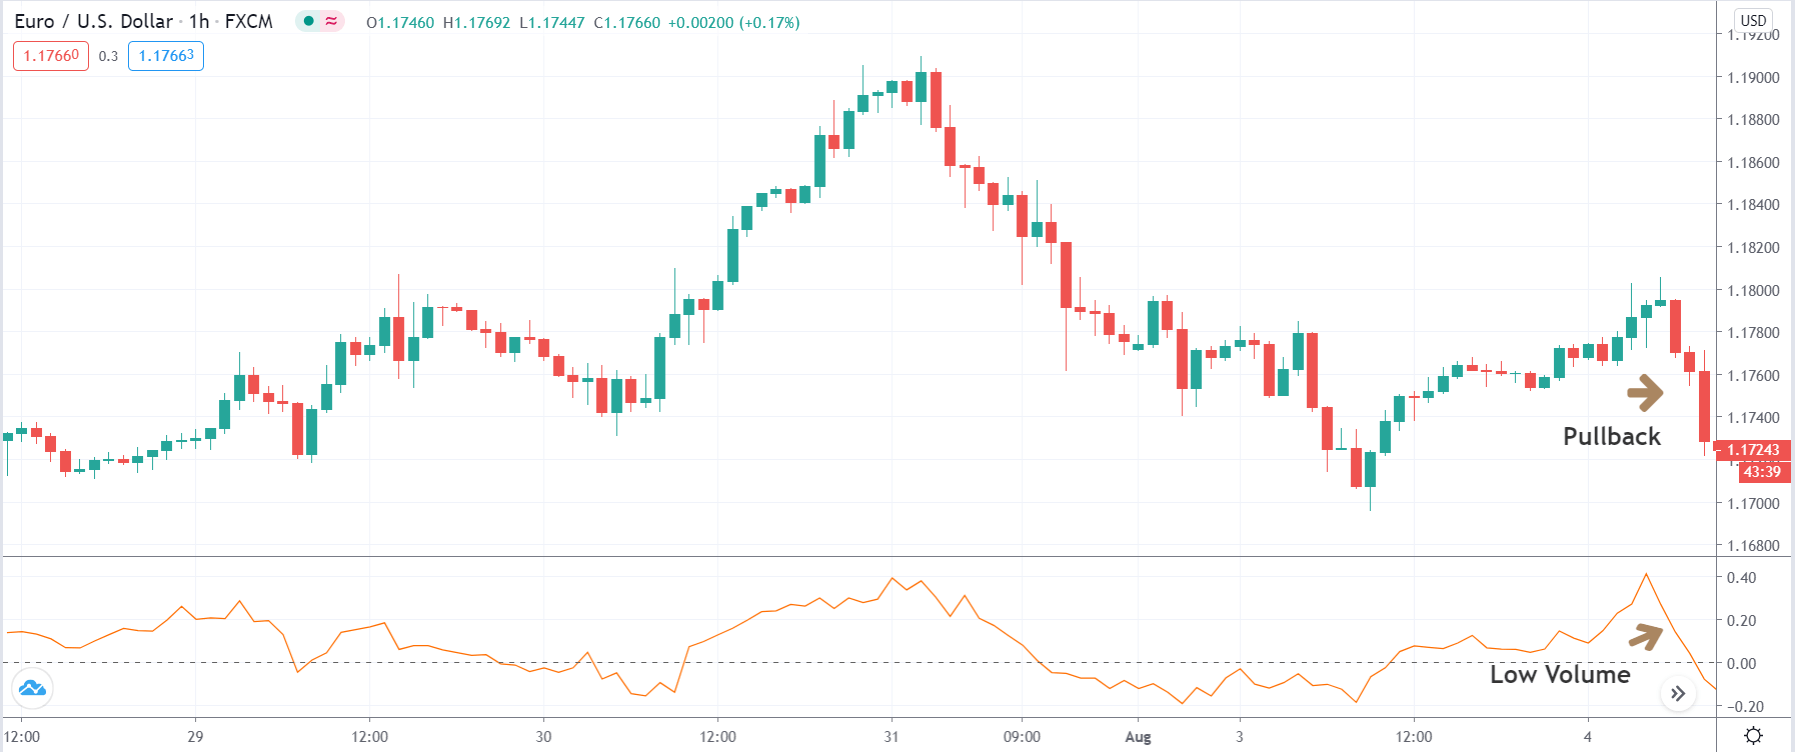
Now, one way people maximize their profit while keeping their losses low is to use an automatic trailing stop that tracks behind the price by a set number of pips. This is a legitimate technique but you should also be aware of its drawbacks. The main one of which is that while the trailing stop will track the price as it trends in one direction, it will never track it in the other, which makes this whole approach vulnerable to pullbacks and could see you knocked out of a trade before it matures.

An alternative approach is to peg your stop/loss to an indicator that is going to see you through to the end of a whole price movement. For example, you could enter a trade and have your stop fixed at X pips from the trade entry point. You would then only move it up once the price has gone up X number of pips so that your new stop is at the break-even point. From here you could peg your stop to the parabolic SAR so that you move it up every time your indicator generates a new dot on your chart. If you’re in a reliable price trend, this method will see you through it to the point at which the SAR hits the price, which is the most likely endpoint for that movement.
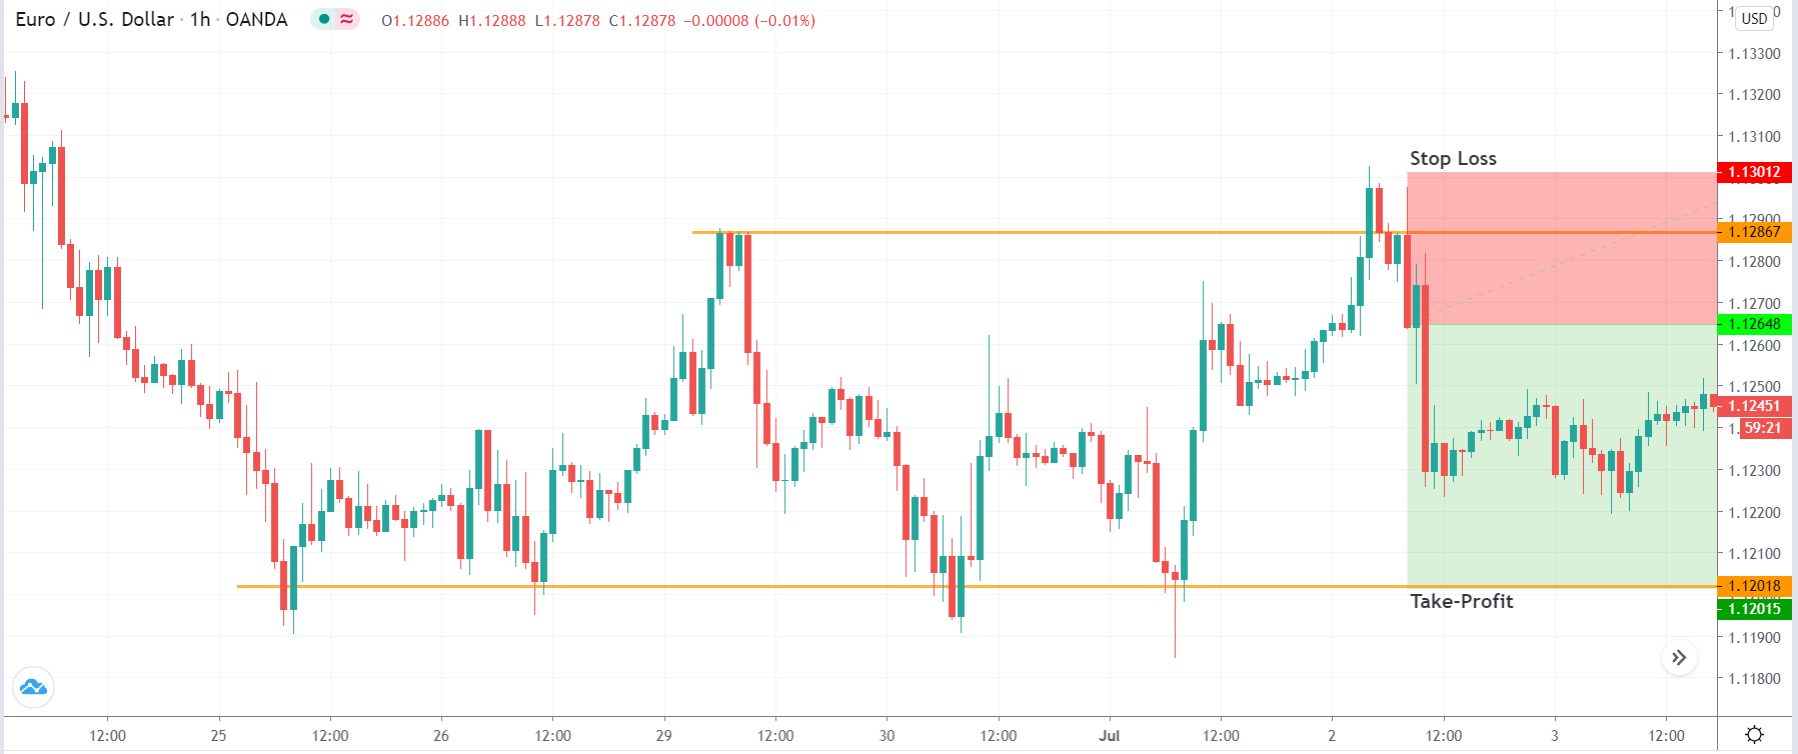
Risk

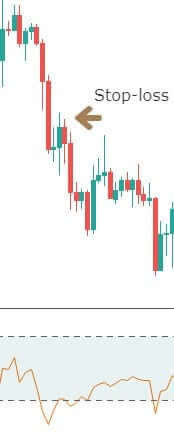
Assessing whether the risk you are taking with a trade against the potential rewards you can reap is the final key component of high-percentage trading. You need to have a definitive plan in place to cut losing trades quickly and for an acceptable loss, while maximizing the profit you take from winners to ensure that your gains outweigh your losses. In short, if the rewards do not justify the risks, don’t trade.

But remember, staying out of those bad trades is just part of the equation. Go back to the ten trades we discussed earlier on in this article. Each time you trade you are only getting into those trades you think will work out for you, where you think you’ve done your homework to the best of your abilities and where you think you did everything right. But, as we know by now, some of them will fail and, going in, you have no idea which ones. So you need to have a plan in place to get your capital out on time and having lost as little of it as possible. 

Position sizing should also be something for which you have worked out and systematized to the point where you have a way of calculating the stake on each trade based on clear and detailed criteria. This is key to managing risk and is going to have an impact not only on each individual trade but on your whole portfolio.

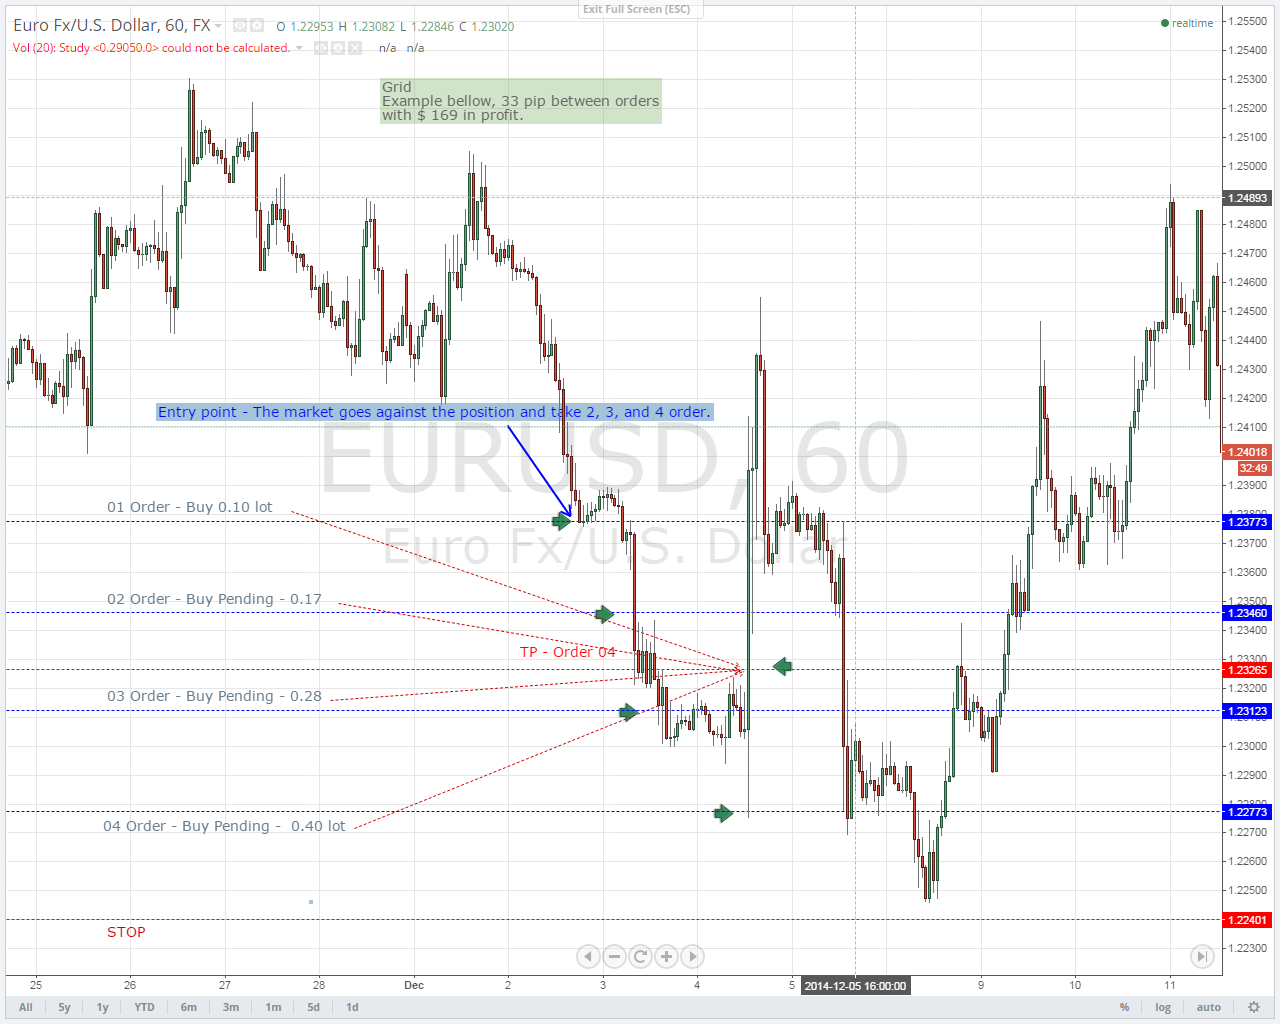
One technique you can introduce to your approach to position sizing is scaling in. This is where you split your trade entry into stages, only committing part of your capital at each stage. Say, for example, you have a trade entry signal on a given currency pair. Rather than committing all of your capital in one go and hoping your stop doesn’t get blown out of the water, you could commit one-third of the amount you intended to risk on this trade and see how it performs. If it performs as predicted, you can then begin committing the remaining two thirds in separate installments. You can even go in with a slightly looser stop/loss order on that initial third, given that you are risking a smaller amount. This gives you a bit more leeway to see how the movement is going to pan out without your stop/loss getting crushed in a nasty pullback.

Whether you choose to scale in your trades or deploy any other position sizing technique, the name of the game here is to make sure you have a deliberate, well-planned approach to managing how you commit capital to your trades. Because risk management is not only about eliminating those trades you do lose, it’s also about making those losses acceptable.

Evolution

So the last thing to say is that you should never rest on your laurels. Yes, all of the components of high-percentage training that we talked about here are supremely important and yes you should incorporate them all into your system if you want to improve your trading outcomes. But even once you’ve done that you can’t expect to just sit back and reap the rewards. You need to use this as a springboard from which you will embark on a journey of constant progress. You will need to focus on your trading system and on yourself because that’s the key to evolving and becoming a better trader in the long-term.

So take this opportunity to build a trading system that incorporates all of the elements that were outlined here, build on it, develop it, research new tools, techniques, and indicators. Test them out individually and test out how they work when integrated into your system as a whole. Make sure that you test the historical validity of your system and all of its components but also plug it into a demo account and take it through a run of forward testing. As well as being the only way to ensure that everything works as you intended it to, testing can also do wonders for your confidence when entering into trades because you can feel that whatever the outcome, you have procedures in place to either minimize the loss or maximize win.

Categories
Forex Basic Strategies

The “Set It and Forget It” Forex Strategy

Is there such a thing as set and forget strategies? We would like to think that there should be some trading strategies that can work this way, but these should be used with caution and minimal understanding of the market, at least. When we talk about such strategies, the first thing you should know immediately is that they are made to be used with small leverage. After all, the last thing you would want is to be leveraged up to 200 times, perform an operation and then withdraw hoping that there will be some sort of backlash against you, as it could be too costly.

In the investment world, a set and forget strategy is the idea that you can buy or sell something and just retire. This is similar to what a trader shareholder does, buying a share in a company like Walmart while assuming that there will be dividends and that the company will continue to exist. There are no worries about a margin call. They simply buy shares and keep them. This is not the same as in the Forex market, as leverage and volatility make long-term retention a much more dangerous idea. Most retail brokers are speculators, so they tend to focus on short-term strategies.

One of the exceptions was the old carry trade, but that strategy no longer exists for the most part because retail brokers have broken the differentials between paired interest rates. Not so long ago people would just buy something like AUD/JPY at the end of the day interest rate, implying that at the end of the day they received very little payment, but much larger funds were getting advantage of this at the same time, raising those pairs. The financial crisis eliminated many accounts while that kind of trade was dismantled. Unfortunately, many retail brokers face margin calls after months and years of reliability.

Investment and Lack of Leverage

One of the questions you should know about setting up and forgetting strategies is that they are more suitable for investors and less suitable for speculators. This doesn’t mean you can’t use it to speculate, it’s just that you need an appropriate amount of capital.

When you make the decision to invest you assume that the price of a financial asset will be valued over the long term. The average investor is not worried about a 1% decrease in the value of an asset he owns. For example, if you bought a share of Microsoft and it lost 1% today you wouldn’t be surprised or worried. You are probably expecting to own such stock for several weeks, perhaps months or years. You know that in the long run, Microsoft will probably appreciate, or at least pay dividends. Maybe I’d have an emergency stop on the market, but that could be 10 or 15% below the current price. This is because you’re only risking 10 or 15% because there’s no leverage.

Reduce Leverage for these Strategies

Just as you wouldn’t use leverage for long-term trading of financial assets, you don’t need to use it in other long-term trading strategies. It’s true that leverage can make you extremely rich, but the most likely thing that could happen is that you would have a pullback that would cause a margin call, or a pullback later that would make you nervous enough to leave the trade, making it impossible to retain in the long run.

A perfect example would be to use the moving stocking crossing system. Although there are shorter-term versions of this, one of the most common ways to trade with this system is to use an exponential moving average of 50 days and one of 200 days. If the 50-day pass above the 200 day pass you must keep the asset in your possession. In the same way, if the 50-day pass below the 200-day, you should sell it. There will be traders in the market any minute, coming and going as moving socks cross each other. We need not say that it needs a trend to make this happen effectively. The side markets are very difficult when it comes to moving average crossing systems.

In the world of Rex, the way to avoid this potential danger is to take a position with little leverage. For example, if you have 1000 dollars in margin, the size of your position could be something like 5000 units. That’s 5-to-1 leverage. We understand that doesn’t sound like much, but it also gives you the ability to stay in that trade for weeks, months, and even years if the system allows it. Beyond that, if you have losses, and you will eventually have them, these will be small.

Another example of a “set and forget strategy” is to use a longer-term Fibonacci backlash based system. In the example below, you can see that we have the same graph that I used for a moving stocking crossing system. This time, you can see there’s a blue arrow in 50% of Fibonacci’s recoil. Most of the time, the longer-term traders will take 50% back from Fibonacci from a high swing as a sign that they must buy, and use the next Fibonacci recoil level, less than 61.8% in this case, as their stop loss. This case ended in a 230 pips stop loss, but you expect the market to return to its higher values at least. That would be a goal of 700 pips. Obviously, this works in the end.

A stop loss of 230 pips frightens many traders but in the end that depends on the size of the position. I guess the biggest lesson of all is that your position really matters. You will not get rich this way, however, you can create your account without stress. With such strategies, it is necessary to review the charts only once a day. Obviously, there are many other strategies but these are two of the most basic and popular.

Alternatives to Leverage

There are a couple of alternatives if you need to use leverage. One, of course, is to resort to the options market. You can go to the options market and sell against the SPY, for example. This shows that you believe the market goes up and automatically creates leverage. In fact, you can buy calls, there are millions of ways to go for options through your broker or your futures platform.

However, if you are selling and buying FX spot, the only way we know how to use leverage and a set and forget strategy, in this case, is to simply put your stop loss and profit target in order and shut down the computer. It’s possible, even if it’s hard. One of my favorite trades was the short sales of the USD/SGD pair. I went on holiday forgetting that I shortened the market, but I had a stop loss put there. When I came back, I had grown 800 pips.

In a way, all trading strategies must be set and forget, for this is stop loss. If you’re very nervous about a position, chances are you have too much leverage. Think of it this way, you’re gonna be a lot more afraid of losing 1000 USD than you are of losing 10 USD.

Categories
Forex Basic Strategies

Turtle Soup +1 Forex Strategy

Important decision-makers are accountable. The decision to conclude a transaction is the trader’s prerogative, which must take into account the behavior of market professionals and crowds. Many players prefer to wait for the end of the trading day. Therefore, traders who use the strategy Turtle Soup have time to think about an exchange with a more balanced approach. An operation is transferred the next day of negotiation and this strategy, which is updated and is called “Turtle Soup+1”.

The creator of the “Turtle Soup+1” strategy is Linda Raschke. She highlighted the following conditions necessary to build a trading system:

– The market falls to a bottom of 20 bars.

– The previous 20-bar background must have formed at least 3 trading sessions before (for the daily chart).

In this scenario, the trader has the opportunity to:

– Place an order pending to be able to buy in the previous minimum level of 20 bars lower on the second day after the formation of a new bottom of 20 bars.

– Place a stop protection order at the new minimum level of 20 bars lower or at the minimum of the next day, depending on which of them is lower.

– Set a portion of the winnings in 2-6 trading days and use a floating stop order to control the rest of the position.

In early May, in the daily chart of USD/JPY appeared the necessary conditions to implement the strategy «Turtle Soup+1»: a minimum of 20 bars were formed and the previous minimum of 20 bars was created 5 days before. A trader waits for the closing and places a pending purchase order the day after the formation of the new minimum of 20 bars. The activation of the pending order allows us to place a stop order at the minimum level minus a few points and observe the market reversal. After 2 days part of the position closes and the market grows 4.5 figures.

Having a reserve time allows the trader to analyze the situation in different periods of time. In the USD/JPY daily chart RSI was moved to the oversold zone, which may be a confirmation signal of a correction or a reversal of a bearish trend.

Everything that is fair to the bearish market in Forex is also applied in a bullish situation. The algorithm for implementing the “Turtle Soup+1” strategy in bullish conditions is as follows:

– The market is growing at a peak of 20 bars.

– The previous peak of 20 bars must have formed at least 3 trading sessions before.

– Place an order pending sale at the previous maximum level of 20 bars on the second day after the formation of a new peak of 20 bars.

– Place a stop protection order at the new maximum level of 20 bars or at the maximum of the next day, depending on which of them is higher.

– To fix a part of the profits occurs in 2-6 trading days.

– A floating stop is used to control the rest of the position.

A good example is a situation that occurred on the USD/CAD chart. The distance between the new and previous maximum of 20 days is 8 bars, the opening of the position is made the day after the formation of the pattern.

By taking time out, a trader can move to a shorter time frame and see a clear divergence MACD, which is an important investment signal in technical analysis.

In my opinion, the strategy “Turtle soup+1” is more interesting than “Turtle Soup”. It does not require an instant reaction and a trader has time to think well about a transaction. On the other hand, a trader always has the possibility of failing a trade while waiting for the second bar to form, which follows the end of 20 days.

Categories
Forex Basic Strategies

Trading Forex Majors and Crosses Using The ‘Awesome’ Strategy

Introduction

The Bollinger Bands is a technical analysis tool that uses a statistical measure of the standard deviation to establish levels of highs and lows in a trend. The upper band shows a level that is statistically high, and the lower band shows a statistically low level. The width correlates to the volatility of the market. This means, in volatile markets, Bollinger bands widen while in less volatile markets, the bands narrow.

In today’s strategy, we utilize this feature of the Bollinger band to anticipate a reversal in the market. But Bollinger bands alone are not sufficient in generating reliable signals. Along with the Bollinger bands, we use the Awesome Oscillator to confirm the reversal of a trend. Let us understand how both indicators can be combined to generate reversal signals.

Time Frame

Time frames suitable for trading this strategy are 1 minute, 5 minutes, and 15 minutes. Therefore, this a perfect strategy for ‘Scalpers.’

Indicators

Three indicators are applied to the chart listed below.

  • Bollinger bands (20,2)
  • Bill Williams’ Awesome Indicator
  • Exponential Moving Average (EMA)

Currency Pairs

The ‘Awesome’ strategy should ideally be traded with major forex currency pairs only. Liquidity and volatility are especially necessary for the strategy to work at its best, which is provided only by major pairs. Some preferred ones are EUR/USD, USD/JPY, AUD/USD, GBP/USD, GBP/JPY, EUR/JPY, CAD/JPY, and NZD/USD.

Strategy Concept

Apart from the Bollinger band, we use the awesome oscillator indicator that attempts to gauge whether bearish or bullish forces are driving the market. It market momentum indicator, which compares recent market movements to historical movements. It uses a line in the center, either side of which price movements are plotted according to a comparison between two different moving averages. We use this awesome oscillator to forecast a shift in market momentum and whether the prevailing trend will continue or reverse.

We look for ‘buy’ opportunities when EMA crosses up through the middle Bollinger band. At the same time, the Awesome Oscillator should be crossing above the zero levels. This is the first part of the reversal. We execute a ‘long’ trade at the ‘test’ of the previous ‘lower high’ that is a part of the earlier trend.

For ‘sell’ trades, we are looking for the opposite conditions of buy trades. The first condition being that the EMA crosses below the middle Bollinger band. At the same time, Awesome Oscillator also crosses below the zero-line. Finally, we enter at the ‘test’ of the ‘higher low’ of the previous trend.

A stop-loss a placed below the lowest point of the downtrend in an upward reversal while it will be above the highest point of the uptrend in a downward reversal.

Trade Setup

In order to execute the strategy, we have considered the 5-minute chart of AUD/USD, where we will be illustrating a ‘long’ trade. Here are the steps to execute the strategy.

Step 1: The first step is to identify the direction of the market. We can do this in two ways. If the price is making higher highs and higher lows, the market is said to be in an uptrend. While if the price is making lower lows and lower highs, the market is in a downtrend. The trend becomes clearer when price moves in a channel and plot the same on the chart.

In the case of AUD/USD, we have identified a downward channel, as shown in the below image.

Step 2: After identifying the direction, we need to wait for a reversal in the market. We can say that a reversal is taking place in the market when price breaks the trendline and starts moving in the same direction. Trendline break is not enough. Here’s where the indicators Bollinger band, EMA, and Awesome Oscillator come handy.

In case of a downtrend, the reversal is confirmed when EMA crosses above the middle line of the Bollinger band, and the Awesome Oscillator moves from negative to positive zone. While in an uptrend, the reversal is confirmed when EMA crosses below the middle line of the Bollinger band and Awesome Oscillator goes below the ‘zero’ level. However, we do not enter the market soon after this, where we need one last thing before that.

The below image shows that when the price is not able to make another ‘lower low,’ it reverses to the upside and breaks out of the channel. At the same, price EMA crosses above the middle line of BB, and Awesome Oscillator becomes ‘positive.’

Step 3: Now, let us discuss how to enter a trade. In a downtrend reversal, we enter the market for a ‘buy’ when the price tests the ‘lower high’ of the earlier trend and puts up a bullish candle. This is when we enter with an appropriate stop-loss and take-profit. Similarly, in an uptrend reversal, we enter for a ‘sell’ when price tests the ‘higher low’ of the previous trend and puts up a bearish candle.

As shown in the below image, we enter ‘long’ only when the price reacts from the ‘lower high’ of the previous downtrend and moves higher.

Step 4: Lastly, we determine the stop-loss and take-profit levels for the strategy. In a ‘buy’ trade, the stop-loss is placed below the lowest point of the previous trend, nothing but the lower low. While in a ‘short’ trade, it is placed at the highest point of the previous trend, nothing but the higher high. The take-profit is set in a manner where the risk-to-reward of the trade is at least 1:1. But since we are trying to grab a major reversal of the market, we move our stop-loss to break even once the market gets closer to the take-profit area.

Strategy Roundup

While it can get take a lot of effort to apply all the rules of strategy, it gets easier after little practice. Pay attention to the Awesome Oscillator, where it clearly indicates the shift in momentum in the market. Aggressive traders can also enter the market without waiting for additional confirmation from the ‘lower high’ or ‘higher low.’ All the best.

Categories
Forex Basic Strategies

A Brand New Forex Trading Strategy By Combining The ‘Flag & Pennant’ Patterns

Introduction

Until now, we discussed a bunch of trading strategies that were based on numerous technical indicators. In today’s article, we discuss a strategy that is based on a candlestick pattern. Flags and Pennants are short-term continuation patterns where the market tends to continue moving in the same direction after the formation of the pattern on the chart. These patterns are found on both short-term and long-term charts.

In the case of Flag, the initial move is a sudden, sharp directional move. It is doesn’t matter where the move is formed on the chart; what matters here is the velocity of the move. If the movement is not sharp and large, the reliability of the pattern will be under question. However, it will also use the volume indicator to confirm the strength of the Flag and pattern. Let us understand all the specifications of the strategy in detail.

Time Frame

As mentioned earlier, the Pennant-Flag strategy can be traded on time frames varying from 15 min to ‘Daily.’

Indicators

The only indicator we will be is the ‘Volume’ indicator. The rest of all is based on candlestick and price action patterns.

Currency Pairs

The strategy can only be used on major currency pairs listed on the broker’s platform. Few preferred pairs are EUR/USD, USD/JPY, GBP/USD, GBP/JPY, EUR/JPY, etc.

Strategy Concept

The strategy is based on the concept of the Pennant Candlestick Pattern. A sharp thrust creates a flagpole, and then when the market begins to consolidate into an asymmetric triangle, we wait for a breakout or breakdown. The consolidation is a brief pause before a potential break on either side. If the price clears the top of the ‘Pennant,’ we look for ‘long’ trades, and if breaks below the bottom of the ‘Pennant,’ we look for ‘short’ trades.

After a large vertical flagpole and a triangular consolidation, the market might be getting ready for a further continuation. The odds of a breakout increase when this pattern is accompanied by high volume. In a bullish flagpole, we place our ‘entry’ order above the ‘high’ of the flagpole, and in a bearish flagpole, we place our order below the ‘low’ of the Flag. Of course, when we enter, we’ll need to place a stop.

The stop is calculated by measuring the number of pips that is equivalent to 35-40 percent of the flagpole. For example, if the height of the flagpole is 100 pips, the stop will be placed 25 beneath the entry point.

Finally, we will need to define exits for our trade. Our first target will be equal to the number of pips that we are risking on the trade. Another strategy is to trail the stop-loss trade and exit when the market shows signs of reversal. Let us look at the specifics of the pattern and technique to make winning trades.

Trade Setup

In order to explain the strategy, we have considered the 4-hour chart of EUR/USD, where we will be illustrating a ‘long’ trade. Here are the steps to execute the strategy.

Step 1: The first step of the strategy is to wait for a sharp, sudden, and strong candle to show up on the chart. This usually happens after a major news announcement or after the release of economic data. This candle should compulsorily be with high volume as it indicates that big players of the market created this move. If the candle is not with high volume, the move cannot be trusted upon. We could use the economic calendar to find out the exact time of news release and the event.

In the below image, we can see a large candle that popped up after a news announcement that took the prices sharply higher.

Step 2: After the sudden move, prices should necessarily move in a triangular pattern, which is shrinking in nature. Few traders also refer to this as ‘squeeze.’ This pattern should be formed on the lower time frame. Market moving in this ‘squeeze’ pattern is very important for the strategy to work at its best. This leads to the formation of a Pennant candlestick pattern. Pennants involve two parts – a vertical flagpole and a triangular consolidation. The consolidation is usually for a shorter duration of time. Once the pattern has been formed along with the necessary conditions, let us see how to enter a trade.

The below image shows the formation of a Pennant candlestick pattern on the 1-hour chart.

Step 3: The rules of ‘entry’ are pretty simple. In a bullish setup, we place a ‘long’ entry order just above the ‘high’ of the ‘flagpole’ candle formed on the higher time frame. In a bearish setup, we place a ‘short’ entry order just below the ‘low’ of the ‘flagpole’ candle. As and when the market continues to move in the direction of the ‘flagpole,’ the order will automatically be executed.

In the case of our EUR/USD example, our ‘buy’ order gets executed as soon as prices start moving higher.

Step 4: Now, let us define the exit rules for the strategy. The stop-loss is calculated by the number of pips equal to 35-40 percent of the ‘flagpole.’ Stop-loss is placed below the entry price equivalent to the pips obtained by calculation. The ‘take-profit’ is set a price where the resultant risk to reward of the trade is 1:1. Therefore, the take-profit is determined by the stop-loss. Another exit strategy is to trail the stop loss and exit after we witness a reversal pattern in the market.

Strategy Concept

The idea behind this technique is not to place most trades but to place the best trades. The most crucial aspect of the trade is the ‘Flagpole’ candle. We need to ensure that this candle is a consequence of a major news announcement and not just a normal candle. Many traders become impatient and enter even though all criteria have not been met. Patience and discipline will help us to avoid falling into this trap and keep us on the course.

Categories
Forex Basic Strategies

Exploring The Forex Market Opportunities With The Help of ‘Volume’

Introduction

In the Forex market, we don’t really have a centralised exchange as we’re trading over the counter. This is the reason why it is so difficult to determine exact trading volumes in Forex. Even though there is no centralised exchange to provide us with the volume data, many forex broker’s and trading platforms keep track of the average volumes in a pair. Each retail broker will have their own aggregate trading volume. Platforms like TradingView also have a volume attached to their chart. We all have realised over time that volume in the forex market is an important indicator, which is the reason why we need the best volume indicator.

The volume indicator used to read the volume in the forex market is the Chaikin Money Flow indicator (CMF.) The CMF was developed by Marc Chaikin, who is a trader himself, and was coached by the most successful institutional investors around the world. The reason Chaikin Money Flow (CMF) the best volume indicator is that is measures institutional accumulation and distribution.

Normally, on a rally, the Chaikin volume indicator should be below zero. Conversely, on sell-offs, the indicator should be below the ‘zero’ line.

Time Frame

The strategy works well on the 1-hour and 4-hour time frame only. Therefore, we can say that it is a swing trading strategy and is not suitable for trading intraday.

Indicators

We will be using just one indicator in this strategy, and that is the Chaikin Money Flow indicator (CMF.) The rest all is based on price action.

Currency Pairs

The strategy is suitable for trading in almost all currency pairs that are listed on the broker’s platform. But we need to make sure that the forex pair has enough trading volume.

Strategy Concept

Volume trading requires us to pay careful attention to the forces of demand and supply. Volume traders look for instances of increased buying or selling orders. They also pay attention to the current price movement and trend of the market. Generally, increased trading volume leans towards heavy buy orders. These positive volume trends will prompt us to open new positions on the ‘long’ side of the market, depending on the price action.

On the other hand, if trading volumes and cash flow decrease—it indicates a “bearish divergence. This may be appropriate to sell. We will pay attention to the relative volume—regardless of the number of transactions occurring in a trading period. By learning how to use the Chaikin money flow and other relevant indicators, we will be able to identify whether to ‘buy’ or ‘sell.’

With practice, the volume trading strategy can yield a win rate of 75%!

Trade Setup

In order to explain the strategy, we have considered the chart of EUR/USD, where we will be illustrating a ‘long’ trade using the rules of the strategy.

Step 1

Firstly, look for a price reversal in the market or a price action that reverses an established downtrend or uptrend. This is an easy and simple step that requires us to have a basic understanding of price reversal. This reversal should be accompanied by the rising Chaikin volume indicator that shoots up in a straight line from below zero to above the ‘zero’ line, during the reversal of a downtrend. In an uptrend, the slope should be downwards, i.e., from positive to negative.

When the volume indicator goes negative to positive in a strong fashion, it shows an accumulation of smart money.

Step 2

Wait for the price to pullback near the previous lower low after an upward reversal. Likewise, wait for the price to pullback near the previous higher high. The Volume Indicator should also pullback in a similar manner. If the pullback is coming in slowly, the trade has a higher probability of performing. If the pullback is strong, we will exercise some caution.

When the volume indicator is decreasing and drops below zero, we have to make sure that the price remains above the swing low. If the market is satisfying all the conditions of the strategy until now, we can move on to the next step.

Step 3

Wait for the Chaikin volume indicator to break back above the zero lines. We enter for a ‘buy’ once a ‘higher low’ is confirmed, and the price starts moving in the direction of the reversal. In a reversal of an uptrend, the Chaikin indicator should break below the ‘zero’ line. We enter for a ‘sell’ once a ‘lower high’ is confirmed, and the price starts moving lower. Once the institutional money comes back in the market, we wait for them to step back and drive the market.

The below image shows a ‘higher low’ being formed along with the volume breakout.

Step 4

This brings us to the next important step, where we establish protective stop-loss and take-profit for the strategy. We place stop-loss below the ‘higher low’ that confirmed the reversal when ‘long’ in the pair and above the ‘lower high ‘when ‘short’ in the currency pair. This strategy indicates a strong reversal in the market that will change the trend of the market. This is why we set our ‘take-profit’ at the origin of the previous trend.

In our example, the risk-to-reward of the trade was over 1:2, which is great.

Strategy Roundup

The volume trading strategy will continue to work in the future; it is based on the activities of the smart money. Even though they hide all their operations, their footprints are still visible. We can read those marks by using proper tools. The Chaikin indicator will add value to our trading because it gives a window into the volume activity the same way we traded the stocks. Make sure to follow this step-by-step guide to trade properly using volume.

Categories
Beginners Forex Education Forex Basic Strategies

Five Fundamentals of a Good Trading Strategy

One of the most important things that a trader needs in order to be successful is a good trading strategy. This is one of the first things you need to figure out as a forex trader because it is crucial to have a plan outlined so that you know how you want to trade and what your goals are. There are a lot of different strategies out there, some focus on day trading, while others pay more attention to risk-management, making smaller profits that add up, and so on. No matter which strategy you choose, there are 5 important elements that your chosen strategy needs to incorporate. 

Time Management

You need to invest some time into trading if you want to be successful. This doesn’t mean that you have to quit your job and devote all your time to trading, but you do need to make sure that you have enough extra time to take trading up. Once you’ve figured out how much time you have to trade, you’ll want to find a strategy that you can maintain. If a strategy requires multiple hours a day sitting in front of your computer but you can only trade in shorter intervals, then it won’t work for you. 

Risk-Management

You’ll need to decide how much you’re willing to risk on each trade before choosing a strategy. The truth is that most experts don’t recommend risking more than 1% of your account balance on any one trade. This can account for slower profits but will ensure that it does not break you if you make a bad move. Trust us, we’ve heard stories about big-league traders losing $25,000 or more on one trade thanks to a lack of these precautions. On the other hand, some traders prefer taking more risks with the chance of making a bigger profit. We’d recommend sticking with the expert’s recommendation if you’re a beginner or don’t have a lot of money invested just yet. Of course, what you’re willing to risk is up to you and you need a strategy that follows those guidelines. 

Making Money

Your trading strategy obviously needs to be profitable with the goal of making money (while minimizing your risk). Of course, your strategy needs to outline some type of plan to bring in the money. What does the strategy consider? Is it based on trends, making small profits through multiple trades, or something else? You should believe in the things that your strategy is based on. 

Easy to Follow

This doesn’t mean that your strategy needs to be simple, only that it needs to be easy to follow from your own perspective. If a strategy confuses you, then you’re going to have a hard time following it correctly. If you try your best to understand a more complex strategy but can’t figure out all the little details, you should try moving on to something else. Remember that a complicated strategy is not necessarily better than a simple one. 

Works with your Broker

Some strategies won’t work with your chosen broker or trading platform. For example, some brokers or platforms do not allow scalping, which means that scalpers can’t use their strategy on those platforms. If you already have a broker, you should check out their terms and conditions so that you know what is and isn’t allowed before choosing a strategy. 


Categories
Beginners Forex Education Forex Basic Strategies

Signs That Your Trading Strategy Isn’t Working

There are thousands of strategies out there, and we mean thousands, all sorts of things are available, you will also get people claiming that their strategy is making them $11 to $500 per day, or they are making 10,000 pips per month, these are huge results and very tempting, but you also need to ask yourself does it sound legitimate? These people claim to have the ultimate strategy, well they can’t all have the ultimate strategy now, can they?

Instead of looking towards them or even using them as a comparison, it is important that you create a strategy that works for you, build it from the ground up in a way that suits your strengths and weaknesses, and also your style of trading. Having done all that, you will be good to go and will be profitable right? Well, not exactly, even with a strategy that you created yourself, there will be flaws in it, in fact, many people who have now found their preferred and most successful strategies would have been through another 10 before that which didn’t turn out quite so well.

So once you have gotten your strategy set up, what sort of things would make you give it up and start again? That is what we will be looking at now.

You’re Spending More than Your Earning

We will get this one out the way first, this is more for those that purchase signals or Expert Advisors (EAs), are they actually making you any money? If you rent an EA for $200 per month and it earns you $150 per month on your account, do you think it is worth it? You are making a net loss of $50, so why are you still suing it? Why would you purchase something that actually makes you a loss? Get rid of it and start looking at your own strategy, a hopefully profitable strategy.

It’s Not Profitable

Keeping along the same lines as the previous point, some strategies just aren’t profitable, you can have a successful strategy that doesn’t actually make you any money, strange I know, but possible. This is often down to bad take profit and stop loss levels and risk management, risking too much per trade can actually give you more wins than losses but the monetary value of the losses is higher than the wins. If this is the case, then it is time to evaluate the strategy to look for an entirely new one to build.

It’s Hard to Stick to the Rules

When setting up a new trading strategy, it should come with some rules, these are there for a reason and they are often the reason that the strategy works. They help to improve consistency and overall profitability. So if you have a strategy that seems to be working, but you are finding it hard to stick to the trading rules set by it, then, in the long run, there is a good chance that you could start to incur losses. It is actually impossible to wor out the profitability of a strategy if you are constantly making changes and breaking the rules, so if you are not able to, it would be a good idea to try and create one that you are able to follow.

The Strategy Takes too Much Effort

When you create a strategy, you also need to take you into account, these are things like the time you are free to trade, your sleeping patterns and so forth, if you like in Europe, there is no point in creating a strategy that requires you to be awake during the Asian markets, otherwise you will be up the entire night. Do you need to look at 108 different indicators in order to find the right signal, well that isn’t maintainable, you need to set up a system that you will be able to use without too much effort, and certainly without causing sleep deprivation.

All of the points above are reasons why you may need to give up your strategy, remember that trading forex should not be a chore, it should be a learning and enjoyable experience, if your strategy is turning that into work or causing frustration then it may be time to start looking for a new one.

Categories
Beginners Forex Education Forex Basic Strategies

The Strangest Forex Trading Strategies

You often see the same strategies being mentioned over and over, there are a few different ones that a lot of people use, or at least different variations of very similar ones. However, every now and then you come across a strategy that people are using which do not actually make any sense, more often than not there is a form of gambling involved, but those people are convinced that their strategy works and so they continue working with it.

We are now taking a look at a number of different strange yet very real strategies that people have been using to trade on the markets.

Allowing your pet to trade: This is a weird one and certainly goes into the realms of gambling. You probably see during most major sporting events, they will put food in two bowls to predict the result, whichever the bowl that the pet eats out of is the predicted winner. Some people have taken this into the trading world and put two bowls down, one with a buy and one with a sell, then let your pet decide. Now unless your pet is actually psychic, this method of choosing trades is certainly not a realistically long term process. It is all a gamble and not something that we could recommend, it could work for a few trades, but certainly won’t in the long run.

Use sports to trade: Sports trading is big business, but we aren’t talking about that, we are talking about people who use sport to work out what they’re going to trade on the markets. This can be a single match or an overall tournament, normally people will look at the super bowl or the world cup final, whichever team wins or scores next will determine the direction of the trade. Not the most scientific approach and certainly not a reliable one, yet it is something that a lot of people do, mainly for fun I am sure, but there is a good chance that one could go the wrong way. I am sure that you can see that there really isn’t a correlation between sport and trading in this sense.

Trading based on the weather: What could be easier than getting up in the morning, looking outside, and knowing exactly what the markets are going to do. Well, that is exactly what some people are doing, they are simply opening the blinds and trading based on the weather. If it is sunny, it will probably go up, if it’s rainy, most likely down, seems logical right? Well apart from the fact that the weather does nothing to the markets. It may change your outlook or your mood, but it certainly does not change the markets.

Trading based on the seasons: Pretty similar to the weather, but slightly easier to work out what the direction of the trade should be. This isn’t necessarily about deciding whether you go long or short, it is more based around the idea that certain investments are better in the colder months and others in the warmer ones. Strategies surrounding this can involve things like trading riskier investments and currencies from November to March before then switching to slightly less risky investments for the rest of the year.

Coin flip: You need to love to gamble on this one, it is not really a strategy when you think about it, it is more of a 50/50 gamble, flip a coin, heads go up, tails go down, simple really.

Home run: The riskiest of all strategies, you are simply going for a home run with every trade, if it is pulled off then you pretty much double your account, couple home runs in a row and you are laughing to the bank. However, unlike baseball, it is one strike and you are out. You need to be able to massively over leverage the account as well as risk the entire thing on a single trade, putting in a trade size larger than usual. Not the best strategy at all, but if you have $10 you don’t mind gambling, it could be fun.

So those are a few of the weirder strategies that people have been known to use. They aren’t ones that are going to make you rich, heck they probably won’t get you many wins compared to losses, but for a bit of fun, they could be worth a shot, of course, maybe use them on a demo account instead of on your actual account.

Categories
Forex Basic Strategies

Everything About The ‘RSI Rollercoaster’ Forex Trading Strategy

Introduction

Sometimes it is best to choose the simplest path of trading. The Relative Strength Index (RSI), invented by Welles Wilder, is one of the oldest and most popular technical analysis tools. If best traders in the world were asked to rank the technical indicators, RSI would certainly be accorded in the top five. It has the unique ability to measure turns in price by measuring the momentum of the turn, which is impossible by any other technical tool in technical analysis.

The standard RSI setting of 70 and 30 serves as a clear sign of overbought and oversold, respectively. The RSI rollercoaster is a strategy that we have developed to take advantage of these turns in the market. The purpose of RSI rollercoaster is to make money from range-bound currency pairs.

Time Frame

This strategy is suitable for trading on the ‘daily’ time frame. It can also be used on the smaller time frames, but the success rate is not very encouraging.

Indicators

As the name suggests, we will be using the RSI indicator for the strategy. No other indicators will be used. Sime knowledge of price action will be helpful.

Currency Pairs

This strategy applies to all the currency pairs listed on the broker’s platform. If trading on the lower time frame, we need to look for highly liquid currency pairs.

Strategy Concept

The key to the RSI rollercoaster strategy versus the traditional RSI strategy is the way of trading the overbought and oversold levels. Here we look for a reversal candle, which provides a sign of exhaustion before taking the trade. This way, we prevent ourselves from picking the top or bottom of a ‘range’ by waiting for an indicator confirmation.

This strategy works best in a ‘ranging’ market where overbought and oversold signals are far more true indications of change in direction. Furthermore, from experience, we have observed that the setup is much more accurate on the ‘daily’ charts than on the smaller time frames such as the 4 hours or 1 hour.

The primary reason for this difference is that ‘daily’ charts include far more data points into their subset and, therefore, change in momentum tends to be more meaningful on longer time frames. Nevertheless, the disproportionate risk to reward ratio in this setup makes even the shorter time frame trades worth considering. We keep in mind that although the setup will fail more frequently on the shorter time frames, the losses will generally be smaller, keeping the overall risk manageable.

Trade Setup

In order to explain the strategy, we have considered an example of such a trade that was carried out on the USD/CAD pair. As the strategy produces a better result on the ‘daily’ time frame, we will be applying it to the ‘daily’ time frame chart. Let us see the steps to execute the strategy.

Step 1

The first step of the strategy is to open the ‘daily’ (preferable) time frame chart of the desired currency pair. Identify key levels of ‘support’ and ‘resistance.’ A ‘support’ or ‘resistance’ is only valid if the price has reacted off from this area at least twice. If the price has reacted only once, that means a ‘range’ has not yet been established.

The below image shows the clear formation of a ‘range’ where the price has reacted multiple times from the ‘ends.’

Step 2

In this step, we wait for the RSI indicator to cross above the 70 ‘mark ‘when the price is near ‘resistance’ or cross below the 30 marks when the price is near ‘support.’ During this time, the price action of the chart is not of much importance. Once the RSI shows a reading below 70 after crossing it, we will look for ‘sell’ opportunities depending on the price action. Similarly, when the RSI shows a reading above 30 after crossing below it, we will look for ‘buy’ opportunities depending on the price action.

In this case, we can see that the price breaks down below ‘support,’ which is an indication of ‘sell’ as per the theory of support and resistance. But as per our strategy, we will not be looking at the price action in this step, and we will focus only on the RSI indicator.

A few days later, we see that the RSI goes below the 30 ‘mark’ for a moment and starts moving higher. This is our first indication of going ‘long’ in the market.

Step 3

We ‘enter’ for a ‘sell’ when the price moves back into the ‘range’ after the indication from RSI. Similarly, we enter for a ‘buy’ when the price moves back into the ‘range’ after the indication from RSI. This price action indicates a false breakout or breakdown, which is identified rightly with the help of an indicator.

In our case, we are entering ‘long’ in the currency pair after we get a confirmation in the form of a bullish candle, as we can see in the below image.

Step 4

In this step, we determine the ‘stop-loss’ and ‘take-profit‘ levels for the strategy. When executing a ‘long’ trade, the stop-loss will be placed just above the ‘high’ where the price created a false breakout. And when executing a ‘sell’ trade, the ‘stop-loss’ will be placed just below the ‘low’ from where the price created a false breakdown. The ‘take-profit’ depends on the major trend of the market. If we are trading against the trend, it should be kept at 1:1 risk to reward or even a little lesser than that. If the ‘trade’ is taking place with the trend, it can be kept at 1:2 risk to reward.

Strategy Roundup

The RSI rollercoaster strategy is designed to squeeze as much profit as possible out of the turns at ‘support’ and ‘resistance.’ Instead of immediately entering into a position when the market moves into an overbought or oversold zone, the RSI, along with a little bit of price action, keeps us away from the market until we get a confirmation sign of the exhaustion. The RSI rollercoaster is almost always in the market, as long as we see wild moves on either side of the ‘range’ to stop-out traders.

Categories
Forex Basic Strategies

Trading ‘Cable’ Using The ‘English Breakfast Tea Strategy’

Introduction

When traders deal with a particular currency pair for a long time, they start to observe certain characteristics and behavior of that currency pair. Such common behavior could be observed during market opening hours, closing hours, or major news releases. Traders may notice common behavior before and after the holiday season, such as Christmas or New Year.

Day traders enjoy the volatility of the market opening. This could be either Tokyo open, London open, or New York open. Some traders are familiar are with the pattern developed during the Tokyo open while some are comfortable trading the New York open. While some traders like to trade when the market is not extremely volatile, they prefer to trade when the market is quiet and less volatile.

The strategy we will be discussing today is based on the peculiar behavior observed in the GBP/USD currency pair. This behavior is mostly observed during the London opening hours.

Time Frame

The English breakfast tea method works well on the 15-minutes time frame. This means each candle represents 15 minutes of price movement.

Indicators

This strategy is based on pure price action; hence we will not be using any indicators.

Currency Pairs

This strategy applies only to the GBP/USD currency pair.

Strategy Concept

The pattern is observed in GBP/USD before, and after the London market opens in the morning, we have named this strategy an ‘English breakfast tea strategy.’

We have observed that when GBP/USD trends in one direction from 04:15 hours to 8:30 hours London time, it tends to move in the other direction after 8:30 hours. We now compare the closing price of the 15-minute candle that corresponds to 04:15 AM and 08:15 AM London time to determine the direction of the GBP/USD. We then enter the market in the opposite direction at 08:30 AM London time.

For example, if the closing price of the 15-minutes candle at 08:15 hours is lower than the closing price at 04:15 hours, we go long at 08:30 hours. If the closing price of the 15-minutes candle at 08:15 hours is higher than the closing price at 04:15 hours, we go ‘short’ at 08:30 hours.

The stop-loss for the strategy is fixed at 20-30 pips depending on the point of entry on the chart and risk appetite. There are two profit targets for the strategy with risk to reward ratios of 1:1 and 1:2. In other words, the ‘take-profit‘ would be at around 30 pips and 60 pips, respectively.

Trade Setup

Since this strategy is based on the London time zone, we need to make sure that we change the trading platform’s time zone to ‘London.’ If this is not possible, we should know London’s corresponding time opening with respect to our time zone. Let us see the steps required to execute the strategy.

Step 1

In the first step, we mark 04:15 hours and 8:15 hours London time on the chart. Then we look at the difference between the two candles. If the closing price of 8:15 hours is lower than the closing price of 04:15 hours, we then look for buying GBP/USD. On the other hand, if the closing price of 8:15 hours’ candle is higher than the closing price of 04:15 hours’ candle, we will for ‘short’ trades in the currency pair.

In the following example, we see that the market moves lower between 04:15 hours and 8:15 hours London time. The closing price of the latter is below the former. Therefore, we will take a ‘long’ position by executing further steps.

Step 2

In this step, we examine the ‘entry’ part of the strategy. ‘Entry’ is the simplest part of the strategy where we enter the market at the close of the 08:30 hours’ candle. If the difference between the two candles marked in the previous step is negative, we enter for a ‘buy’ at the subsequent candle. If the difference between the two candles is positive, we enter for a ‘sell’ at the subsequent candle.

We can see in the below image that the subsequent candle dropped significantly lower. As per our strategy, we will take a ‘long’ trade at the close of this candle. Let us see what happens later.

Step 3

In this step, we determine the stop-loss and profit targets for the strategy. The stop loss is usually set at 20-30 pips depending on the risk appetite of the trader. However, a technical approach for setting the stop loss is that, if the trade is taking place in the direction of the major trend of the market, we keep a small stop loss. If the trade is taking place against the major trend of the market, we opt for a larger stop loss. The first profit target is at 1:1 risk to reward, and the second one is set at 1:2 risk to reward. If we are trading against the trend, the first ‘take-profit’ ensures that we don’t lose any money even if the market turns around mid-way.

In the below image, we can see that the price hits our final ‘take-profit’ after taking an entry at the close of the red candle. Since the market was in an uptrend, we kept a small stop loss.

Strategy Roundup

This strategy is based on a fixed time period, i.e., during the market opening hours. The rules are simple and specific. Any trader can try out this strategy to benefit from the volatility associated with the market opening. However, the currency pairs will change for other market openings. Since we are not giving much importance to the market trend, we might have some losing trades in the beginning until we become expert in the strategy.

Categories
Crypto Daily Topic

Algorithmic Trading Strategies Explained

Algorithmic trading is an advanced form of trading that uses a computer program to automate the process of buying and selling of either stocks, cryptocurrencies, FX currency pairs, options, or futures. Unlike trading assets directly through a broker, algorithm trading is more accurate and result-oriented as it is designed with a predefined set of instructions that guide it on how to execute trades.

The trades are executed at the exact price and trade volume. This helps eliminate the time lag between placing and execution of the order. Also, all trades are free from human emotions, which may otherwise make a trader give up on profitable trade due to fear or make losses in pursuit of profits. Although the trades are executed automatically, the algorithms used have to be generated by traders in line with their investment goals. The traders key in variables like price, volume, time, and other indicators, which trigger a buy or sell order when specific conditions are met. 

Common Algorithm Trading Strategies 

Here are some of the most used automated trading strategies that you can explore: 

#1 Momentum-based/ trend algo 

Momentum and trend is the simplest algorithm trading strategy that aims at capitalizing on a long-running market trend. The idea is that if the market has been moving in one specific direction, upwards or downward, it’ll continue to do so until it’s affected by opposing factors that change its trajectory. A simple momentum-based algorithm, for instance, will invest in the best performing indices based on their performance within a specific duration of time. A more complex strategy blends momentum over time, making use of both absolute and relative momentum indicators. For instance, when the 30-day moving average goes above the 80-day moving average, a buying order is executed; conversely, when the 30-day moving average goes below the 180-day moving average, then a selling order is executed. 

As such, momentum algo trading makes use of technical indicators such as the historical price data and trading volume to execute orders. Further, the strategy allows traders to rebalance the system on a weekly, monthly, quarterly, or even yearly basis. 

#2 Statistical Arbitrage trading 

Statistical arbitrage is an opportunistic trading algorithm strategy that capitalizes on the price differences of assets as listed on various exchanges or markets. For instance, say a security trades at $10 on exchange Y and goes for $9.86 per share on exchange Z. The algorithm will identify this price difference and take a long position of the security in exchange Z, then quickly takes a short position of the same amount of the security on exchange Y. 

To realize reasonable profits using this trading strategy, you need to execute high trade volumes frequently since the price differences are almost negligible. However, for the cryptocurrency market, the price differences can be significant due to the difference in demand for crypto within a specific geographical location. For instance, you can buy low-priced crypto from your local exchange and sell it in an overseas exchange where the demand is higher. 

#3 Mean reversion 

Mean reversion strategy can be used in conjunction with the momentum/trend algorithm to avert losses when the market trends change drastically. Here’s how – while momentum strategy assumes that an asset’s price will continue moving in the same trajectory as it’s currently trending, mean reversion, on the other hand, works under the principle that an asset will always return to its mean value at some point in time regardless of its current high or low trend. The idea here is that the price of an asset will always go back to its historical average price after extreme deviations. Often, these deviations are caused by overselling or overbuying of the subject asset, influencing its price movement.  

When using the mean reversion strategy, the algorithm seeks to identify the upper and lower price limits of an asset. When the price is below the lower limit, the algorithm takes a long position and sells when the price goes above the higher limit in anticipation of the price returning to its average value. 

#4 Weighted average price strategy 

In this strategy, large orders are executed based on either volume-weighted average price or time-weighted average price. The strategy can be executed manually, but the large orders have to be released in small parts, which cannot be humanly possible with as much efficiency and accuracy as that of an algorithm. Besides, to make above-average profits, the orders have to be executed as close as possible to the volume-weighted average price or time-weighted average price to reduce the impact on the market. 

#5 Sentiment analysis 

Sentiment algorithm trading is quite simple as it doesn’t rely on complex mathematical models to execute orders. It involves examining the general market movements based on the opinions of major stakeholders and traders’ behavior. As such, the algorithm analyzes all types of data from media reports, to social media, to earning reports – and uses this information to predict future price movements upon which orders will be executed. 

#6 Building a custom algorithm trading strategy 

There are various websites such as CryptoHopper and Bitsgap that offer a variety of trading algorithms which you can then connect to the exchange site of your choice. But, you still have an option to design a unique trading strategy, one that works with your understanding of the market and investment goals. To build an algorithm trading strategy, you need to have proficient programming skills in addition to a good understanding of the quantitative and fundamental analysis of the market. 

Once you have these skills, all you have to do is feed your code input variables such as price, trade volume, and other variances that will trigger the execution of orders. Note that, before using your strategy to trade on the real market, you need to run a backtesting program that involves testing the performance of the strategy using historical data. If the strategy brings good results, you can confidently use it to trade in the real market. 

Conclusion 

Algorithm trading strategies are ideal for both novice investors and traders who are yet to understand the factors influencing market movements. Even the experienced traders can also benefit from the accuracy and efficiency of algorithm trading strategies, which ensures that they don’t miss out on any trading opportunity. However, it is vital to understand that each strategy works differently, and therefore it’s advised to choose one that meets your investment goals. 

Categories
Forex Basic Strategies

FX Trading Strategies To Avoid: Grid Strategies

There are thousands of different strategies, some are fantastic and work for most trading conditions, some work really well during specific trading conditions, some work with some of the time, some most of the time. Some are safe and some are a little bit riskier, we are going to be looking at one of those slightly more risky ones, in fact, it is one of the riskiest ones. It is known as a grid strategy and it works much as the name suggests, so let’s take a look at what this strategy involves and why it is so risky.

There are a lot of different variations of the grid strategy, but before we look at any of them we need to outline what a grid-based strategy actually is. To put it into simple tmr,s if you look at the charts, you will see a grid on the background, this is similar to how you need to imaging the strategy, there are vertical lines going up the screen at fixed intervals, lets for the examples state say that the grid lines are 25 pips apart. A trade is opened if it goes the right way, it is done and profits can be taken.

However, if it goes the wrong way, when it gets to negative 25 pips, you will open up another trade going the same direction as the original, if it then moves another 25 pips to a total of 50 pips negative, you will open a third, this will continue until the markets reverse and the trades can all be closed at the same time for an overall profit.

So you can see how it can be a little risky if the markets continue to move against you, there is a very good chance that you will continue to open up new positions until you get a market call and the broker protects itself and you by closing out your trades. That is the barebones basics of how the strategy works, there are of course a lot of different variations of it. Some make it safer, some riskier and some just make it go a little crazy, but whichever version people use, it will have a lot of risks attached to it and so this strategy remains very risky and is one of the most dangerous ones to use due to its lack of basic risk management.

Now let’s take a look at what some of these variations of the strategy involve:

Grid + Martingale

The martingale strategy is another strategy that you may have heard of and is another sky one, so you can imagine that combining it with the grid strategy, which is an already risky strategy could be making things a little worse.

This strategy works much the same way as the standard grid strategy does, its main difference is that when more than one trade is opened due to the markets going the wrong way, each subsequent trade is opened at a larger size. What size that depends on the trader using the strategy, some people use double the lot size, some people increase it by just a specific amount each time. Other than that, it works exactly the same way, at a set interval the new trade will be opened.

As the lot sizes are now increasing it will make a couple of differences, the first is that the drawdown that the account experiences will be a quite a bit higher than the standard version, the other differences is that if the markets do decide to change and reverse, you will be able to get out of the trades in profit from a much smaller move. So there is a positive and a negative, but overall this version of the grid strategy offers a lot higher risk to the standard one, which we will remind you that it was already quite risky to begin with.

Extending Grid

As this is a grid-based strategy, it works in a similar fashion once again, as the markets go against you, new trades will be open dup at set intervals the main difference for this version is that the grid expands as it gets large, so the first trade will open after 25 pips, the second would be after 75 pips and the third would be after 150 pips, so as you can see, the gap between each trade is getting larger, this helps to slow down the speed that the drawdown will be increasing. This version of the grid helps to reduce some of the risks that come with the strategy, but this does not make it a riskless strategy, it still involves a lot of risks.

Increasing or Decreasing Sizes

Another variation of the strategy takes a different approach to the lot and trade sizes rather than the size of the actual grid. There are two different variations within it, one where the trade size decreases with each trade and another when it increases, we have already mentioned the increasing version in the form of the martingale variation, so the other one is the decreasing size. This is where each trade is opened at a slightly smaller trade size, this is done to try and reduce the speed that the drawdown increases while still allowing you to open up additional positions. This is a version that is far less performed due to the larger reversal required but it does have the benefit of not risking as much of your account as quickly as the other versions do.

Those are a few of the different styles of the grid strategy, there are of course additional variations that people use, what is important to note is that they do not change the actual mechanics and ideas behind the strategy, so we know what some of the versions are, but in what situation is this strategy actually effective in?

The strategy works best in a market that is oscillating and ranging, it moves up and down and does not break out into any trends, this allows you to consistently take profit at each move up and down as you would be opening up trades, taking profits and then opening another, this continues and can be very effective when the markets continue like this for an extended period of time.

The main issue with this strategy is when the markets begin to trend, when this happens, things can begin to go wrong very quickly. A trend can last for hundreds of pips, if this happens the grid will open up a lot of trades and unless you have a very large account, there is a good chance that the tread can continue long enough to cause an account to blow. The only hope with people using this strategy is that the trend reverses or that there is a pullback where you are able to get out of all trades at the same time with a profit.

So those are some of the different grid-based strategies, they are some of the strategies that people are often told not to use, and for good reason, the strategies are very dangerous and can put your entire balance at risk, so if you are looking to protect your account, we would strongly suggest that you try a different, more conservative strategy to a grid-based one.

Categories
Forex Basic Strategies

What Is ‘Gawk the Talk Strategy’ & How To Trade It Effectively?

Introduction

Trading the news is one of the best ways to make a profit within a short span of time. This is because volatility is highest during these announcements, and traders look to capitalize on these news releases by analyzing the data and the price movement.

The strategy we will be discussing is amazingly suitable for traders who love the volatility associated with news announcements. One of the biggest advantages of trading the news is accessibility. Today, we can access the news outcome as soon as they are released without any delay.

Many free websites report economic events every day. The one which is widely used by investors and traders is a site called forexfactory.com. This site is user-friendly, and the economic calendar allows us to view the upcoming news at a glance.

The news that has red-coded flags linked to them have the greatest impact on the currency pairs. We will prefer to trade the news events with the highest impact as opposed to the orange or yellow ones because the possibility of large movement is high. Today’s strategy is also based on such news releases.

As the actual and forecasted figures are extremely important for this strategy, we will be watching these numbers very carefully. That is the reason why this strategy is named as ‘Gawk The Talk.’

The top news announcements that cause the greatest moves in the forex market are Interest Rates, Gross Domestic Product (GDP), Employment Change, Trade Balance, Consumer Price Index, Purchasing Manufacturing Index (PMI), and Retail Sales.

Time Frame

Gawk the Talk strategy works well with the 15 minutes and 1-hour candlestick charts. This means each candle on the chart represents 15 minutes or 60 minutes of price movement.

Indicators

No indicators need to be used in this strategy.

Currency Pairs         

The strategy is suitable for trading all currency pairs; however, it is healthier to trade in currency pairs such as the EUR/USD, USD/JPY, GBP/USD, USD/CHF, USD/CAD, AUD/USD, and NZD/USD.

Strategy Concept

The idea of the strategy is simple, where we long on the affected currency when the actual figures are greater than forecasted figures by a minimum factor of 15%. To lower the risk, we focus on news events that are related to the U.S. economy. Which means we will be primarily trading the U.S. dollar either as the base currency or counter currency.

We will use the 15 minutes time frame chart to determine our entries since the news is usually released in 15-minutes intervals. Some common times of news releases include 8 A.M., 9:15 A.M., 10:30 P.M., and 11:45 P.M.

For example, if the Reserve Bank of Australia raises the interest rates, we will go long in AUD/USD. And if the interest rates are lowered, we take a short trade in the pair. For news announcements that affect the United States, it is best to trade in the two most liquid pairs: EUR/USD and USD/JPY. Remember, we go long in the pair if the news outcome is positive for the base currency and ‘short’ in pairs wherever the currency is a counter currency.

Trade Setup

To illustrate the strategy, we will use the Unemployment rate news announcement, which was released on the 2nd of July 2020. As mentioned earlier, we will be dealing with currency pairs involving the U.S. dollar only. Hence, depending on the news data, we will take a suitable position in the EUR/USD pair.

Step 1:

The first t step is to go to the forex factory website and look for news releases that have the highest impact on the currency. The easiest way to find such events is to look for the red-colored flags on the left-hand side of the event. We will not consider any other news results other than red ones.

In this example, we will be analyzing the Unemployment rate data of the United States.

Step 2:

An important point most traders miss out while trading using this strategy is that they trade just based on the numbers. They forget to look at the charts from a technical angle. In this step, we mark the key technical levels on the chart based on the current state of the price.

As we can see in the below image, just before the news announcement, the price is at the resistance area. This means a ‘short’ trade is considered to be less risky than a ‘long’ trade at this point.

Step 3:

This step is the crux of the strategy. In this step, we take an appropriate position in the currency based on the news’s outcome. If the actual numbers are higher than the forecasted numbers, we will go long in that currency. Likewise, if the actual numbers are lesser than the forecasted numbers, we will go ‘short’ in that currency. The difference between actual and forecasted figures should be a minimum of 15% before we can take enter the market.

In our example, we see that the Unemployment rate was better than what was predicted by economists. This means the data is positive for the U.S. dollar, and thus we can expect bullishness in the currency. Therefore, we take a ‘short’ position in EUR/USD soon after the market falls from the resistance.

Step 4:

Stop loss for the strategy is placed just above the news candle, which is technically the right spot for placing the stop loss. The take-profit is also placed at a key technical level, which could be a hurdle for the trade. The risk to reward ratio of trades placed using this strategy is a minimum of 1.5. However, one should book partial profits at the halfway mark in order to lock in some profits.

In this case, the price moved about 60% of our take-profit, where would take some profits off. However, more often than not, the price does hit the take-profit levels.

Strategy Roundup

The strategy we discussed today is mostly for the aggressive traders and people with large risk appetite. In this strategy, we are essentially taking advantage of the volatility and the fundamental factors that affect the currencies. The trade management rules of the strategy ensure that we don’t make huge losses even if the trade does not work completely in our favor. Cheers.

Categories
Forex Daily Topic Forex Trading Strategies

Principles of Trading Strategies

Introduction

A trading strategy is a systematic methodology of investment that can be applied in any financial market, for example, bonds, stocks, futures, commodities, forex, and so on. In this context, a profitable trading strategy is more than a system that provides an entry signal on the long or short side with a stop-loss and a profit target.

Big traders make money to take their investment decisions systematically, reducing their risk with the diversification of the assets that make up their portfolio.

In this educational article, we’ll present a set of elements that can be part of a trading strategy.

The Elements of a Trading Strategy

A systematic trading strategy should be tested and validated with historical data, and its execution in the real-market should be done with the same accuracy as when using paper money.

The strategy should provide a setups series that allow us to recognize where to locate the market entry and in which direction. Finally, the trading strategy should allow market positioning in the long and short sides. This positioning should require identifiable stop-loss and profit target levels.

In particular, in this article, we’ll present the use of Fibonacci, candlesticks formations, chart patterns, trend lines, and trend channels.

Fibonacci Analysis

Likely, Fibonacci retracements and extensions are the most used tools in the world of retail and institutional trading. The Fibonacci series has its origin from the mathematical problem of the rabbits’ population solved by Leonardo da Pisa “Fibonacci” in his work “Liber Abaci” published in 1202.

The sequence discovered by Fibonacci not only can be applied in the rabbits’ population growth, but this series also solves other growth problems in nature and also on the financial markets.

Fibonacci and Corrections

One application of the Fibonacci tools in financial markets is the measurement of a retracement size that an impulsive wave may experience in its corrective move.

The rationale of this strategy considers that when the initial impulsive movement ends and following the subsequent corrective move, the market will develop a second impulsive move in the same direction of the first move.

The selection of the asset is linked to the timeframe under analysis; for example, the structure developed in a weekly chart will require more time than an hourly chart formation.

The following figure illustrates two potential entry setups using the Fibonacci retracement tool. The first scenario considers a retracement of 38.2% of the first move. The second scenario will occur when the price experiences a retracement of 61.8% from the top of the first impulse. 

The stop-loss will be placed at the origin of the previous impulsive movement.

Setting Targets with Fibonacci Extensions

Prices extensions are movements that resume the progress of a previous trend. Generally, the extensions occur in the third wave, and the correction corresponding to the second wave does not move beyond the origin of the first impulsive movement. The next figure exposes the extension of a regular three-wave pattern. Consider that the wave identification does not correspond to an Elliott wave labeling.

The analytic process follows the next steps:

  1. After an impulsive move, the price action must develop a minimum retracement of the first move.
  2. The size of the swing must be multiplied by the Fibonacci ratio of 1.618.
  3. The resulting level will correspond to the price target of the third wave.

The analysis in a five-wave pattern is similar to the three-wave case. The difference in this pattern is the seek the length of an additional impulsive move.

The five-wave pattern includes three impulsive movements and two corrective moves. The following figure illustrates the Fibonacci measures of this formation.

The Phi-Ellipse

The Phi-Ellipse is a countertrend trading method based on the oscillation of price with time. Its goal is to reduce the noise of falses breakouts and increase the stability of the investment strategy. The drawing process of a Phi-Ellipse requires to identify three points, as shown in the next figure.

After identifying the points A, B, and C, in a regular three-wave pattern, there should place the Phi-Ellipse in these points. We should expect a new impulsive move as the first impulse. There are three ways to trade against the trend at the end of the Phi-Ellipse, which are:

  1. Enter in a position when the price breaks outside the perimeter of the Phi-Ellipse.
  2. Entry based on a chart pattern at the end of the Phi-Ellipse.
  3. Place an order when the price action when the price moves outside a parallel line to the median line of the Phi-Ellipse.
  4. A buy position is recommended at the end of the Phi-Ellipse when it has a descending slope, and a sell position is recommended when the Phi-Ellipse has an upward slope.

Conclusions

In this educational article, we discussed the elements that should contain a trading strategy. The application of a systematic trading strategy or a combination with a strategy across time in a diversified portfolio could help the investor reduce the risk in its investment decisions.

On the other hand, the strategy’s analysis methodology should provide entry-setups for both long and short-side positions. In this context, in this article, we presented the use of Fibonacci retracements and extensions to offer entry setups inlcuding its stop loss and profit target level. Finally, we introduced the Phi-Ellipse method, which allows the investor to reduce the risk of falses breakouts in its investment portfolio.

In the next educational article, we will review the use of candlesticks formations, chart patterns, trend lines, and trend channels.

Suggested Readings

– Fischer, R., Fischer J.; Candlesticks, Fibonacci, and Chart Patterns Trading Tools; John Wiley & Sons; 1st Edition (2003).

Categories
Forex Basic Strategies

Pro Scalping Technique By Combining Stochastic With Bollinger Bands

Introduction

Scalping is a trading strategy that helps traders to take advantage of minor price movements on lower timeframes. It is one of the quite popular ways of trading the Forex market. There are many successful scalpers who make a lot of money by scalping the minor price moves. To be a scalper, we must be emotionally intelligent and have the ability to make quick decisions.

Scalpers place anywhere from 0 to a few hundred trades in a single day. Ideally, smaller movements in price are easier to catch compared to the longer moves. Typically while day trading, if the win/loss ratio is less than 50 percent, traders still make money. On the other hand, in scalping, it is critical to win most of the trades. Otherwise, we will end up on the losing side.

Stochastic Oscillator

Stochastic is a wonderful indicator developed by George C. Lane in late 1950. This indicator doesn’t follow the price or volume like other popular indicators in the market.  Instead, it follows the speed and momentum of the changes that occur in price before the trend formation. Stochastic is a range bounded indicator, and it oscillates between the 0 and 100 levels.

Typically, a reading above 80-level is referred to as the overbought signal, and a reading below the 20-level indicates an oversold signal. The Stochastic indicator consists of two lines, where one reflects the actual value of the indicator for each session, and another reflects its three-day simple moving average. The intersection of these lines indicates the reversal in price action.

Bollinger Bands

Bollinger Bands is a technical indicator developed by John Bollinger in the 1980s. It is a leading indicator, and it consists of two bands and a centerline. Out of the two bands, one stays above the price action, and the other stays below. Both of these bands contract and expand depending on the market’s volatility. When price action hits the lower band, it indicates a buy trade, and when it hits the upper band, it indicates a sell trade.

The Strategy

The strategy we are going to discuss is one of the most basic but effective scalping strategies ever used in the market. The idea is to apply both indicators (Bollinger Band & Stochastic) on the price chart. When the price action hits the lower Bollinger band, and the Stochastic is at the oversold area, it is an indication for us to go long. Conversely, when the price action hits the upper Bollinger band and if the Stochastic is at the overbought area, we can go short.

In the chart below, we can see that our strategy has generated a few buy/sell signals in the EUR/AUD Forex pair. The price action was in an overall uptrend. When both of the indicators gave us the signal, we took both buy and sell entries accordingly. In the chart below, the buy trades have given us some good profits, but in the sell trades, the profit was comparatively less. Always remember that these things are quite common in scalping. If you are an aggressive scalper, trade both buy sell signals. But if you are a trader who prefers to scalp the market with the trend, follow the next strategy.

Scalping The Market By Following The Trend

Buy Example

The chart below represents an uptrend in the EUR/AUD Forex pair. As you can see, by following our strategy, this pair has given us three buy signals, and all the trades were quite healthy and have performed well in the market. If you scalp the market by following the trend, it is easy to make big gains. For scalping, it is required to put smaller stops. Hence, always go for 4 to 5 pip stop-loss and 10 to 15 pip target. You can also exit your positions when the price hits the upper Bollinger band.

Sell Example

The below 3-minute chart of the GBP/JPY forex pair represents a couple of sell trades. As you can see, all the sell trades in this pair performed very well. We can also observe that every time the price action prints a brand new lower low. We took all the five selling trades on a single trading day, an all of them hit the take-profit range. So if we scalp the market by following the trend, it will be quite easy to make some profits from the market. The red arrows on the Stochastic and Bollinger Band indicators represent the sell signals.

Scalping The Ranges

Just like the trends, it is easy to scalp the ranges as well. In fact, the ranges are even easier to scalp than the trend because the support and resistance lines of the range offer extra signals for us. For ranges, all you need to do is to hit the sell when price action hits the top of the range and hit buy when prices hit the range bottom. If you add the Bollinger Bands and Stochastic indicator, the signals generated by the market will be stronger.

The chart below indicates a couple of buy/sell signals in the GBP/JPY 3-minute Forex chart. As you can see, we have gone long when prices hit the bottom of the range, combined with our strategy. The same applies to the sell-side. We have gone short when the price action hits the top of the range while respecting our strategy rules.

Conclusion

Scalping trading involves entering a trade for a shorter period of time to take advantage of small price fluctuations. When you enter a trade, it is advisable to risk lesser money and place as many trades as you can. We must have control over our inner greed and aim for smaller targets. In the beginning, it will be difficult for you to scalp the market as the smaller timeframes move way faster. You need to train your eyes a bit to understand the lower timeframes properly. Always try to scalp with a bigger trading account because the trading commissions can quickly eat up the smaller accounts.

Categories
Forex Basic Strategies

Profiting From The Rounding Top & Rounding Bottom Forex Pattern.

Introduction

The Rounding Top and Rounding Bottom are two of the most famous trend reversal patterns in the Forex trading industry. These patterns are mostly used to catch the end of a trend in both bullish and bearish markets. These patterns are extremely reliable as they are back-tested rigorously by a number of professional technical traders. Learning the trading of these patterns introduces us to a lot of trading opportunities while riding a brand new trend. Always remember that the Rounding top pattern appears at the top of an uptrend, and the Rounding Bottom pattern appears at the bottom of a downtrend.

Rounding Top

The Rounding Top pattern appears to be in the form of an inverted ‘U’ shape. Hence it is also referred to as an ‘Inverse Saucer.’ This pattern resembles the Double Top chart pattern but a bit more complex than that. Most of the time, the Rounding Top appears at the major resistance level on a price chart. This pattern has three major components – A rounding shape where the price action fails to print a higher high, a taper off, and the beginning of the lower trend.

Rounding Bottom 

The Rounding Bottom is a bearish reversal chart pattern, and it appears at the end of a downtrend, indicating a long term reversal in the price action. This pattern resembles the Cup and Handle pattern, but it doesn’t go through the temporary downward trend of the handle portion. This pattern can be found at the major support area in any trading timeframe. Just like the Rounding Top, this pattern also has three major components –  The Rounding Shape, where the price action fails to print a brand new lower low, taper off, and the beginning of an uptrend.

Trading The Rounding Top Pattern

The below CAD/CHF charts represents the formation of a Rounding Top pattern in this Forex pair.

We had decided to go short as soon as the pattern is confirmed when the price reached the neckline. The bear candles on the price chart were stronger than the bull candles indicating the gaining strength of sellers in the market. The sell trade is activated when the price goes below the neckline. Stop-loss is placed just above the region where the pattern is formed.

After activating the trade, price action didn’t blast to the south immediately. Instead, it pulled back to buy-side, before eventually going down. In this kind of situation, most of the traders doubt their strategy and exit their positions because of fear. But since our analysis is strong enough, it is a good idea to hold our positions and wait for the price to move in our direction.

Trading The Rounding Bottom Pattern

The below EUR/USD, 240 Minutes chart, represents the formation of the Rounding Bottom pattern on the price chart. We can see the market being in a downtrend when the Rounding Bottom pattern is formed. This is a clear indication for us to understand that the bears are losing momentum, and bulls are about to take over the market. We took a buy-entry when the price went above the neckline. The take-profit was placed at the higher timeframe’s significant resistance area.

Rounding Top Pattern + RSI Indicator

In this strategy, we have paired the Rounding Top pattern with the RSI indicator to identify accurate trading signals. As we all know, the RSI is a momentum indicator that measures the magnitude of the price change. RSI stands for Relative Strength Index, and it is developed, J. Welles Welder.

This indicator oscillates between the 0 and 100 levels. When RSI reaches the 70 level, it indicates overbought market conditions, and we must expect a downside reversal. Likewise, when it reaches the 30 level, it indicates the oversold conditions, and we must expect a buy-side reversal.

The strategy is simple –  Identify the Rounding Top pattern and see if the price action is going below the neckline. If yes, check where the RSI indicator is. If it is in the overbought area, it is a clear indication for us to go short.

The below price chart represents the formation of the Rounding Top pattern on the EUR/CHF Forex pair.

In the below chart, we can see the price going below the neckline. At the same time, RSI gave a reversal at the overbought area, indicating us to go short in this pair. We have activated the trade at the neckline, and the stop-loss placement was above the most recent higher low. We had closed our positions when the price action started to struggle at the Bottom.

Rounding Bottom Pattern + RSI Indicator

The below chart represents the formation of the Rounding Bottom pattern on the NZD/CAD Forex pair.

We had gone long when the price broke the neckline, and the RSI gave a reversal at the oversold area. As you can see in the chart below, right after our buy activation, the price smoothly blasted to the north. We booked our whole profits when the price reached a significant resistance area. Stop-loss was just below our entry as the neckline acts as a strong support to the price action.

Conclusion

The Rounding Top and Bottom are bullish and bearish reversal patterns that are used to identify the end of an ongoing trend. You need to know that you must wait for the breakout of the neckline to take long or short positions according to the pattern formed. The stop-loss can be placed above the neckline when trading the Rounding Top and below the neckline when trading the Rounding Bottom pattern.

The take-profit must be equal to the size of the pattern formed, and if the trend is strong enough, consider going for deeper targets. Overall, these patterns are quite popular and easy to spot on the price chart. Practice trading these patterns using a trading simulator or a demo account before applying these strategies on live accounts.

We hope you find these strategies informative. If you have any questions, make sure to let us know in the comments below. Cheers.

Categories
Forex Basic Strategies

Trading The ‘Wedge Pattern’ Like A Professional Technical Trader

Introduction

A Wedge is a technical chart pattern marked by converging trend lines on the price chart. The trend lines on the price chart are drawn to connect the highs and lows of price action over a specific period of time. The wedge pattern holds three significant characteristics:

  1. The converging trend lines.
  2. A major decline in volume as the price action progresses through the pattern.
  3. A major breakout on either of the sides.

The Two Types of Wedge Patterns

  • The Rising Wedge (signals a bearish reversal)
  • The Falling wedge (signals a bullish reversal)

The Rising Wedge

The Rising Wedge is a bearish trading pattern that begins with a wide bottom. The pattern contracts as the prices rise. This pattern typically appears in an uptrend, and on higher timeframes, it takes nearly 3 to 6 months of time to form. Upper and lower trend lines must have at least 3 to 4 higher highs and higher lows to consider that as a Rising Wedge pattern. The loss of volume on each successive high indicates that the price is losing its momentum, and soon we can expect the downside reversal.

The Falling Wedge

The Falling Wedge is a bullish pattern that begins wide at the top and contracts at the bottom. To confirm this pattern, see if the direction of the trend is downward. Most often, the Falling Wedge pattern forms at the end of the downtrend, as it prints the last lower low on the chart. Mostly this pattern takes almost three to four lower lows and lower highs to print on the price chart. As the price action drops, the loss of volume and momentum increases the probability of bullish reversal.

Wedge Pattern Trading Strategy

The Falling Wedge Pattern

As discussed, a Falling Wedge indicates that the sellers are losing momentum in the market, and the buyers are gaining momentum. This means that we can soon expect a buy-side reversal in the trend. As we can see in the image below, we have identified a Falling Wedge pattern in the AUD/NZD Forex pair. We can clearly see that the price action is confined within the two lines, which gets closer together to create a Falling Wedge pattern. The loss of selling momentum indicates that the buyers are gaining control. When the price action breaks the upper trend line, it shows that the sellers are now out from the game, and this instrument is ready for brand new higher highs and higher lows.

The image below represents our entry, exit, and stop-loss in the AUD/NZD Forex pair. The entry was purely based on the breakout, and the stop-loss was just below the second line. In this example, we go for deeper stop-loss because the market was quite volatile. Most of the time, the breakout line acts as a strong support to the price action. So we can go for a smaller stop-loss just below the close of the recent candle as well. The placement of take-profit order entirely depends on you. Some of the common ways to exit our position are when the price hits the major resistance line, or when the buyers start to lose momentum. In this example, we have placed the take-profit order at the higher timeframe’s resistance area.

The Rising Wedge Pattern

Markets prints the Rising Wedge pattern in an uptrend. When the two lines of the pattern get closer, it indicates that the uptrend is losing momentum, and the probability of the downside reversal is increasing. So when the price action breaks the lower trend line, it is an indication to go short. The below image represents the falling wedge pattern in the EUR/JPY Forex pair, and the entry was at the breakout of the lower trend line.

The below chart represents our entry, exit, and take profit in this pair. As mentioned, the entry was after the breakout, and the stop-loss was at the most recent higher high. To place the take-profit, we choose the major resistance line. But notice that on this daily chart, price action took so much time to hit our take profit. This is normal, and while trading this pattern, we will face these types of situations. Most of the time, this pattern offers very strong signals. So it is important to control our emotions and not panic. Holds your positions for the target you are looking for. If the price action came back to the breakeven, only then we suggest you close your position. Otherwise, place the stop-loss at breakeven and wait for the market to hit the take-profit.

Pros & Cons Involved

Just like any other technical trading pattern, the Wedge pattern also has its own pros and cons. The problem is that there is no specific benchmark for this pattern of where to enter and where to exit our positions. Some traders pair this pattern with the other technical indicators to take an entry while some traders wait for the trend line breakout to take entry.

Both ways work very well, and both have the chance to lead us to more significant profits. The biggest advantage we have is the leverage of more than two lines coming together. It is a warning for us to stop taking sell trades and expect a buy-side reversal soon. So with this, we know the shift in the direction of price action ahead of time. This will ultimately help us in entering the trend at the earliest.

Conclusion

For us to witness & confirm this pattern on the price chart, three things are required. Two trend lines must come close to each other as the price action moves and within those two lines, and that’s primary. The second rule is that one-party must be losing its momentum while the other party must show the sign of coming back in the show. The third thing is that the breakout of either one line according to the circumstances is necessary.

To take a trade, we can enter the breakout, or we can wait for the price to retest the trend line. The stop-loss should be set above/below the second line, and the take-profit order must be placed at the higher timeframe’s resistance area. Identifying this pattern is easy compared to the other trading patterns out there. We must train our eyes to find this pattern visually on the price chart and look for the best entry, exit, and stop-loss areas. All the best!

Categories
Forex Basic Strategies

Identifying & Trading The Bullish & Bearish Gartley Pattern

Introduction

We have discussed three of the most used Harmonic patterns in the previous strategy articles, and they are AB=CD, Butterfly, and Bat patterns. In today’s article, let’s learn how to trade one of the oldest Harmonic patterns – The Gartley. Trading harmonic patterns is one of the most challenging ways to trade but equally rewarding. There are traders across the world who highly believe in these patterns because of their accuracy in identifying trading signals, and the high RRR trades they offer.

The Gartley is one of the most commonly used harmonic patterns as it works very well on all the timeframes. IT is also one such pattern that frequently appears on the price charts. H.M Gartley introduced this pattern in his book ‘Profits in the Stock Market’ in the year 1935.

This pattern is also known as the Gartley 222 pattern because H.M Gartley introduced this pattern in the 222nd page of his book. There are both bearish and bullish Gartley patterns, and they appear depending on the underlying trend of the market. The Gartley pattern is made up of 5 pivot points; let’s see what these points are in the below section.

5 Pivot Points of The Garley Pattern

Just like other harmonic patterns, H.M Gartley used five letters to distinguish the five separate moves and impulses of the Gartley pattern.

  • The letter X represents the start of the trend.
  • The letter A represents the end of the trend.
  • The letter B represents the first pullback of the trend.
  • The letter C represents the pullback of the pullback.
  • The letter D represents the target of the letter C.

Gartley Pattern Rules

‘X-A’ – This is the very first move of the pattern. The wave XA doesn’t fit any criteria, so it is nothing but a bullish or bearish move in the market.

‘A-B’ – The Second move AB should approximately be at the 61.8% level of the first XA move. So if the XA move is bearish, the AB move should reverse the price action and reach the 61.8% Fib retracement level of the XA.

‘B-C’ – The goal of the BC move is to reverse the AB move. Also, the BC move should end either at 88.6% or 38.2% Fibonacci retracement level of XA.

‘C-D’ – The CD move is the reversal of the BC move. So if the BC move is 38.2% of the AB, CD move should respond at 127.2% level of BC. If BC move is at the 88.6% level of the AB move, the CD move should be at the 161.8% Fib extension level of BC.

‘A-D’ – This is the last but most crucial move of the Gartley pattern. Once the CD move is over, the next step is to measure the AD move. The Last AD move will show us the validity of the Gartley Pattern on the price chart. The pattern is said to be valid if this move takes a retracement approximately at the 78.6% Fib level of the XA move.

Below is the pictographic representation of the Gartley Pattern

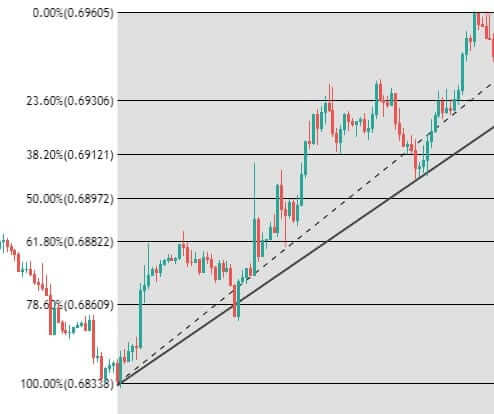
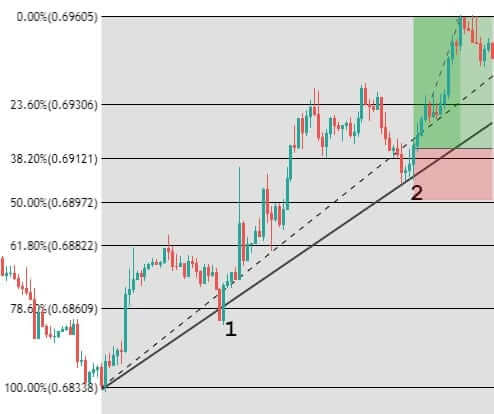
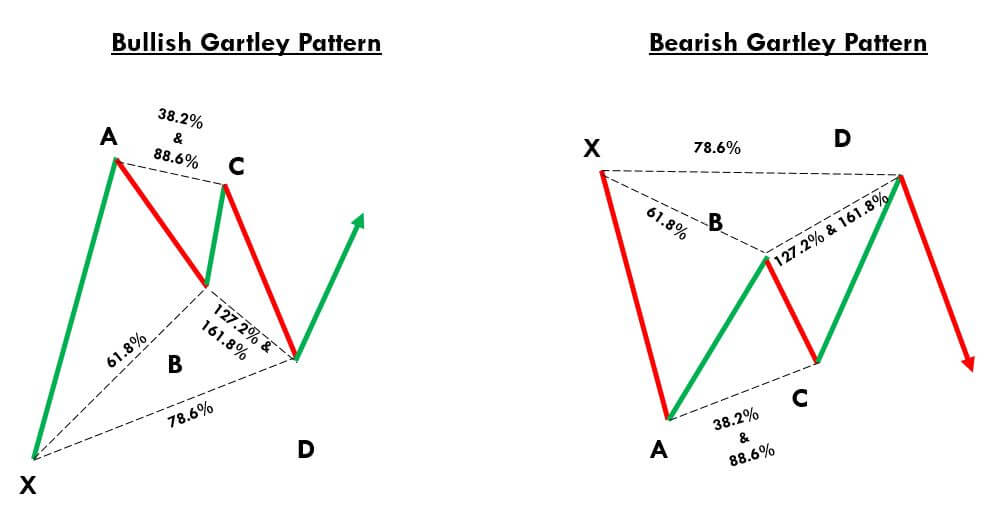
 Gartley Pattern Trading Strategy 

Trading The Bullish Gartley Pattern

In the below NZD/USD weekly chart, we can see that the market is in a clear uptrend. We have then found the swing high and swing low, which is marked by the point X & Point A. We then have four swing-high & swing-low points on the price chart that binds together to form the Gartley harmonic pattern.

Always remember that every swing high and low must validate the Fibs ratios of the Gartley pattern. These levels can be approximate as we can never trade the market if we keep waiting for the perfect set-up. There are indicators out there where the Fibonacci levels are present in them by default. We generally use TradingView, and in this charting software, the below-used indicator can be found in the toolbox, which is present on the left-hand side.

Please refer to the marked region in the chart below. The first XA leg is formed just like a random bullish move in the market. The second AB move is a bearish retracement, and it is at the 61.8% Fib level of the XA move. Furthermore, the BC is a bullish move again, and it follows the 88.6% Fib level of the AB move. The CD leg is the last bearish move, and it is respecting the 161.8% Fib level of BC.

Now we have identified the bullish Gartley pattern on the price chart. We can take our long positions as soon as the CD move ends at the 161.8% level. The next and most crucial step of our strategy is to find the potential placement of our stop-loss. The ideal region to place the stop-loss is just below point X. If the price action breaks the point X, it automatically invalidates the Gartley pattern.

However, stop-loss placement depends on what kind of trader you are. Some aggressive traders place stop-losses just below the entry while some use wider stops. We suggest you follow the rules of the strategy and use point X as an ideal stop-loss placement.

B, C & A points can be considered as ideal areas for taking your profits. We suggest you go for higher targets in the case of the formation of a perfect Gartley pattern. Overall, placing a ‘take-profit‘ order depends on your previous trading experience also. Because, if you come across any ideal candlestick patterns in your favor while your trade is performing, you can extend your profits. We can also combine this pattern with other reliable technical indicators to load more positions in our trades.

Trading The Bearish Gartley Pattern

Below is the EUR/GBP four-hour chart in which we have identified the bearish Gartley pattern. In the highlighted region, we can see the formation of the bearish XA leg like a random bearish move. The second leg is AB – a bullish retracement stopping at the 61.8% level of the XA move. Furthermore, the BC move is bearish again, and it respects the 88.6% Fibs level of the AB move. CD is the final bullish move, and it is respecting the 161.8% Fibs level of BC.

As soon as the price action completes the CD move, we can be assured that the Gartley pattern is formed on our price chart. We can also see the formation of a Red confirmation candle indicating us to go short in this Forex pair. We have taken our short positions at point D and placed our stop-loss just above point X.

We have three targets in total, and they are points B, C, and A. Within a few hours, the price action hits the B point, which was our first target. Moreover, the price pulled back at point C, but we were safe in our trade as our stop-loss was placed above point X. Our final target was at point A, which is achieved within four days.

Conclusion

The Gartley pattern is wholly based on mathematical formulas and Fibonacci ratios. Remember to take the trades only when all the mentioned Fib levels are respected. If you have no experience with harmonic patterns, you must master this pattern on a demo account first and then use them on the live markets. We are saying this because it requires a lot of patience and practice to identify and trade these patterns.

We hope you understood how to identify and trade the Gartley Harmonic Pattern. If you have any questions, let us know in the comments below. Cheers!

Categories
Forex Basic Strategies

Identify Reliable Trading Signals Using ‘Piercing Line’ Candlestick Pattern

Introduction

The Piercing Line is a simple and effective candlestick pattern, and it is used to trade the bullish reversals in the market. This pattern typically appears in a downtrend. Also, when it appears in a significant support area, we can consider it more reliable. Piercing Line is a two candlestick pattern where the sellers influence the first candle, and the second candle is responded by enthusiastic buyers. Piercing Line essentially indicates the bears losing control, and bulls taking over the market.

  1. First of all, in a downtrend, the first candle of the pattern should be bearish.
  2. The second candle should be bullish, and it should open lower than the closing of the previous candle, and it must close above the midpoint of the bearish candle.

This indicates that buyers now overwhelmed the sellers. In terms of supply-demand, this pattern shows that the supply is depleted somewhere, and the demand for buying has increased. Remember not to trade this pattern alone. Always use it in conjunction with some credible indicators or other trading tools to further enhance the probability of winning.

Piercing Line Pattern Trading Strategies

Piercing Line Pattern + Percentage Price Oscillator

In this strategy, we have paired the Piercing Line pattern with the Percentage Price Oscillator to generate credible trading signals. The Percentage Price Oscillator is a momentum indicator. It consists of a centerline, histogram, and the two moving averages. Just like the MACD indicator, the PPO also represents the convergence and divergence in price action. This indicator gives a crossover at the overbought and oversold market conditions.

When price action crosses the centerline, it means that the bullish or bearish momentum is super strong. We want to let you know that PPO is not that popular in the industry. Also, it is not available in the MT4 terminal. However, you can download this indicator from this link and add it to your MT4 terminal. If you are a Tradingview user, search the PPO indicator in the indicators tab, and you should be able to find it.

Step 1 – Find out the Piercing Line pattern in a downtrend.

Step 2 – Once you find the Piercing Line pattern, the next step is to wait for the reversal to happen on the PPO indicator at the oversold market conditions.

In the below CHFJPY chart, the market was in an overall downtrend. We can see the market printing Piercing Line pattern, and that is an indication of a trend reversal. We can also see the PPO indicator giving crossover in the overbought area at the same time. Both of these clues indicate a clear buy signal in this pair. We can also see the price action showing divergence, which is another clue to go long. If we are able to find all of these clues on a single price chart, we shouldn’t mind placing bigger trades.

Step 3 – Stop-loss and Take Profit

PPO indicator quite often gives high probability trading signals. So when we take trades of that kind, most of the time, we must place the stop loss just below the first candle of the Piercing Line indicator.

There are several ways to book profits. For this particular strategy, we can close our position when the PPO reversed at the overbought area or when the market starts printing the opposite pattern. If you plan to make more money in a single trade with extra risk, it is advisable to book the profit at the higher timeframe’s major resistance area.

In the below chart, we can see that we have closed our whole position at the major resistance area and the stop-loss order was just below the recent low.

Piercing Line Pattern + Double Moving Average

In this strategy, we have paired the Piercing Line pattern with the Double Moving Average. Moving Average is a very well-known indicator in the industry. Many average indicators are available in the market. If you are using the lower period average, expect more trading signals. Contrarily, if you are using the higher period average, expect fewer but accurate signals.

Step 1 – First of all, find out the Piercing Line pattern in a downtrend.

Step 2 – Activate the buy trade when the lower period MA crosses the higher period MA. In the below EURAUD Forex chart, the price action was in a downtrend, and around the 22nd of December, the market prints the Piercing Line pattern. This means that the sellers now have a hard time to go lower, and buyers took over the market. Furthermore, when a lower period moving average crosses the higher period moving average, it is a clear indication to go long. After our entry, price action immediately prints a brand new higher high.

Step3 – Stop-loss and Take Profit

If you are an aggressive trader, use the recent low for stop loss. But if you are a conservative trader, make sure to place wider stop losses. If you plan to ride the longer moves, wait for the price action to hit the daily support area. But if you plan to go for intraday trades only, we suggest you exit your position when the double MA gives the opposite signal.

In the below chart, we can see that we have closed our full positions at the higher timeframe major resistance area, and stop-loss was just below the recent low. Overall, it was a 3R trade.

Bottom Line

Piercing Line pattern is a bottom reversal pattern, and it is one of the very well-known bullish reversal patterns. We can say that this pattern is exactly the opposite of the Dark Cloud Cover pattern. We won’t be able to see this pattern very frequently on the price chart, but when it appears, a trend reversal is guaranteed. Sometimes you will find this pattern in the consolidation phase, but it’s not worth your time to trade it in ranges. So it is always recommended to find this pattern in a clear trending market because that’s where we can generate more effective signals. The only limitation of this pattern is that it requires the use of other technical tools to confirm the signal and cannot be used stand-alone. But that’s the case of most of the candlestick patterns, so that’s not a major limitation.

That’s about the Piercing Line candlestick pattern. Let us know if you have any questions in the comments below. Cheers!

Categories
Forex Basic Strategies Forex Trading Strategies

Trading The Morning Star Candlestick Pattern Like A Pro!

Introduction

Morning star is a bottom reversal pattern, and it primarily consists of three candlesticks that indicate the bullish sign. This pattern warns the weakness in an ongoing downtrend that, in turn, suggests the start of an uptrend. Traders observe the formation of a Morning Star pattern on the price chart, and then they can confirm it with other technical tools.

The Three Candlesticks Of Morning Star Pattern

  • Large Bearish Candle
  • Small Bullish or Bearish Candle
  • Large Bullish Candle

The most fundamental thing to remember is that the market should be in a downtrend to trade the Morning Star pattern. To confirm the downtrend, mark the lower lows and lower highs.

Large Bearish Candle is the first part of the Morning star reversal pattern. The bearish candle indicates the bears are in complete control, which means the continuation of the selling pressure. At this point in the market, we should only be looking for the sell trades as there is no sign of reversal yet.

Small Bullish/Bearish Candle is the second candle that begins with a bearish gap down. This candle indicates that the sellers fail to push the price lower, despite trying really hard. The price action ends up forming a quite small bullish/bearish or Doji candle. If this candle is a small bullish candle, it’s an early sign of trend reversal.

Large Bullish Candle is the third candle that holds the most significance because the real buying pressure is revealed in this candle. If this candle begins with a buying gap, and if buyers can push the prices higher by closing the candle even above the first red candle, it is a definite indication of a trend reversal.

Trading strategy – Morning Star Candlestick Pattern

As we know by now, the Morning star is a reversal pattern. It mainly indicates the bulls taking over the trend while the bears lose the grip. Most of the beginners tend to trade the Morning Star pattern stand-alone. But we do not recommend this as it is not reliable enough. Always pair this pattern with some other credible indicators, support resistance levels, or trend lines to make profitable trades.

Morning Star Pattern + Volume

In this strategy, we have paired the Morning Star pattern with the volume. The volume plays a significant role in pattern formations. If the first red candle shows a low volume, it is a good sign for us. Then, if the second candle is green and the volume rises, it indicates the buying pressure. Lastly, the long green candle’s volume must be high. The high volume on the last candle shows the confirmation of the upcoming buy trend. If the third bullish candle has low volume, then try avoiding that Morning Star Pattern because the volume is not indicating the bullish reversal. If you observe the third candle closing with high volume, take up the buying position and ride the uptrend until there are any indications of a trend reversal.

Confirm the downtrend on the trading timeframe

Confirmation is very important because, if there is no downtrend, there’s no point in trading the Morning Star pattern. You can confirm the downtrend on a higher timeframe or on your trading timeframe. As you can see in the below image, the overall trend of the CAD/CHF Forex pair was down.

Find out the Morning star pattern on your trading timeframe

As you can see in the below CAD/CHF chart, the market prints the Morning Star pattern by following all the rules of our strategy. The first red candle was with low volume, and the second one was a small red candle. Hence there is no indication to go long in this pair yet. The very next was a long green candle with high volume. This is a strong indication of a trend reversal.

Entry, Take Profit and Stop Loss

We should be entering the trade when the next green candle closes. There are so many different ways to book profit. We can close the position at any resistance area or supply-demand zone. In this trade, we hold our positions because we took the trade from the beginning of a new trend. You can also close your positions when the price goes near the higher timeframe’s significant resistance level.

Pairing this pattern with volume makes it more reliable to trade. So it is a good idea to place the stop loss just below the second candle. In the above picture, you can see that we have put the stop loss just below the second candle, and we have also booked the profit at the higher timeframe’s major resistance area.

Reliability of Morning Star Pattern

This pattern is very easy to identify on the price chart if you are an intermediate trader. Even novice traders can easily spot it on the chart with little practice. Morning Star pattern often gives us well-defined entries and good risk-reward ratios. The only limitation of this pattern is that, if the sellers are strong enough, the prices could go further down despite the formation of the Morning Star Pattern. Hence it is always recommended to combine this pattern with some other trading tools rather than trading it stand-alone.

We hope you find this article informative. Try trading this pattern when you see a perfect downtrend next time. Let us know how the results have been in the comments below. Cheers!

Categories
Candlestick patterns Forex Basic Strategies Forex Trading Strategies

Pairing The Hanging Man Candlestick Pattern With MACD Indicator

Introduction

The Hanging Man is a visual candlestick pattern which is used by traders and chartists in all type of markets. The term ‘Hanging Man’ refers to the shape of the candlestick. Visually the hanging man looks like a ‘T,’ and it appears in an uptrend. The formation of this candlestick is an indication that the uptrend is losing its strength. Meaning, sellers started showing interest, and the current trend of an asset is going to get reversed. Anyone can easily predict from the name of this pattern that it is viewed as a bearish sign.

The Hanging Man candle composes of a small body and a long lower shadow with little or no upper shadow. The vital point to remember is that the hanging man pattern is a warning of the upcoming price change, so do not take it as a signal to go short. Also, trading solely based on one pattern is risky. To confirm the sign given by the Hanging Man pattern, traders must pair it with support resistance or any other trading indicator.

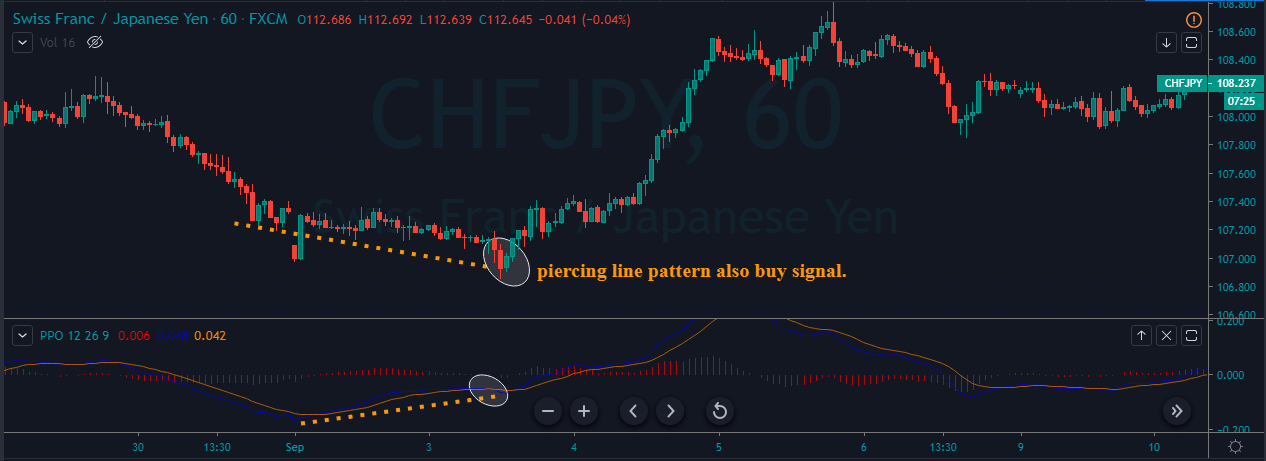
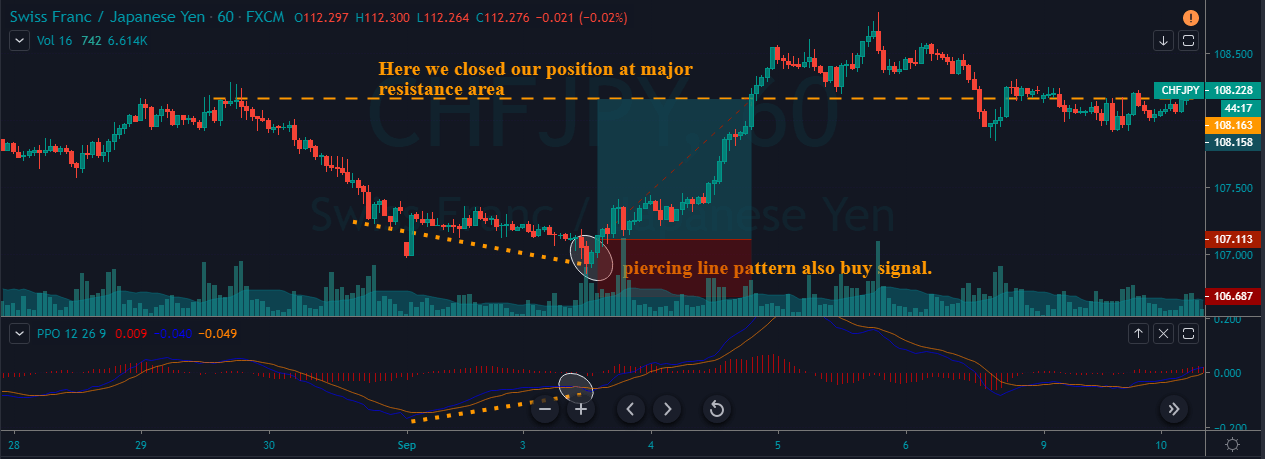
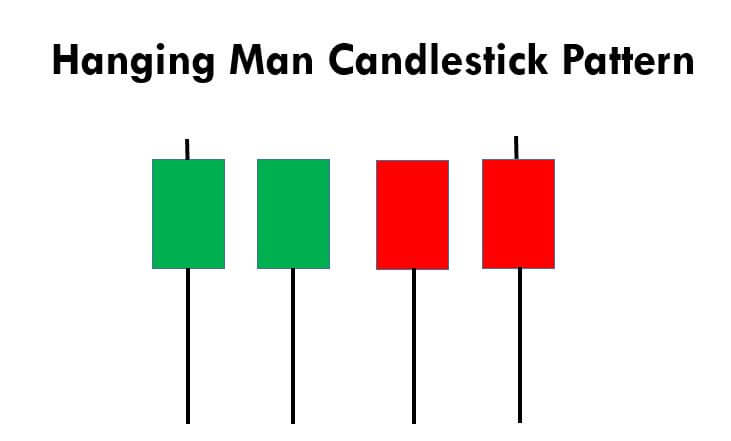
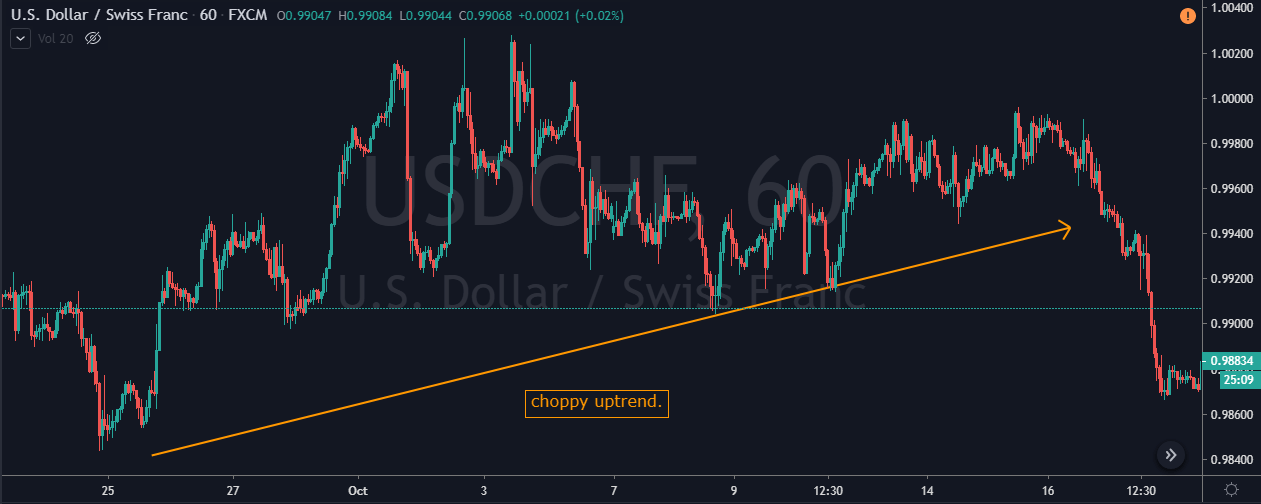
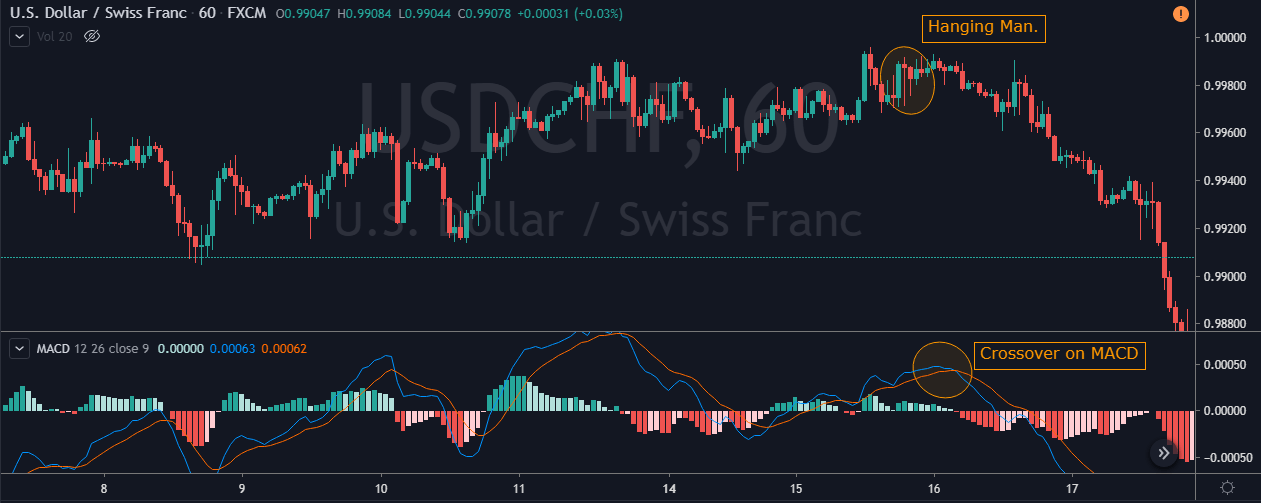
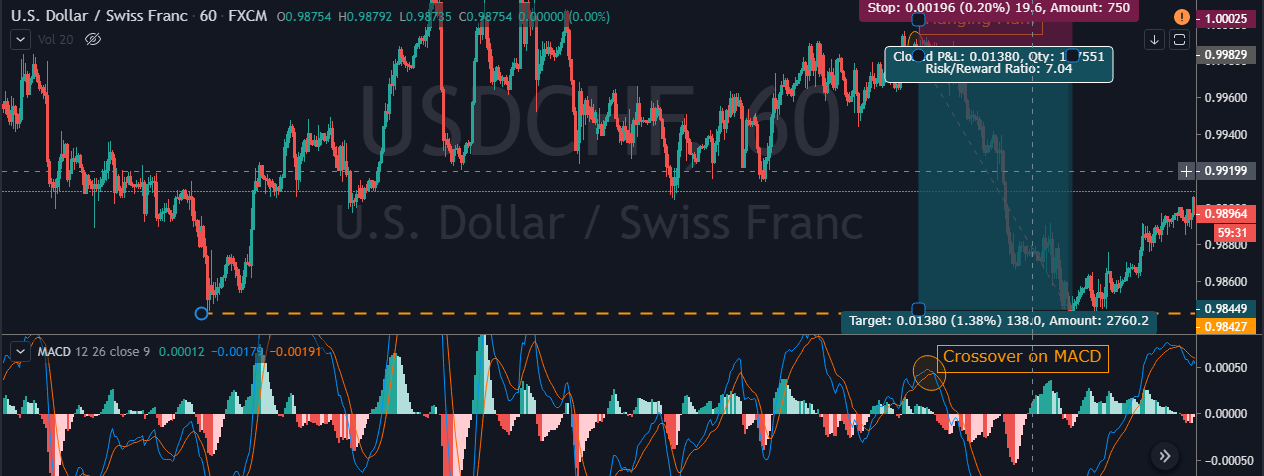
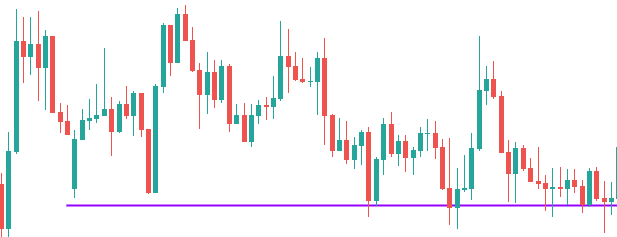
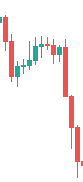
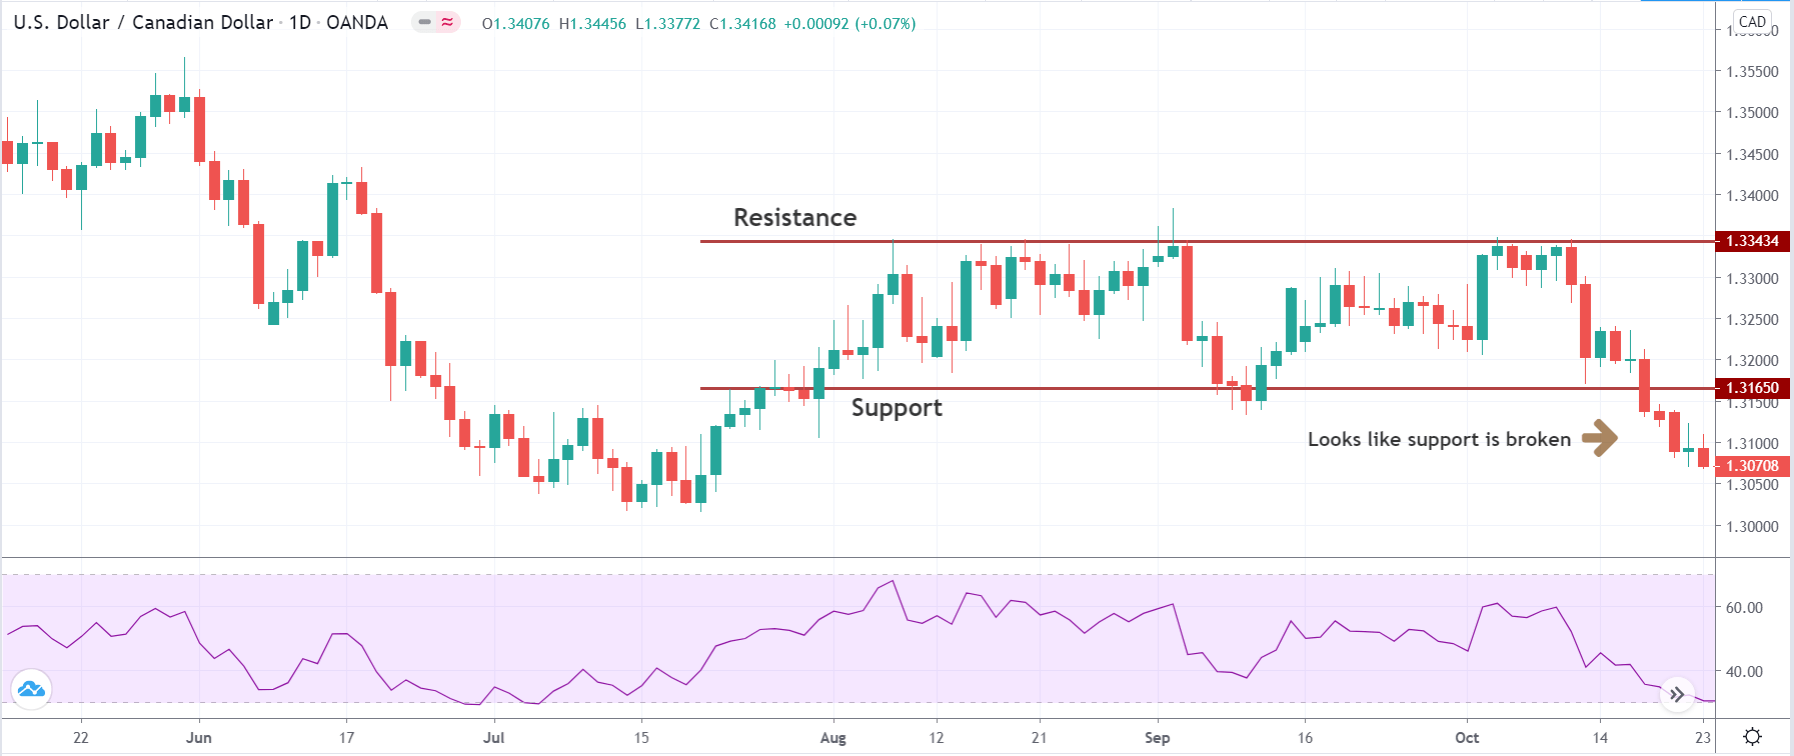
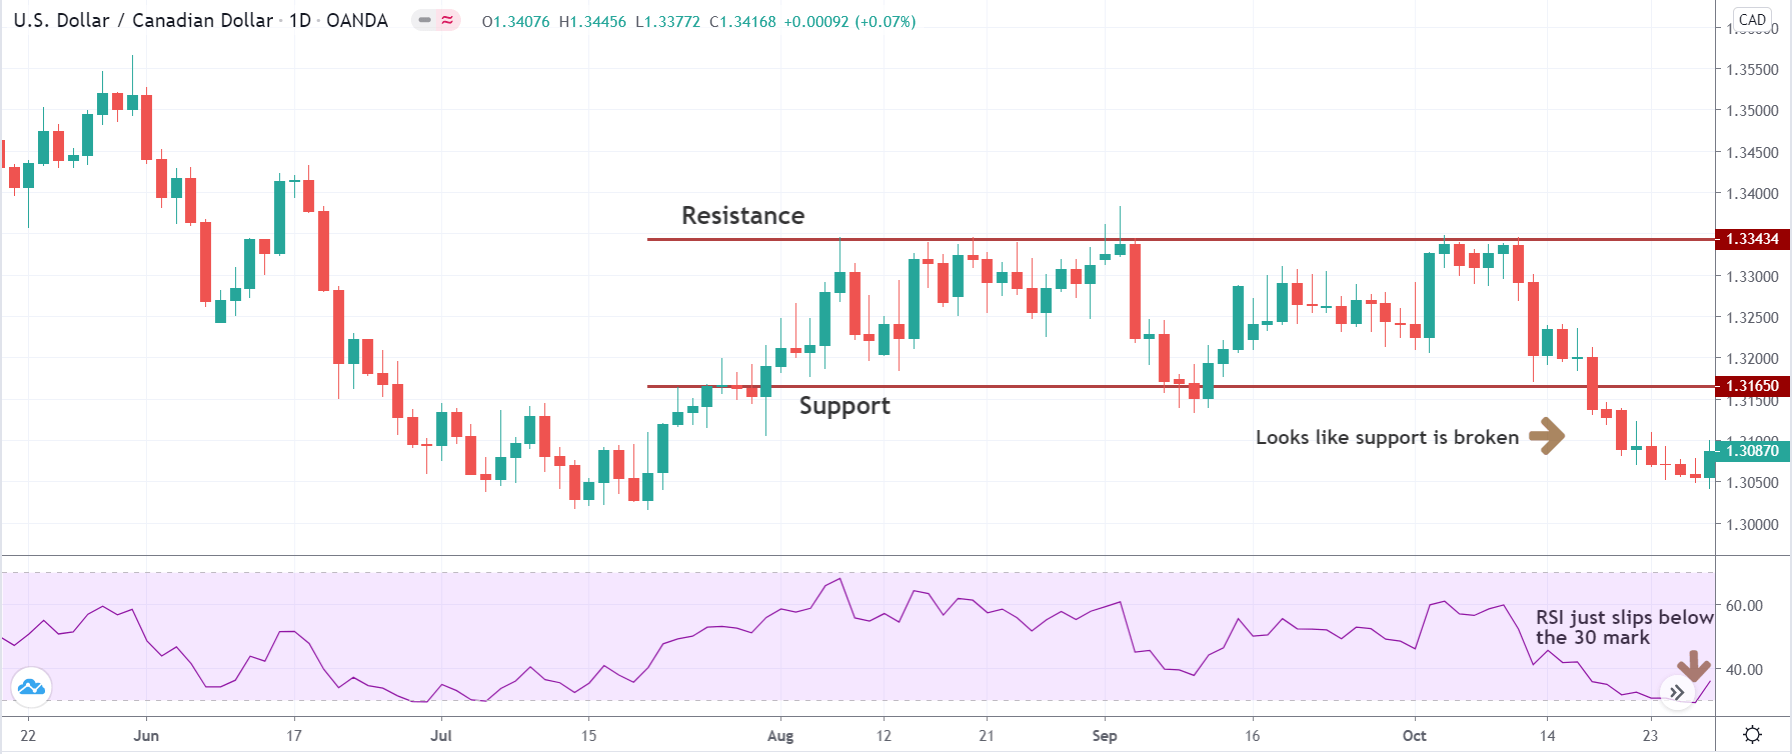
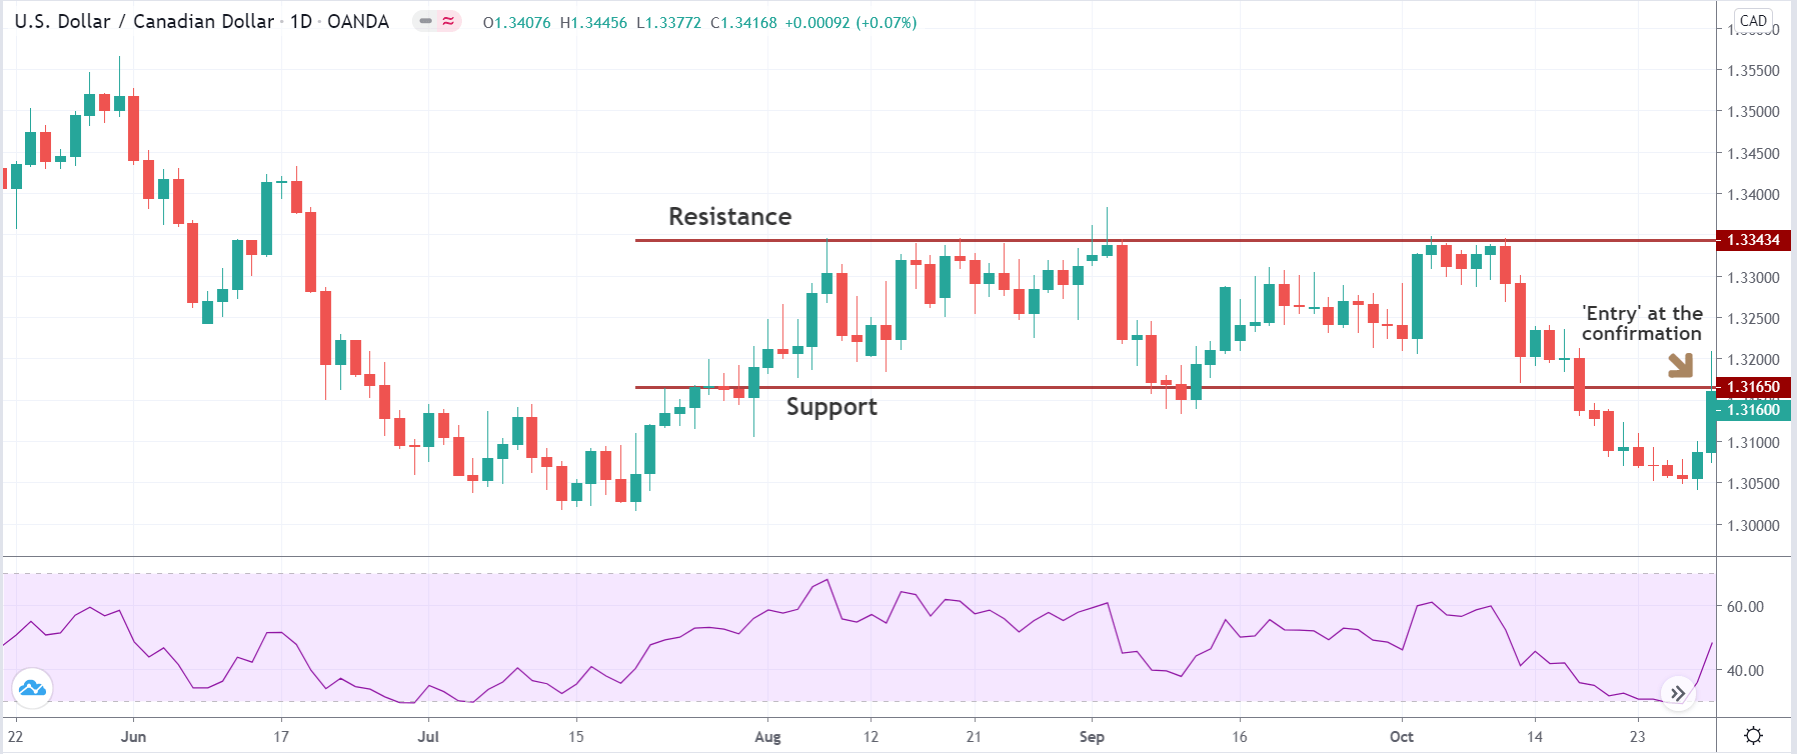
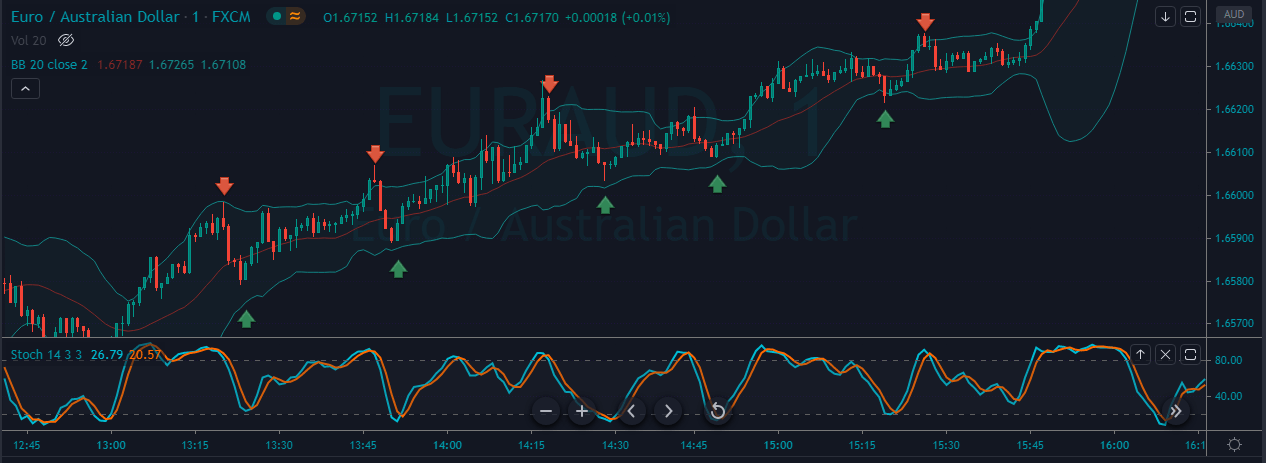
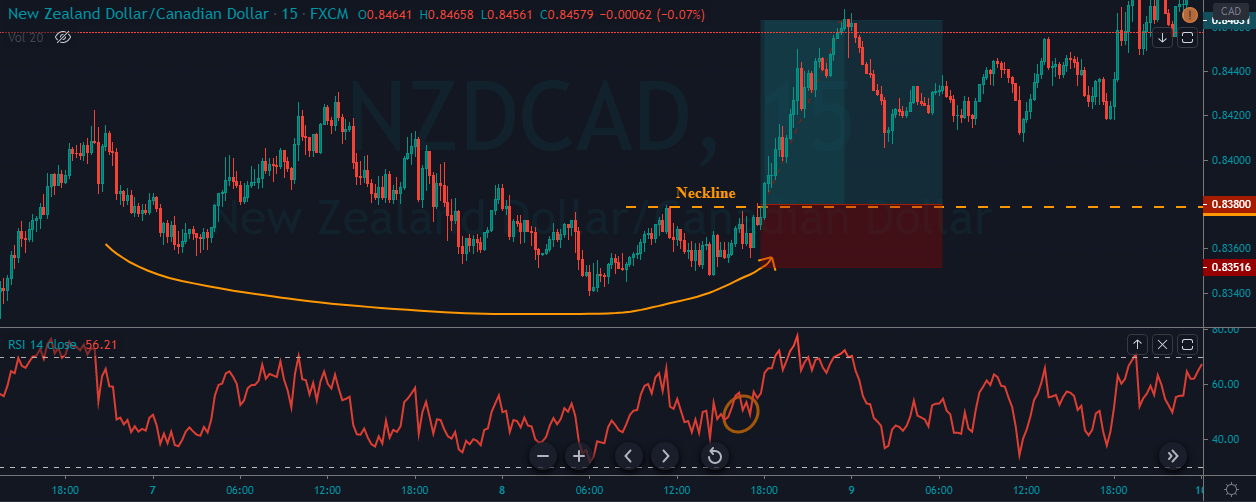
This pattern is not confirmed unless the price falls shortly after the Hanging Man. If the next candle closes above the high of the Hanging Man, this pattern is not valid. After the pattern, if the very next candlestick falls, then it’s a clear indication of the reversal. Now, if you see a Hanging Man candlestick and the above-discussed rules apply, you can go ahead and take the trade. But since it is crucial to have an extra confirmation, let’s pair this pattern with a technical indicator.

Pairing the Hanging Man Pattern With MACD Indicator

In this strategy, we have paired the Hanging Man pattern with the MACD indicator so that we can filter out the low probability trades. MACD stands for Moving Average Convergence and Divergence, and it is one of the most popular indicators in the market. It is essentially an oscillator that is used for trading ranges, trend pullbacks, etc. Also, this indicator identifies the overbought and oversold market conditions. In this strategy, we are using the default setting of the MACD indicator to identify the trades.

Step 1 – Confirm the uptrend first on your trading timeframe

We can’t use the Hanging Man pattern to take the buy trades. Since it is a reversal pattern, it only signals the selling trades. So first of all, find out the uptrend in any currency pair. One more primary thing to remember when trading this pattern is this – After finding a clear uptrend, if you see the market printing the Hanging Man, then try not to trade that pair. Because, in a strong trend, it’s not easy for a single candle to change the direction of the entire trend. But if you find this pattern when the uptrend is a bit choppy, it has higher chances to perform. As we can see in the image below, the uptrend in USD/CHF was not strong enough.

Step 2 - Find out the Hanging Man pattern on your trading timeframe

Some traders use two or three timeframes to trade patterns. But that’s not the right way of pattern trading. If you are an intraday trader, use only lower timeframes to identify the pattern. So the next step here is to find out the Hanging Man in this chart. Also, apply the MACD indicator. For us to go short, the MACD indicator must be in the overbought area.

As you can see in the image below, the USD/CHF Forex pair prints a Hanging Man pattern. This is the first clue for us that the buyers aren’t able to push the market higher. Soon after the crossover happened on the MACD indicator, we can say that this forex pair is in the overbought condition. So now, two forces are aligned, and they are indicating us to go short. Within a few hours, the pair rolls over, and it prints brand new lower low.

Step 3 – Entry, Take Profit & Stop Loss

We go short as soon as we see the Hanging Man candlesticks and MACD indicator at the overbought area, we can go short. In this pair, buyers were quite weak, and this is an indication for us to place deeper targets. As we suggest in every strategy, often close your position at significant support/resistance area, or when the market starts to print the opposite pattern. In this pair, we closed our full trade at 0.9844. Overall it was 7R trade, and we made nearly 140+ pips.

Placing the stop loss depends on what kind of trader you are. Some advanced traders use their intuition to close their positions, while some use logical ways such as checking the power of the opposite party. In this trade, we know that the buyers are not strong enough, so there is no need to use the spacious stop loss.

Difference Between Hanging Man and Hammer Patterns

The Hanging Man and Hammer both look the same terms of size and shape. Both of these patterns have long, lower shadows and small bodies. But the Hanging Man forms in an uptrend, and it is a bearish reversal pattern. Whereas the Hammer forms in a downtrend, and it is a bullish reversal pattern. These two patterns appear in both short and long term trends. Do not use these patterns alone to trade the market. Always use them in conjunction with some other reliable indicators or any other trading tool.

Bottom Line

Most of the professional traders never see this pattern alone as a predictor of a potential trend reversal. Because there will be times when the price action continues to move upward even after the appearance of the Hanging Man. Hence technical indicator support is required to confirm the reversal of the trend. Make sure to stick to the rules of the pattern so that you can use it to your advantage. This pattern forms in all the timeframes, but we suggest you master it on a single timeframe first. Cheers!

Categories
Forex Basic Strategies Forex Trading Strategies

Trading False Breakouts Like a Professional Forex Trader

Introduction

Often there are times in the market when the price breaks a certain significant level, and most of the novice traders immediately jump into the market. But, suddenly, the price reverts quickly, stopping out these traders or putting them in a losing position. Most of the experienced traders would have exited their positions when they realized they are trapped by the big whales like industry or institutional traders.

But beginner traders often become the victims of these false breakouts, and it affects their psychology as well. They will start doubting their trading strategies, and the fear element will surpass their confidence. Instead of falling into the negative state of mind, traders should learn how to use these false breakouts to their advantage so that they can profit from it. In this article, let’s discuss how to trade the false breakouts properly.

Most of the traders often consider false breakouts as a negative thing in the market. The general perception is that, by trading the false breakouts, they are taking the unnecessary risk, or it is not the correct way to trade. Some traders also believe that simple breakouts are more comfortable to trade. It is true, but simple breakouts won’t provide a great risk-reward, and also, it is not a consistent way to trade the market. On the other hand, successful & experienced traders see the false breakout logically and consider it as an opportunity to make some quick profits.

There are a lot of ways to trade false breakouts. Some traders trade them in conjunction with indicators, and some use it with trend lines and support resistance. In this strategy, we will show you the most appropriate way of trading false breakouts.

Trading the false breakout by using the major S&R levels

False breakouts occur in all types of markets, such as Forex, Stocks, Futures, and Options. They also occur in all kinds of market conditions. But the critical thing to remember is that every false break out is not worthy enough to trade. Always consider trading the false breakouts by following the trend of the market. That is, if the trend is up, look for the buy-side false breakout and in a downtrend, look for sell-side false breakouts.

Step 1 – Find the trend of the higher timeframe

This step is simple yet crucial because we need to confirm the trend of the market. Keep in mind that most of the lower timeframes always follow the direction of the higher timeframe. To explain this strategy, we are examining the uptrend of the GBP/USD forex pair.

Step 2 – Look for the significant S&R in the lower timeframe

Most of the false breakouts occur near the support and resistance level. The reason brokers and market movers use these levels is to manipulate the market as is these areas act as a significant supply-demand zone. This makes it easier for the bigger players to fill more orders.

Step 3 – Look for the false breakouts at the S&R level

As we know by now, most of the false breakouts happen at major support resistance area. A trader can set the alarm on the price chart to see when the price action is at a major level. When the price breaks these levels, wait for the false breakout to trade the market.

In the below image, GBP/USD was in an uptrend. On 15 Min chart during the pullback phase, prices started holding at the support area. On 29th Nov, look at the first circle where the price action prints the false breakout. But there is no way to trade that breakout. Because after that, the price action dipped below the support area, which is a sign of a false breakout. So it is an indication to go long on the GBP/USD forex pair.

Step 4 – Entry, Stop loss and Take profit

A trader should be entering the market when the price action holds at the significant support resistance area as it confirms that the levels are active to hold the prices. \

Take profit placement depends on your trading style. If you are an intraday trader, we suggest you close your position at a recent high. If you are a swing trader, look for another false breakout to load more positions. You can also use the recent high or any support resistance area of the higher timeframe to close all of your positions.

Most of the false breakouts are sure shot trades in the market. Place the stop loss just below the recent low, or at the closing of the most recent candle. If you are a conservative trader, then put stop loss bit spacious to your entry point.

In the below image, we have placed the stop loss just below the closing of the recent candle, and we have captured the 4R trade in the market.

Bottom line

It is essential to learn the logic and psychology behind any false breakout. Most of the time, the risk is small in these types of trades, and it is important not to be greedy while placing more extended targets. If there is no momentum in the market, close your positions, and if the trend is healthy to go for longer moves. You can still trade the regular breakouts, but throw relatively less money when compared to the false breakout trades. Also, make sure to practice trading false breakouts in a demo account until you master it. We hope you liked this article. Cheers!

Categories
Forex Basic Strategies

Trading With The Bollinger Band %B Indicator

Introduction

If you have experience trading with the Bollinger Bands indicator, you will find it easy to trade with the Bollinger Band %B indicator. The only difference is that, in this indicator, you can identify the relationship between the price and the bands with at most clarity.

What is the Bollinger Band %B indicator?

It is basically a technical indicator that quantifies the price of an asset with respect to the upper and lower limits of Bollinger Bands. We have derived 6 relations between the price and the indicator.

  • The %B is at zero when the currency pair is at the lower band.
  • % B will be at 100 when the currency pair is at the upper band.
  • The indicator is above 100 when the price of the currency pair above the upper band.
  • It is below zero when the price goes below the lower band.
  • The %B is above 50 when the price goes above the middle band.
  • And it is below 50 when the price goes below the middle band.

The Bollinger band %B uses the 20-day simple moving average (SMA) as the default parameter, just like the Bollinger Bands. This indicator is available on most of the trading platforms and terminals.

Bollinger Band %B formula

%B = (Price – Lower Band) / (Upper Band – Lower band)

Things to know

Before understanding the strategy, it is necessary to know a few things about the indicator as these concepts will be used in every step of the strategy. Below is the chart of a forex pair with the Bollinger Band %B indicator plotted to it.

  • The upper dashed line represents the 100% level of the %B indicator also known as the upper band.
  • The lower dashed line represents the 0% level also known as the lower band of the indicator.
  • The area in between the two dashed lines is known as the middle band.

These bands help us in identifying different trading opportunities. Hence, one needs to know about it before knowing the strategy.

The Strategy

Step 1: Identify the major trend

To identify the overall trend of the market, the trader needs to shrink the chart and determine the trend.

An uptrend is defined as a series of higher highs and higher lows, while a downtrend is defined as a series of lower lows and lower highs. In this strategy, we have taken the example of a downtrend, as shown in the figure. One can also see lower lows and lower highs in the above chart.

Let us see how the strategy works.

Step 2: Find the price where %B is above 100 or below 0 in the currency pair.

In this step, we are looking for the price where the indicator is above the upper band or below the lower band. This extreme price action is said to continue for long after taking a suitable entry.

A sell setup is formed when the indicator crosses below the lower band, and a buy setup is formed when the indicator crosses above the upper band. This strategy is almost reverse of other strategies (as oversold indicates buying in other strategies).

The above chart shows the crossing of the indicator below the lower band, which is apt for a sell trade. Just because the price is below the dashed line, we cannot take an entry immediately.

The next step is to find a pullback and then make an entry. We will then see how and where to take profits.

Step 3: Take an entry only at a suitable pullback.

By suitable pullback, we mean the opposite color candles should not be swift candles and should not make higher highs. If this happens, the current trend can be weak and may not sustain. The %B indicator can also assist us with the same, as the indicator should move slowly after crossing the lower band. If the indicator reacts and moves fast, it means the pullback is strong and could also result in a reversal. Finally, an entry can be taken after the close of at least two pullback candles.

The below figure explains the above paragraph clearly.

Step 4: Determining how to take profit

In this strategy, we follow a rule-based system for making profits which are again based on our indicator. A trader needs to cover his position after the indicator crosses the lower band once again and goes above the dashed line. This style of taking profit is different than in other strategies where it is based on a fixed percentage. This way of taking profits ensures that a trader is trading based on rules and guidelines which is a disciplined approach.

The below figure explains how profit is taken and the position is covered.

When the indicator goes above the 0% (lower band) level after crossing below, it means profit can be taken now and the trade can be closed.

Step 5: Place a protective stop

Stop-loss is a mandatory and essential part of risk management, hence it needs to determined before entering a trade. For this strategy, stop-loss is placed above the high of the pullback which makes it an optimal place. The stop-loss, in this case, is very small which increases the risk to reward ratio (RR) considerably.

Here is exactly where it is recommended to put the stop loss.

The final trade setup would look something like this 👇

This results in a minimum of 2:1 RRR.

Final words

This is one of the easiest strategies which can be learned by new and experienced traders. It makes use of simple Bollinger bands added with a %B indicator. This indicator can also be combined with several other technical indicators and trading systems, but this alone, too, has a very good level of accuracy.  Now, we have to follow the money management principles to take the best trades and make huge profits from the same strategy. For this, you can also refer to our money management article series, which talks on various risk management topics. Cheers!

Categories
Forex Basic Strategies Forex Fibonacci

Perfecting The Fibonacci Retracements Trading Strategy

Introduction

The Fibonacci tool was developed by Leonardo Pisano, who was born in 1175 AD in Italy. Pisano was one of the greatest mathematicians of the middle ages. He brought the current decimal system to the western world ( learned from Arab merchants on his trips to African lands). Before that, mathematicians were struggling with the awkward roman numerical system. That advancement was the basis for modern mathematics and calculus.

He also developed a series of numbers using which he created Fibonacci ratios describing the proportions. Traders have been using these ratios for many years, and market participants are still using it in their daily trading activities.

In today’s article, we will be sharing a simple Fibonacci Retracement Trading Strategy that uses Fibonacci extensions along with trend lines to find accurate trades. There are multiple ways of using the Fibonacci tool, but one of the best ways to trade with Fibonacci is by using trend lines.

With this Fibonacci trading strategy, a trader will find everything they need to know about the Fibonacci retracement tool. This tool can also be combined with other technical indicators to give confirmation signals for entries and exits. It also finds its use in different trading strategies.

Below is a picture of the different ratios that Leonardo created. We will get into details of these lines as we start explaining the strategy.

Strategy Prerequisites

Most of the charting software usually comes with these ratios, but a trader needs to know how to plot them on the chart. Many traders use this tool irrespective of the trading strategy, as they feel it is a powerful tool. The first thing we need to know is where to apply these fibs. They are placed on the swing high/swing low.

  • A swing high is a point where there are at least two lower highs to its right
  • A swing low is a point where there are at least two higher lows to its right

If you are uncertain of what the above definitions meant, have a look at the below chart.

Here’s how it would look after plotting Fibonacci retracement on the chart.

In an uptrend, it is drawn by dragging the Fibonacci level from the swing high all the way to swing low. In case of a downtrend, start with the swing high and drag the cursor down to the swing low. Let’s go ahead and find out how this strategy works.

The Strategy

This strategy can be used in any market, like stocks, options, futures, and of course, Forex as well. It works on all the time frames, as well. Since the Fibonacci tool is trend-following, we will be taking advantage of the retracements in the trend and profit from it. Traders look at Fibonacci levels as areas of support and resistance, which is why these levels could be a difference-maker to a trader’s success.

Below are the detailed steps involved in trading with this strategy

Step 1 – Find the long term (4H or daily time frame) trend of a currency pair

This is a very simple step but crucial, as well. Because we need to make sure if the market is either in an uptrend or a downtrend. For explanation purposes, we will be examining an uptrend. We will be looking for a retracement in the trend and take an entry based on our rules.

Step 2 – Draw a line connecting the higher lows. This line becomes our trendline.

The trend line acts as support and resistance levels for us. In this example, we will be using it as support.

Step 3 – Draw the Fibonacci from Swing low to Swing high

Use the Fibonacci retracement tool of your trading software and place it on swing low. Extend this line up to the swing high. Since it is an uptrend, we started with a 100% level at the swing low and ended with 0% at the swing high.

Step 4 – Wait for the price to hit the trend line between 38.2% and 61.8% Fibonacci levels.

In the below-given figure, we can see that the price is touching the trend line at two points (1 and 2). There is a significant difference between the two points. At point 1, the price touches the trend line between 78.6% and 100%, whereas, at point 2, the price touches the trend line between 38.2% and 61.8%.

The region between 38.2% and 61.8% is known as the Fibonacci Golden Ratio, which is critical to us. A trader should be buying only when the price retraces to the golden ratio, retracements to other levels should not be considered. Therefore, point 2 is where we will be looking for buying opportunities.

Step 5 – Entry and Stop-loss

Enter the market after price closes either above the 38.2% or 50% level. We need to wait until this happens, as the price may not move back up. However, it should not take long as the trend should continue upwards after hitting the support line.

For placing the stop loss, look at previous support or resistance from where the price broke out and put it below that. In this example, stop loss can be placed 50% and 61.8% Fibonacci level because if it breaks the 50% level, the uptrend would have become invalidated. The trade would look something like this.

Final words

The Fibonacci retracement tool is a prevalent tool used by many technical traders. It determines the support and resistance levels using a simple mathematical formula. Do not always rely only on Fibonacci ratios, as no indicator works perfectly alone. Use additional tools like technical analysis or other credible indicators to confirm the authenticity and accuracy of the generated trading signals. One more important point that shouldn’t be forgotten is not to use Fibonacci on very short-term charts as the market is volatile. Applying Fibonacci on longer time frames yield better results.

We hope you find this strategy informative. Try this strategy in daily trading activities and let us know if they helped you to trade better. Cheers!

Categories
Forex Basic Strategies

Heard Of The Amazing ’20 Pips Per Day’ Strategy?

Introduction

Forex is the most liquid and volatile market in the world. The average pip movement in the major currency pairs is around 100 pips. However, as a retail trader, it is not impractical to grab 100 pips every single day. Though there are some strategies out there, it is very challenging to make 100 pips per day every day. But, there is 20 pips strategy, 30 pips strategy as well as 50 pips strategy, which is much reliable than the 100 pips strategy. So, in this lesson, we shall be discussing the 20 pips strategy.


The 20 Pips Strategy


The strategy is very simple and straightforward. According to this strategy, when the price breaks above a range in a logical area, you must go long, and when it breaks below a range in a logical area, you must go short. So, this strategy is basically a breakout strategy. However, it’s not as straightforward as it sounds. There are some criteria one must consider before trading this strategy.

❁ Considerations

Currency Pair

You can trade this strategy on any currency pair. However, it is recommended to focus mainly on major and minor currency pairs.

 Session

Though the market is open 24 hours, it does not mean you can apply this strategy any time during the day. To keep it safe, it is advised to trade only during the times when there is high liquidity. That is, the London – New York overlap would be the best time to apply this strategy. Else, the London session or the New York session will work perfectly fine as well. And it is great if you do not trade it during the Asian session, as markets don’t usually break out during this period.

 Timeframe

Timeframe plays an important role when it comes to trading a strategy of this type. To make 20 pips a day, it is ideal to stay between the 1hour timeframe and the 15-minute timeframe.

Indicators

This strategy does not require any technical indicators.

How to trade the 20 pips strategy

Below is a step by step process to trade this strategy.

  1. Open the candlestick chart of any currency pair, preferably, a major or minor currency pair.
  2. Firstly, go to the 1-hour timeframe in the chart and see if the market is in a logical area to buy or sell (Ex: Support and resistance).
  3. If yes, then wait for the price to break above or below the consolidation area.
  4. Check the strength of the breakout on the lower timeframe (15 minutes). Based on the strength, prepare to hit the buy or sell.

 Trading the 20 pips strategy on the live charts

• Buy example

Below is the chart of AUDUSD on the 1-hour timeframe. We can see that the market has been bouncing off from the purple line. So, this becomes a logical area to buy. At present, the market is holding at the purple support line. And it was in a tiny range for like ten candles. Now, to apply the strategy, we need the market to break above this range.

In the below image, we can see that the market breaks above the range with a big green candle. But, before hitting the buy, we must switch to the lower timeframe and see if the momentum of the candle that broke the range was strong or not.

In the below 15 min chart, we can clearly see that the broke above the range in just two green candles. This is an indication that the buyers have come up strong. Hence, now we can prepare to go long.

Coming to the take profit and stop loss, the take profit would, of course, be 20 pips, and the stop loss can be kept a few pips below the support area. Alternatively, you can even go for a 1:1 RR by keeping a stop loss of pips.


• Sell example

Note that this strategy can be applied when the market is in a trending state as well. Below is the chart of EUR/USD on the 1-hour timeframe, and we can see that the market is in a downtrend. The market keeps making lower lows and lower highs. At present, it can be seen that the market is pulling back, and a green candle has appeared. Now, all we need is the price to break below the pullback to give us a heads up that the downtrend is still active.

In the below chart, we can see that, in the very next candle, the market broke below the pullback area. Hence, we can prepare to go short after getting confirmation of the strength from the lower timeframe.

In the below 15-minute timeframe chart, we can see that the momentum of the candle was sufficiently robust during the breakout. Hence, we can consider shorting in now.

As far as the take profit and stop loss are concerned, it remains the same as the previous example. That is, 20 pips take profit with 20 pips stop loss.

Bottom line

A great feature to consider about this strategy is that it can be used in any state of the market. However, all the criteria mentioned above must be met for the strategy to work. If you’re a beginner in trading, then this could be an ideal strategy to get started with. And if you have experience in trading, you can try enhancing the strategy by applying some indicators and patterns.

Note that this strategy, just like other strategies, does not provide 100% accuracy. There are times when this strategy fails, as well. Hence, it is recommended to use this strategy in conjunction with other strategies to have a better winning probability. Happy Trading!