Categories
Forex Basic Strategies

Pairing Significant S&R Levels With RSI Indicator To Generate Accurate Trading Signals

Introduction

In the previous set of articles, we discussed strategies based on trend continuation or trend reversal. Let us change the subject a little bit and discuss a strategy based on ‘Support and Resistance.’ Although we all know how to trade support and resistance, there is always a problem of consistency when it comes to trading using the conventional support and resistance strategy. We have a look into some of these issues by designing a strategy that provides not only decent risk-to-reward (RR) but also a high probability of success.

Markets are continually changing due to changes in market participants, global politics, and economic events. This means if we continue to trade the usual way, we could be in trouble. It is necessary that, along with markets, we, too, change our trading strategy in order to adapt to the changing market environment.

Time Frame

The strategy works well on the 1-hour, 4-hour, and ‘Daily’ time frame. Therefore, the strategy is suitable for the swing to long-term traders.

Indicators

We make use of only one technical indicator in the strategy, and that is the Relative Strength Index (RSI) with its default settings.

Currency Pairs

The strategy is suitable for trading almost all currency pairs listed on the broker’s platform. One thing we need to ensure before choosing a currency pair is that it should be volatile.

Strategy Concept

‘Cup and Handle’ is a powerful candlestick pattern that shows the prevalence of bullish strength in the market. It is a very reliable pattern that offers excellent trading opportunities. ‘Cup’ formation indicates that the price was unable to make a proper ‘lower low’ on the higher time frame due to a strong buyer who took the price up. The ‘handle’ indicates that the market was unable to reach the previous ‘low’ due to weak sellers where eventually buyers bought at a higher price and are in the process of making a new ‘higher high.’

The logic behind the formation of the ‘Cup and Handle’ pattern makes it one of the most powerful patterns. But the pattern alone is not the basis for the strategy; we also use the RSI to take the highest probability trades. We apply the concept of ‘Cup and Handle’ pattern and RSI indicator at a long-term ‘Support’ level to execute low-risk ‘long’ trades.

The same concept applies when taking ‘short’ trades at long-term ‘Resistance’ level. Here we should look for the formation of the ‘Inverse Cup and Handle’ pattern at ‘Resistance.’ ‘Cup’ here indicates that the price was unable to make a proper ‘higher high’ on the higher time frame due to strong seller who crashed the price. The ‘handle’ indicates that the market was unable to reach the previous ‘high’ due to weak buyers where eventually sellers sold at a lower price and are in the process of making a new ‘lower low.’ We use the RSI indicator to take the highest probability trades by looking for ‘overbought’ and ‘oversold’ situations in the market.

Trade Setup

In order to use the strategy, we have considered the 4-hour chart of AUD/USD, where we will be illustrating a ‘long’ trade using the rules of the strategy.

Step 1:
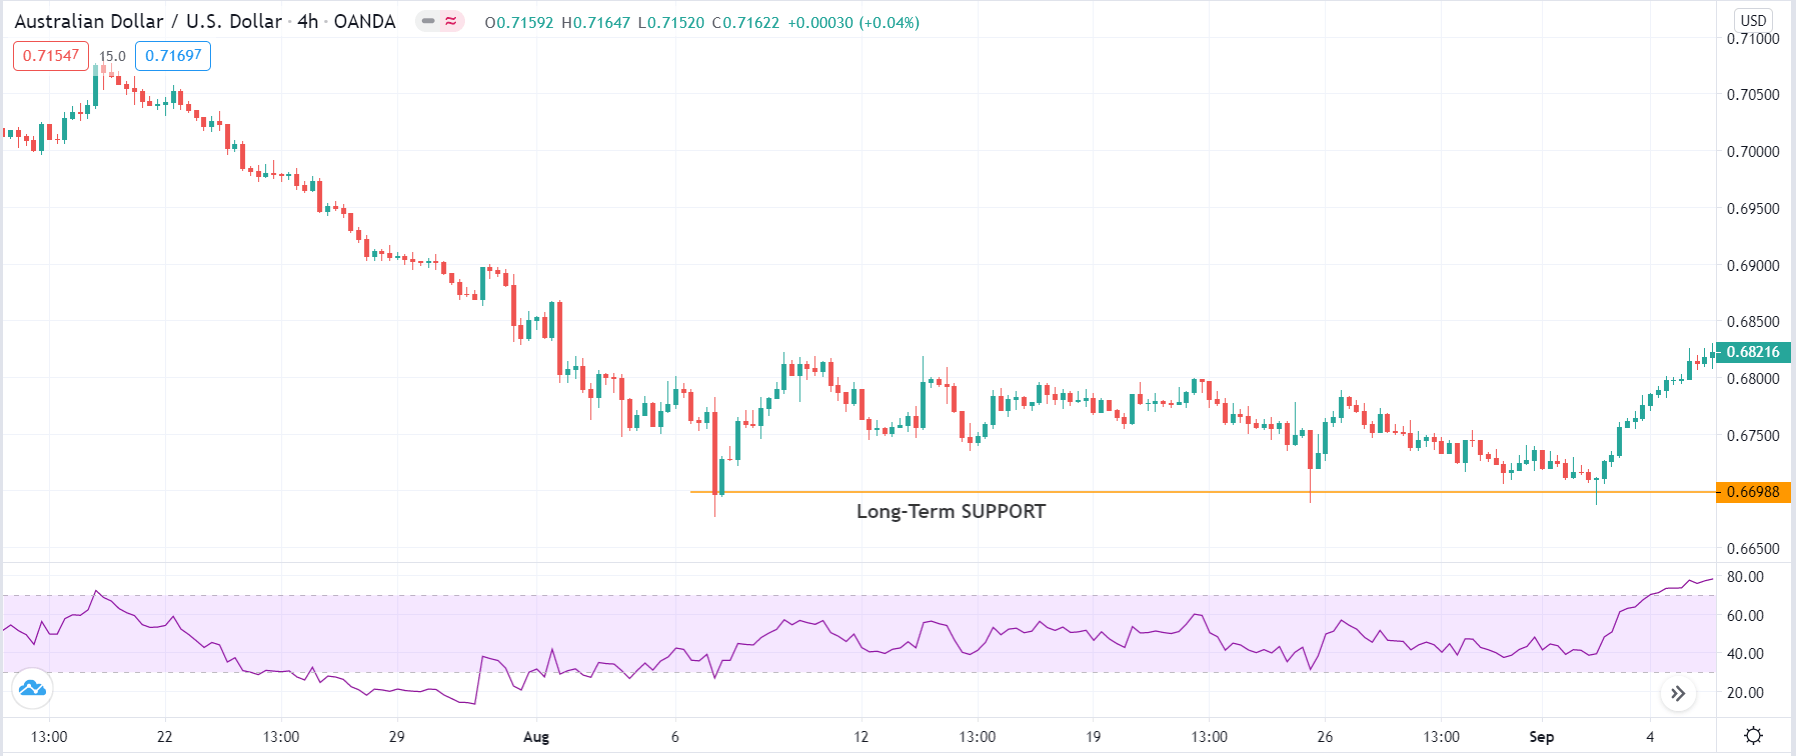
The first step is to identify long-term support and resistance levels. By long-term we mean, support and resistance levels on the 1-hour time frame and above. Note that the greater number of touches, the stronger is the support or resistance. We would recommend at least three touches at the support or resistance to calling it a strong one. To raise the odds in our favour, we can look for trading at support level in an uptrend and resistance in a downtrend.
The below image shows long-term support being formed in the AUD/USD pair on the 4-hour chart.

Step 2:
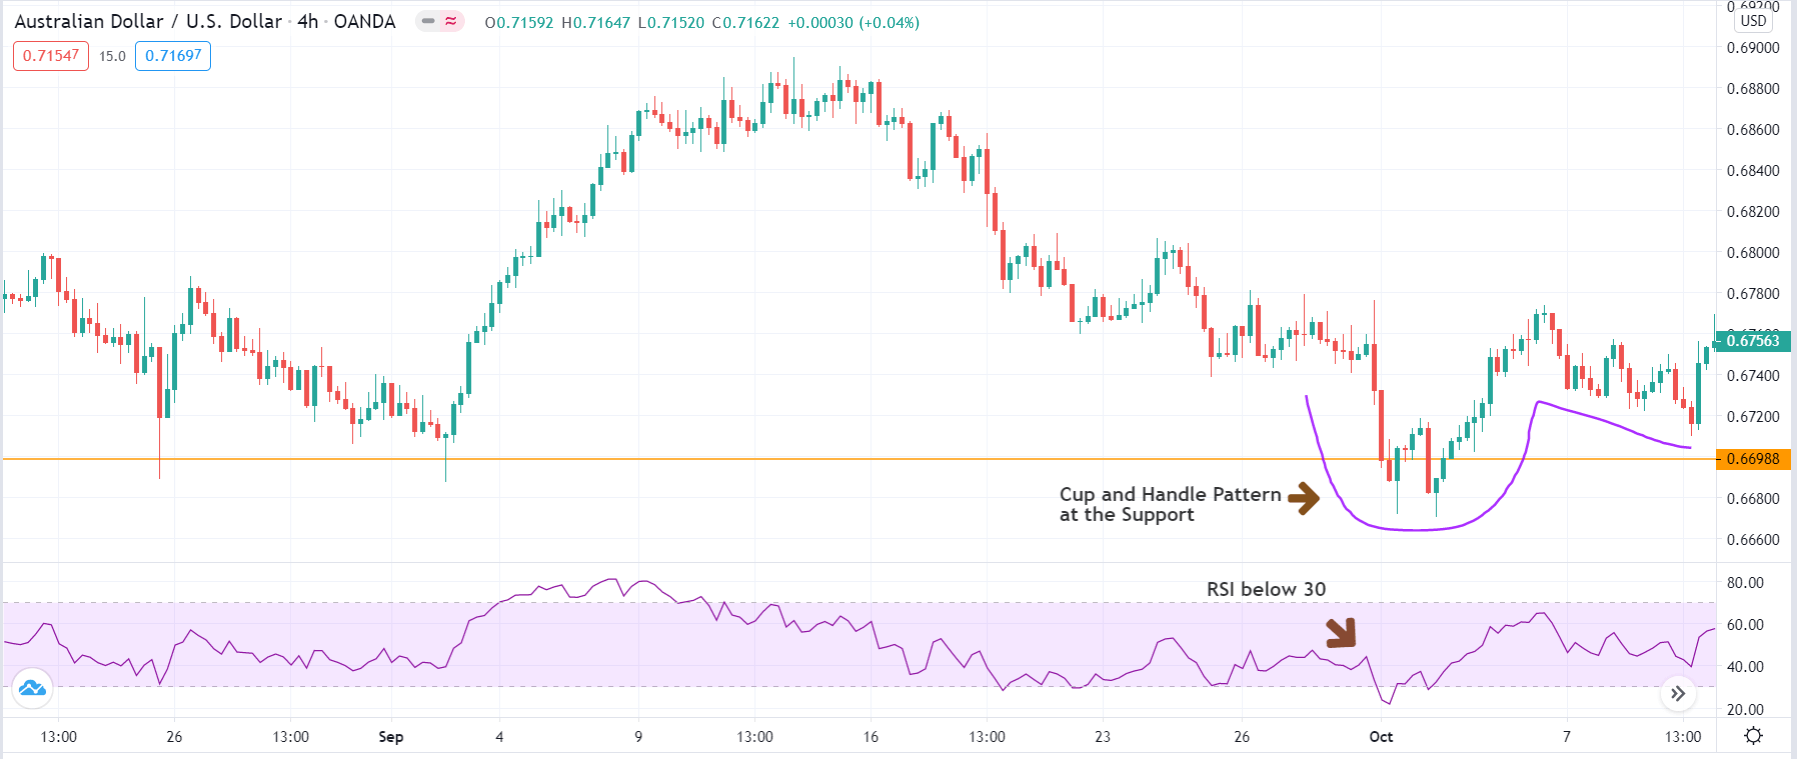
Once we have identified the critical technical level, we will wait for the price to present the ‘cup and Handle’ pattern at support and ‘Inverse Cup and Handle’ pattern at resistance. Here we should make sure that when the price at support, the RSI indicates an oversold (below 30) situation in the market at least once and then shows up the pattern. On the other hand, when the price is at resistance, the RSI should cross above the level of 70, indicating an overbought situation and then show up the ‘Inverse cup and handle’ pattern.

Step 3:
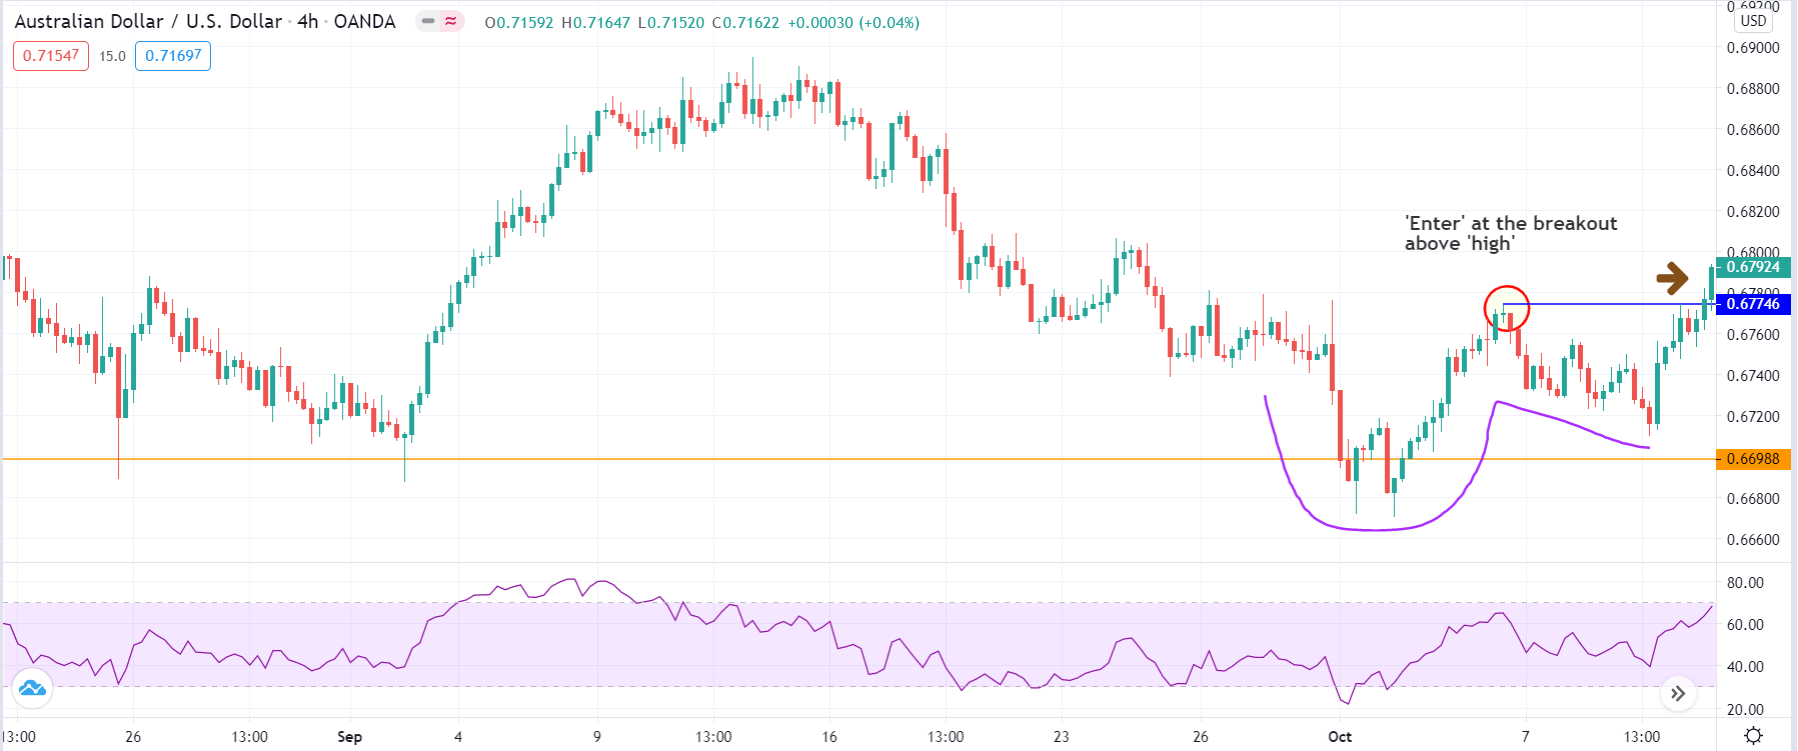
After ensuring that the pattern is formed at the right place along with suitable indications from the RSI, we now discuss how to enter the trade. In a ‘cup and handle’ pattern, we enter ‘long’ right at the price break out above the ‘high’ of ‘cup’ pattern. In an ‘inverse cup and handle’ pattern, we enter ‘short’ when ‘price’ breaks below the ‘low’ of the ‘cup’ pattern.
The below image shows an example of we enter for a ‘buy’ at ‘support.’

Step 4:
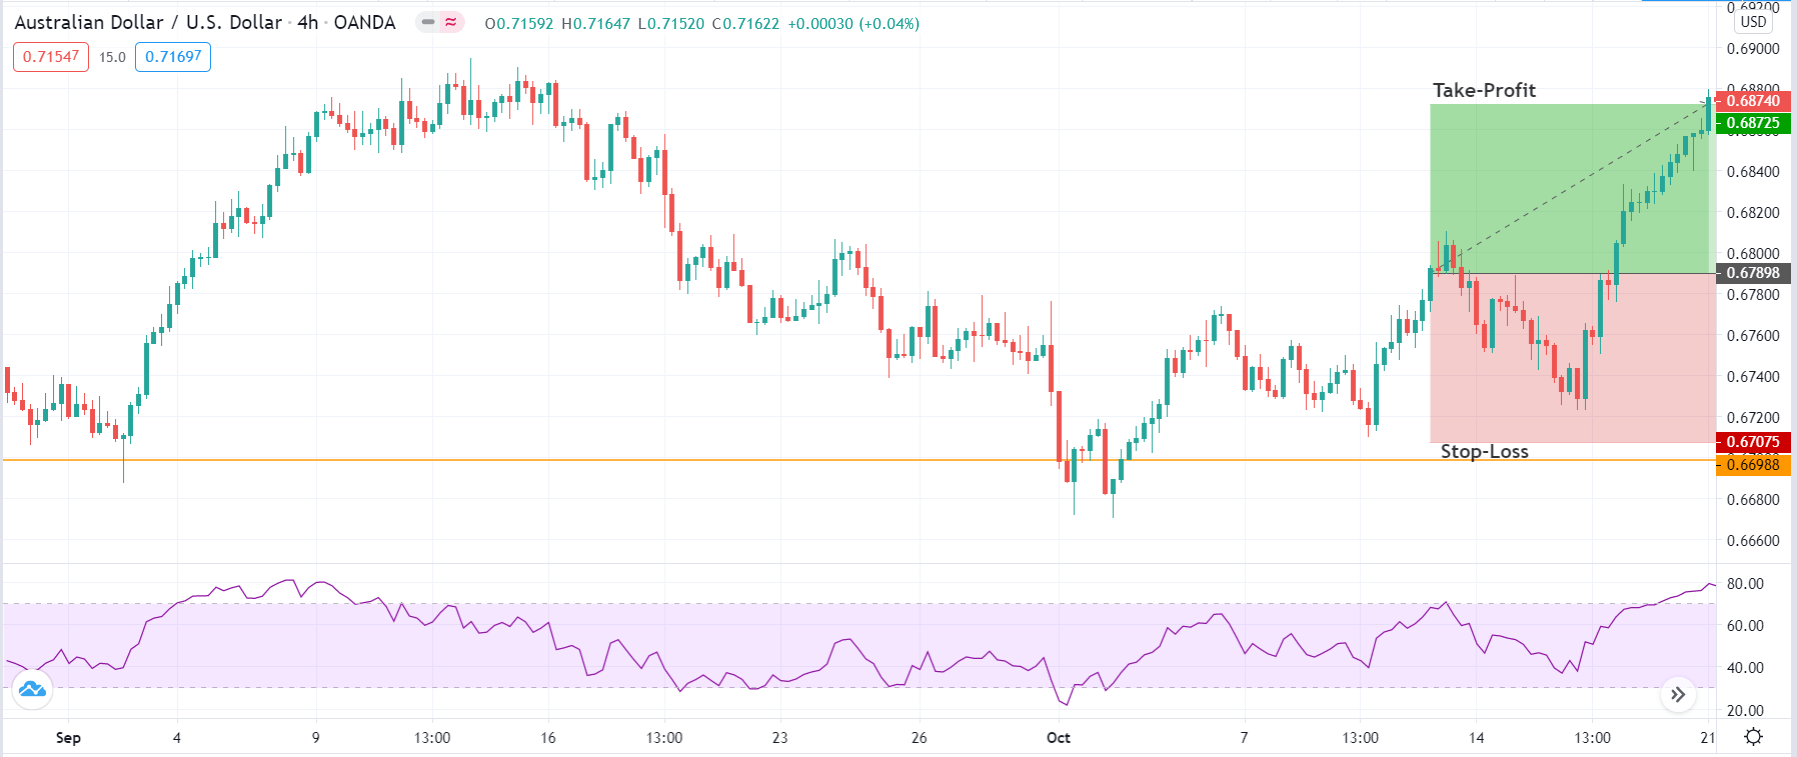
After entering, it is essential to determine the stop-loss and take-profit levels for the trade. One of the primary reasons behind low risk-to-reward (RR) ratio is late ‘entry.’ Stop-loss is placed below the ‘low’ of the ‘handle’ pattern in a ‘long’ position and above the ‘high’ of the ‘handle’ pattern in a ‘short’ position. The strategy essentially says to enter when prices have travelled a decent amount of distance from support or resistance, which considerably reduces the risk-to-reward (RR) ratio.
The below image shows the result of the trade executed using the above strategy where the resultant risk-to-reward (RR) of the trade is 1:1.

Strategy Roundup

Although the ‘Cup and Handle’ pattern is a bullish continuation pattern, if we understand the logic of the pattern and apply at key technical levels, it can provide excellent opportunities for short as well as long-term traders. Using the RSI indicator along with the pattern gives an extra edge to the strategy, which makes it highly suitable in changing market environment.

Categories
Forex Basic Strategies

Learning To Trade The ‘Make Your Wish’ Forex Trading Strategy

Introduction

The ‘make your wish’ strategy is based on one of the most popular candlestick patterns, i.e., the Shooting Star. As we all are aware that it looks similar to an inverted hammer, we try to develop a strategy that gives us the ability to capture small bearish reversal in the market. This pattern can prove to be a very “dangerous” pattern if developed at the right location.

Once we comprehend the importance of shooting stars, we discover that one candle pattern has such a power that it can signal the reversal of a strong bullish trend. Very few people take the risk of trading reversal, as this type of trading has badly hurt the trading accounts of many.

Today’s strategy will address this issue and will show how we can catch a falling knife without cutting off our fingers. The ‘make your wish’ can help us spot the top of the market and how to trade it properly. As Shooting stars are believed to make our wishes come true, we have named this strategy as ‘Make Your Wish,’ hoping that the strategy makes our wish of winning come true.

Time Frame

This strategy can only be traded on very short-term price charts such as 5 minutes or 1 minute. Hence, this is a perfect, intraday trading strategy.

Indicators

We make use of just one technical indicator in this strategy, and that is the Chaikin Oscillator.

Currency Pairs

The most suitable currency pairs are EURUSD, USD/JPY, GBP/USD, AUD/USD, GBP/AUD, USD/CAD, GBP/JPY, and CAD/JPY. Minor and exotic pairs should completely be avoided.

Strategy Concept

The ‘make your wish’ strategy is a very simple and effective technique to use in the forex market. Since most traders are interested in day trading and scalping, there isn’t a better strategy to use for that. The strategy is based on the simple concept that when the market moves sharply in one direction, it needs to ‘pullback’ at some of the time that will lead to a decent retracement in the price to the next technical level. The ‘shooting star’ helps us identifying the time when retracement will start.

Here, we take advantage of this retracement and try to particulate in the short-term reversal of the market. As this can involve high risk, we cannot solely rely on a candlestick pattern and use a technical indicator to give us the extra confirmation. We use the ‘Chaikin Oscillator, ’ which is designed to anticipate directional changes in the market by measuring the momentum behind the movements. Anticipating change in direction is the first step to identifying a change in the trend. But this also isn’t enough for forecasting a reversal, which we shall in detail in the future course of the detail.

The risk-to-reward (RR) of the trades will not be high as we are trading against the trend of the market, which may not be suitable for high ‘RR’ seekers. But at the same time, the probability of success is high for trades executed using this strategy.

Trade Setup

In order to execute the strategy, we have considered the 5-minute chart of where we will be illustrating a ‘long’ trade. Here are the steps to execute the strategy.

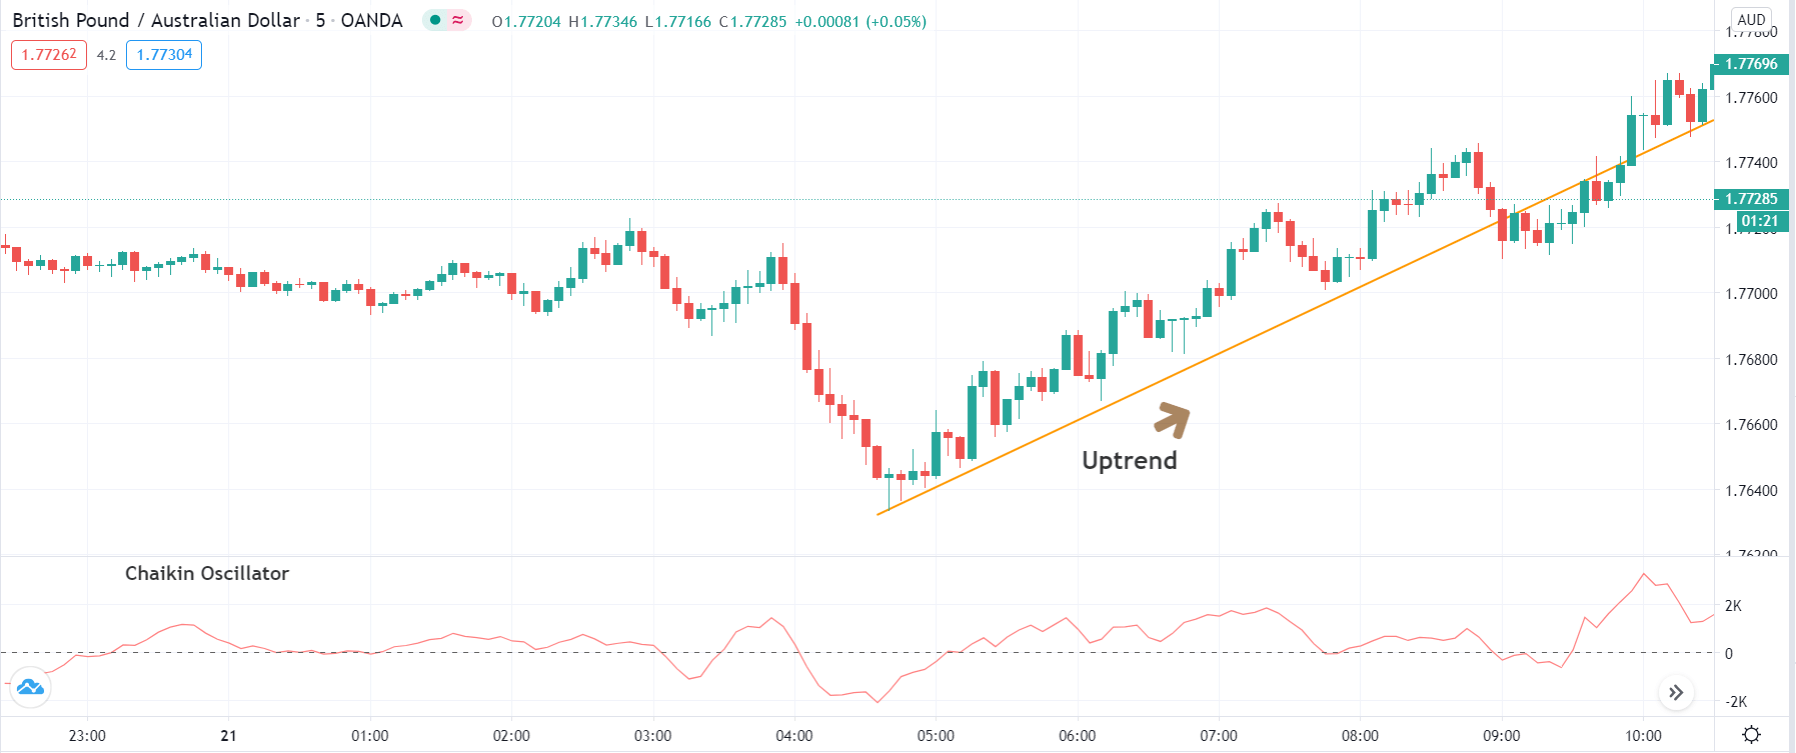
Step 1: Firstly, we identify the trend of the market by plotting a trendline. If the price bounces off from the trendline, each time it comes close to it, we can say that the market is trending. Here we should make sure that the price is not violating the trendline multiple times. This also means that there are no deeper retracements in the trend, which is desired for the strategy. The trendline is plotted by connecting the ‘highs’ and ‘lows’ of the market.

The below image shows that GBP/AUD is in a strong uptrend.

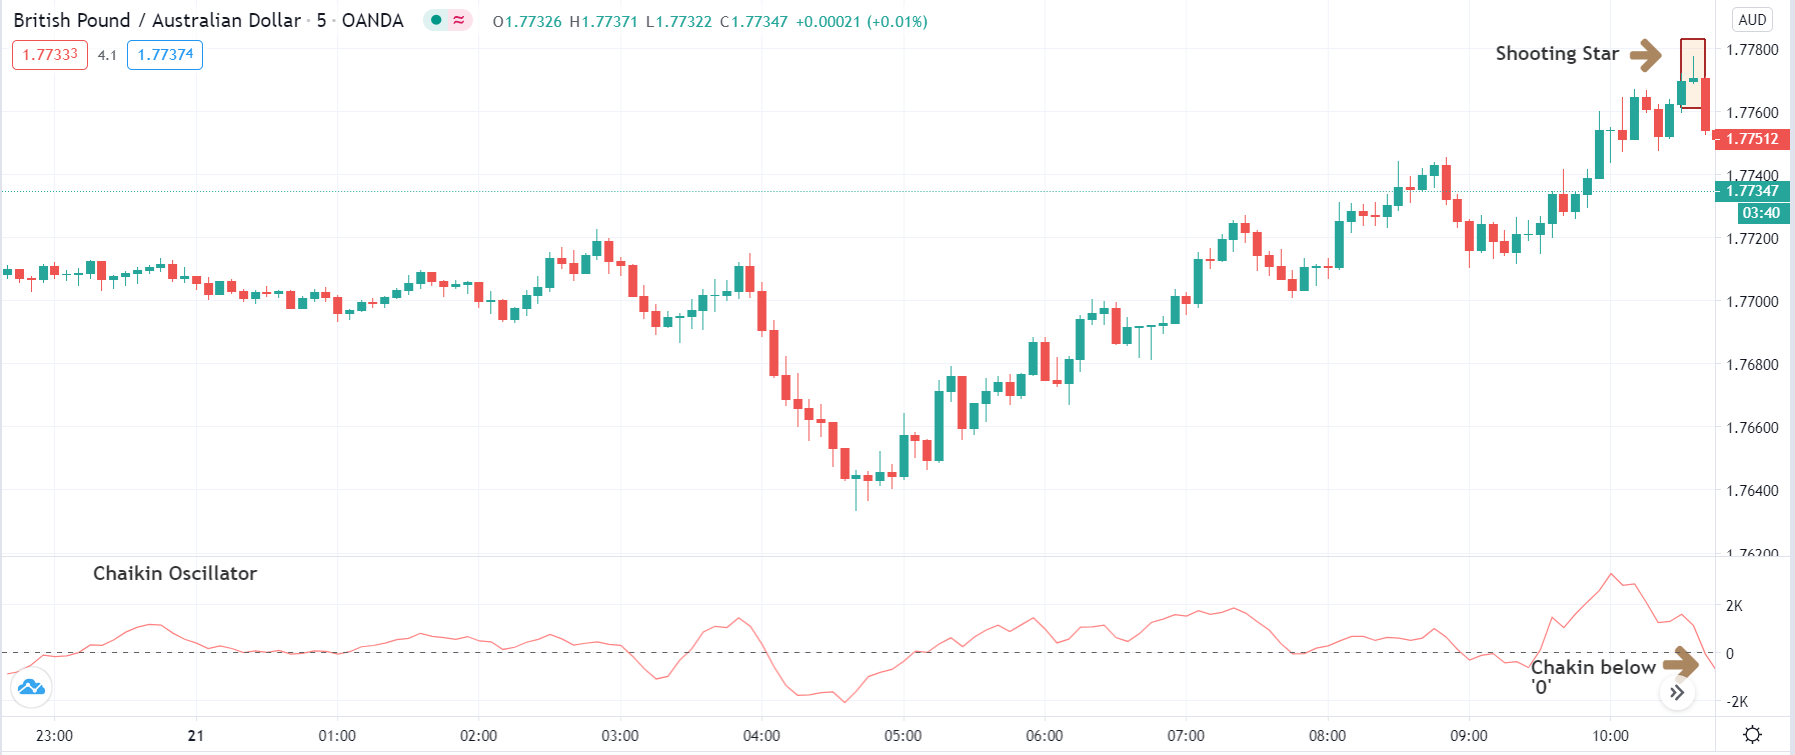
Step 2: Next, we wait for the ‘Shooting star’ candlestick pattern to appear in the trend. Once the pattern shows up on the chart, we look at the Chaikin oscillator and make a note of its reading. When this ‘rejection’ pattern appears in an uptrend, it indicates a reversal of the trend if the Chaikin oscillator starts moving lower and slips below the ‘0’ level.

When this ‘rejection’ pattern appears in a downtrend, it indicates a reversal of the trend if the Chaikin oscillator starts moving upwards and moves from negative to positive territory. When both these criteria are fulfilled, reversal is imminent in the market. But we cannot enter the market as yet.

The below image shows how the pattern emerges on the chart along with a falling Chaikin oscillator.

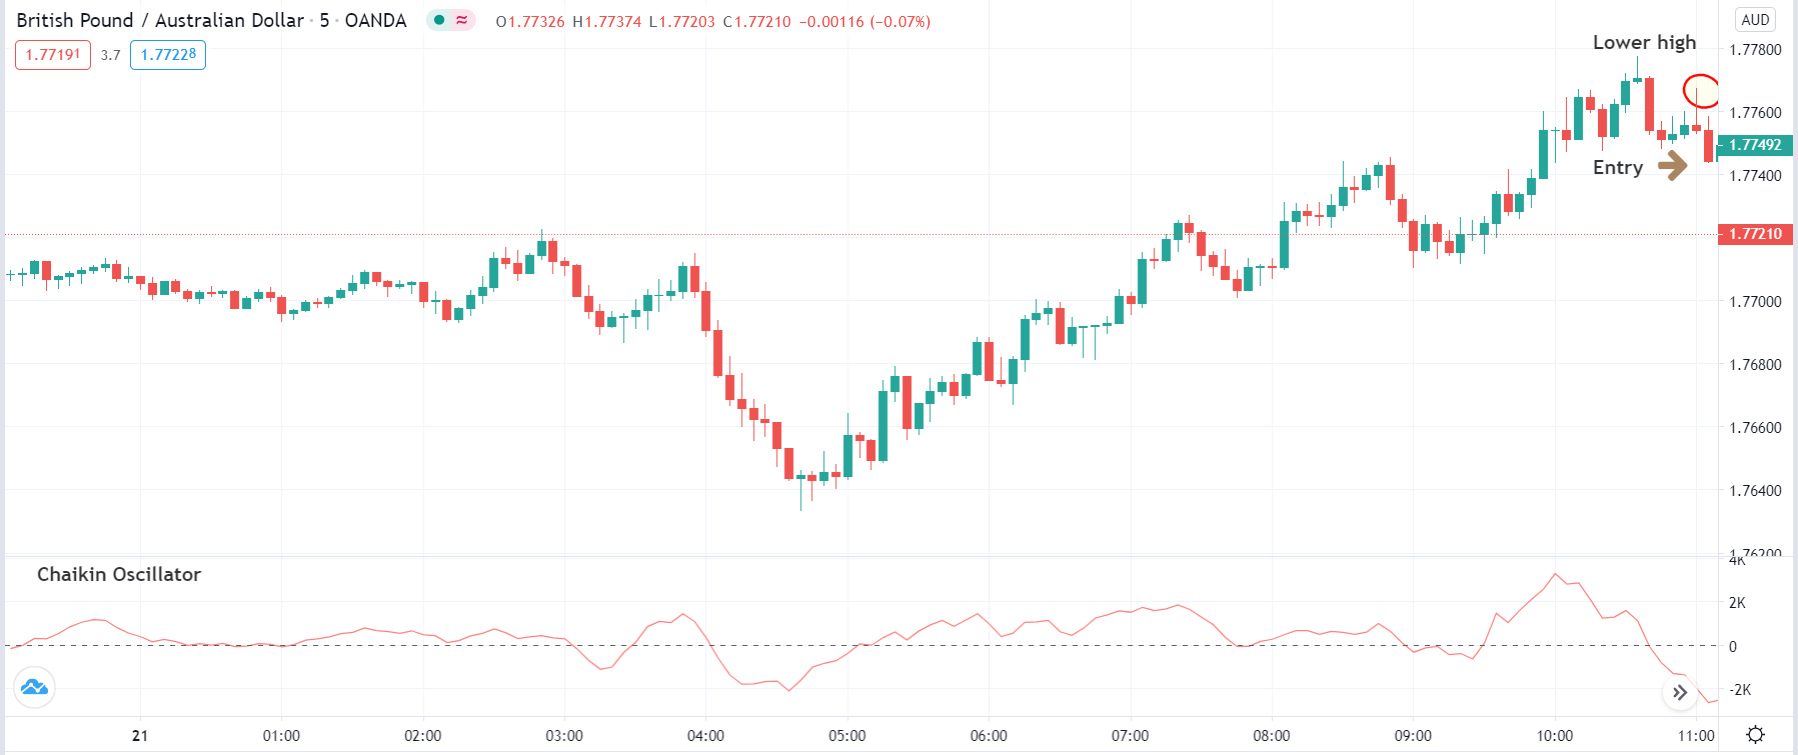
Step 3: It is important to note that we enter the market soon after the appearance of the pattern. After the formation of the pattern, it is necessary to wait for a ‘lower high’ in case of an uptrend reversal and a ‘higher low’ in a downtrend reversal.

The below image shows the formation of  ‘lower high’ after the appearance of the ‘shooting star’ pattern, which is the final confirmation for entering the trade.

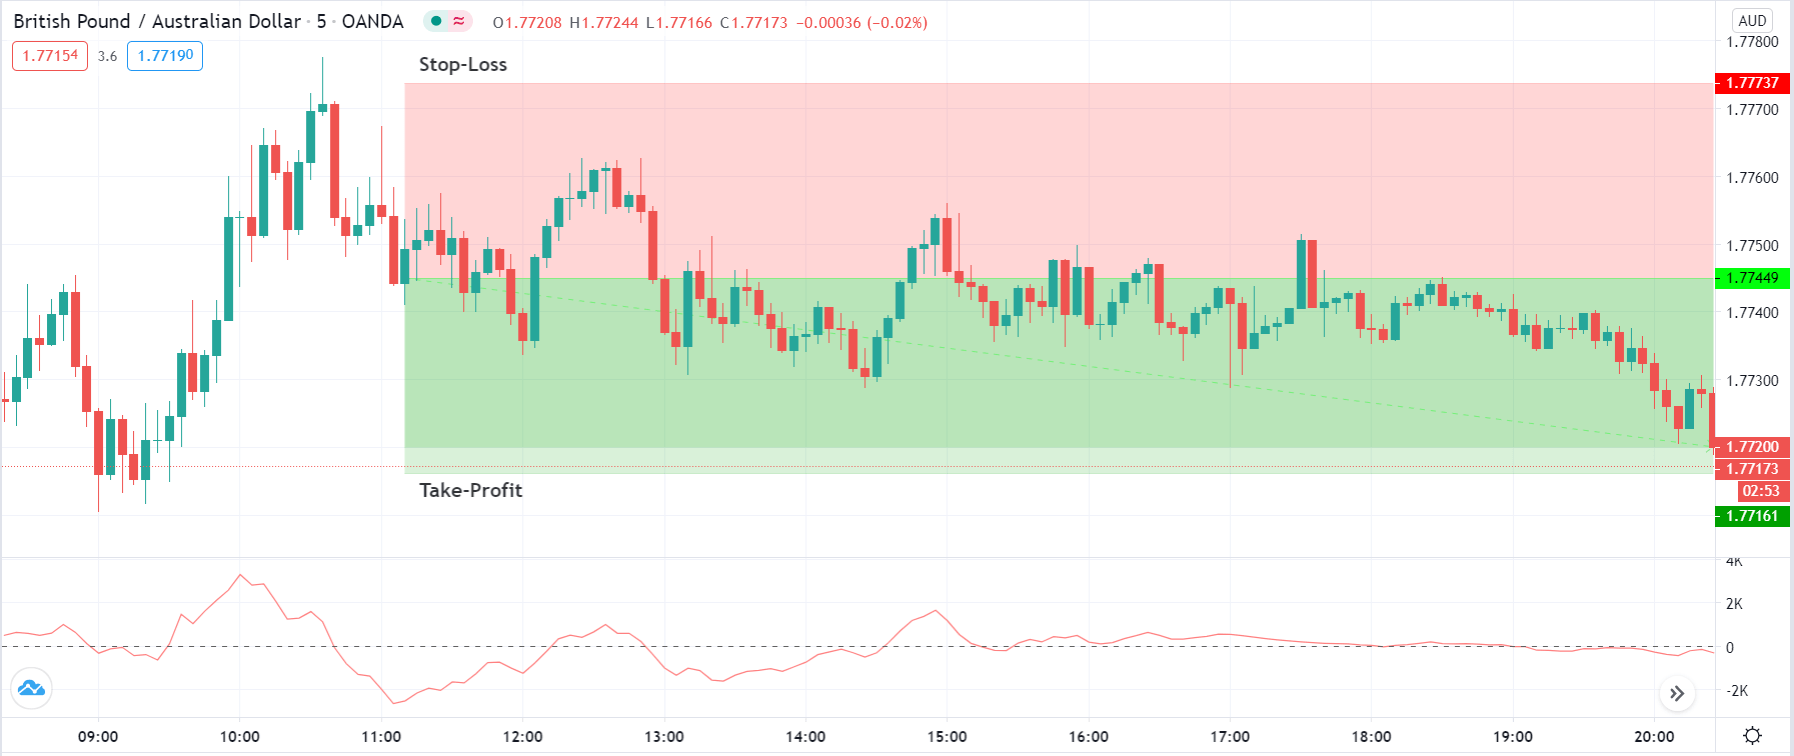
Step 4: Now, let us determine the stop-loss and take-profit levels for the strategy. Setting the stop-loss is pretty simple, where it is placed above the ‘lower high’ in a ‘long’ trade and below the ‘higher low’ in a ‘short’ trade. The take-profit is set at a price where the distance of take-profit from the point of ‘entry’ is equal to the distance of ‘stop-loss.’ That means the risk-to-reward (RR) of trades executed using this strategy is not more than 1:1. The reason for low RR is because we are trading against the trend of the market. Hence there is a possibility that the market might start moving in its major direction.

Strategy Roundup

A lot of traders warn against reversal trading, but finding top and bottom in the market and trading reversal can be done successfully if we have a proven methodology like the ‘make your wish’ strategy. We need to take into consideration all the rules outlined in this strategy guide other than just looking for the ‘shooting star’ pattern.

Categories
Forex Basic Strategies

A Brand New Forex Trading Strategy By Combining The ‘Flag & Pennant’ Patterns

Introduction

Until now, we discussed a bunch of trading strategies that were based on numerous technical indicators. In today’s article, we discuss a strategy that is based on a candlestick pattern. Flags and Pennants are short-term continuation patterns where the market tends to continue moving in the same direction after the formation of the pattern on the chart. These patterns are found on both short-term and long-term charts.

In the case of Flag, the initial move is a sudden, sharp directional move. It is doesn’t matter where the move is formed on the chart; what matters here is the velocity of the move. If the movement is not sharp and large, the reliability of the pattern will be under question. However, it will also use the volume indicator to confirm the strength of the Flag and pattern. Let us understand all the specifications of the strategy in detail.

Time Frame

As mentioned earlier, the Pennant-Flag strategy can be traded on time frames varying from 15 min to ‘Daily.’

Indicators

The only indicator we will be is the ‘Volume’ indicator. The rest of all is based on candlestick and price action patterns.

Currency Pairs

The strategy can only be used on major currency pairs listed on the broker’s platform. Few preferred pairs are EUR/USD, USD/JPY, GBP/USD, GBP/JPY, EUR/JPY, etc.

Strategy Concept

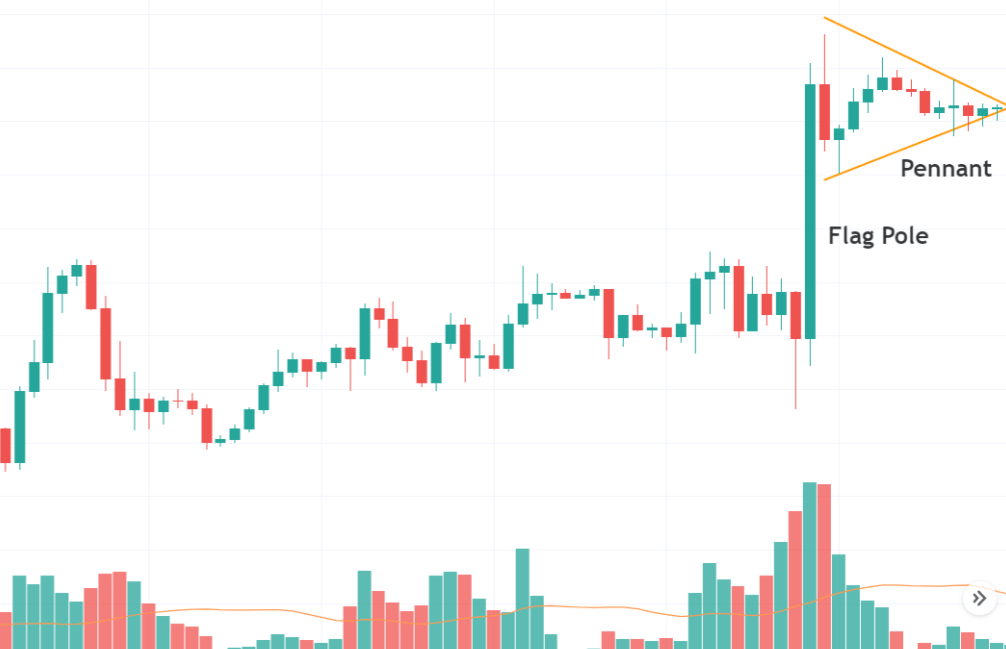
The strategy is based on the concept of the Pennant Candlestick Pattern. A sharp thrust creates a flagpole, and then when the market begins to consolidate into an asymmetric triangle, we wait for a breakout or breakdown. The consolidation is a brief pause before a potential break on either side. If the price clears the top of the ‘Pennant,’ we look for ‘long’ trades, and if breaks below the bottom of the ‘Pennant,’ we look for ‘short’ trades.

After a large vertical flagpole and a triangular consolidation, the market might be getting ready for a further continuation. The odds of a breakout increase when this pattern is accompanied by high volume. In a bullish flagpole, we place our ‘entry’ order above the ‘high’ of the flagpole, and in a bearish flagpole, we place our order below the ‘low’ of the Flag. Of course, when we enter, we’ll need to place a stop.

The stop is calculated by measuring the number of pips that is equivalent to 35-40 percent of the flagpole. For example, if the height of the flagpole is 100 pips, the stop will be placed 25 beneath the entry point.

Finally, we will need to define exits for our trade. Our first target will be equal to the number of pips that we are risking on the trade. Another strategy is to trail the stop-loss trade and exit when the market shows signs of reversal. Let us look at the specifics of the pattern and technique to make winning trades.

Trade Setup

In order to explain the strategy, we have considered the 4-hour chart of EUR/USD, where we will be illustrating a ‘long’ trade. Here are the steps to execute the strategy.

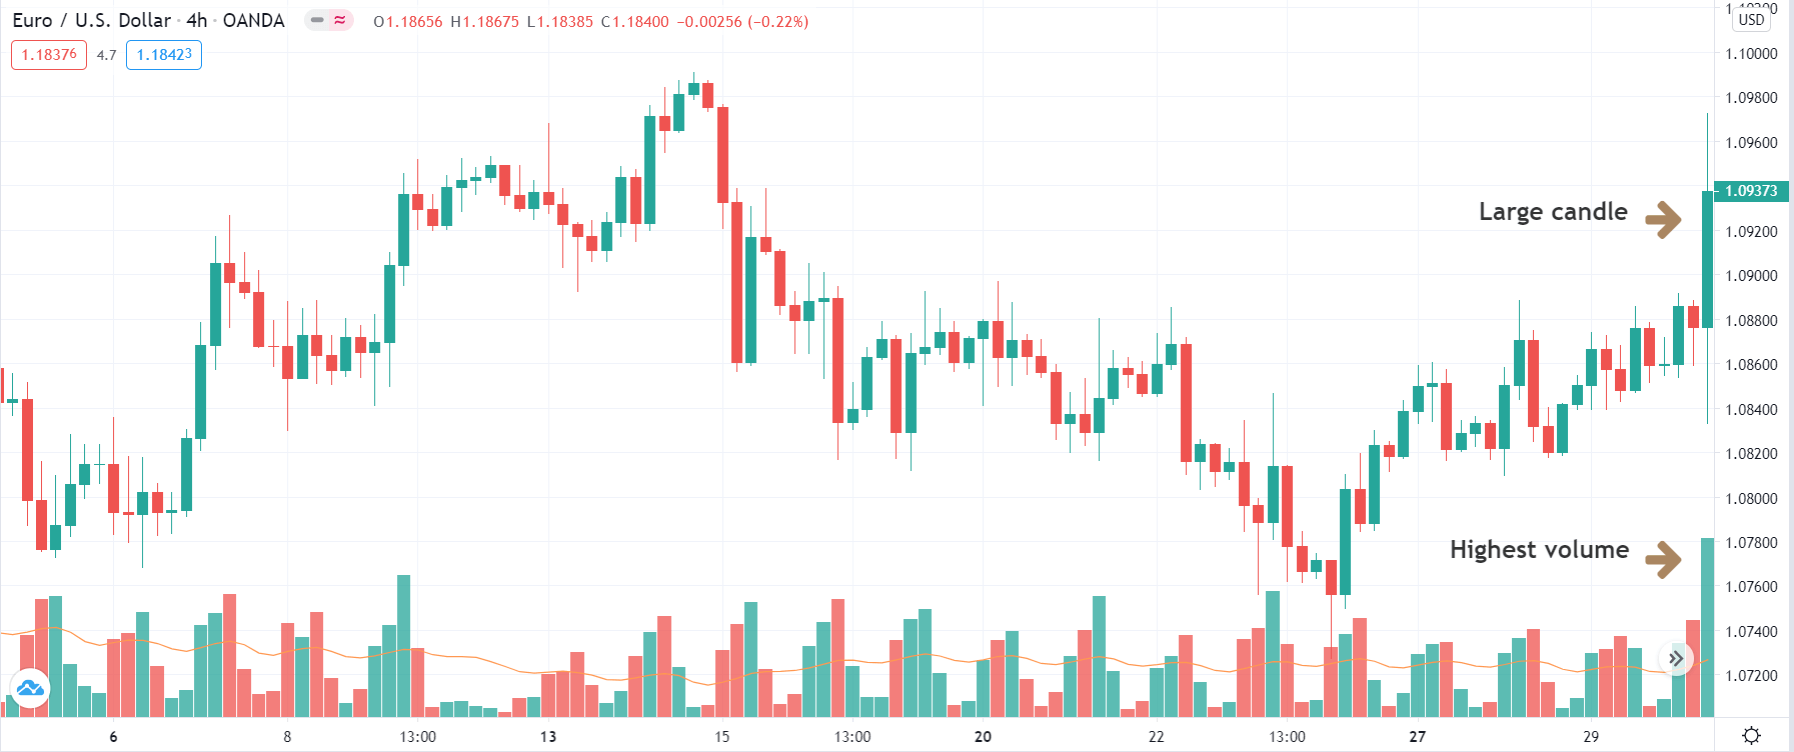
Step 1: The first step of the strategy is to wait for a sharp, sudden, and strong candle to show up on the chart. This usually happens after a major news announcement or after the release of economic data. This candle should compulsorily be with high volume as it indicates that big players of the market created this move. If the candle is not with high volume, the move cannot be trusted upon. We could use the economic calendar to find out the exact time of news release and the event.

In the below image, we can see a large candle that popped up after a news announcement that took the prices sharply higher.

Step 2: After the sudden move, prices should necessarily move in a triangular pattern, which is shrinking in nature. Few traders also refer to this as ‘squeeze.’ This pattern should be formed on the lower time frame. Market moving in this ‘squeeze’ pattern is very important for the strategy to work at its best. This leads to the formation of a Pennant candlestick pattern. Pennants involve two parts – a vertical flagpole and a triangular consolidation. The consolidation is usually for a shorter duration of time. Once the pattern has been formed along with the necessary conditions, let us see how to enter a trade.

The below image shows the formation of a Pennant candlestick pattern on the 1-hour chart.

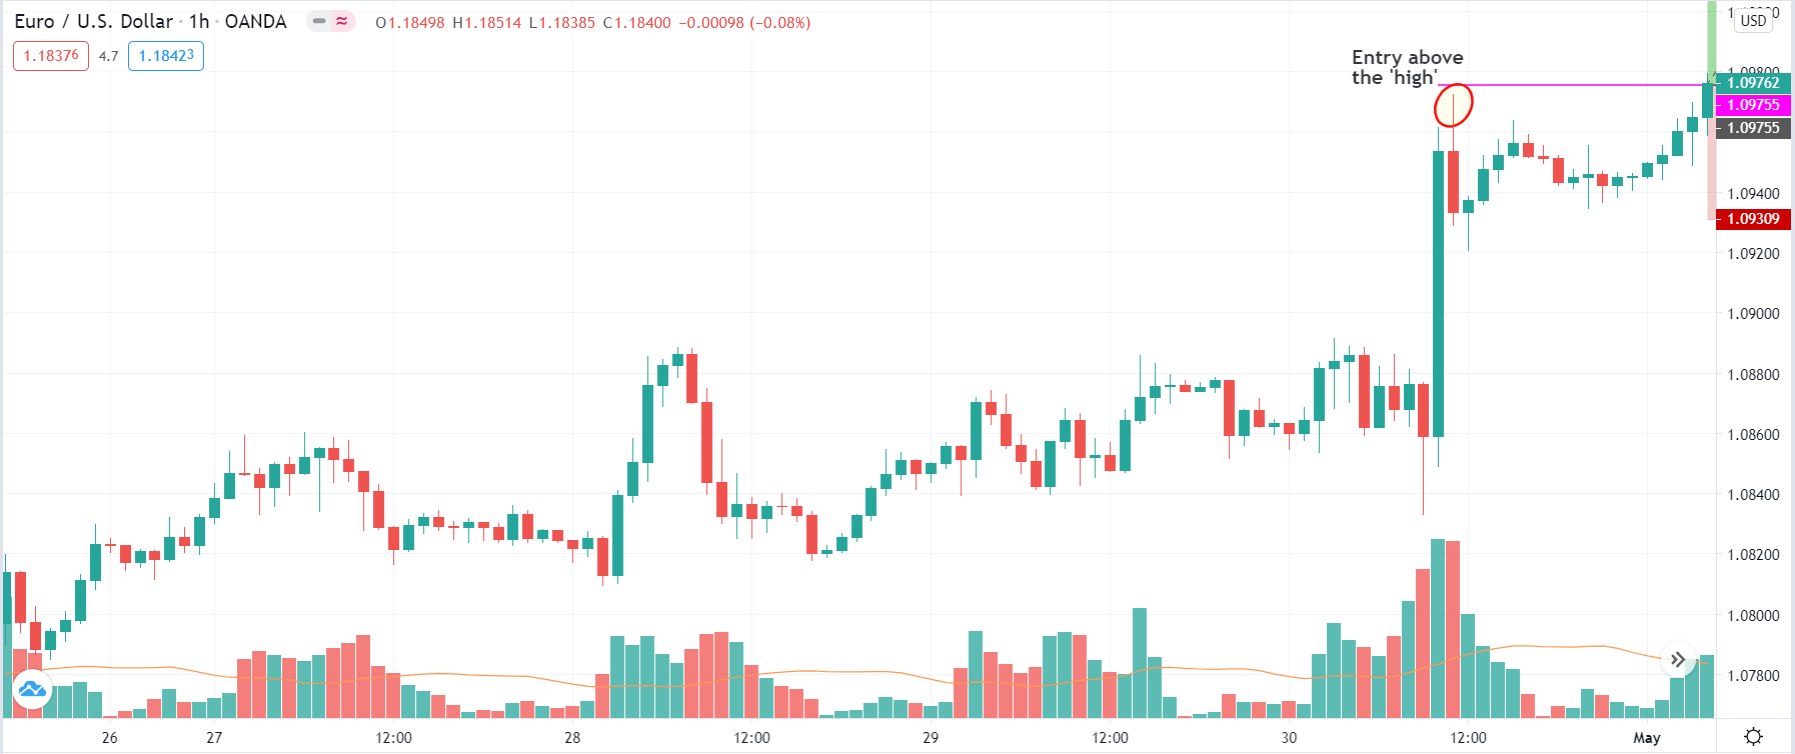
Step 3: The rules of ‘entry’ are pretty simple. In a bullish setup, we place a ‘long’ entry order just above the ‘high’ of the ‘flagpole’ candle formed on the higher time frame. In a bearish setup, we place a ‘short’ entry order just below the ‘low’ of the ‘flagpole’ candle. As and when the market continues to move in the direction of the ‘flagpole,’ the order will automatically be executed.

In the case of our EUR/USD example, our ‘buy’ order gets executed as soon as prices start moving higher.

Step 4: Now, let us define the exit rules for the strategy. The stop-loss is calculated by the number of pips equal to 35-40 percent of the ‘flagpole.’ Stop-loss is placed below the entry price equivalent to the pips obtained by calculation. The ‘take-profit’ is set a price where the resultant risk to reward of the trade is 1:1. Therefore, the take-profit is determined by the stop-loss. Another exit strategy is to trail the stop loss and exit after we witness a reversal pattern in the market.

Strategy Concept

The idea behind this technique is not to place most trades but to place the best trades. The most crucial aspect of the trade is the ‘Flagpole’ candle. We need to ensure that this candle is a consequence of a major news announcement and not just a normal candle. Many traders become impatient and enter even though all criteria have not been met. Patience and discipline will help us to avoid falling into this trap and keep us on the course.

Categories
Forex Course

123. Trading The Bullish & Bearish Bat Pattern

Introduction

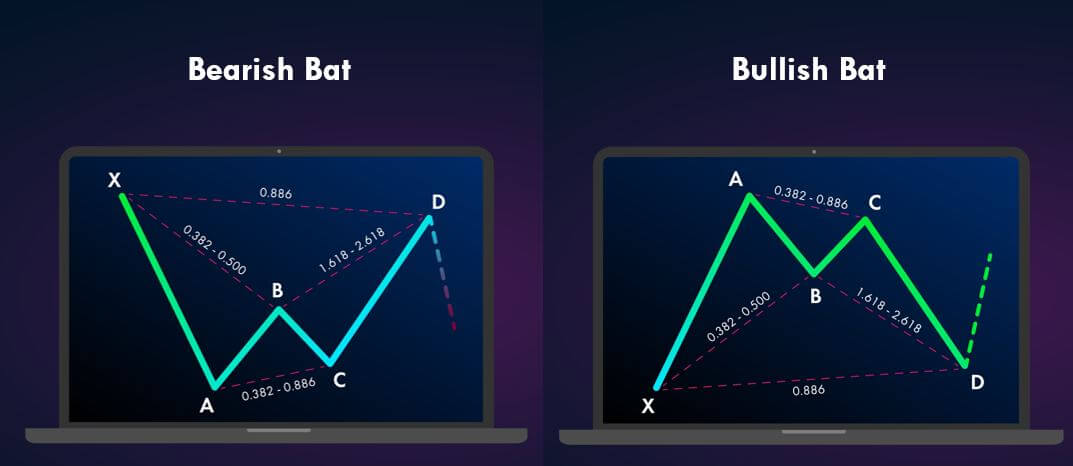
The BAT is a harmonic pattern that appears in both up and downtrend. This pattern occurs when the trend temporarily reverses its direction and before continuing on its original course. As soon as this pattern ends, the markets resume it’s original direction, giving us an opportunity to enter the trade.

The Characteristics of the BAT Pattern

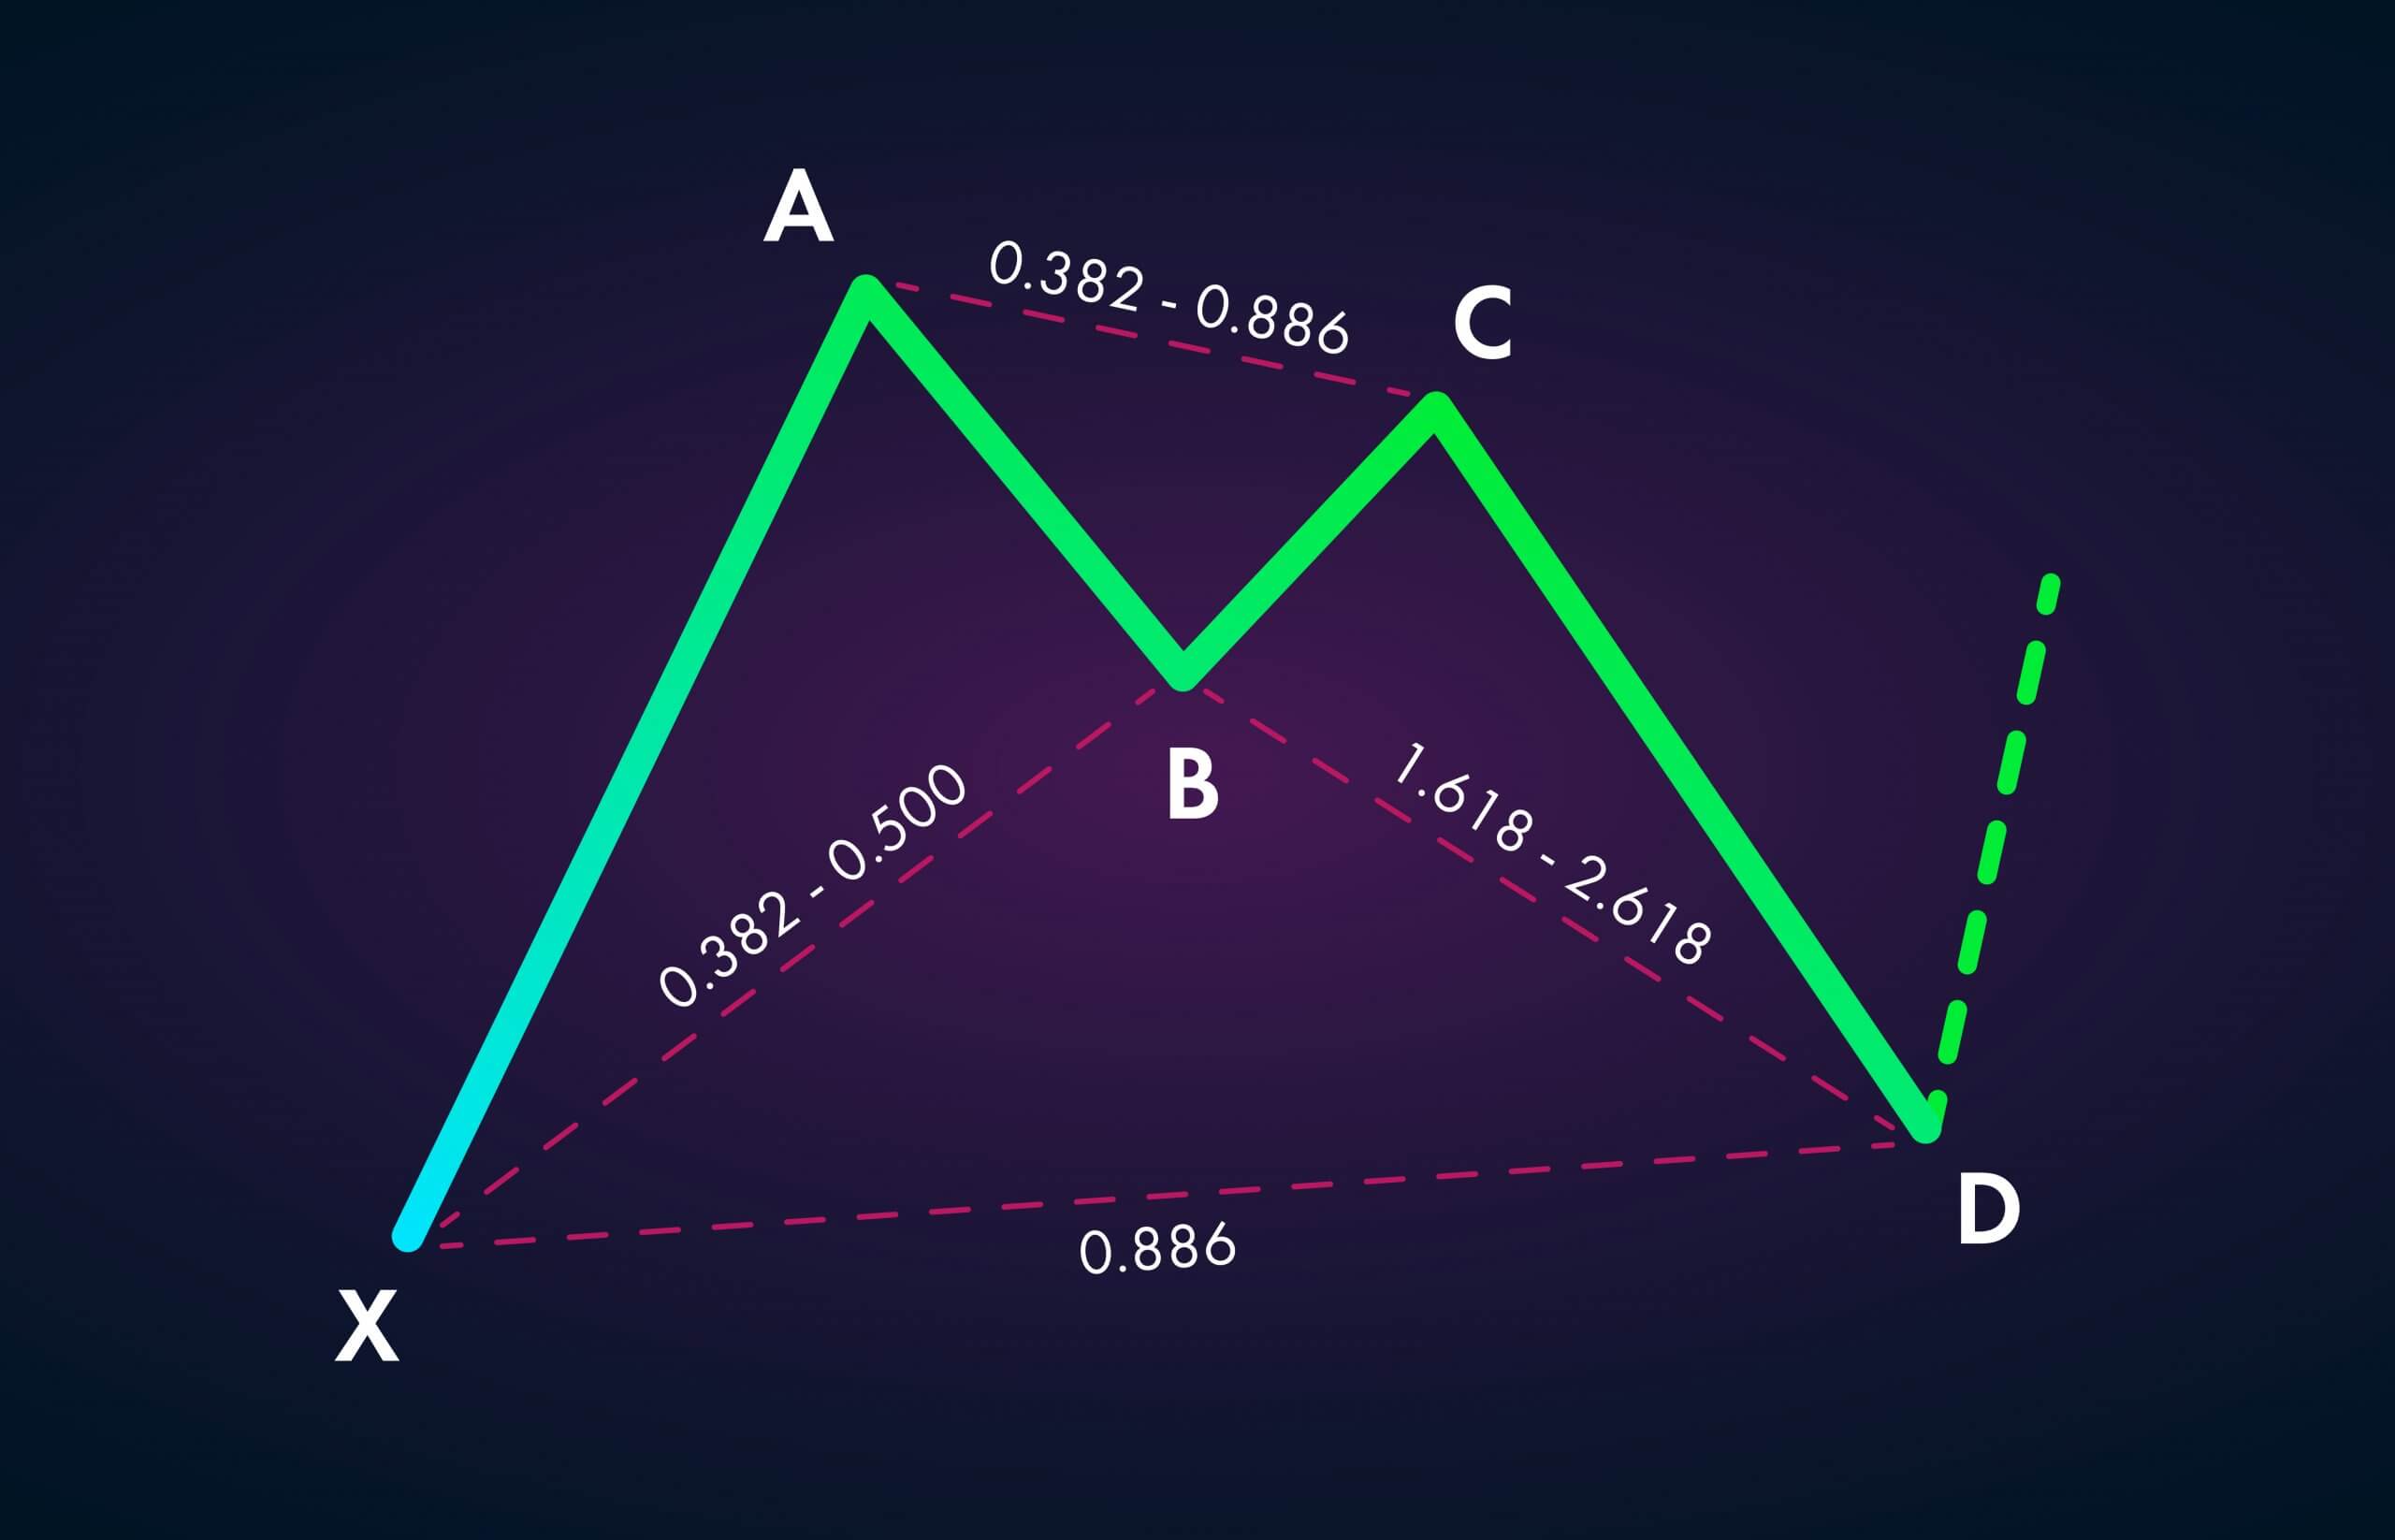
X-A – In its bullish version, the first leg forms when the price rises sharply from the point X to point A.

A-B – The AB leg retraces back between the 38.2% and 50% Fibonacci levels to the distance covered by XA leg.

B-C  – For BC leg, price changes its direction again and retrace anything between the 38.2% and 88.6% of the distance covered by the AB leg.

C-D – The CD leg is the final and most important part of the pattern. If this leg goes wrong, then the pattern can be considered invalid. We can go long when the CD leg has achieved 88.6% retracement of the XA leg.

Below is how both Bearish and Bullish Harmonic Bat pattern would look like when Fib levels are applied to it.

Trading the Bullish Bat pattern

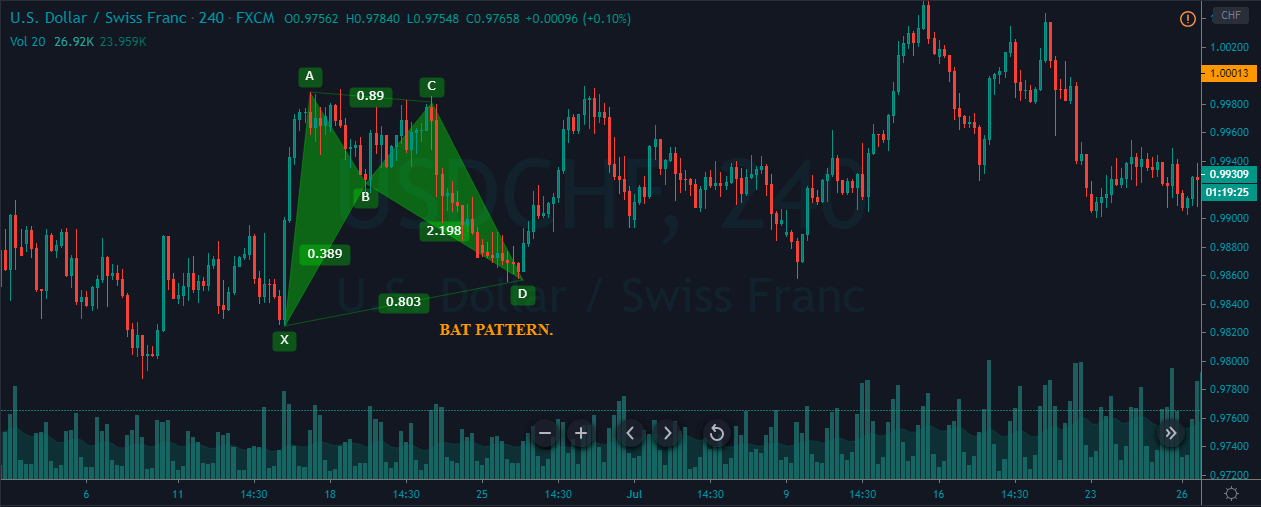
The below price chart represents the formation of a Bullish BAT pattern on the USD/CHF forex price chart.

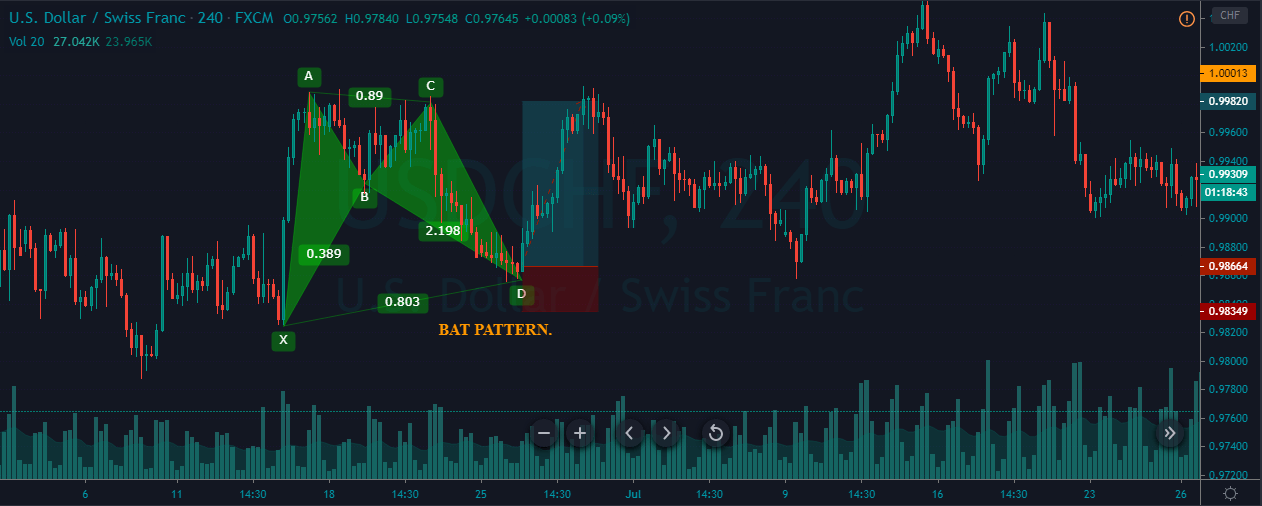
The below image represents our entry and exit while trading the Bullish Bat pattern. At first, we can see the price action printing the XA leg on the chart. Followed by that, the counter-trend AB move has retraced to 38.2% Fib level of the XA move. The BC leg followed the trend and retraced back to 88.6% of the AB leg. The last leg was the CD leg, which reached the 88.6% Fib level of the XA move. The trade activation was at point D, and the stop-loss is placed little below the D point. To place the take-profit order, we chose point A, and we can see how that placement is respected.

Trading the Bearish Bat pattern

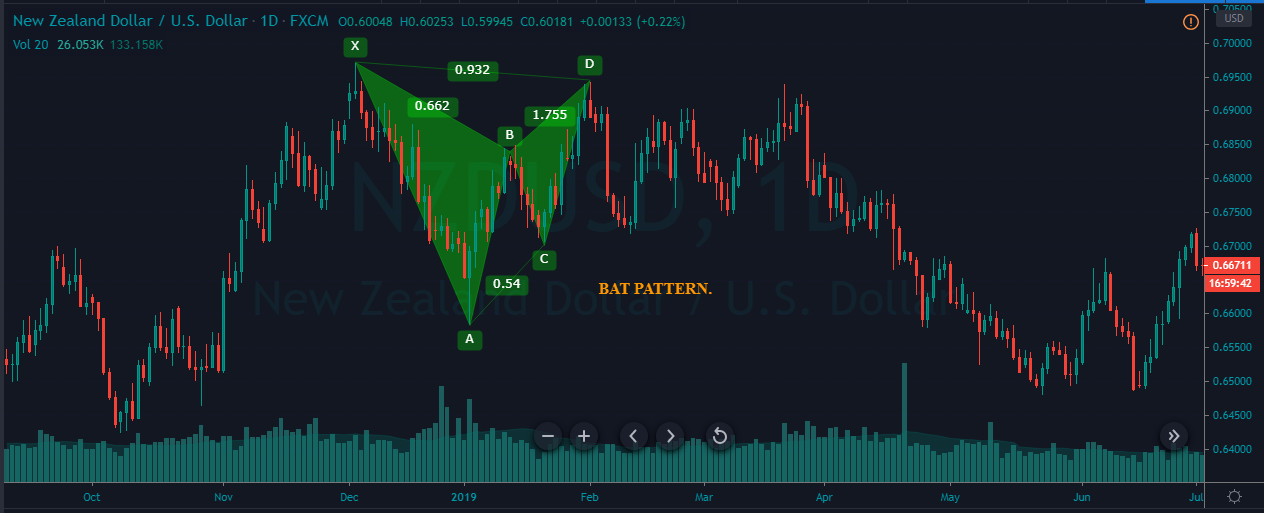
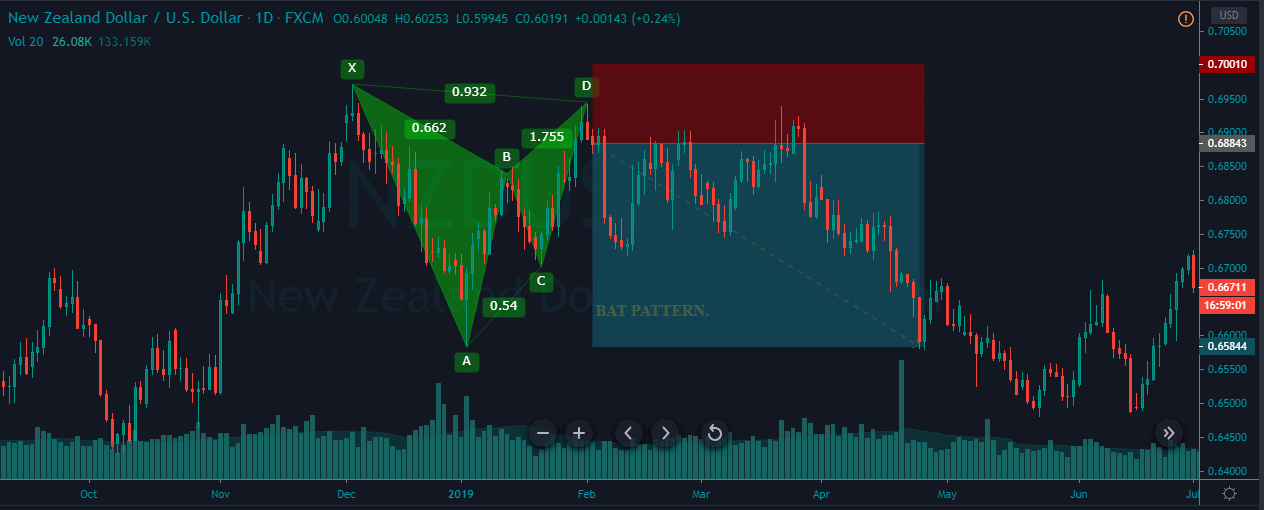
The image below represents the formation of a bearish bat pattern on the NZD/USD Forex price chart.

The formation of the pattern starts with the first leg at point X, and it ends at point A. The second leg AB was counter-trend, and it retraced back to 38.2% of the XA leg. The BC leg goes down, and even that retraced 38.2% of the AB leg. The last leg was the CD move, and if this leg doesn’t follow the rules, we shouldn’t consider the pattern valid. The CD leg goes up, and it retraces to 88.6% fib level. Hence, we can consider the pattern formed as valid. We have activated the trade at point D, and the stops were placed above point D. We have placed two take-profit orders – the first one was at point C, and the next one was at point A.

Conclusion

Bat is one of the most credible Harmonic patterns in the market. As the pattern ends at point D, our trade immediately resumes and often provides an excellent risk to reward ratio trades. Once you master trading the bullish pattern, the bearish one can easily be traded. The Bat is also considered one of the most reliable harmonic patterns; So whenever you identify this pattern, it is advisable to go big. Cheers!

[wp_quiz id=”77106″]
Categories
Forex Basic Strategies

Profiting From The Rounding Top & Rounding Bottom Forex Pattern.

Introduction

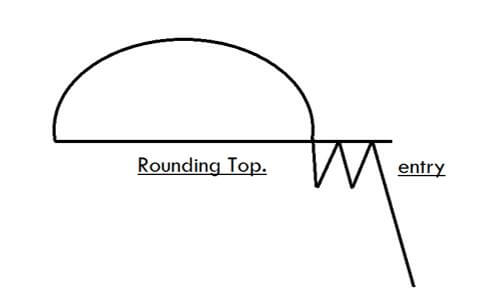
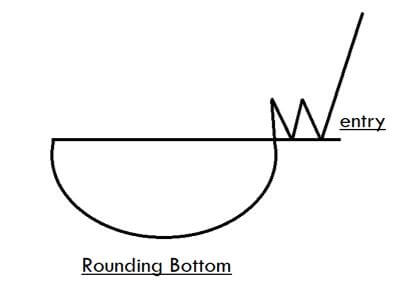
The Rounding Top and Rounding Bottom are two of the most famous trend reversal patterns in the Forex trading industry. These patterns are mostly used to catch the end of a trend in both bullish and bearish markets. These patterns are extremely reliable as they are back-tested rigorously by a number of professional technical traders. Learning the trading of these patterns introduces us to a lot of trading opportunities while riding a brand new trend. Always remember that the Rounding top pattern appears at the top of an uptrend, and the Rounding Bottom pattern appears at the bottom of a downtrend.

Rounding Top

The Rounding Top pattern appears to be in the form of an inverted ‘U’ shape. Hence it is also referred to as an ‘Inverse Saucer.’ This pattern resembles the Double Top chart pattern but a bit more complex than that. Most of the time, the Rounding Top appears at the major resistance level on a price chart. This pattern has three major components – A rounding shape where the price action fails to print a higher high, a taper off, and the beginning of the lower trend.

Rounding Bottom 

The Rounding Bottom is a bearish reversal chart pattern, and it appears at the end of a downtrend, indicating a long term reversal in the price action. This pattern resembles the Cup and Handle pattern, but it doesn’t go through the temporary downward trend of the handle portion. This pattern can be found at the major support area in any trading timeframe. Just like the Rounding Top, this pattern also has three major components –  The Rounding Shape, where the price action fails to print a brand new lower low, taper off, and the beginning of an uptrend.

Trading The Rounding Top Pattern

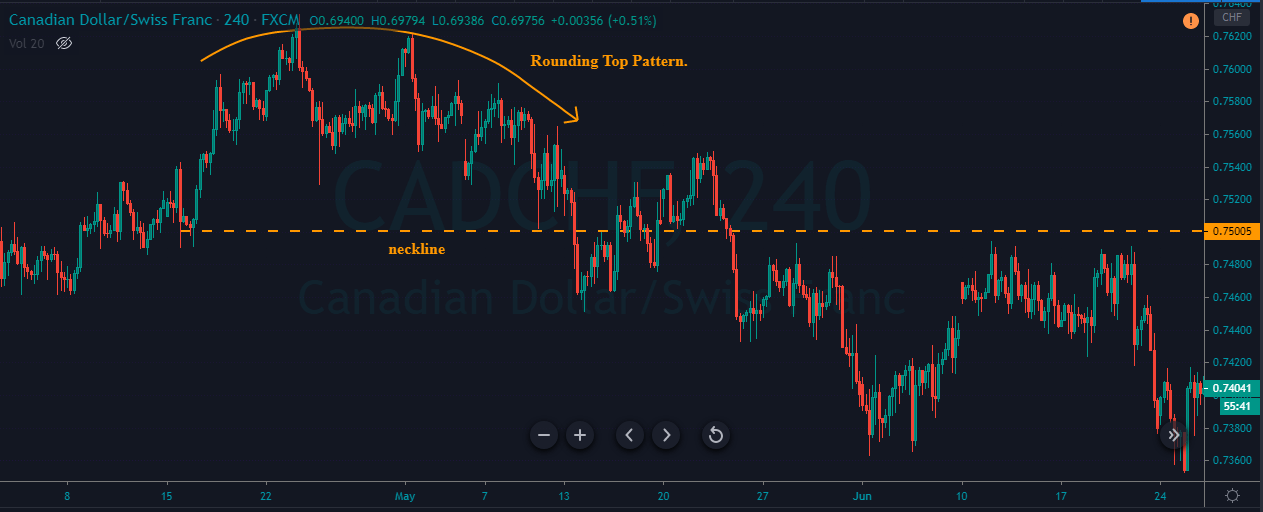
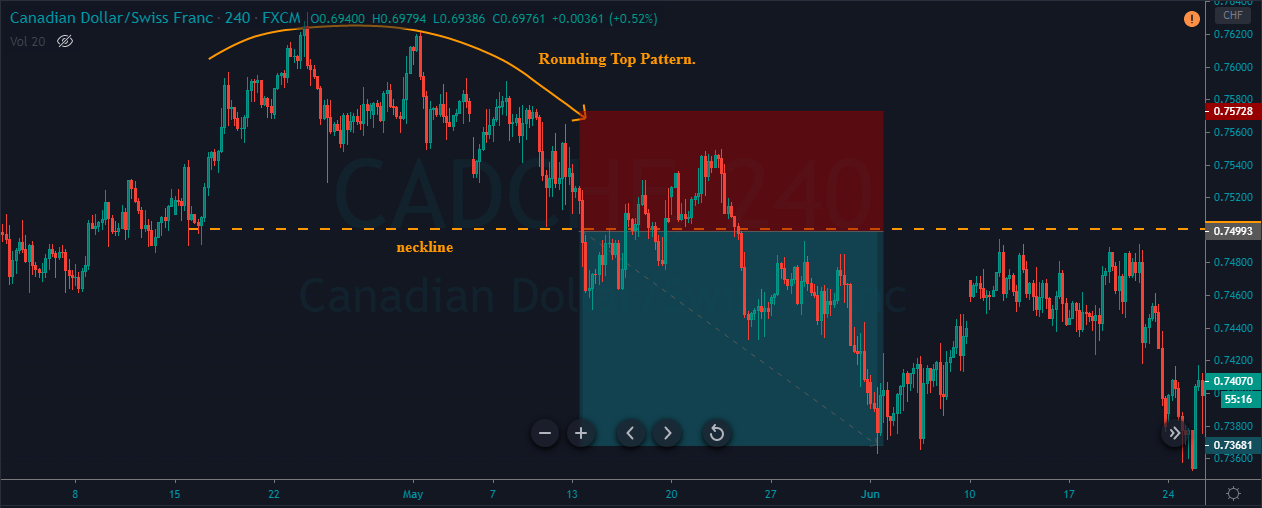
The below CAD/CHF charts represents the formation of a Rounding Top pattern in this Forex pair.

We had decided to go short as soon as the pattern is confirmed when the price reached the neckline. The bear candles on the price chart were stronger than the bull candles indicating the gaining strength of sellers in the market. The sell trade is activated when the price goes below the neckline. Stop-loss is placed just above the region where the pattern is formed.

After activating the trade, price action didn’t blast to the south immediately. Instead, it pulled back to buy-side, before eventually going down. In this kind of situation, most of the traders doubt their strategy and exit their positions because of fear. But since our analysis is strong enough, it is a good idea to hold our positions and wait for the price to move in our direction.

Trading The Rounding Bottom Pattern

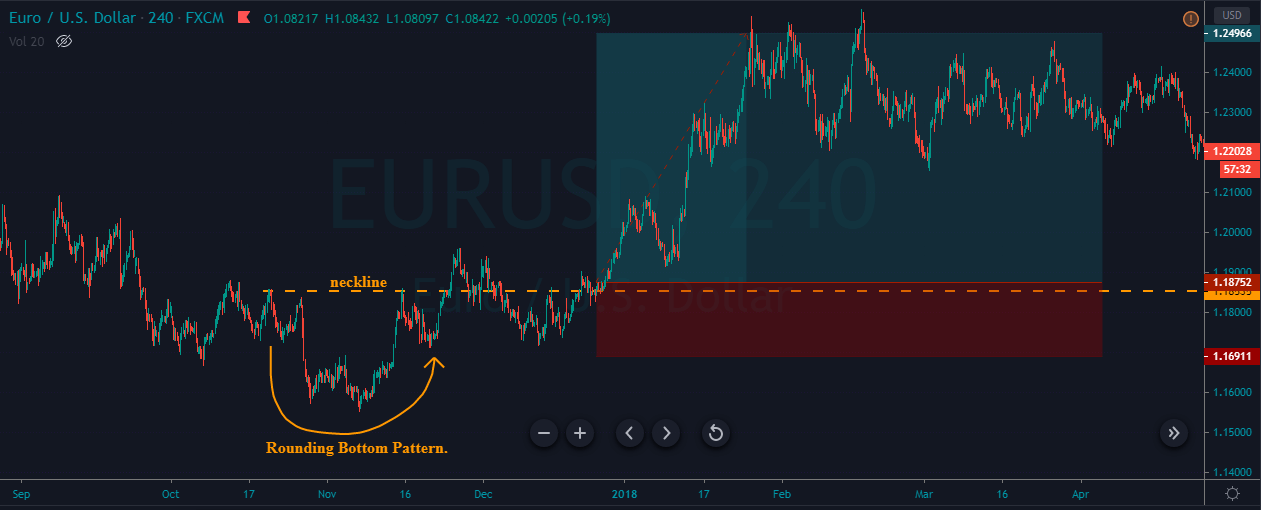
The below EUR/USD, 240 Minutes chart, represents the formation of the Rounding Bottom pattern on the price chart. We can see the market being in a downtrend when the Rounding Bottom pattern is formed. This is a clear indication for us to understand that the bears are losing momentum, and bulls are about to take over the market. We took a buy-entry when the price went above the neckline. The take-profit was placed at the higher timeframe’s significant resistance area.

Rounding Top Pattern + RSI Indicator

In this strategy, we have paired the Rounding Top pattern with the RSI indicator to identify accurate trading signals. As we all know, the RSI is a momentum indicator that measures the magnitude of the price change. RSI stands for Relative Strength Index, and it is developed, J. Welles Welder.

This indicator oscillates between the 0 and 100 levels. When RSI reaches the 70 level, it indicates overbought market conditions, and we must expect a downside reversal. Likewise, when it reaches the 30 level, it indicates the oversold conditions, and we must expect a buy-side reversal.

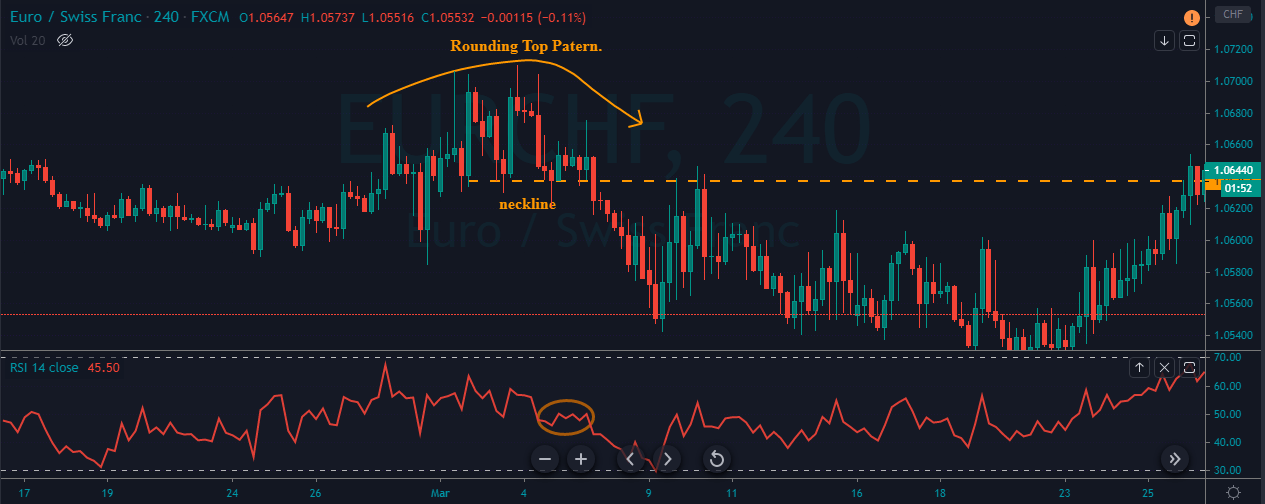
The strategy is simple –  Identify the Rounding Top pattern and see if the price action is going below the neckline. If yes, check where the RSI indicator is. If it is in the overbought area, it is a clear indication for us to go short.

The below price chart represents the formation of the Rounding Top pattern on the EUR/CHF Forex pair.

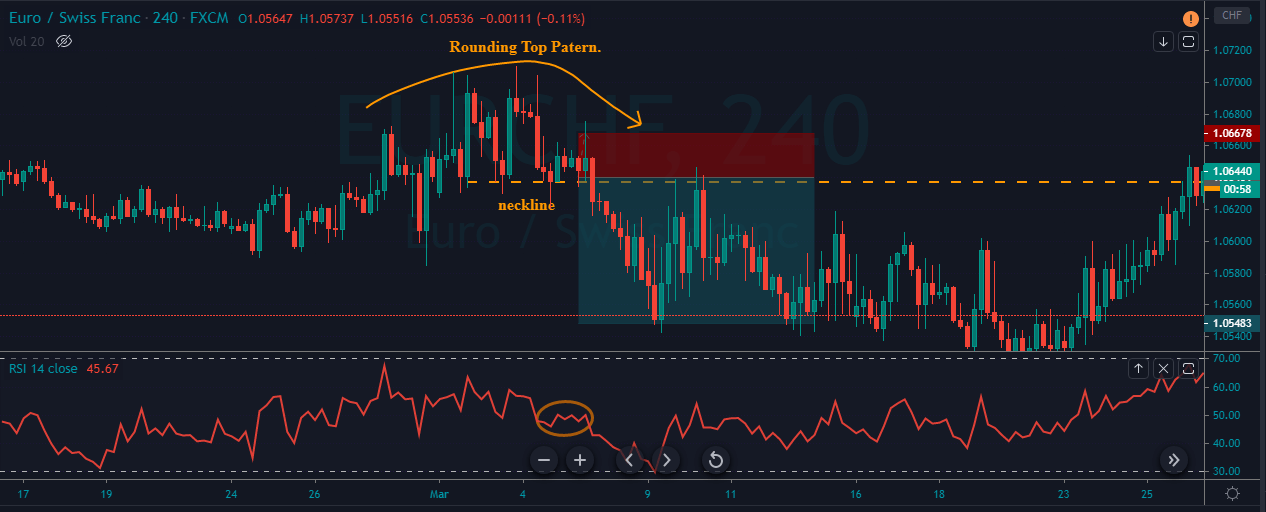
In the below chart, we can see the price going below the neckline. At the same time, RSI gave a reversal at the overbought area, indicating us to go short in this pair. We have activated the trade at the neckline, and the stop-loss placement was above the most recent higher low. We had closed our positions when the price action started to struggle at the Bottom.

Rounding Bottom Pattern + RSI Indicator

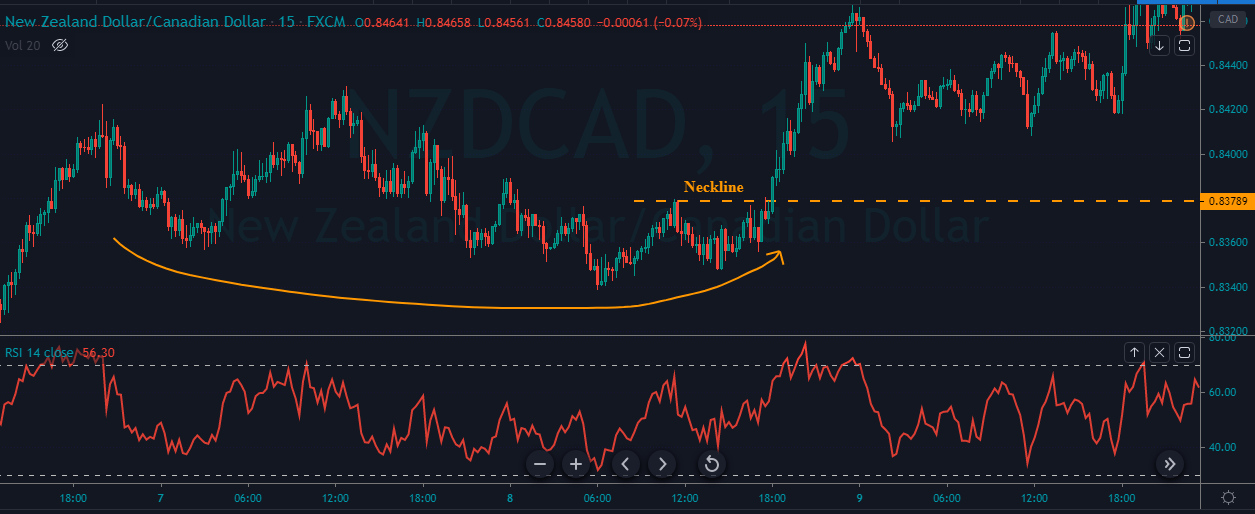
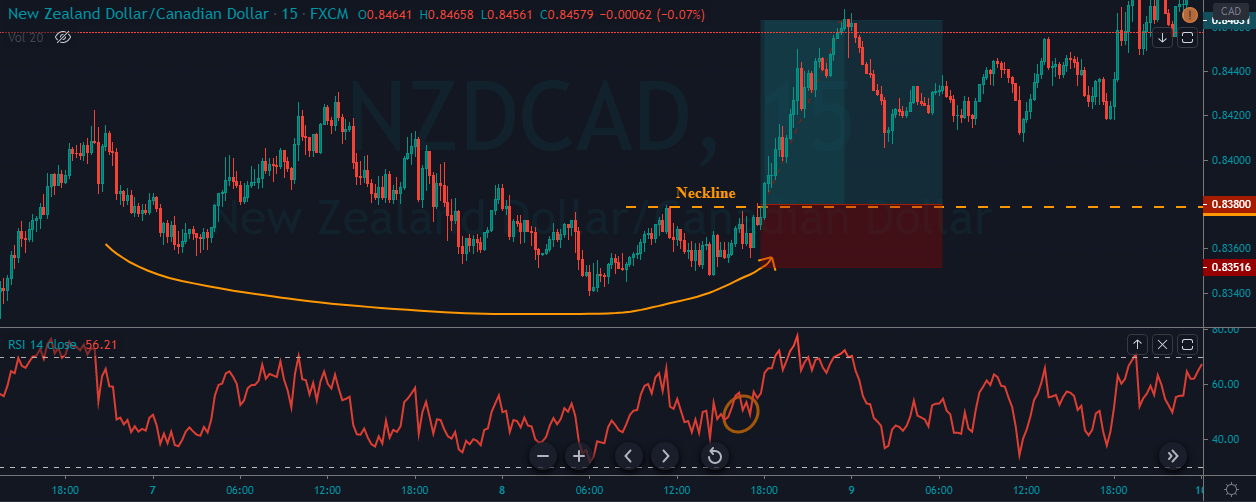
The below chart represents the formation of the Rounding Bottom pattern on the NZD/CAD Forex pair.

We had gone long when the price broke the neckline, and the RSI gave a reversal at the oversold area. As you can see in the chart below, right after our buy activation, the price smoothly blasted to the north. We booked our whole profits when the price reached a significant resistance area. Stop-loss was just below our entry as the neckline acts as a strong support to the price action.

Conclusion

The Rounding Top and Bottom are bullish and bearish reversal patterns that are used to identify the end of an ongoing trend. You need to know that you must wait for the breakout of the neckline to take long or short positions according to the pattern formed. The stop-loss can be placed above the neckline when trading the Rounding Top and below the neckline when trading the Rounding Bottom pattern.

The take-profit must be equal to the size of the pattern formed, and if the trend is strong enough, consider going for deeper targets. Overall, these patterns are quite popular and easy to spot on the price chart. Practice trading these patterns using a trading simulator or a demo account before applying these strategies on live accounts.

We hope you find these strategies informative. If you have any questions, make sure to let us know in the comments below. Cheers.

Categories
Forex Basic Strategies

Learning To Trade The Bullish & Bearish ‘Butterfly’ Harmonic Pattern

Introduction

Harmonic patterns have always been popular among a set of traders around the world. So it is essential to learn them to have an edge over the market. There are two different types of Harmonic Patterns. The first type is external, and the second is internal. External Harmonic patterns include Butterfly and crab patterns. Whereas the internal Harmonic patterns include Gartley and Bat patterns. In today’s article, let’s discuss how to trade the Butterfly pattern profitably.

The Butterfly is both a bullish and bearish reversal pattern that falls into the category of the Harmonic group. It is developed by H.M Gartley. Scott Carney and Larry Pesavento then fine-tuned the pattern by adding the Fibs ratios. This harmonic pattern is composed of four legs, and they are marked as ‘X-A,’ ‘A-B,’ ‘B-C,’ and ‘C-D.’ The Butterfly pattern mostly appears at the end of the trend indicating a trend reversal.

By identifying this pattern on the price charts, traders can enter a trade anticipating a potential market reversal. The Butterfly structure on the chart resembles the letter’M’ in a downward trend. Conversely, in an uptrend, the pattern looks like a ‘W.’

Butterfly Pattern Rules

To confirm the appearance of the Butterfly pattern, the rules below must be met. Remember to accept the pattern even if the levels are closer to these Fib ratios. If we stick these levels only, we might be missing on well-performing trades as the setups with the exact Fib levels hardly occur.

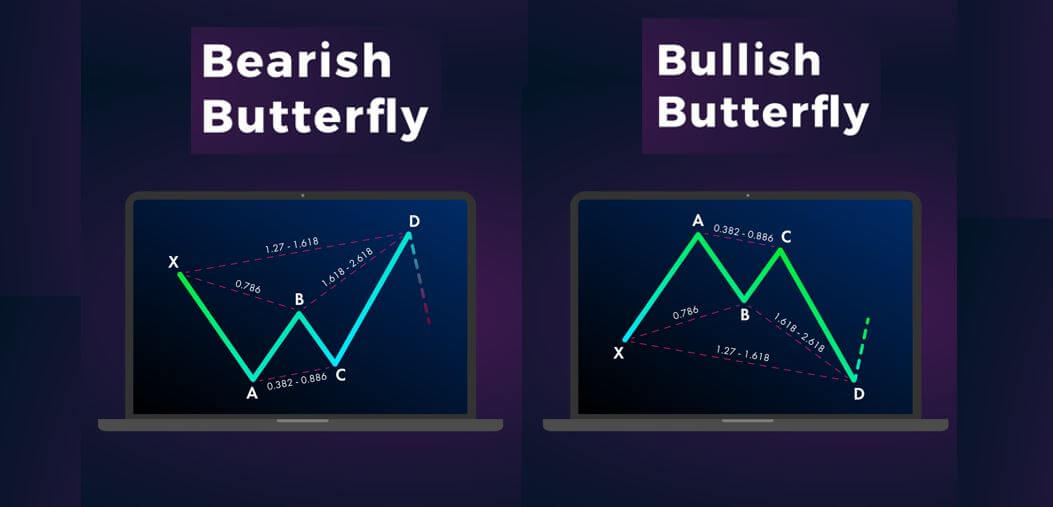
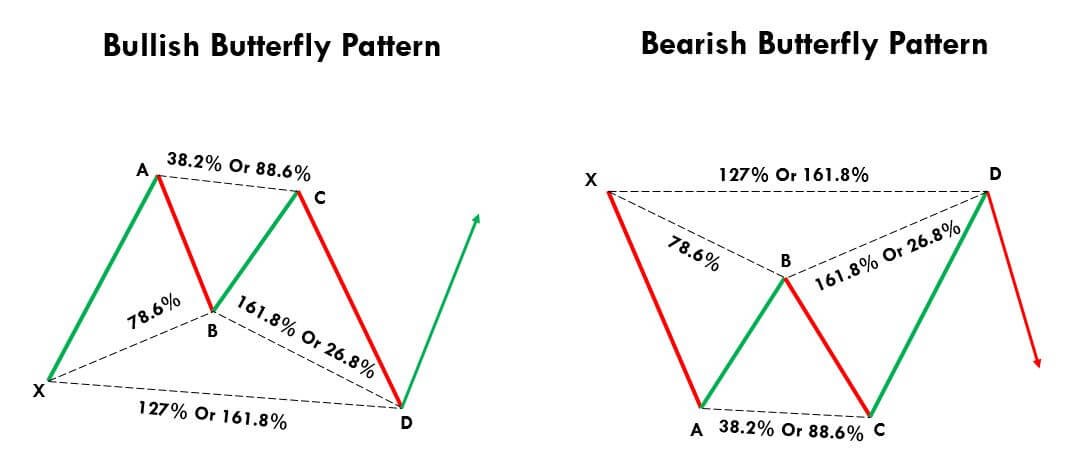
‘X-A’ – This is the initial move of the Butterfly pattern, and in a downtrend, this leg is formed when the price drops sharply from point X to A. Likewise, in an uptrend, this leg is formed when price moves up swiftly from X to A.

‘A-B’ – The B point should retrace 78.6% of X-A leg.

‘B-C’ – The B-C move should retrace 38.2% or 88.6% of the A-B move.

‘C-D’ – The C-D move is the final and most crucial move of the pattern. If the B-C is 88.6% of the A-B, then the C-D must be reached the 261.8% extension of BC. On the other hand, if the B-C is 38.2% of A-B, then the C-D must reach the 161.8% extension of B-C.

A pictographic representation of the same is shown below.
How To Trade The Butterfly Pattern

Trading The Bullish Butterfly Pattern

The below picture is a 30-minute chart of the USD/JPY Forex pair. We have identified the Butterfly pattern and plotted Fib levels on to that. As we can see, the first X-A leg started as a random bullish move on the price chart. The second A-B bearish move retraces close to the 78.6% of the X-A move.

Furthermore, the B-C moves reach close to 88.6% of the A-B move. The last C-D bullish move reaches almost close to the161.8% of the B-C movement. So after the appearance of all the four legs, we confirm the formation of the Bullish Butterfly Pattern. Now let’s how we are going to trade this pattern.

Once the price action completes the CD move, we must wait for 2 to 3 bullish candles to take a buy entry in the USD/JPY pair. We must enter the market right after the appearance of the Green confirmation candles. As we can see in the above image, the market blasted to the north right after the appearance of confirmation candles.

Always remember that we are dealing with probabilities and not certainty while trading. So as technical traders, we must adjust according to the market sentiment. The ideal way is to exit our positions when the price approaches the level of point A. But in this particular trade, the market shows excessive volatility as we can see the appearance of a ‘three white soldiers’ candlestick pattern. As per our learnings, we know when this pattern appears, the trend is going to continue.

So we must place deeper targets in this Forex pair. That’s the reason why we didn’t book any partial profits and closed our whole position at a significant resistance area. So in any given trade, always decide your risk-management according to the market situation. Furthermore, we put the stop loss just below the X point, which is the safest position to set a stop-loss. Because, if the price breaks this point, directly it invalidates the Butterfly pattern.

Trading The Bearish Butterfly Pattern

The below image represents the 240-min chart of the GBP/USD Forex pair. We have identified the formation of a Bearish Butterfly pattern in this chart. In a downtrend, the first X-A leg started as a random bearish movement in the market. The A-B leg is a bullish move that retraces close to the 78.6% of the X-A leg. Then the third B-C movement is the bearish move again, and it retraces close to the 38.2% of the A-B move. Then finally, the C-D move happened, which completes the formation of the Bearish Butterfly Pattern.
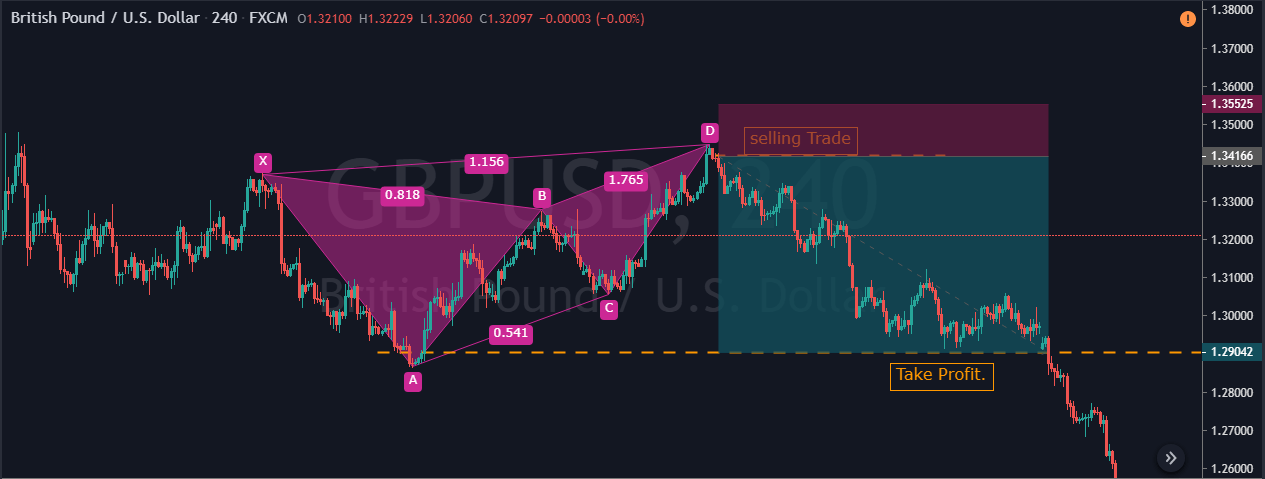
As we can see in the above picture, the last leg retraces to the upside, and it was close to the 161.8% extension of the BC move. When the price action completes the C-D leg, it prints a couple of red confirmation candles indicating a potential market reversal. Hence in this pair, we took a sell at D point, and the stop-loss placement was just above the D point. We didn’t book any partial profit at point B or C; instead, we closed our whole position at our final target, which is point A.

When and When Not to Trade The Butterfly Pattern?

The good thing about Harmonic patterns is that they work very well in all the types of markets. They also work wonderfully in every market condition. We believe you have clearly understood that the Butterfly is a reversal pattern. We must use all of our previous learnings to win a trade. For instance, if a bullish Butterfly pattern is formed in a strong downtrend, try to avoid trading that pattern. This is because it is difficult for a single pattern to completely reverse the market trend.

If the market was in an uptrend, which is now turning into a dying channel, and if we identify a bearish Butterfly pattern on the price chart, the probability of it being an accurate trading signal is more. Sometimes we can observe the market printing a pattern within the pattern. This also increases the likelihood of our trades. For instance, we can see the formation of a ‘Three White Soldiers’ pattern (below chart) in one of the examples we discussed.
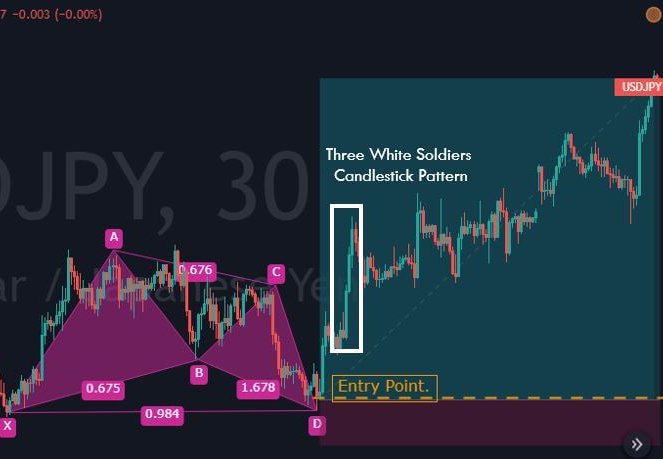
This example is not in the context of trading the Harmonic pattern as a whole but in the context of placing our take-profit orders while trading Harmonic patterns.

Alternative to Harmonic Patterns?

It is a bit difficult for new traders to learn and implement the Harmonic patterns on their trades. So, in the beginning, new traders can also use other forms of technical analysis tools to trade the market. These harmonic patterns are used by most of the professional traders in the industry as they provide an excellent risk to reward ratio. But once you gain some experience, you can try trading harmonic patterns on the demo account, and if you are confident enough, you can apply them to the live charts.

In the end, price action trading is the only tool which can be considered as a complete alternative to the harmonic pattern trading. But a large part of the traders in the industry does not know how to use price action alone to trade the market. So for them, candlestick pattern trading combined with technical indicators is the best method to trade. Overall, yes, there is an alternative to harmonic pattern trading. However, most of the traders in the market aren’t aware of it.

Bottom Line

The one main benefit of identifying and trading the Butterfly pattern is that it helps the traders to identify the top and bottom of the price action so that they can ride the whole trend. The Butterfly pattern is the easiest one in the harmonic group, which provides highly profitable trading signals. The Fibonacci extension levels are an integral part of trading the Butterfly pattern. If the Fib ratios are not attached to your pattern, make sure to add the fibs manually to your price chart so that you can visualize the pattern correctly. Best of luck!

Categories
Forex Basic Strategies

Identifying & Trading The Bull Trap Pattern In The Forex Market

Introduction

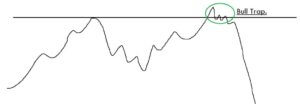
A Bull Trap is one of the unique patterns that can be found in the Forex market. This pattern is comprised of two highs were the second high is failing to hold higher, and as a result, prices push to the new low. Unlike most of the patterns, a Bull Trap pattern generates false buying signals and indicate us to be cautious when we identify this pattern on the price charts. Hence it is also known as a whipsaw pattern.

The up-move that happens trick the buyers & investors into making bullish trades as they look identical to a buy signal. But the signal is not real, and they end up generating losses on long positions. Traders must seek confirmation after the breakout so that they can filter out these false buying signals and escape the Bull Trap. Bear Trap is the opposite of the Bull Trap pattern, which occurs when sellers fail to hold the prices below the break down level.

Psychology Behind The Bull Trap Pattern

The markets will be in a downtrend printing brand new lower lows & lower highs continuously. The price action then hits the major resistance level and starts pulling back. When the pullback begins to struggle, some of the aggressive traders and investors tend to take their long positions. Then, suddenly, one strong candle breaks the resistance line with power.

At that stage of the market, emotions are on a peak point, so as a result, most of the traders take buy entries believing the breakout. The market then prints one red candle, and the price action respects the resistance level and starts to hold below the resistance level. At this point, most of the trader will be hoping for the market to go up, but the prices roll into the sell-side.

How Does The Bull Trap Occur?

Example 1

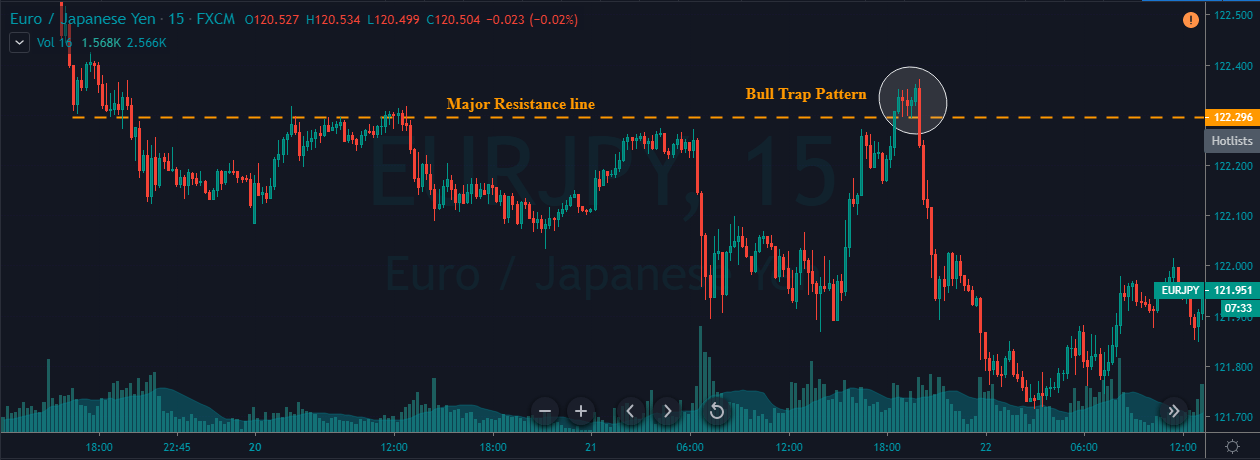
As we can see in the below 15-minute EUR/JPY Forex chart, price action hits the resistance line twice, but both the times it failed to break the line. However, the third-time, price action broke the major resistance line with power. This would have resulted in most of the traders taking their long positions. When the four small candles held above the resistance line, it gives extra confirmation to the traders to buy this currency pair, but that was just a trap by the sellers. After some time, the price action dropped back, and that would affect most of the traders’ emotions negatively.

This kind of situation is common, and sometimes novice traders tend to immediately jump to the opposite side. But for professional traders, their emotions never play a role in decision making. So never take the opposite trade if that is not a part of your plan. In the above chart, we shouldn’t be going short unless the second or third bearish candle is formed after the beginning of a downtrend.

Example 2

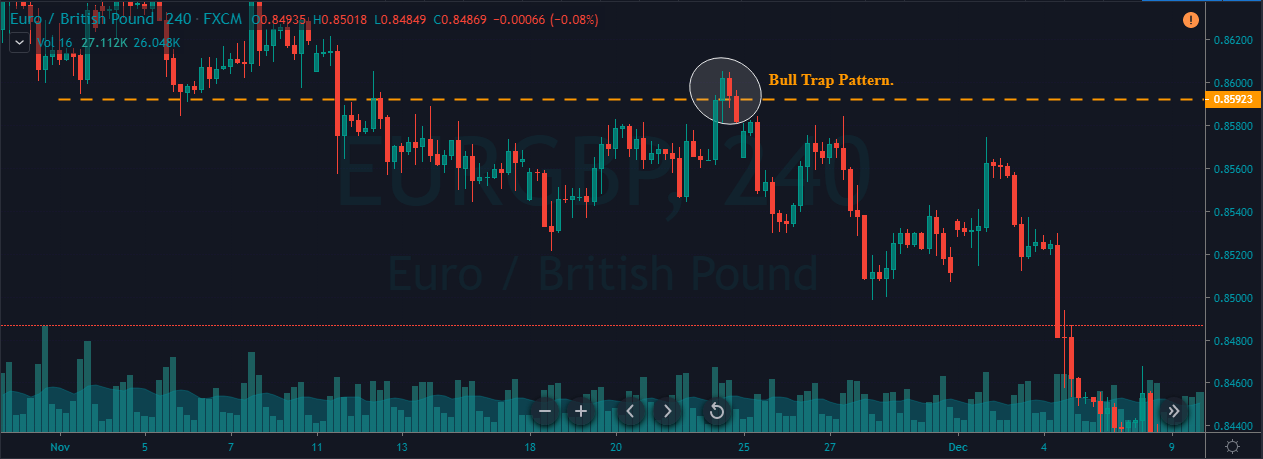
In the below EUR/GBP chart, the pair was in an overall downtrend. During the pullback phase, when price action reached the major resistance area, most of the amateur traders visually see that as a bullish market. Price action respects the resistance line twice, but on the 25th of Nov, when strong buyers broke the resistance line, it creates the illusion of a buy signal in this pair.

But the buyers failed to hold the price higher, and the very next candle pushed the price below the resistance line. When the price broke the resistance line, amateur traders activate their buy trades. Still, technical traders will always wait for the prices to hold above the resistance line and take the buy entry only after the confirmation. In this example, prices never held above the resistance line, so there was no trade buy trade for professional traders. On the other hand, inexperienced traders end up booking losses.

Trading The Bull Trap Pattern

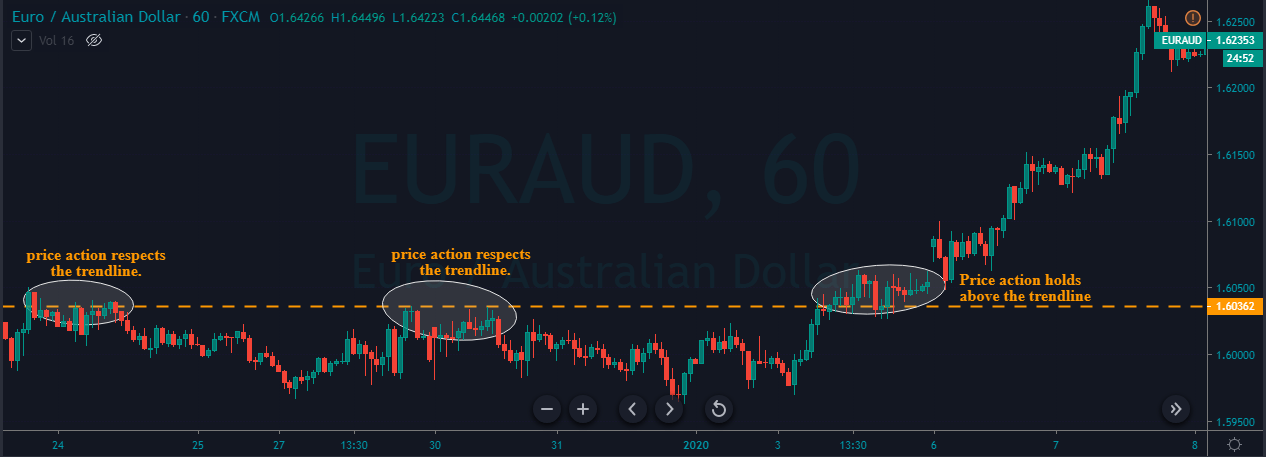
In the above examples, we discussed how to identify the Bull Trap pattern. Now, let’s understand how to trade this pattern. In the below EUR/AUD Forex chart, the price action tried to break the resistance line twice, but both of the time buyers failed to perform. On the 3rd of Jan, buyers broke the resistance line with some strong power. After the break, inexperienced traders would have activated their buy positions. But always keep in mind that the breakout never confirms the buy entry. We should be keeping a close look at the price after the breakout and only trade once we get the confirmation.

As you can see in the above chart, after the breakout, many candles held above the resistance line. After watching close to fifteen candles, we can confirm that the resistance has turned to support. The hold after the breakout confirms that the sellers failed to take prices lower.

Entry, Stop-Loss & Take-Profit

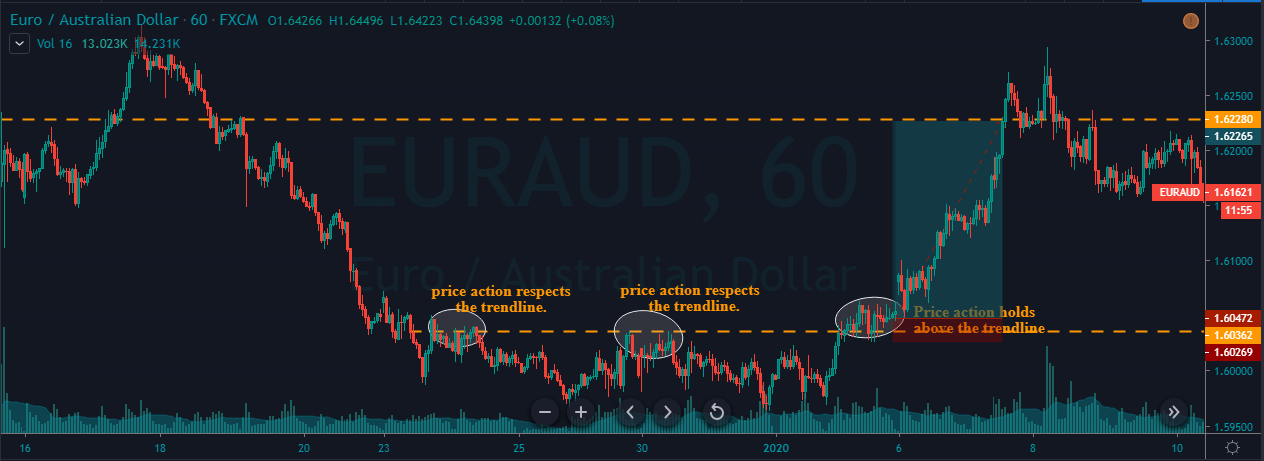
When buyers held the prices above the resistance line for a while, it is a clear indication of a buy signal. So now we enter the market as soon as the confirmation is done. We have decided to go for a smaller stop-loss because the hold confirms that the sellers left the ground.

Our take-profit is at the higher timeframe resistance area. We can see the price dropping back right after our take-profit level as the price tested the resistance line. Interestingly, a bull trap pattern is formed again above our take-profit order. This is the ideal way to trade this pattern, and most of the professional traders follow the same. Patience is the key to trade the Forex market. If you are patient enough to follow all the rules of the game, you will win for sure.

Conclusion

Bull Trap occurs when the prices fail to hold above the breakout. It could happen for various reasons. Some of them are buyers not being interested in pushing the prices higher, or they might have been booking the profits. On the other hand, professional sellers might have jumped into the market to take sell trades. As a result, they end up dropping the prices below the resistance levels, which will eventually result in triggering the stop-loss orders of the trapped buyers.

The best way to identify the Bull Trap pattern is to analyze the momentum of the buyers in the Forex market. If the buyers fail to hold the prices above the breakout, do not take long positions and never let the emotions drive your decision making.

Categories
Forex Basic Strategies

Most Profitable Ways To Trade The Triple Top Chart Pattern

Introduction

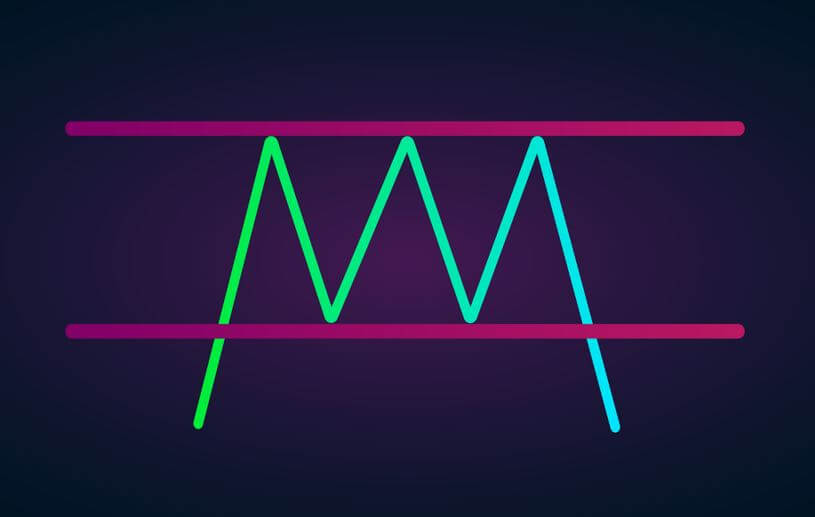
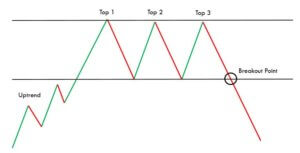
The Triple Top is a bearish reversal pattern that helps traders in identifying the peak areas of the market. This pattern occurs when the market prints three consecutive tops nearly at the same price level of any underlying asset. The areas of the touchpoints are the resistance levels, and the pullback between these points is known as the swing lows. After the third high or third touchpoint, if the price breaks the support and goes below, the pattern is said to be complete.

Traders can then activate their positions on the sell-side. Most of the traders try to be extra conservative and wait for the exact pattern to occur. But it can be challenging to find the Triple Top Reversal pattern with all the three highs at the same in size. We should always remember that the technical analysis is more of art and less of science. So even if 80% of the pattern rules are met, we can take the trades by confirming those signals with other credible technical indicators.

The Psychology behind the Triple Top Pattern

The appearance of a Triple Top Pattern implies that the buyers are slowly losing momentum in the market. It might also mean that the buyers are not willing to push the price higher. At the same time, the sellers are interested in taking the price lower. The Triple Top pattern is a way more powerful pattern than most of the other credible patterns in the market. This is because the third failed attempt of the buyers implies that the sellers are way too aggressive than the buyers. Hence we can expect stronger downward moves.

Triple Top Pattern – Trading strategy

The Triple Top pattern occurs very rarely on the higher timeframe. Even if it occurs, this pattern often takes a lot of time to develop fully. However, on an intraday timeframe, this pattern can be observed quite often.
Step 1: Identifying the TTP on a price chart

In the below AUDCHF Forex chart, we can see the market printing a clear Triple Top chart pattern.

Step 2: Entry 

The strategy is to wait for the breakdown to happen so that we can activate our short positions. On the 27th of January, we can observe the breakdown that occurred in this pair, and that can be considered as a clear Sell Signal.

Step 3: Stop-loss & Take Profit

We can activate our sell positions as soon as we see a bearish confirmation candle. We can go for two different targets in this trade. Both are at the higher timeframe’s support area. Most of the traders believe that their target must be double as compared to the size of the Triple Top pattern, but it’s just a myth. Always book the profit according to the market circumstances.

If the trend is super strong, go for the deeper targets. Contrarily, if the market momentum is fading, book the profit at any significant area. Traders who are well versed with pattern trading can add positions when the market goes back to the entry point so that they can ride the whole show again. While trading the breakout or break down patterns, always place the stop-loss near the recent low.

Triple Top Pattern + Double Moving Average

In this strategy, we have paired the Triple Top pattern with the Double Moving Average to identify accurate sell signals. A moving average will help us in identifying significant trends, trading opportunities, and entry/exit levels. Many traders believe that if they find the magic number of the period, then they can easily beat the market, but it’s not true. There are infinite numbers of periods available, and traders should practice only 3 to 4 periods, to use this indicator effectively.

Step 1: Identifying the TTP on a price chart

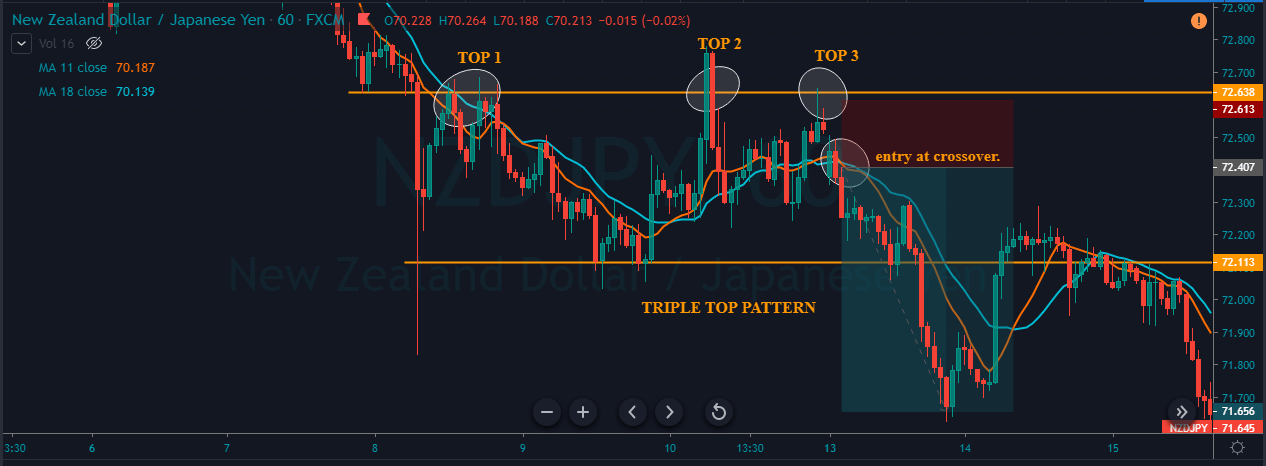
In the below chart, we can observe the market printing the Triple Top pattern on the NZD/JPY 60-minute Forex pair. We have applied the double MAs on to the price chart.

The traditional way to trade this pattern is to wait for the break down to happen and then go for sell just like we did in the above example. But in this strategy, let’s tweak things a bit by adding the double moving average to the plot. In this strategy, we are using the 14 and 9-period average. This strategy is purely for the intraday traders only.

Step 2: Entry, Stop-loss & Take Profit

After price action printing the third top, if we observe an MA crossover happening, we can activate our sell positions even before the breakdown. By following this approach, we get to enter the trade ahead of time, while the breakdown traders wait for the break down to activate their position. Most of the professional traders use this approach to maximize their profits.

There are many ways to close our positions. We can book profit at a significant support area. The placement of stop-loss depends on the trader’s trading style. If you are an aggressive trader, the smaller stop-loss is good. But expect more hits before the trade performs. If you are a conservative trader, use an extra spacious stop-loss.

Bottom line

A pattern is said to be paramount when it offers the best risk-reward ratio trades. Also, the pattern must have a higher probability of occurring in intraday timeframes. The Triple Top is one such pattern that offers both of these demands to every trader. Also, remember that the Triple Top is a bearish reversal pattern, so only take short positions when you see this pattern on the price charts. Apart from the ones mentioned above, there are different other ways to activate our position in the appearance of this pattern. But the above ones are the safest and most profitable ways to trade.

Try identifying and trading this pattern on a demo account before trading on the live charts. We hope you find this article informative. If you have any questions, please let us know in the comments below. Happy Trading.

Categories
Forex Course

56. Learning The Triple Candlestick Patterns – Part 1 (Continuous)

Introduction

After acquiring a fair bit of knowledge about Single and Double candlesticks patterns, let’s now proceed and learn the Triple Candlestick Patterns. A Triple Candlestick Pattern, as the name clearly suggests, is formed by three candles. In the next couple of articles, we discuss two Continuation patterns and two Reversal patterns to understand how these patterns are formed. Also, most importantly, we will be learning how to trade these patterns as well. So in this article, we will be discussing the basic & well-known Continuous Triple Candlestick Patterns – Three White Soldiers and Falling Three Methods.

Three White Soldiers Candlestick Pattern

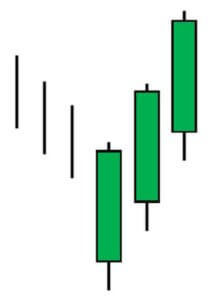
Three White Soldiers is a bullish triple candlestick pattern that predicts the reversal of the short term downtrend. The reversal of this short term trend leads to the continuation of the long term trend, and hence this pattern is classified as a continuation Pattern. This pattern consists of three long-bodied candles that open within the previous candle’s body and close above the previous candle’s high.

Below is how the Three White Soldiers candlestick pattern looks on the price chart

Criteria for the pattern

  1. The second and third candles should open within the body of the previous candle
  2. All three candles in the pattern should not have very long shadows.
  3. The continuation pattern is confirmed by other technical indicators such as the RSI and EMA.

Three White Soldiers pattern is used by traders for both entry and exit. Traders, who were short in the currency pair will look for exit and traders who were following the long term uptrend take a bullish position and enter the market.

Falling Three Methods

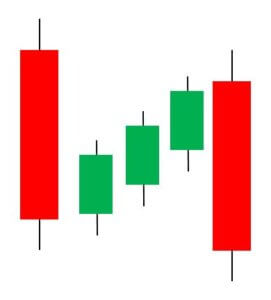
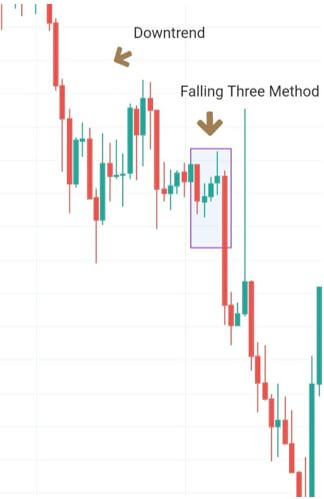
The Falling Three Methods is a major trend continuation pattern and is sometimes referred to as five candle patterns because of the confirmation candles at the first and fifth positions. These two long candles confirm the trend and its continuation. The sole of this pattern is the three counter-trend candlesticks in the middle. This pattern should never be considered as a reversal pattern; it is a clear trend continuation pattern.

Below is an image of how the pattern looks on the price chart

Criteria for the pattern

  1. The Falling Three Methods is a bearish continuation pattern with two long candlesticks in the direction of the main trend and three counter-trend candles in the middle of the two big bearish candles.
  2. The series of small-bodied candles should be of the same color. However, a bearish Doji as the third candle can also be considered.

This pattern is used by traders to initiate new short positions or add to an existing one. A trade is taken only after the fifth candle, which confirms that the trend is going to continue. There are also traders who use the 10-day moving average to confirm that the market is in a downtrend. While trading this pattern, one needs to make sure that this pattern is not at the key support level.

Conclusion

These are two famous triple candlestick trend continuation patterns. Make sure not to use these patterns stand-alone. They must be paired with other credible technical tools like indicators or chart patterns to confirm the authenticity of signals they generate. In the upcoming lesson, let’s look at some of the Reversal Triple Candlestick Patterns. Cheers!
[wp_quiz id=”61436″]