Categories
Forex Elliott Wave Forex Market Analysis

Is AUDUSD Turning Bearish?

In our previous technical analysis of the AUDUSD pair, we mentioned the potential corrective formation that was developing. In particular, we warned about the progress of an incomplete fourth wave of Minute degree identified in black, in which the pair was advancing on the wave (b) of Minutette degree in blue.

Technical Overview

As the previous chart shows, the price action seems moving in a mid-term sideways channel. This formation has been evolving since early September, when the price topped at 0.74134. In terms of the Elliott Wave theory, the figure shows the progression of a likely incomplete flat pattern (3-3-5).

In this context, the bearish rejection below September’s high of 0.74134 should confirm the end of wave (b), in blue, and the beginning of wave (c). Also, according to Elliott’s textbook, the coming wave (c) should follow an internal sequence subdivided into five waves.

The big picture of the AUDUSD pair currently reveals the gray box’s rejection suggested in our previous analysis. From here, the Aussie could start to decline in a five-wave sequence corresponding to the already mentioned wave (c) of Minuette degree, labeled in blue. 

Moreover, after wave (c) completes, the Australian currency should also end its wave ((iv)) of Minute degree in black and giving way to a new impulsive wave corresponding to the fifth wave of the same degree.

Short-term Technical Outlook

The AUDUSD price exposed in the next 2-hour chart reveals the completion of wave c of Subminuette degree identified in green, which topped at 0.74076 on November 30th, as the price action developed an ending diagonal pattern.

Once the price touched the psychological barrier of 0.74, the price began to decline, developing a breakdown below the baseline of the ending diagonal pattern, piercing the demand zone between 0.73492 and 1.73571, where the Aussie started a consolidation in the current trading session.

Considering that the pair started to consolidate, we expect an intraday sideways formation, likely a flag pattern. In this context, if the price breaks and closes below the baseline of this flag pattern, the AUDUSD could confirm the bearish continuation, which could make it drop to the next demand zone between 0.72654 and 0.72801.

Likewise, the price could extend its declines toward the next demand zone between 0.71449 and 0.71651. The movement, developed into a five-wave sequence, should complete the wave (c) of Minuette degree identified in blue, which, at the same time, could confirm the end of wave ((iv)) of Minute degree labeled in black, as we said earlier.

The invalidation level corresponding to this downward scenario is placed at the high of wave c, in green,  0.74076.

Categories
Forex Basic Strategies

A Brand New Forex Trading Strategy By Combining The ‘Flag & Pennant’ Patterns

Introduction

Until now, we discussed a bunch of trading strategies that were based on numerous technical indicators. In today’s article, we discuss a strategy that is based on a candlestick pattern. Flags and Pennants are short-term continuation patterns where the market tends to continue moving in the same direction after the formation of the pattern on the chart. These patterns are found on both short-term and long-term charts.

In the case of Flag, the initial move is a sudden, sharp directional move. It is doesn’t matter where the move is formed on the chart; what matters here is the velocity of the move. If the movement is not sharp and large, the reliability of the pattern will be under question. However, it will also use the volume indicator to confirm the strength of the Flag and pattern. Let us understand all the specifications of the strategy in detail.

Time Frame

As mentioned earlier, the Pennant-Flag strategy can be traded on time frames varying from 15 min to ‘Daily.’

Indicators

The only indicator we will be is the ‘Volume’ indicator. The rest of all is based on candlestick and price action patterns.

Currency Pairs

The strategy can only be used on major currency pairs listed on the broker’s platform. Few preferred pairs are EUR/USD, USD/JPY, GBP/USD, GBP/JPY, EUR/JPY, etc.

Strategy Concept

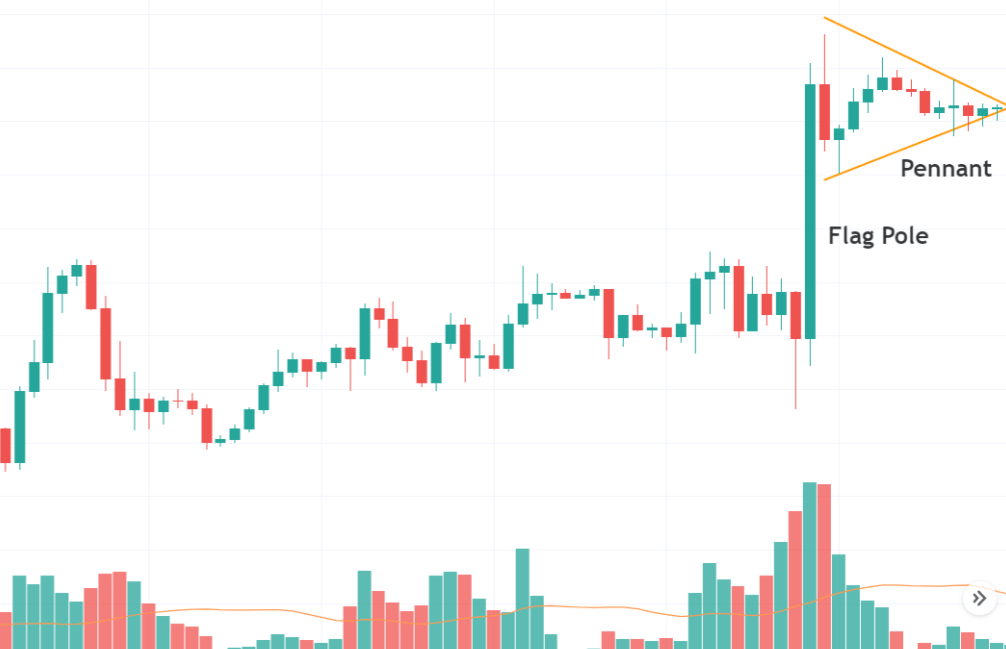
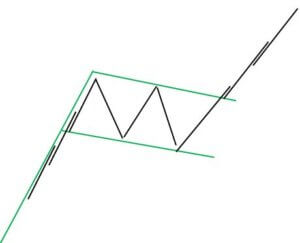
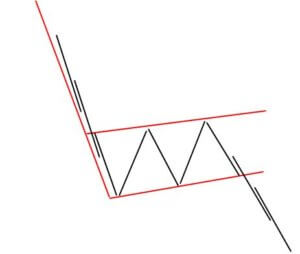
The strategy is based on the concept of the Pennant Candlestick Pattern. A sharp thrust creates a flagpole, and then when the market begins to consolidate into an asymmetric triangle, we wait for a breakout or breakdown. The consolidation is a brief pause before a potential break on either side. If the price clears the top of the ‘Pennant,’ we look for ‘long’ trades, and if breaks below the bottom of the ‘Pennant,’ we look for ‘short’ trades.

After a large vertical flagpole and a triangular consolidation, the market might be getting ready for a further continuation. The odds of a breakout increase when this pattern is accompanied by high volume. In a bullish flagpole, we place our ‘entry’ order above the ‘high’ of the flagpole, and in a bearish flagpole, we place our order below the ‘low’ of the Flag. Of course, when we enter, we’ll need to place a stop.

The stop is calculated by measuring the number of pips that is equivalent to 35-40 percent of the flagpole. For example, if the height of the flagpole is 100 pips, the stop will be placed 25 beneath the entry point.

Finally, we will need to define exits for our trade. Our first target will be equal to the number of pips that we are risking on the trade. Another strategy is to trail the stop-loss trade and exit when the market shows signs of reversal. Let us look at the specifics of the pattern and technique to make winning trades.

Trade Setup

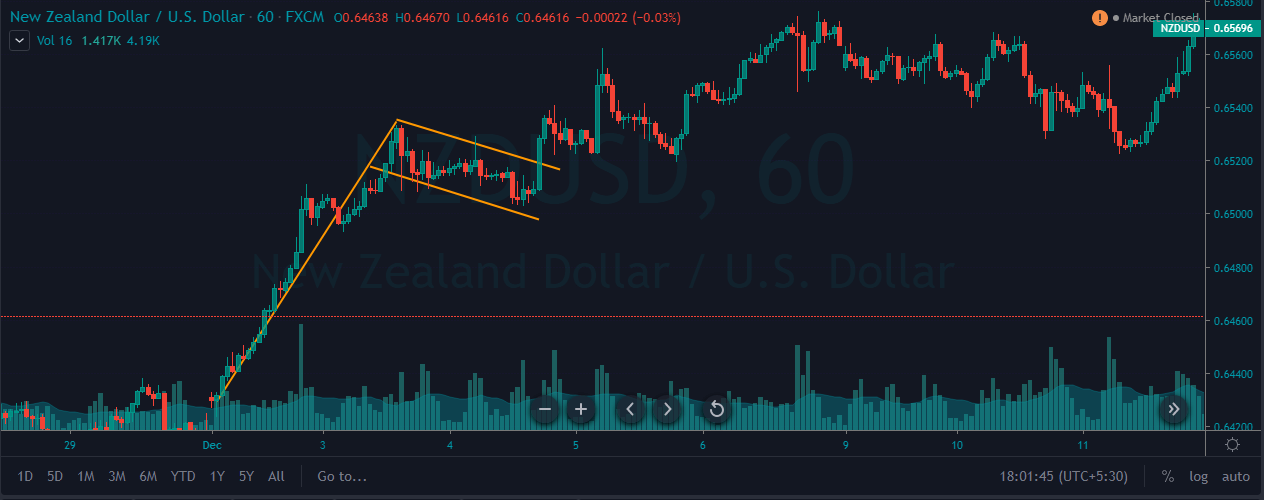
In order to explain the strategy, we have considered the 4-hour chart of EUR/USD, where we will be illustrating a ‘long’ trade. Here are the steps to execute the strategy.

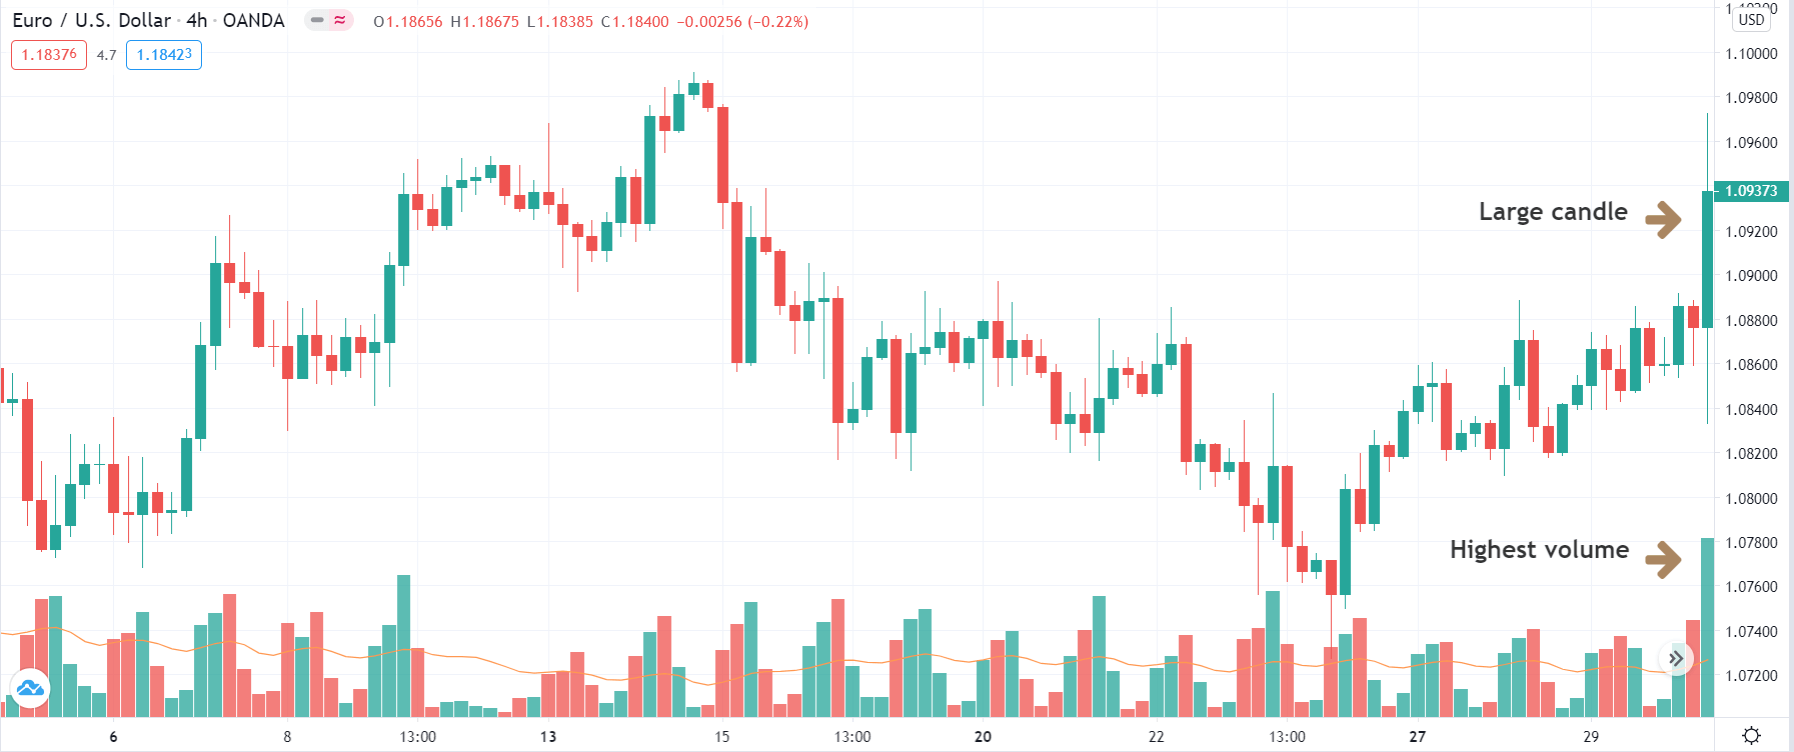
Step 1: The first step of the strategy is to wait for a sharp, sudden, and strong candle to show up on the chart. This usually happens after a major news announcement or after the release of economic data. This candle should compulsorily be with high volume as it indicates that big players of the market created this move. If the candle is not with high volume, the move cannot be trusted upon. We could use the economic calendar to find out the exact time of news release and the event.

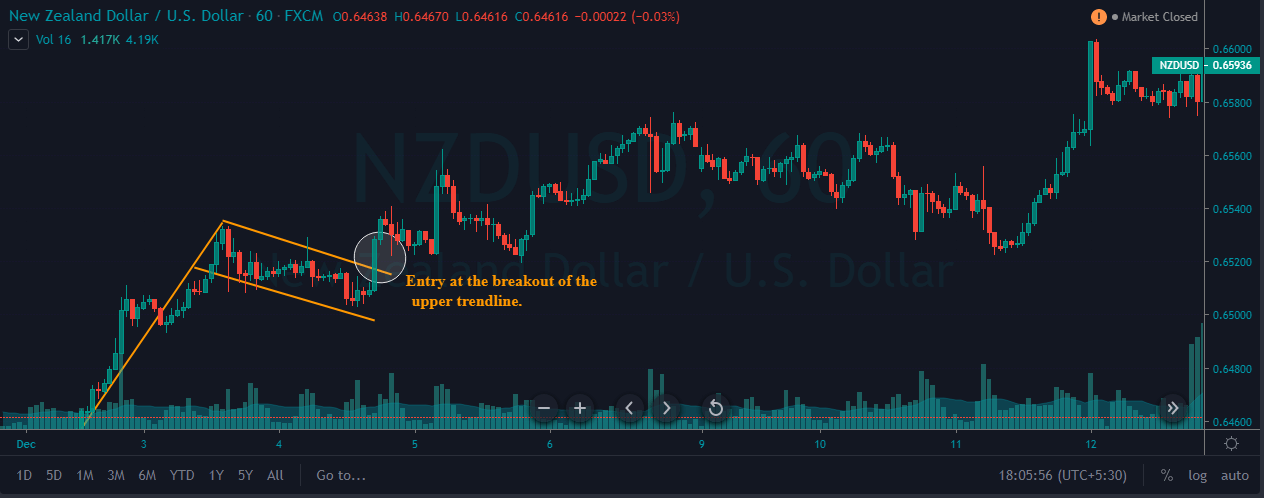
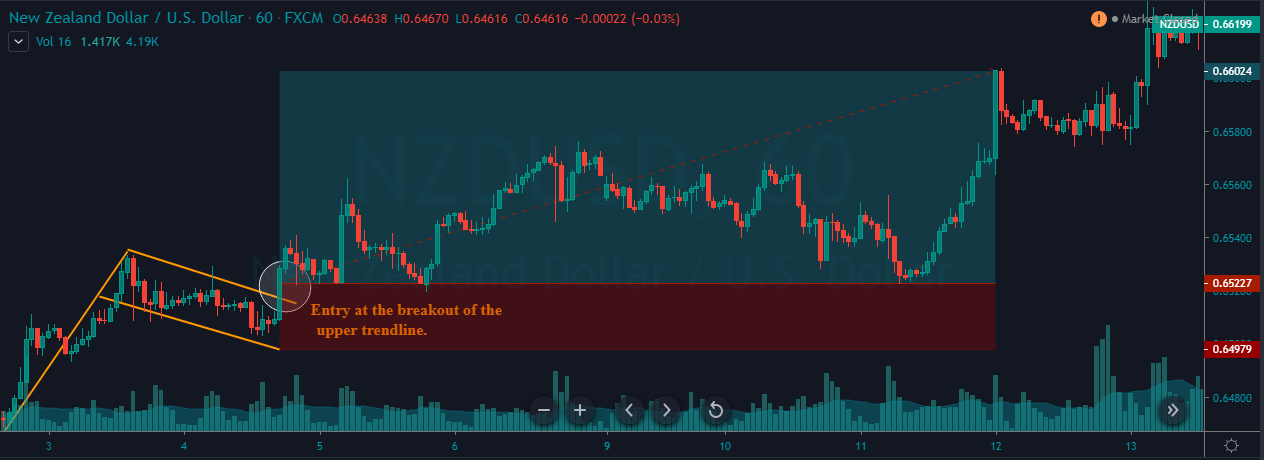
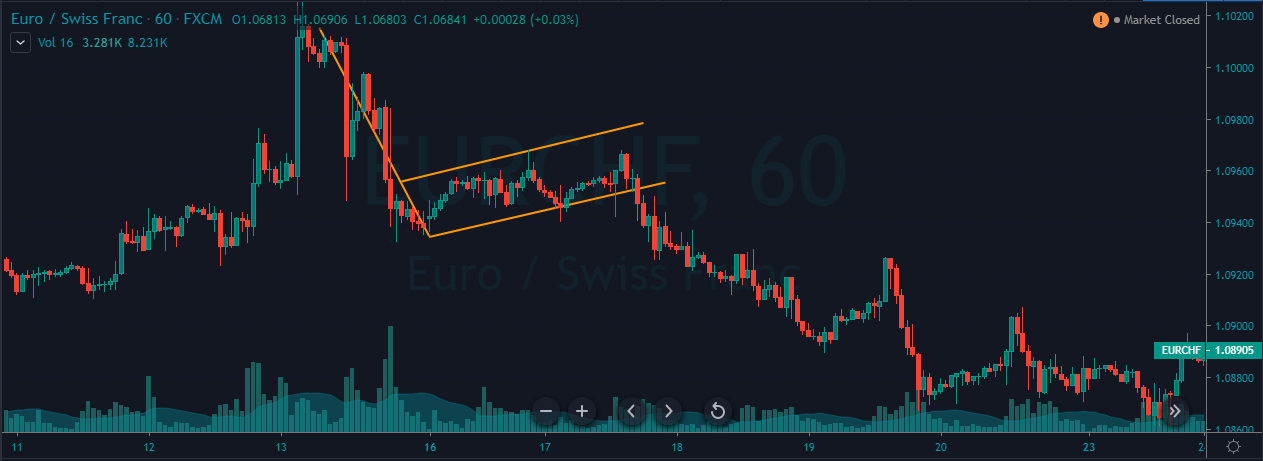
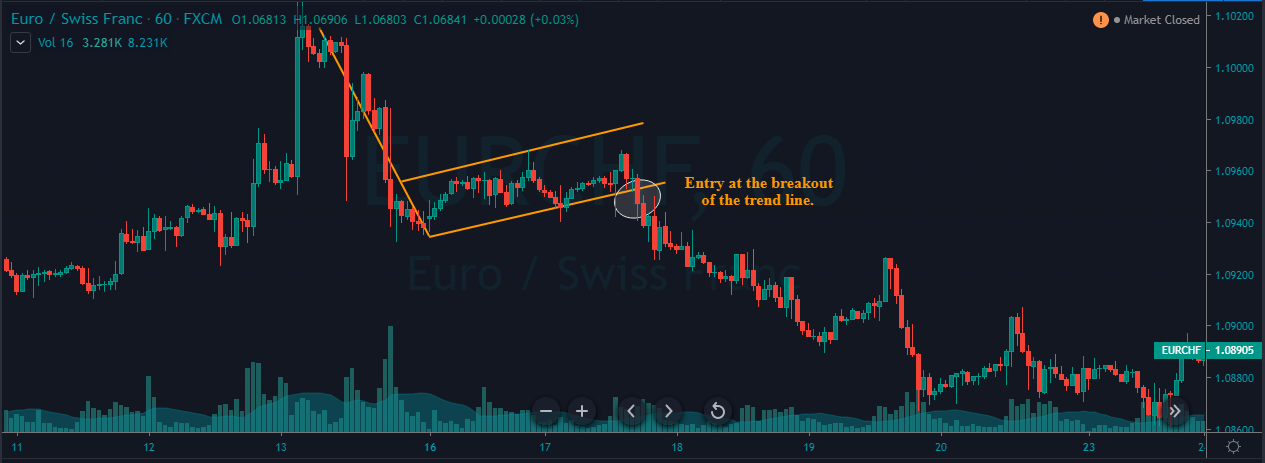
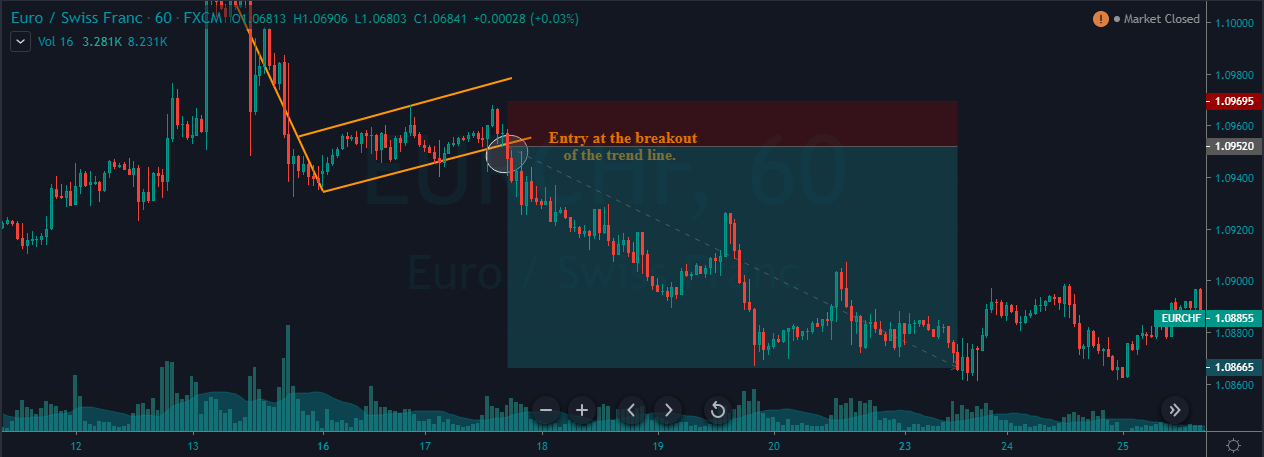
In the below image, we can see a large candle that popped up after a news announcement that took the prices sharply higher.

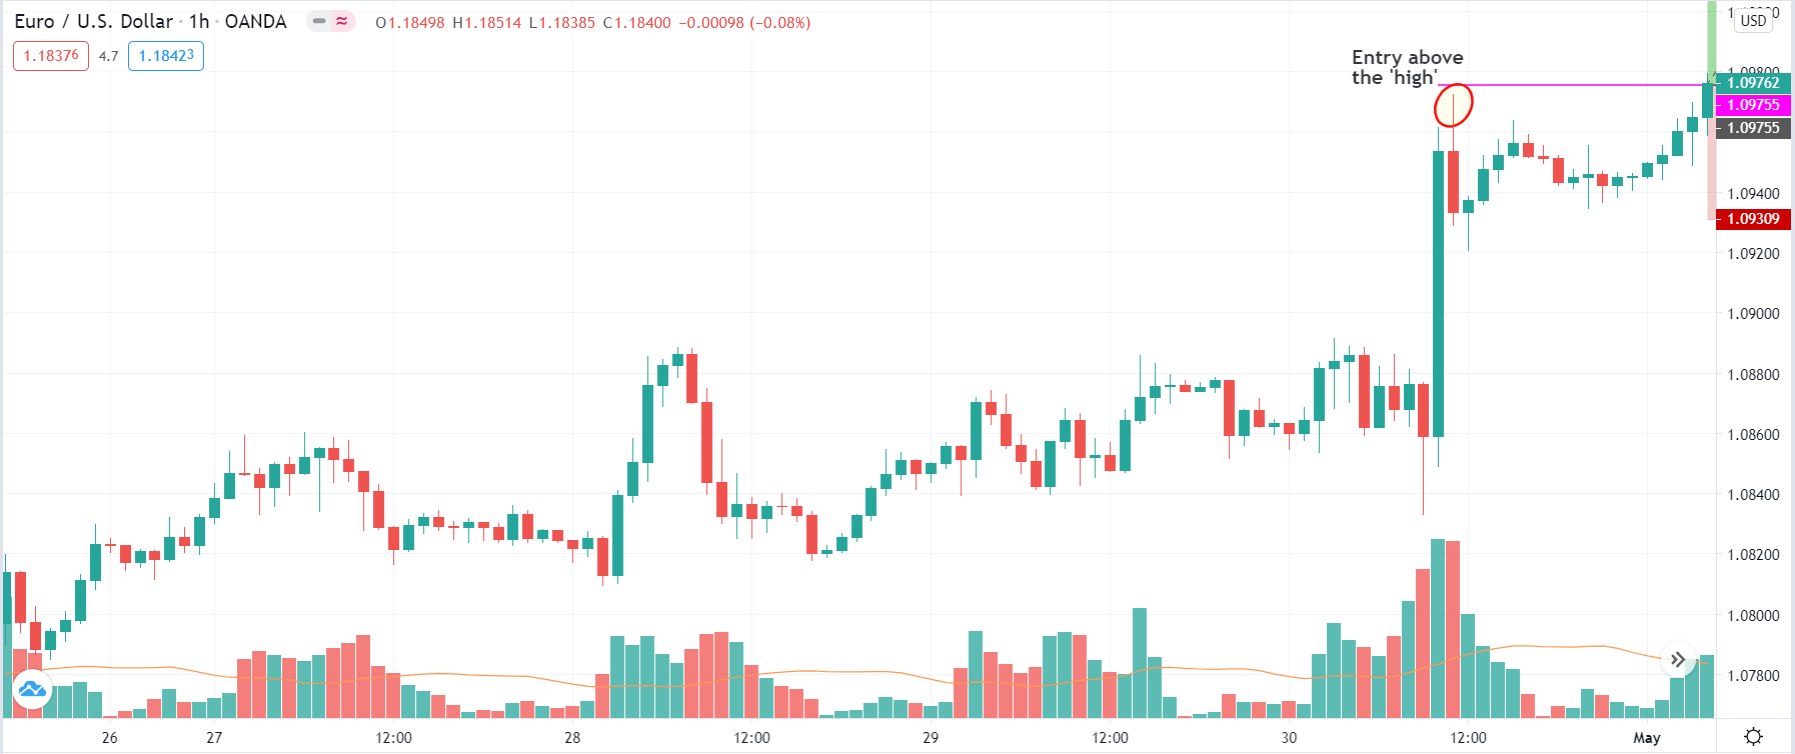
Step 2: After the sudden move, prices should necessarily move in a triangular pattern, which is shrinking in nature. Few traders also refer to this as ‘squeeze.’ This pattern should be formed on the lower time frame. Market moving in this ‘squeeze’ pattern is very important for the strategy to work at its best. This leads to the formation of a Pennant candlestick pattern. Pennants involve two parts – a vertical flagpole and a triangular consolidation. The consolidation is usually for a shorter duration of time. Once the pattern has been formed along with the necessary conditions, let us see how to enter a trade.

The below image shows the formation of a Pennant candlestick pattern on the 1-hour chart.

Step 3: The rules of ‘entry’ are pretty simple. In a bullish setup, we place a ‘long’ entry order just above the ‘high’ of the ‘flagpole’ candle formed on the higher time frame. In a bearish setup, we place a ‘short’ entry order just below the ‘low’ of the ‘flagpole’ candle. As and when the market continues to move in the direction of the ‘flagpole,’ the order will automatically be executed.

In the case of our EUR/USD example, our ‘buy’ order gets executed as soon as prices start moving higher.

Step 4: Now, let us define the exit rules for the strategy. The stop-loss is calculated by the number of pips equal to 35-40 percent of the ‘flagpole.’ Stop-loss is placed below the entry price equivalent to the pips obtained by calculation. The ‘take-profit’ is set a price where the resultant risk to reward of the trade is 1:1. Therefore, the take-profit is determined by the stop-loss. Another exit strategy is to trail the stop loss and exit after we witness a reversal pattern in the market.

Strategy Concept

The idea behind this technique is not to place most trades but to place the best trades. The most crucial aspect of the trade is the ‘Flagpole’ candle. We need to ensure that this candle is a consequence of a major news announcement and not just a normal candle. Many traders become impatient and enter even though all criteria have not been met. Patience and discipline will help us to avoid falling into this trap and keep us on the course.
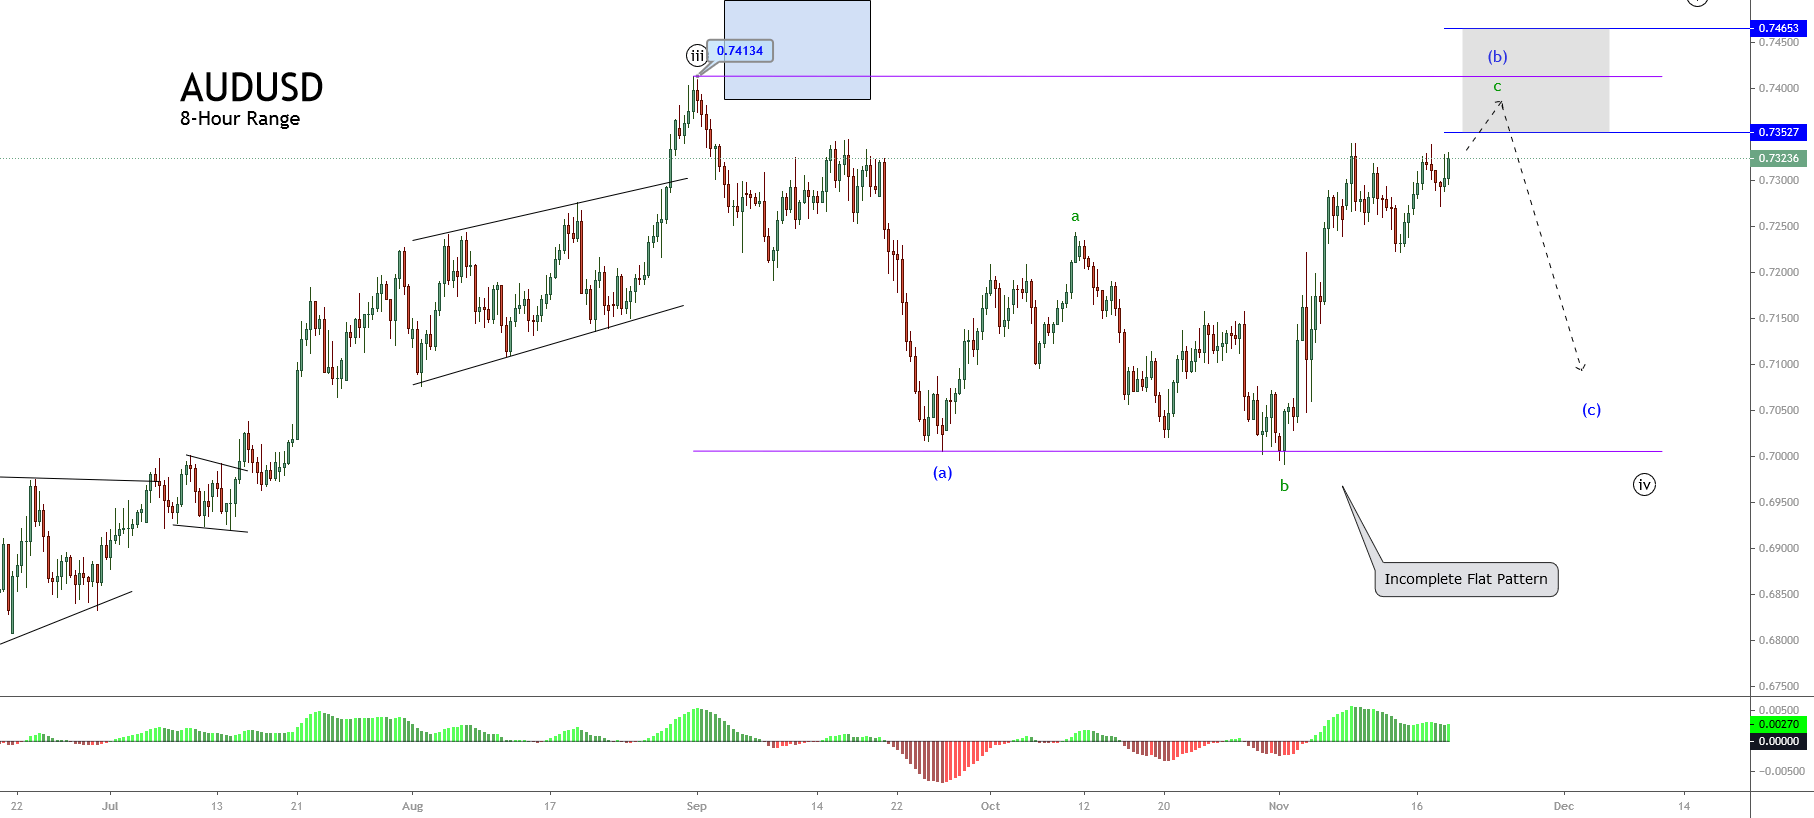
Categories
Forex Basic Strategies

Trading The Bullish & Bearish ‘Flag Pattern’ Like A Pro

Introduction

A Flag Pattern is one of the very well-known trend continuation patterns. Visually, this pattern looks like a flagpole and a flag, hence the name ‘Flag Pattern.’ A flagpole is printed by the sharp price upward move, followed by the symmetrical pullback, which forms the flag on the price chart of any underlying currency pair. When the flag breaks the trend line, it triggers the next trend move of an underlying asset. In simple words, flag forms when price action turns sideways after the sharp upward movement. This pattern can be seen on any timeframe; however, it is mostly found on lower timeframes such as 15, 5 or 3-minute chart.

Flag patterns can be both Bearish & Bullish

Bullish Flag Pattern

The bullish flag pattern starts with a strong upward move. This move implies that the sellers are entirely off guarded as the buyers took over the entire show. Eventually, the price action peaks, and it prints a pullback. The higher high and lower low of the pullback will be parallel to each other. This action results in the formation of a tilted rectangle. This whole process appears like a bullish flag pattern on the price chart.

By placing the trend line at the upper and lower end of the pullback, we can observe the diagonal parallel nature of that pullback. The breakout of the upper trend line indicates that the trend is ready to resume, and that is the best time to activate an extended position.

Bearish Flag Pattern

The bearish flag pattern is just the opposite of the bullish flag pattern that we discussed above. When the price action hits bottom, it prints the pullback where the lower low and higher high are parallel to each other.

The breakout of the lower trend line indicates that the trend is ready to resume, and it’s the best time to go short in any underlying asset.

Flag Pattern – Trading Strategies

Bull Flag Pattern Strategy

A Bull flag is a trend continuation chart pattern that indicates the likeliness of the market to move higher. (Uptrend Continuation)

Pattern Confirmation Criteria:

  • Find out a strong uptrend in any currency pair. In other words, the range of candles should be more bullish.
  • After the strong move, wait for the pullback to occur. A pullback is generally in the form of lower low and lower high. Here’s where we can expect to see a bull flag pattern on the price chart.
  • Draw the upper and lower trend lines on the price chart. When the price action breaks the upper trend line, it a sign to go long.

Here’s how the bull flag pattern looks like on price chart.

Entry – In the below NZD/USD Forex chart, we can see that the pair was in an overall uptrend. During the pullback phase, price action has printed the bullish flag pattern. The breakout of this pattern indicates a clear buy signal in this currency pair.

Stop-Loss & Take-Profit – When the price action breaks the upper trend line, it’s a sign to go long in this pair. The bull flag is quite a reliable pattern, so we can place our stop-loss just below the second trend line (lower part of the tilted rectangle). Placing the take-profit order is purely based on your trading style. If you are an aggressive trader, go for extended targets; but if you are a conservative trader, use smaller targets. In this particular trade, we closed our full position at one of the significant resistance areas.

Bear Flag Pattern Strategy

A Bearish Flag Pattern is also a continuation chart pattern, but it indicates the downward movement of the market. (Downtrend Continuation)

Pattern Confirmation Criteria:

  1. Find out a steady downtrend in any currency pair. In other words, the range of candles should be more bearish.
  2. After a strong move, wait for the pullback to occur. A pullback is typically in the form of a lower higher low and higher high. Here’s where we can expect the formation of a bearish flag pattern on the price chart.
  3. Draw an upper and lower trend line on the price chart. When price action breaks the lower trend line, it’s a sign to go short.

Here’s how the bearish flag pattern looks like on price chart.

Entry – In the below EUR/CHF 60 Forex chart, the overall market was in an uptrend. Then suddenly, sellers overwhelmed the buyers by printing a couple of strong red candles. If a bearish flag pattern appears on the price chart, we can confirm that the downtrend is going to continue. In the below picture, we can clearly see the formation of a bearish flag pattern. We can activate our sell positions as soon as the lower trend line breaks.

Stop-Loss & Take-Profit – In this trade, we must go for minimal stop-loss because the market is in a consolidation phase and not in a strong downtrend. We had closed our whole position when the price action started struggling to print a new lower low and lower high.

Bottom Line

The Flag pattern is always created by a swift up/down move, followed by the consolidation, which runs between the parallel lines. Always use the breakouts of the Flag pattern to take the positions.

Always remember that the trend is your friend. Take only buy trades in the appearance of a Bullish Flag and sell trades in the presence of a Bearish Flag.

Traditional ways suggest that the stop-loss must be set below the pole of the flag, but we don’t always have to follow this idea. While trading flag breakouts, the stop-loss just below the recent low is good enough.

In the Forex market, the flag pattern performs very well in active trading hours as most of the swift moves (like flagpole formation) occur in busy hours only. If you are a strict confirmation trader, let the price action to retest the trend line to activate your trades. This procedure will help you in picking the higher probability trades, although you’ll miss the higher-momentum moves that don’t pause to continue moving.

Categories
Forex Elliott Wave

Corrective Waves and the Flag Pattern

Is it possible to simplify the wave analysis and compare it with classic chartist patterns? Identifying Elliott Wave patterns can seem confusing, especially if you are looking to differentiate between a flat or a zigzag pattern. In this educational article, we will look at some of Elliott’s patterns and compare them to traditional chartist figures.

The Normal Zigzag, Flat and the Flag Pattern

In the Elliott wave theory, the zigzag and the flat pattern are formations built by three internal waves. At the same time, depending on the strength of the corrective move, these could be more or less profound. The following figure shows the comparison between a normal corrective wave, which can be a zigzag or flat, and the flag pattern.

If we remember the wave theory, a zigzag pattern follows a 5-3-5 sequence, and the flat structure, a 3-3-5 internal subdivision. However, both formations can be simplified as a three-legs formation. Now, as we can see in the previous figure, the normal Zigzag and Flat structures can be simplified by a flag pattern.

The flag pattern is a chartist figure that represents a pause of the market trend and usually resolves as a continuation of the previous movement. The same situation occurs with the zigzag and flat pattern.

The flag pattern is spotted by a descending (or ascending) move, which connects in a tight range, its highs, and lows within a parallel channel.

The following chart exposes a series of flag formations detected on the GBPJPY cross in its 12-hour range.

On the figure, we observe that Flag patterns are commonly found in financial markets. According to Thomas Bulkowski’s publication, the flag pattern has a break-even or failure rate below 4%, which converts it as a “pretty nice” pattern to trade.

Flag Pattern Trade Setup

The flag trade setup is similar to the zigzag of flat configuration.

  • Entry: The trade is triggered once the price surpasses the end of wave “B,” or the previous swing high or low.
  • Protective Stop: The trade will be invalid if the price drops below the low of the flag.
  • Target: We will determine the profit target level using the Fibonacci expansion tool. The first target will be at the 100% level, as a second target at 127.2%, and the third profit target level will place at 161.8%

Putting All-together

The following chart illustrates the GBPCHF in its 8-hour range. In early January 2019, the cross developed a rally from 1.2248, which drove to the price until 1.2573. Once reached this high, the price action formed a corrective move in three waves. The bullish position was activated once price action surpassed the previous swing at 1.2524.

After the breakout, the price rallied over the three profit targets proposed. Note how the price runs when the flag pattern is tight and high, and the difference when the flag is broad in terms of price and time.

Conclusion

From the analysis realized, we conclude that a corrective structure as a normal zigzag or flat formation can be simplified as a flag pattern. This simplification could aid the traders in reducing the time analysis elapsed to the decision process before to place an order.

The confidence level of this pattern as a continuation figure could contribute to reducing the risk in the trading process.