Categories
Forex Signals

Watch this Breakout Before to Buy

Description

The NZDUSD pair in its hourly chart shows a sideways sequence that reacted mostly bullish after dropped to 0.5468, the lowest level reached since April 2009.

This Tuesday, the stock markets began to show bounces signals despite the bearish opening observed on Monday trading session. The context seen makes us suspect an increase in the traders’ interest on the risk-on side. This scenario could lead to a boost to commodity currencies such as the New Zealand Dollar.

The breakout and close above the level 0.5878 make us foresee that the price could confirm an upward which could drive to the oceanic currency until 0.6186.

The level that invalidates our bullish scenario locates at 0.5655.

Chart

Trading Plan Summary

  • Entry Level: 0.5878
  • Protective Stop: 0.5655
  • Profit Target: 0.6186
Categories
Forex Elliott Wave

Corrective Waves and the Flag Pattern

Is it possible to simplify the wave analysis and compare it with classic chartist patterns? Identifying Elliott Wave patterns can seem confusing, especially if you are looking to differentiate between a flat or a zigzag pattern. In this educational article, we will look at some of Elliott’s patterns and compare them to traditional chartist figures.

The Normal Zigzag, Flat and the Flag Pattern

In the Elliott wave theory, the zigzag and the flat pattern are formations built by three internal waves. At the same time, depending on the strength of the corrective move, these could be more or less profound. The following figure shows the comparison between a normal corrective wave, which can be a zigzag or flat, and the flag pattern.

If we remember the wave theory, a zigzag pattern follows a 5-3-5 sequence, and the flat structure, a 3-3-5 internal subdivision. However, both formations can be simplified as a three-legs formation. Now, as we can see in the previous figure, the normal Zigzag and Flat structures can be simplified by a flag pattern.

The flag pattern is a chartist figure that represents a pause of the market trend and usually resolves as a continuation of the previous movement. The same situation occurs with the zigzag and flat pattern.

The flag pattern is spotted by a descending (or ascending) move, which connects in a tight range, its highs, and lows within a parallel channel.

The following chart exposes a series of flag formations detected on the GBPJPY cross in its 12-hour range.

On the figure, we observe that Flag patterns are commonly found in financial markets. According to Thomas Bulkowski’s publication, the flag pattern has a break-even or failure rate below 4%, which converts it as a “pretty nice” pattern to trade.

Flag Pattern Trade Setup

The flag trade setup is similar to the zigzag of flat configuration.

  • Entry: The trade is triggered once the price surpasses the end of wave “B,” or the previous swing high or low.
  • Protective Stop: The trade will be invalid if the price drops below the low of the flag.
  • Target: We will determine the profit target level using the Fibonacci expansion tool. The first target will be at the 100% level, as a second target at 127.2%, and the third profit target level will place at 161.8%

Putting All-together

The following chart illustrates the GBPCHF in its 8-hour range. In early January 2019, the cross developed a rally from 1.2248, which drove to the price until 1.2573. Once reached this high, the price action formed a corrective move in three waves. The bullish position was activated once price action surpassed the previous swing at 1.2524.

After the breakout, the price rallied over the three profit targets proposed. Note how the price runs when the flag pattern is tight and high, and the difference when the flag is broad in terms of price and time.

Conclusion

From the analysis realized, we conclude that a corrective structure as a normal zigzag or flat formation can be simplified as a flag pattern. This simplification could aid the traders in reducing the time analysis elapsed to the decision process before to place an order.

The confidence level of this pattern as a continuation figure could contribute to reducing the risk in the trading process.

Categories
Forex Elliott Wave

The USDJPY and its 3-Year Triangle

The triangle is one of the three basic corrective patterns along with the Flat structure, with more variations within Elliott’s Wave Theory. In this educational article, we will review the basic concepts of the triangle pattern and then apply it to the USDJPY pair.

The Fundamentals

Triangles are one of the three basic corrective formations described by R.N. Elliott. Five internal segments characterize them. The inner legs overlap and follow an internal sequence as 3-3-3-3-3.

The following figure shows the different types of triangles. By simplification, we omitted the internal structure of each segment that composes the triangle pattern.

We should consider the nature of the triangle, a balance between the buying and selling forces. In this context, and under a conservative approach to trading, it is not desirable to trade within this internal structure. However, the breakout of price action across the wave (D) can provide a reliable entry to the market with reduced risk.

The 3-Year Triangle of USDJPY

The following chart corresponds to the USDJPY pair in its weekly timeframe, using a log scale. We observe the price action on the Japanese currency developing a Contracting Triangle structure that began at the end of 2016.

The next chart shows the USDJPY moving in a 12-hour timeframe. The pair shows the last internal segment corresponding to a wave (E) of Intermediate degree labeled in black.

At the same time, in the last figure, we can distinguish the price action developing an Expanding Triangle formation in a wave C of Minor degree labeled in blue. However, the RSI oscillator reveals in its progress the shape of a contractive triangle pattern.

It should be noted that when the price action develops an Expansive Triangle in a wave C, the pattern should correspond to an Expansive Diagonal formation. Remember that a diagonal pattern has five internal waves overlapped one with another. At the same time, each inner leg holds three segments.

Trading the USDJPY Triangle

The USDJPY pair in its 12-hour chart shows an incomplete expansive diagonal. Consequently, positioning on the long-side could still have endeavored with a short-term objective placed in the upper trendline of the diagonal. A likely target area would be between 109,716 and 110,551.

Considering that the invalidation level of the bullish segment is the bottom of the wave ((iv)) in green at 108,242, the breakdown and close of the price below this level could give us the first bearish scenario with a target at the end of the wave B labeled in blue located at 106,625.

Now, if the USDJPY price continues extending its falls below the end of wave C in blue and (D) in black located at 104,446, a major-degree bearish scenario would be activated. Under this context, the pair could see the psychological support of 100 yen per dollar.

Conclusions

Depending on the trader’s style and its risk aversion, the internal structure of the triangle pattern could be traded one timeframe shorter than the time frame in which the triangle has been identified.

We must remember that the internal structure of the triangle follows a sequence 3-3-3-3-3. Under this context, a three-wave corrective structure can be a Flat pattern (which has a subdivision 3-3-5); or it can also be a zigzag pattern (5-3-5). Therefore, an internal wave C could give a trading opportunity. However, knowing the nature of the triangle pattern, and considering it is formed by the struggle between buyers and sellers, the targets of the movements anticipated should be limited by the triangle formation.

Categories
Forex Elliott Wave

Trading the Elliott Wave Principle – Part 5

Triangles are the third fundamental Elliott wave corrective structure. In this educational article, we will review the guidelines to trade this pattern.

The basics

The triangle structure is a corrective formation with a 3-3-3-3-3 internal sequence. Triangles usually tend to appear in waves four and B.

In this formation, volume tends to decrease as the triangle progresses. Also, it characterizes by the balance between bull and bear traders.

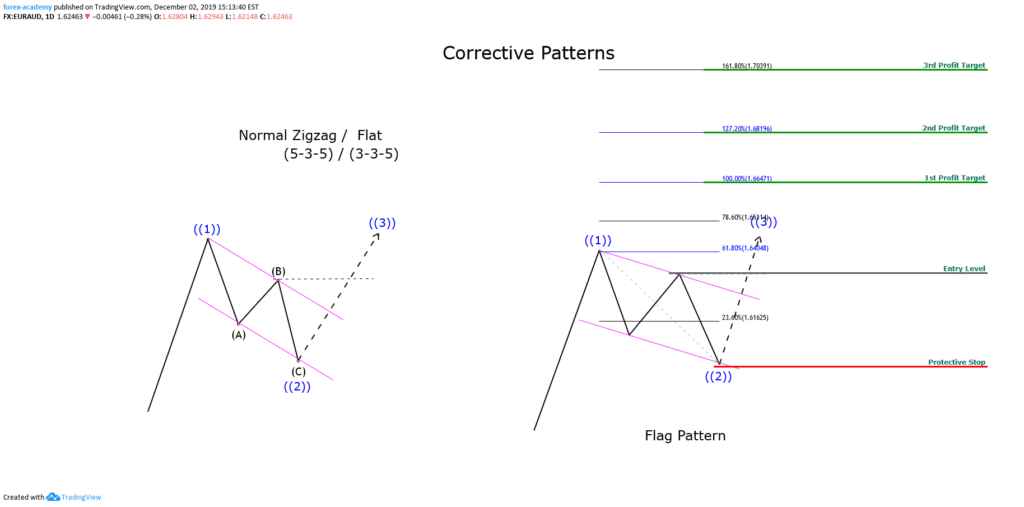
The following figure illustrates the trading setup for a contracting triangle. The entry is triggered once the price action strikes and closes above the end of wave (D) labeled in black degree.


To place the potential targets, we can measure the Fibonacci projection from the origin of wave ((3)) or ((A)) labeled in red, and the lowest level of the triangle. The first target will be at 61.8%, and the second target at 100%.

The trading setup is invalid if the price pierces the wave (A) labeled in black degree.

Golden triangle

Gold, in its weekly chart, shows the guideline of an Elliott wave contracting triangle in progress. The bullish sequence starts on November 30, 2015, once the yellow metal found buyers at $1,046.54 per ounce.

The golden metal made the first rally until early July 2016 at $1,375.15 per ounce. After this move, Gold made an up and down sideways movement till late April 2019.

Now that we have identified the start of a price cycle, we have to face the question, “do I recognize an Elliott wave pattern?”

In this case, we start from the most straightforward formation, which could correspond to a Contracting Triangle.


Now that we have recognized a wave pattern, we advance to the second stage, which is to define our trading plan. Following the triangle setup guideline, we have to expect the breakout of wave (D) labeled in black at $1,346.75.

The theory says that the first profit target must be at 61.8% of the Fibonacci projection. However, this level is under the entry-level. In this case, we place the first profit target at the 100% level at $1,453.78. The second profit target will be at the 127.2% level at $1,543.80 per ounce.

The invalidation level is theoretically below the wave (A) labeled in the black degree at $1,122.10.

Now that we have defined the trading plan, the third stage is to manage the trade and risk. The first step is to reduce the risk. In this case, we move the protective stop from the theoretical invalidation level to the end of the wave (E) at $1,266.39, as shown in the next figure.


Once that we have reduced the risk and the trade advances, the trader must eradicate the risk. In this example, after Gold reached the first profit target at $1,453.78, we move the protective stop to the entry-level.

As an alternative to eliminate the risk, the protective stop could be placed considering the entry-level plus the trade costs, for example, commission costs and swap.


The last step of the trade management, before the trade reaches the final profit target, is to protect open profits. This last stage depends on the criteria of each trader.

Categories
Forex Elliott Wave

Trading the Elliott Wave Principle – Part 4

The flat pattern is the second fundamental Elliott Wave corrective structure. In this educational article, we will review the guideline to trade the flat structure.

The basics

Flat pattern is an Elliott wave corrective structure built by three waves, and its internal sequence is 3-3-5. There exist a single model to trade a flat formation. The following chart shows the trading setup of a flat corrective structure.


From the basic model, the entry is given once price action breaks and closes above wave 4 labeled in blue, of wave (C) labeled in black. The profit target is placed in the same way as the zig-zag trade setup. It is at 100%, 127.2%, and 161.8% of the Fibonacci projection of waves ((1)) and ((2)) labeled in red. The invalidation level is under the end of the wave (C).

Trading the flat pattern

Before to define place an order, we must answer the question, “Do I see some Elliott wave pattern?”.

In the example, the IBM (NYSE:IBM) in its 8-hour chart shows a first five waves bearish sequence started on April 10, 2014. Once IBM founded buyers on January 29, 2015, at $149.52 per share, the price developed a three waves movement as a flat pattern, which ended at $176,25 on May 04, 2015.


If our hypothesis is correct, it is the Elliott wave pattern recognized is a flat structure, we can do our trading plan. The entry should be placed after the completion of the second wave (B) or (2) labeled in black degree.

The short position is triggered after the breakdown and close below the last swing at $168.75. The target is defined using the Fibonacci projection between (A) and (B) waves. In our example, IBM reached the first target at $126.53 on 100% of the Fibonacci projection.

The third part of the trade is to manage the risk of the trading plan. The first stage is to reduce the risk; for this stage, we set the invalidation level above the end of wave (B) or (2) at $176.25. Once IBM plummets, we eliminate the risk after the price drops into the 61.8% of Fibonacci projection at $145.60.

Finally, we have to protect the open profits, for example, each $5 of advance, we can move the protective stop each $5 of progress.

Categories
Crypto Market Analysis

Bitcoin Gold found a temporary resistance

Bitcoin Gold (BTG/USD)

Market Cap. $1.26B

Circulating Supply: 16.98M BTG

Max Supply: 21M BTG

Volume (24h) $30.81M


The Bitcoin Gold (BTG/USD) went up a bit today and is trying to make a valid breakout above a critical dynamic resistance. Price has found a temporary resistance in the short term, that’s why it went slightly down. It is trading at 74.900 level and is located above some very important support levels, but we still need a confirmation for a larger rebound.

Bitcoin Gold chart

The BTG/USD has found a bottom right above the 38.000 psychological level after the failure to reach and retest the median line (ML) of the descending Pitchfork. The price has shown some oversold signs after several false breakdowns below the mentioned median line (ML).

The crypto slipped below the lower median line (lml) of the ascending pitchfork but failed to stay there signaling a bullish movement. It has found strong resistance at the 50% Fibonacci line (ascending dotted line) of the ascending pitchfork and now has decreased a little to accumulate more directional energy.

A valid breakout above the upper median line (UML) of the descending Pitchfork will signal an increase at least till the 50% Fibonacci line. Only a valid breakout above this line will confirm an advance towards the median line (ml) and the first warning line (WL1) of the descending pitchfork. A significant increase will be invalidated by a valid breakdown below the lower median line (lml).

Conclusion

Bitcoin Gold (BTG/USD) could double its current value as long as will stay within the ascending pitchfork’s body. A valid breakout above the 50% will signal that the price is strongly bullish.

©Forex.Academy

Categories
Crypto Market Analysis

Stellar To The Moon?

Stellar (XLM)

Market Cap. $6.69B

Circulating Supply 18.57B XLM

Max Supply: 0 XLM

Volume (24h): $177.67M


XLM/USD increased sharply in the last days and has managed to jump above some very important resistance levels. Stellar increased like the other major crypto after the massive drop but remains to see how long the rebound will be.

Stellar (XLM) - Forex Academy

XLM/USD has finally managed to breakout above the downtrend line. Price has failed to reach this line since January 2018. You can see that I’ve added an ascending pitchfork hoping that I’ll catch a significant upside movement.

The rate has made several false breakdowns below the lower median line (LML) of the ascending pitchfork. It has failed to stay below the 0.2000000 psychological level and now tries to reach new highs.

Stellar increased by 60.22% in the last 7-days and has managed to jump above the 50% Fibonacci line (ascending dotted line) and above the 0.3433903 static resistance. The breakout needs confirmation because another false breakout above the 50% Fibonacci line will send the rate down again.

A valid breakout will lead the rate towards the next upside target represented by the median line (ML). The major upside target remains at the upper median line (UML) as long as the rate stays within the ascending pitchfork’s body.

Price has come back down to test and retest the broken 50% Fibonacci line and the 0.3433903 level. We should wait to see if this will really be a valid breakout before we go long on this crypto. A failure to stay above the 50% line could signal a minor corrective phase. Stellar could still increase despite a minor drop as long as stays above the outside sliding line (SL).