Categories
Crypto Daily Topic

What’s a Whitepaper and How Can You Write One? 

If you have been in the cryptocurrency and blockchain space for some time, then you most certainly must have heard of the term whitepaper. It is the reference document that we run to when we want to find out what a crypto project is about. It’s the kind of document Bitcoin Founder Satoshi Nakamoto wrote when he introduced the concept of cryptocurrency and blockchain to the world.

Within the last decade, we have had a new crypto project launched almost every week. What the majority of these projects have in common is a white paper that was used to reel in investors. Even the most absurd cryptos like the Useless Ethereum Token raised significant amounts of money. While it might not have been a whitepaper, it still outlined the product details and managed to net a jaw-dropping $300k

In this guide, we explain the process of writing a white paper, highlighting all the pointers needed to get you started. But first, what’s a whitepaper, and why’s it a big deal? 

What’s a Whitepaper? 

According to Investopedia, “a whitepaper is an informational document usually issued by a company or not-for-profit organization to promote or highlight the features of a solution, product or service. White papers are often written as sales and marketing documents used to entice or persuade potential customers to learn more about or purchase a particular product, service, technology, or methodology.”

The term white paper can be traced back to 1922. Many people point to the British government’s Churchill White Paper as the earliest form of a whitepaper. These have since seen a dramatic rise in usage within the last decade in the midst of the cryptocurrency craze as upcoming projects issue white papers in a bid to attract investors.

Why are Whitepapers Important? 

To qualify the importance that whitepapers have to come to embody, let’s look at a 2013 study by Eccolo Media. The study sought to establish the effectiveness of various marketing strategies. These were some of the conclusions of the research: 

  • 49% of consumers had used a whitepaper to make a tech purchase decision
  • Whitepapers trumped case studies, success stories, product brochures, blog articles, social content implementation scenarios, infographics, e-newsletters guides, and media files to be the most influential type of content marketing, 
  • Whitepapers were the most effective form of content during the pre-sale period when investors are not aware of your product
  • 7 out of 10 respondents said it was important or very important to continue receiving information about a product after purchase. Whitepapers fit this bill the best followed by case studies and tech guides

Perhaps the most famous whitepaper so far is Satoshi Nakamoto’s. In his whitepaper:” Bitcoin: A Peer-to-Peer Electronic Cash System,” he introduced Bitcoin, the first and most successful cryptocurrency to the world.

This white paper also paved the way for an incredibly successful industry but completely changed how we view money. That whitepaper introduced us to the revolutionary technology known as the blockchain. It essentially marked the beginning of a new era. 

How to Write a White Paper

Before you even start writing the paper, you’re going to need to do some homework. The first step, like with all kinds of writing, is conducting thorough research. You’ll then need to read other white papers and compare them with what you have. And finally, you’ll need to put everything together. 

#.1 Research

A well-researched whitepaper is authoritative. People respect well-researched Information. For every problem that you are trying to solve, you need to talk about what previous attempts have accomplished and/or come short of. Of course, you’ll need to credit the original sources later on. This will lend you more credibility. 

#2. Read Other Whitepapers

In the world of crypto, there’s always the likelihood that someone is working on an idea similar to yours. In light of this, you’ll want to read other whitepapers to avoid duplication and to identify the places where you can really showcase your project’s unique selling points. Additionally, it might help to look at the particularly great whitepapers that came before yours. Bitcoin and Ethereum whitepapers are great starting points.  

#3. Organize

After research, everything will possibly be muddled together. This is where you structure your information so it will be easy to use during the writing process. 

#4. Identify Your Audience

You need to single out your target audience. What type of audience are you looking at? Are they of a particular age group? Are they located in a particular geographical area? Do they have particular interests? What kind of people would be interested in your project? Once you identify your target audience, you’ll be able to package your information in a manner that’s appealing to them. 

How To Structure Your Whitepaper

After you’ve done your research on what to include in your whitepaper and identified your target audience, now’s the time to start creating your whitepaper. There’s no standard structure on how to format a whitepaper. Nevertheless, any whitepaper needs to answer the following questions: 

  • What’s the aim of the project? 
  • Can its model make money?
  • What problems will it solve?
  • What differentiates it from competitors? What’s its unique selling point?
  • How do you plan to utilize the raised funds?
  • What will be the utility of the project’s token?
  • Does the project need a blockchain?
  • Who’s on the team, and what are their credentials?
  • Does the project have a working model already, or is it still in the theoretical stage right now?

While that’s a general guide, there are some sections that any whitepaper must outline. Let’s get a look below: 

#1. Headline and Abstract

This section is supposed to draw in readers, investors, and all other interested parties. An abstract is a snapshot of what your whitepaper is all about. While it should be short, it should give readers the reason to keep reading. 

#2. Introduction

Next is the introduction. Bear in mind that you’re still trying to appeal to the reader, which is why you need to pack a lot of relevant info, yet just briefly, in this section. Let your readers know why the world needs this project right now. What economic, social, or political need will it fill? 

#3. The Problem, Solution, and Product Description

This section sheds light on the problem you want to solve with your project and the solution that you’re proposing. It will make or break your whitepaper. As such, you need to go all in. Take time and explain the technical details of your product very clearly. Include graphics where possible. 

You need to use a formal and almost academic tone. Further, be factual and back up every single claim with a reference.

#4. Token Economics

Explain to investors what will be the utility of your project’s token. Explain as clearly as possible the role of the token in the ecosystem. Remember, the more utility it will have, the more value it will have. This is because if you don’t clearly define your token, investors will not expect much out of it.

As a result, when the market drops, they’ll quickly drop it for more valuable tokens. You need to give people reason to hold on to your token, regardless of the nature of the markets. In other words, people should be able to see the long-term value of your token.

#5. Token Usage Guidelines 

Since you’re trying to raise money, it’s only necessary that you explain to investors where their money is going. This is especially important considering the prevalence of scams in the ICO and crypto arena. For this reason, you owe your potential investors a detailed plan as to how you’re planning to spend the money. 

#6. Development Roadmap

The roadmap is the timeline within which your team intends to accomplish the different project milestones. A roadmap is important because it enables investors to have realistic expectations of the project. Plus, a roadmap makes it easier to monitor the progress, and it helps keep your team accountable. 

Ideally, a roadmap should include the milestones that you intend to achieve for the next 12 to 24 months, and it should at least include a beta-launch. If some tasks in the roadmap have already been accomplished, be sure to state that clearly as that will score major points with investors.

#7. Project Team Members

It’s very important to talk about the team on your project. Most investors are looking to see the credibility of the founders/employees/advisors. While some project developers have gone completely anonymous and have succeeded, nevertheless, this success may not always replicate for every occasion. The bigger part of the white paper is all technical, so why not add some human touch by talking about people? Photos and a short biography for the team members go a long way.

Designing Your Whitepaper

Now that you know what should go into your whitepaper, how you present it is just as important. One of the things you to consider is the cover page. A cover page should be clean, crisp, and professional. You’ll also want to incorporate images throughout the document to provide relief and a visual representation of what you’re talking about. 

Some whitepapers even break with the traditional-looking document and jazz the whole thing up. The Ardor whitepaper is a perfect example of this. 

Where to Post the Whitepaper

Over the years, many projects have posted their whitepaper on Bitcoin-related forums, on GitHub, or their website. However, it’s probably best to post it on the website where people can directly find it. Of course, you can always post the link to it on various sites when promoting your project. 

About White Paper Templates 

Just like with any official document, you’re likely to find numerous white paper templates on the web. And with the proliferation of ICOs everywhere, it’s not uncommon to see project managers hiring professionals to write for them.

However, relying on such templates or freelancing services to create your white paper is not recommended. If you want a unique and quality whitepaper, you need to dedicate time to it. Remember that the whitepaper is a medium through which you’re trying to attract your investors, and a subpar document will simply not cut it.

Pitfalls to Avoid When Creating a White Paper 

When writing a white paper, there are some common pitfalls you will want to avoid. Some are common to writing, while others are specifically related to the niche. These include:

  • Spelling mistakes – These are a complete no-no. They reflect poorly on your professionalism and your seriousness about the project. Utilize a tool like Grammarly and iron these out.
  • Subjective opinions and arguments – Remain objective about the claims and perceptions that you make.
  • Overambition – This is when a white paper lists overblown goals with little or no backing. If you say that you are going to achieve a particular goal, then illustrate how you are going to do it. 
  • Tokens – Does your token have a clear utility? If not, better get back to the drawing board and make your token one that investors will readily invest in.
  • Team – Any serious investor will want to check up on who your team members are. You want to make sure all your team members are up to the task.
  • Unrealistic Roadmap – This is when a whitepaper overstates what it’s going to achieve in an unrealistically short amount of time.
  • Formatting Mistakes – This could be images without a uniform resolution. It could also be an inconsistent font or layout. 

Final Words 

Writing a whitepaper can be daunting, but if you follow these guidelines, you’ll find it might be easier than you ever thought. When you get as much background information as you can, get a look at other whitepapers, and organize your thoughts, you are on the way to writing a winning one and getting readers hooked. Since your goal is to raise money for your project, you want to get this right. Good luck! 

Categories
Crypto Videos

Bitcoin vs Fiat currencies – Battle Of The Titans!
 

Bitcoin vs. Fiat currencies – The best investment in the past 1200 years!

Although it was not designed as an investment vehicle, Bitcoin’s value increase has made it the best currency investment in the last 1,200 years.
Its value appreciation over the past 11 years truly sets it apart from all of the world’s fiat currencies.
The first widely accepted Bitcoin commercial transaction happened on May 22, 2010, when Laszlo Hanyecz bought two pizzas for exactly 10,000 BTC. With the pizzas being worth around $30, this puts the transaction value to around $0.003 per BTC at this point.
If we take the price of $0.003 per Bitcoin as a reference point, Bitcoin’s price has appreciated over 320 million percent over the past ten years. Now let’s compare that with other currencies.

The US Dollar

The US dollar has been the only and official currency of the United States ever since the Coinage Act of 1792. In those 228 years, the US dollar managed to devalue quite a bit due to inflation.
According to consumer price index data, we know that $1 in 1792 bought the equivalent of today’s $26.71. In other words, the US dollar has lost over 96% of its value in these 228 years. The vast majority of the value dollar managed to lose actually happened since its decoupling from the gold standard, which happened in 1971.

The Euro

The Euro became an official currency on January 1, 1999, making it just ten years younger than Bitcoin. Therefore, we cannot say that currencies performed worse just because they are significantly older.
The Euro suffers from basically the same design issues as the dollar, the main one being inflation. One Euro today is worth the equivalent of just 0.70 euro in 1999, meaning that this currency has lost thirty percent of its value in only 21 years.

The British Pound

The British Pound is the oldest world currency still in use. It is actually over 1,200 years old. The decimalized pound sterling of today isn’t exactly what the original Pound was, which makes the comparison a bit inaccurate.
The original “pound” from the 8th Century was composed of 240 silver pennies. One Pound was equivalent to 350g, which is worth £156.45 ($200) at the current silver price. If we consider the original silver value rather than the spending power of the currency itself, in 1,200 years, the Pound has arguably appreciated by 15,545%.
Even if we do choose this optimistic way of measuring as our benchmark, the results still can’t even hold a candle to Bitcoin’s performance over the past ten years.

Categories
Crypto Daily Topic

Blockchain and Big Data: A Match Made in Heaven? 

The rise of the technological revolution has given birth to data-driven businesses. Organizations now collect large volumes of consumers’ data that is analyzed to make strategic business decisions that help drive profitability. The collection of massive consumers’ datasets, which is commonly known as Big Data, has become an established industry on its own with its revenue projected to grow to $103 billion by the year 2027. 

As Big Data continues to become more prevalent in modern-day businesses, it presents a slew of analytical problems to businesses looking to derive valuable insights from the data. Additionally, with the advent of the web of connected devices, consumers are also at the risk of privacy violations due to the increased probability of security breaches. 

But blockchain, a relatively new technology focused on data integrity and management, has the potential to transform the Big Data industry. And although the two technologies, blockchain and Big Data, may seem mutually exclusive on the surface, they complement each other to create powerful solutions for tech-driven enterprises. 

Where can Blockchain Help Big Data

Some of the biggest challenges facing the Big Data industry stem from poor data management. This is despite the numerous efforts by data scientists to come up with different data management systems. Even with the dynamic technological advancements, it’s becoming quite clear that the most modern tech-infrastructure can’t keep up the growing volume of data. 

As a result, poor data management breeds such other problems as data insecurity as well as inaccurate and incomplete records, also known as dirty data. Analysts and organizations have, therefore, been forced to spend a huge deal of their time and resources on data management that, in an ideal situation, would be spent on other core areas of the organization.

But with the advent of blockchain technology, data management is about to get a lot easier for both the data collectors and its consumers.  

By leveraging the fundamental properties of this novel technology, traditional data-processing infrastructure could be upgraded to manage data adequately. Below are some of the potentialities that the integration of Big Data and blockchain offers:

I) Enhance Data Security

The Big data industry struggles with the lack of adequate security to keep from malicious hackers and their advanced tools at bay. The current data management infrastructures cannot, therefore, be relied upon to keep consumers’ data secure. 

As a distributed ledger system, blockchain technology can be integrated into these data management infrastructures to improve their security. The fact that it uses cryptographic principles to record data in the network makes it almost impossible to breach.

In addition to the high-security standards, blockchain solutions for big data eliminate the need for a central infrastructure where data is stored. Instead, data is stored in a distributed network, making it impossible for a single party to generate enough computational power to alter the data in any way. 

II) Ensuring Data Integrity

Besides, drawing insights from the data, data scientists spend a great deal of their time verifying the data in their care and ensuring it is accurate and consistent.

Blockchain can relieve analysts of this tedious task by vetting this data before it’s recorded in the extensive data chain network. It, therefore, solves the persistent cases of inaccurate, repeated, and incomplete data and makes it easier to draw credible insights from the data. While verifying each dataset, blockchain technology also enhances transparency, given that any data recorded within the network can be traced.  

III) Allow Individuals to Monetize their Data

In today’s information age, data is the single most valuable commodity traded by giant tech companies as well as small enterprises. However, the owners of the data rarely benefit from this trade. They are reduced to mere data sources, while enterprises pocket all the profit from selling their data.  

This practice is about to change with the introduction of blockchain to Big Data. The technology is set to democratize data ownership, allowing consumers to regain absolute control of their data. Data monetization can be supported through a token-based economy or discount on products in exchange for personal data. 

Eventually, blockchain will create marketplaces where individuals can trade data directly with businesses. Unlike the current data market, blockchain marketplaces will be more transparent, allowing individuals to see how their data is being used even after the transaction has taken place. 

IV) Manage Data Sharing

As a decentralized ledger system, blockchain allows parties within a network to share data without the security risk factor. As such, it’ll be easier for, say, banks and hospitals to share an individual’s data effectively, improving service delivery. Additionally, the coordinated data sharing eliminates the cumbersome Know Your Customer (KYC) processes, saving institutions money and time. 

Even within an organization, data sharing will be seamless with the use of blockchain solutions that eliminate data silos. As a result, departments within an organization will collaborate efficiently to improve productivity. 

V) Real-Time Data Analysis

Blockchain in payment systems is used to facilitate real-time transactions. Today, there are several fintech innovations that use blockchain to process fast and real-time settlements of huge sums, irrespective of geographical barriers.

In the same way, blockchain-enabled systems can be used by organizations that require real-time analysis of large scale data to improve their services. For instance, if banks were to use these systems, it would enable them to observe changes in data in real-time and make quick decisions, such as block fraudulent transaction attempts or track irregular activities. 

VI) Predictive Analysis

Data stored on a blockchain network can be analyzed to give valuable insights, much like any other form of data. Considering the accuracy and security of blockchain data, the analyses derived from this type of data are more accurate than those from traditional data management systems. 

Additionally, owing to the distributed nature of blockchain and the huge computational power it offers, data analysts, even those in small organizations, can engage in extensive data analysis tasks. By leveraging the accuracy of the data stored therein, the computational power of the blockchain, and its resourcefulness, data analysts can predict and forecast different aspects of the business with utmost accuracy. 

Conclusion

Blockchain and Big Data technologies are set to radically transform the way businesses process and manage large volumes of data. As such, the integration of the two technologies to form a single solution will not only help businesses step up their data infrastructures, but also solve some of the inherent problems that come with managing large databases.

You must, however, appreciate that blockchain solutions in the Big Data industry may not be realized anytime soon due to the growing concern that blockchain application in Big Data is overly expensive. Most tech companies believe it is cheaper to store data on the traditional infrastructures than a blockchain network. This is because blocks can only store and process a limited amount of data, which is smaller compared to the large volumes of data collected per second by current Big Data systems. But blockchain is an ever-evolving technology, and hopefully, it will mature fast enough to address these concerns, allowing for its full implementation in Big Data management. 

Categories
Cryptocurrencies

Enjin Coin: How is Blockchain Impacting the Gaming Industry?

Blockchain was ideally developed to facilitate a rather simple purpose: to power a decentralized, peer-to-peer, and ultra-secure digital currency – Bitcoin. In the beginning, no one could have conceived the sheer power that the technology wielded, or predicted the technological revolution it would inspire a decade or two later. From healthcare to the food industry, banking finance to gaming, blockchain is impacting virtually every industry. 

Enjin Coin is a cryptocurrency project that is taking advantage of blockchain to offer gamers, developers, publishers, and other stakeholders in the gaming industry a fast and safe solution to manage virtual goods and realize real value.

In this piece, we’ll shine more light on this exciting project and discover its offerings to gaming communities.

What is Enjin Coin? 

Launched in November 2017, Enjin Coin (ENJ) is a cryptocurrency and Ethereum-based blockchain platform that allows game developers to integrate crypto features into games and apps without necessarily having blockchain skills. As stated in the project’s white paper, ENK is “a cryptocurrency (ERC20 Token) and smart contract platform that gives game developers, content creators, and gaming communities the required crypto-backed value and tools for implementing and managing virtual goods.”

Wat is ENJIN coin - Forex Academy

Enjin company was established in 2009 and has, for the past decade, been empowering game lovers to derive more value from the game industry. It is committed to helping game companies increase revenue and maintain a competitive edge in the industry. 

With ENJ, Enjin hopes to be an industry leader in what it sees as an inevitable transition into a blockchain way of doing things in the long run. The Enjin coin platform comprises a suite of software development kits (SDKs) that game developers can use to integrate blockchain-based solutions into gaming. The blockchain initiative will go a long way in reducing the high fees and reducing the lack of transparency that is so rife in the gaming industry.

The coin had its pre-sale in August and September 2017 and raised over $12 million worth of Ether (38,800 ETH). The pre-sale was closely followed by the public sale, in October 2017, where the project raised an additional $23 million. 

How Does Enjin Coin Work?

Enjin Coin is an ERC20 token that runs on the Ethereum blockchain. This makes the platform a cryptocurrency and a smart contract platform. The project is also looking to adopt the Raiden network – Ethereum’s version of the Lightning Network. Its key operational features include:

1. Virtual Goods

Thanks to Enjin Coin, game developers will be able to create tokens for different game communities – using Enjin Coin as the parent currency. This lends the tokens the benefits of crypto (speed, safety, security, and low fees) while maintaining the uniqueness of their respective platforms. These tokens can be exchanged for ENJ at any time. 

Virtual goods can be pretty much anything used in the gaming world, including entire planets, swords, guns, spaceships, cosmetic upgrades, castles, and gaming characters. These virtual goods have real-life value, thanks to Enjin Coin serving as their parent currency. The process by which users create virtual goods via Enjin Coin is referred to as minting. Users can mint goods with whichever quantity of ENJ. The more coins you use to mint an item, the more value it will possess. 

Gamers can acquire these virtual goods either by purchasing or during giveaways, promotions, or rewards. They can also trade/exchange them in a safe, secure, and fraud-free environment. For instance, you can exchange a gun for a planet, sell a spaceship for ENJ, buy a character with ENJ, etc. 

These goods are safely kept in a decentralized and uncensorable environment – and are thus not controlled by anyone. This means you get to own and control your virtual goods, as well as have the ability to prove ownership. This is important, especially if the game or server suffers a malfunction or your account gets hacked.

2. Payment Gateway

The Enjin Coin platform also features a payment gateway that allows users to create customized shopping carts, manage invoices, refunds, emails, and text notifications. It also includes a widget through which you can accept ENJ and any other type of coin payments. Transactions cost is low, and there are no hidden charges.

The platform’s Smart Wallet (more on that below) allows you to execute automatic payments for games from websites that you have listed as ‘Trusted Platforms.’ This feature injects more speed and trust in transactions.

3. Smart Wallet

Enjin Coin’s ‘Smart Wallet’ provides support for a lot of the platform’s functions. First off, it facilitates payments via Trusted Platforms and allows you to exchange currencies and virtual goods outside of your gaming account to any other Smart Wallet user. You can also initiate transactions through the ‘Transaction User,’ as well as create settings and thresholds that can automatically block illegitimate transactions.

Smart Wallet features a “top-of-the-line” security infrastructure complete with a 12-word recovery phrase that enables you to recover your funds in case you forget the password for your Wallet. Additionally, the Wallet has its own proprietary virtual keyboard that further guards against data sniffing. It also deletes any and all sensitive info after transactions, rendering it safe even if it were to be hacked.

4. Efinity

Enjin Coin plans to unveil Efinity – a technology like Bitcoin’s Lightning Network, which features multiple game channels that will allow games to handle infinite volumes of transactions blazingly-fast and with near-zero transaction fees. These transactions will be trustless, blockchain-verified, and support millions of players at any time. Other functionalities will be:

  • Token transfers and approvals
  • Melting tokens
  • Escrow capability
  • Metadata for game items
  • Token bundles
  • Non-fungible tokens
  • Whitelist feature for bound tokens

Can Enjin be Integrated with the Actual Game? 

Yes. The Enjin Content Management System supports plugins that can integrate with the majority of players’ favorite games. Some of the popular games supported today include Dissolution, Forgotten Artifacts, Shield of Shalwend, Age of Rust, Forest Knight, War of Crypto, Battlefield 1, World of Warcraft, Cats in Mech, Afterverse, The Six Dragons, Space Misfits, and Minecraft.

What’s Enjin Coin’s Future Prospects? 

Enjin Coin may be relatively new to the gaming industry, but several factors point to its future success as a cryptocurrency project.

These include:

  • An already existing marketplace trusted by millions of gamers across the globe.
  • ENJ is an ERC-20 token that enjoys multi-exchange and multi-wallet support. Apart from ERC-20, Enjin also supports ERC-1155 smart contracts that enable the tokenization of both fungible and non-fungible gaming industry assets.
  • It has secured a partnership with industry heavyweights such as Samsung, Unity, PC Gamer, Ubisoft, NRG, and other trusted sports brands. 

Tokenomics of Enjin Coin

As of May 26, 2020, Enjin Coin is trading at $0.194120, with a market cap of $159, 133, 893, while ranking at #44 in the overall crypto market, according to Coinmarketcap. It has a 24-hour volume of $36,370, 221 and a total supply of 1, 000, 000, 000 ENJ. The coin’s all-time high was $0.493384 ( Jan 07, 2018), with an all-time low of $0.015620 (Nov 02, 2017).

Where to Buy and Store Enjin Coin

ENJ is listed on several exchanges, including Binance, Coinswitch, Cointree, Changelly, and KuCoin. Popular exchange Coinbase does not list ENJ.

Being an ERC-20 token, you can store ENJ in any Ethereum-compatible wallet like MyEtherWallet, MetaMask, Mist, and Geth. You could also opt for hardware wallets like Ledger Nano and Trezor. 

Final Thoughts

Enjin Coin provides gamers from all around the world with the blockchain benefits of speed, security, and decentralization. It’s helping inject more transparency in the gaming industry and provide gamers with true and absolute ownership of their virtual goods.

The project already has a solid background of Enjin – a company that is trusted by millions of users across the world. Only time will tell if the project can continue with its streak of success.

Categories
Cryptocurrencies

What is IOTA All About? 

Technology makes our lives easier. And as it is now, we might be at the cusp of a new age as far as technological advancements are concerned. In the very near future, it’s highly probable that the mundane devices around us will be interconnected with each other and to the internet. Think of your fridge, car, oven, car, shower, coffee maker, etc.

These devices will be able to work without needing human intervention. In other words, we’ll be able to derive more value from the things around us, thanks to them being connected to the internet. This phenomenon is called the Internet of Things (IoT). 

It would be ideal if we could actualize IoT without any of the current impediments that face it – with two of the major ones being security and scalability. There is a valid concern that an IoT network would be a security disaster as far as information security, data privacy, and cyber safety are concerned. 

IOTA is a distributed ledger platform that seeks to address the issue of scalability and security for the Internet of Things. What exactly is IOTA, and what does it offer the IoT economy and the distributed ledger space?

What is IOTA?

IOTA is a cryptocurrency project created and optimized for the Internet-of-Things (IoT). The IOTA team envisioned an IoT – already a bold vision by itself – that is powered, secured, and driven by blockchain. David Sostebo, the co-founder of IOTA, wrote that ” IOTA was initiated with a very clear and focused vision of enabling the paradigm shift of the Internet of Things… through establishing a de facto standardized ‘Ledger of Everything.’ 

IOTA diverts from the traditional blockchain model adopted by the majority of cryptocurrencies. Instead, it uses a dedicated distributed ledger platform called Tangle – itself an implementation of a computer science and mathematical concept known as Directed Acyclic Graphs(DAG). Tangle’s consensus mechanism works this way: for new transactions to be valid and before it’s added on the public ledger, it must be validated by the two lastly entered transactions.

This removes the dependence on miners to validate transactions, thus allowing for more scalable transactions (by reducing network congestion and network delays) as compared with traditional blockchains such as Bitcoin’s and Ethereum’s. 

How Does IOTA Work? 

The idea behind IOTA is to integrate blockchain solutions to the Internet of Things. IoT is not a complicated concept or a fantastical idea belonging to sci-fi movies. As a matter of fact, it’s already part of the world’s economy – think devices that monitor factory conditions, driverless cars, smart homes, smart lighting, smart pet care, etc. Research indicates that in 2017, IoT devices had grown up to 8.4 billion, with an even more aggressive growth projected for the future. 

How IOTA Works | Forex Academy

IOTA’s founders believe that for IoT to realize its highest potential, network devices should share and utilize resources more efficiently. The idea is for devices to acquire more resources, such as internet bandwidth, power, storage – only when they need them, and to sell excess or unwanted power at any given time. 

Even the smallest IoT network’s implications would be tens of transactions every second, as devices relay info between and across each other. Such volumes of transactions are beyond the capability of the current blockchain model. For instance, the Ethereum blockchain can handle 15 transactions per second, while the Bitcoin blockchain can handle 7. This results in high transaction fees for priority transactions, while the rest of the transactions can take hours to be completed. As such, the blockchain, as it is, is simply not scalable enough to support the IoT economy. 

IOTA and Scalability

Upon completion, IOTA anticipates having billions of interconnected nodes on its network. To this end, its processing power is designed to expand as more nodes join the network. Tangle’s consensus mechanism dictates that each transaction is linked to two other transactions – in the end, creating a web of transactions based on a verification history. As time goes on, every transaction becomes linked to the ones that verified it. This simple model removes the need for a blockchain. 

In terms of computing power and securing the network, each time a new device submits a transaction – it contributes to the network in this way. Again, this removes the need for block miners. 

IOTA and Transaction Fees

IOTA is also fee-free. As new devices contribute computing power when they submit transactions, the only cost they expend is the electricity they use to confirm the two previous transactions. This essentially makes IOTA free to use. 

This absence of fees is intentional. The IoT network will comprise devices transacting with each other at fractional costs and a very high frequency. Levying charges on such transactions would render micropayments impractical. To serve as the backbone of the IoT economy, IOTA has to be a free network. 

34% Attacks

As you already know, the blockchain is vulnerable to what is known as “the majority attack.” This describes the event when a party manages to control more than 50% of the network (51% attack). In such an event, the attacker can perform malicious transactions, stop miners, and so on. For its part, Tangle will be vulnerable if an entity were to control 34% (over ⅓) of the network’s computing power. 

The IOTA network would be particularly vulnerable to such an attack when it’s still a small network with fewer nodes (i.e., now). It’s easier for a bad actor to gain control of 34% of the network at this time. To curb such an attack, the network is utilizing a Coordinator that synchronizes data across all nodes – cushioning the network against an attack. 

The coordinator node is necessary to protect the early Tangle, and the network plans to get rid of it when it becomes robust and resilient enough. But that also means that the platform is not exactly decentralized right now.

In May 2019, IOTA announced the plan to kill the coordinator and implement ‘Coordicide’ – a new procedure that would make the network decentralized. The protocol, however, is yet to be implemented. 

Who is behind IOTA? 

The IOTA platform was launched in 2015 by David Sønstebø, Dominik Schiener, Sergey Ivancheglo, and Serguei Popov. Sønstebø and Schiener both serve as co-chairman of the board of directors. Ivancheglo departed from the organization’s foundation in June last year in seemingly amicable terms, but as the IOTA community came to discover, there was a ton of intrigue going on behind the scenes. See the full team here

Concerns About IOTA 

IOTA has faced criticism for its use of several new technologies instead of tested and tried technologies. Technology experts question if IOTA will really work to scale and if it will stand up to attacks even after more nodes join the network. 

Michigan University’s Digital Currency Initiative published a paper outlining serious flaws in Curl, the network’s hashing function. After testing the hash function, they discovered it produced the same output when fed with two different inputs – a situation known as Collision and one that denotes a faulty hash code. The team added that a malicious actor could have manipulated the flaw to bring down Tangle or steal user funds. The IOTA team has since addressed the loophole.

Ethereum’s core developer Nick Johnson published a scathing article in which he delineated why he thought IOTA’s platform lacked “good technical judgment,” disregarded “cryptographic best practices,” is “a bad actor in the open-source community,” and that its integrity guarantees lack rigor.”

Tokenomics of IOTA

As of May 27, 2020, IOTA was trading at $0. 195231, at a market position of #24 and with a market cap of $542, 649, 121. The coin had a 24-hour volume of $14,089, 509. IOTA’s circulating supply is 2, 779, 530, 283, with a total and maximum supply of the same value. The currency’s all-time high was $5.69 (December 19, 2017), while its all-time high was $0.079620 (March 13, 2020). 

Conclusion

The IOTA project takes the progressive idea of IoT and proposes to make it even better with distributed ledger solutions. For now, the project is far from perfect, or even near full-blown implementation. If everything goes as planned, IOTA will be an unstoppable idea, not just in the distributed ledger space, but in the world.

Categories
Crypto Videos

Crypto Trading For Beginners!

The Easiest Profitable Bitcoin Strategy

So many traders struggle with making a profit in the volatile crypto market. They test several indicators by themselves or maybe even in a couple of indicators together, but with no success. Even if they found success during a bull market phase, they started losing money once the market changed directions.

Backtesting

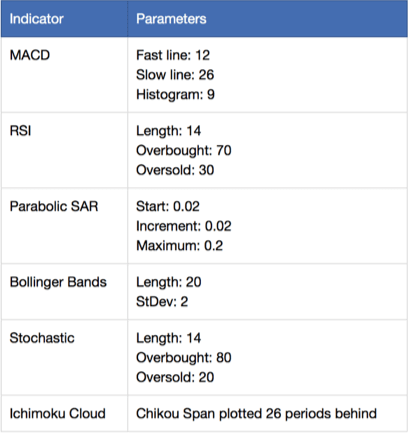
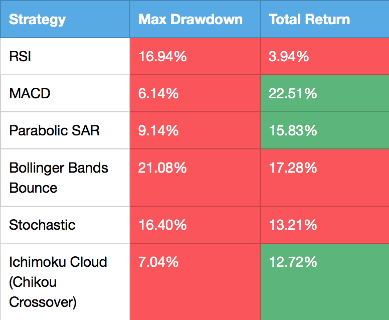
Harry Nicholls backtested various crypto trading indicators in order to find the one that works best. He tested RSI, Stochastic, Bollinger Bands, MACD, Parabolic SAR, and Ichimoku Cloud.

All of the strategy parameters were kept to default. What he found out is that, at the time of the experiment, some indicators performed better than the other. While some netted over 20% gains overall, some lost over 15%.

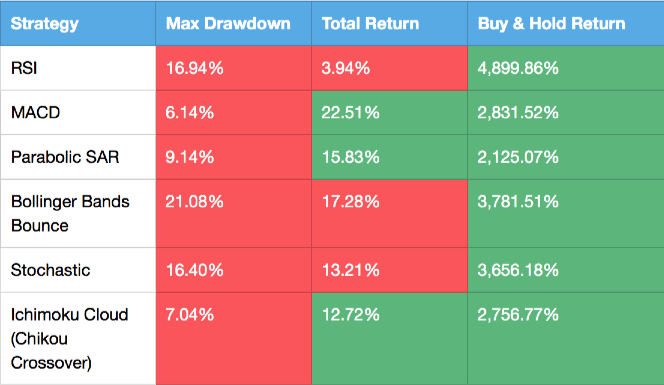
If we take his research up to here, we can clearly see that the MACD is the clear winner among the indicators tested. However, is it? While the MACD was profitable and netted 22.51% after over three years of trading, the market itself went from $300 to, at one point, $19,900, which is far more than 22.51%.

The Buy and Hold method

After seeing that, he implemented the Buy and Hold method, which simply bought in the first time the indicator notified that it is a good time to buy, and held until the present. As the picture shows, the gains are immeasurable compared to the previous ones. The worst-performing indicator was Parabolic SAR, with the gains of 2,125.07%, just under 100 times the gains of MACD trading.

It is clear that the Buy and Hold method works so much better than trading based on one indicator, which is the whole point Nicholls was trying to make. Relying on just one trading indicator or tool is simply far too unpredictable for constant trading. Inexperienced traders do not have to dive into trading head-first and lose a lot of money in order to learn how to profitably trade. They can rather learn on the go while investing safely, as Bitcoin and the rest of the crypto market are already making amazing gains by themselves.

Categories
Crypto Videos

Crypto! The Most Important Altcoin Trading Rule!


The Most Important Altcoin Trading Rule

While most people are introduced to cryptocurrencies through Bitcoin investing and trading, the cryptocurrency market is much more than just Bitcoin. There are countless altcoins out there that compete with Bitcoin or try to solve some other problems existing in the world.
Whether traders support certain altcoins or not, the fact is that altcoins trading can be extremely profitable. However, not many people know how to properly trade altcoins as the profit has to be tracked both against the fiat currencies and against Bitcoin.

Altcoin Trading

Altcoin trading is not much different from Bitcoin trading in terms of indicators and tools traders use to trade it. It is just as volatile and just as predictable (or rather unpredictable) as Bitcoin is. However, one main difference is that it is highly correlated to Bitcoin and that altcoins traders need to take Bitcoin’s price movement into consideration when trading altcoins.
When Bitcoin moves in the same directions altcoins are moving, traders need to think of whether their money will grow more while sitting in Bitcoin or altcoins. When Bitcoin is about to move in the opposite direction to altcoins, traders have to think about whether altcoins will be “pulled” in Bitcoin’s direction, and how much. In a market where Bitcoin’s price is stable, altcoins trading certainly becomes superior to just holding Bitcoin as traders can make greater profits off of altcoins price fluctuations.
Altcoin traders need to watch the general trend of the specific altcoins as well as Bitcoin’s trend prior to engaging in trades.

Conclusion

This guide should be considered advice to all traders willing to go into altcoins trading. As with everything, with more risk comes more opportunity, and altcoins trading is no different. If you learn to incorporate and merge Bitcoin analysis with altcoins analysis, your altcoins trading will be far more profitable.

Categories
Crypto Videos

Applying The Stock To Flow Model To The Bitcoin Halving


Stock to Flow model and Bitcoin Halving

What is the Stock to Flow model?

The Stock to Flow model is a way to measure the abundance of a certain resource. The Stock to Flow ratio would then be the amount of a resource that is held in reserves divided by the amount of the resource produced annually.
While the Stock to Flow model is generally applied to natural resources, it has seen some use when predicting the cryptocurrency prices as of lately.

What does Stock to Flow show?

The S2F essentially shows a product’s supply increase each year for a given resource relative to its total supply. The higher the Stock to Flow ratio is, the less new supply enters the resource market relative to the total supply. Assets with a higher Stock to Flow ratio should, theoretically, retain its value over the long-term better than those with a lower Stock to Flow ratio.

Stock to Flow and Bitcoin

When Bitcoin’s mining and production is taken into account, it’s not difficult to see why Stock to Flow ratio would be used on calculating and predicting Bitcoin’s price. The model treats Bitcoin comparably to commodities such as gold or silver. In theory, such commodities should retain their value much better than other assets over the long term due to their low flow and relative scarcity.

As of recently, Bitcoin is considered a very similar resource, as it is scarce, costly to produce and has a maximum supply. On top of that, its issuance is defined which makes the flow almost completely predictable, which can be extremely useful when calculating long-term price movements.

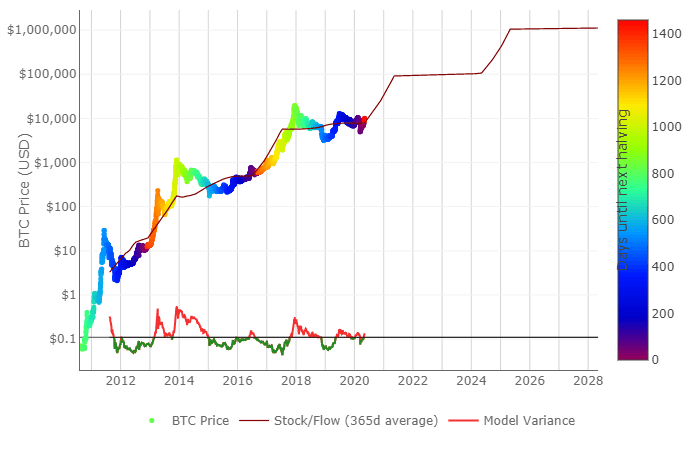
According to the “followers” of this model, the properties that Bitcoin has create a scarce resource that is expected to retain and increase its value in the long-term. The chart shows that the Stock to Flow ratio has been extremely accurate in the long-term as the price acted almost the same way after every Bitcoin halving (which reduced its daily supply by half).

Conclusion

The Stock to Flow model is a visual representation of the relationship between the available Bitcoin and its production rate. While it has so far been successful in predicting Bitcoin’s price movements, it may not be able to take into account all aspects of the Bitcoin valuation. Even so, Bitcoin’s Stock to Flow ratio is something that should be tracked and taken into account when looking for long-term trends and how Bitcoin might act in the future.

Categories
Crypto Daily Topic

How Does Libra Differ From Blockchain? 

Facebook garnered tremendous attention in 2019 when it announced that it was creating a cryptocurrency called Libra. The announcement was met with the coldest of shoulders by regulators around the world, with declarations going from Libra “must be stopped” to the project was “serving private interests.”

The project drew ire partly due to the very audacious nature of the project plus the tainted history of Facebook with managing user data. Facebook’s Mark Zuckerberg was forced to sit through US Senate hearings to explain the project, and many of the initial members withdrew from the project.

Libra and Bitcoin

Of course, any cryptocurrency that launches will unfailingly be compared against the one that started it all: Bitcoin. Bitcoin is the currency that spawned off the rest of the cryptocurrencies, and these cryptocurrencies have taken after Bitcoin one way or another. Whether it’s a permissionless blockchain, or a proof-of-work consensus mechanism, or a capped supply, Bitcoin has inspired the ton of them. 

What about Libra? With the controversy and the biting controversy surrounding the cryptocurrency, it’s crucial to compare the two. It’s also important since some people tend to lump the two together. 

Bitcoin and Libra: A Sea of Difference

Is  Libra like Bitcoin? Let’s stack each against the other and find out. 

i) Availability and History

Bitcoin traces its history to  2008 when the anonymous developer Satoshi Nakamoto published its white paper. The first bitcoin was subsequently mined in January 2009. Bitcoin is now a fully-fledged currency through which millions of people all over the world can buy, sell, and trade on multiple exchanges. Though not yet fully mainstream, a good number of merchants and businesses the world over are accepting Bitcoin for payments. 

Libra’s white paper was released in 2019, with the cryptocurrency scheduled to go live sometimes in 2020. We’re yet to see the network that will support the currency, and with multiple founding partners jumping ship, whether the currency will be launched per the scheduled time is anyone’s guess. 

ii) Developers

In terms of development, Facebook is the team behind Libra. After the Libra project went public, the Libra blockchain was made open-source, allowing developers around the world to contribute to the code. 

For its part, Bitcoin was conceived and developed by Satoshi, with other developers joining in at later stages of the process. Bitcoin is now in the hands of the Bitcoin Foundation, and it’s also open-source, meaning anyone can add to the code. At any time, developers are always working to improve Bitcoin’s functions one way or another, whether improving scalability, privacy, interoperability with other blockchains, and so on.

iii) Centralization and Decentralization

One of Bitcoin’s core features is that it’s decentralized,  meaning it’s not managed by any single entity. No one can switch its network, hijack transactions, or block its usage. It achieves this thanks to having a distributed network of thousands of computers, also called nodes, all over the world. 

All anyone needs to do to become a node has enough storage on the computer to store the ever-increasing size of the blockchain, as well as reliable access to the internet. For anyone to hijack the Bitcoin blockchain, they would need massive computing power, which would simply be expensive for anyone to have the motivation to do so. 

On the other hand, Libra is fairly centralized. The project is run by the Libra Association, which comprises several organizations drawn from various industries: blockchain, venture capital, non-governmental organizations, academic institutions, and so on. These organizations have a financial stake in the project, and they will have a say in the development and the general direction of the project. Each member has contributed $19 million, and they get the right to vote on the decision-making process. 

iv) Pricing and Value

When Libra was originally unveiled, the plan was to create a stablecoin backed by a basket of fiat currencies such as the US dollar, the Euro, the Japanese Yen, and so on. That, however, was met with criticism by regulators and central banks who cried foul of the potential of that to usurp some of the power of the financial system. 

Now it looks like Libra has come back with a plan to appease the system. It will now comprise individual stablecoins for a number of Fiat currencies, – including USD, the Euro, the Singaporean dollar, the Japanese Yen, and its very own Libra coin, which will be backed by the stablecoins instead of Fiat currency. 

In comparison, Bitcoin is not backed by any currency. It derives its value from people accepting it and being willing to pay a certain amount of money for it. In the same way in history, people agreed that things like shells or rare stones have value and can be used as a medium of exchange, the same way people ascribe value to Bitcoin. 

v) Privacy

Bitcoin is a pseudonymous currency, meaning while you’ll not use your personal credentials to conduct transactions, your Bitcoin address and transaction history can be used to trace your real-world identity. Bitcoin’s blockchain is public, with every single transaction being in the public domain. 

While Libra is yet to go live and its privacy policy is not yet known, many people have rightfully raised questions on whether the project can protect user privacy, given Facebook’s history with the mishandling of user data. Concerns abound on whether Facebook could leverage its position and use people’s data as a means to further revenue. 

vi) Regulation

Bitcoin’s decentralized nature cushions it a great deal from the potential clampdown of governments. Governments could make trading and investment of Bitcoin difficult, but with its nodes being distributed all over the world, it’s just not possible to regulate it as effectively or stop its usage. 

On the other hand, Libra raised alarm bells from regulators and governments immediately it was announced. Concern was rife that with a powerful entity such as Facebook backing Libra, it would undermine the global financial system and provide bigger leeway for criminals and terrorist organizations. 

Libra even had to capitulate to the regulatory pressure. In a testimony prepared for a hearing at the US Senate, David Marcus, head of the project, wrote:” The time between now and launch is designed to be an open process subject to oversight and review…And I want to be clear: Facebook will not offer the Libra Digital currency until we have fully addressed regulatory concerns and received appropriate approvals.”

As you can deduct, Libra is highly prone to regulatory control. If governments and regulatory bodies don’t like what’s happening, they can intervene and demand a change of policy or approach. This could never happen with Bitcoin. 

vii) Coin Distribution

Bitcoin’s supply is capped at 21 million, meaning there will only ever be that amount of coins in existence. This number is programmed in the Bitcoin code, with the last coin expected to be mined around the year 2140.  This prevents inflation and also increases the purchasing power of Bitcoin over time. By contrast, the supply of Libra is in the hands of the Libra association, who will be in charge of the currency’s supply. 

As you can see, Libra and Bitcoin are two different cryptocurrencies with different approaches. In all the ways, Bitcoin is the embodiment of what cryptocurrency is about: a decentralized, open-source network, hard-to-regulate currency. Libra has the makings of a cryptocurrency, but not quite. Its association with Facebook is not helping its cause for the moment, but as with anything crypto, a lot remains to be seen. 

Categories
Crypto Videos

Master Crypto Trading With The Cup & Handle Formation Part 2!


Make money in Crypto by spotting the Cup and Handle pattern – part 2/2

Picking a Profit Target


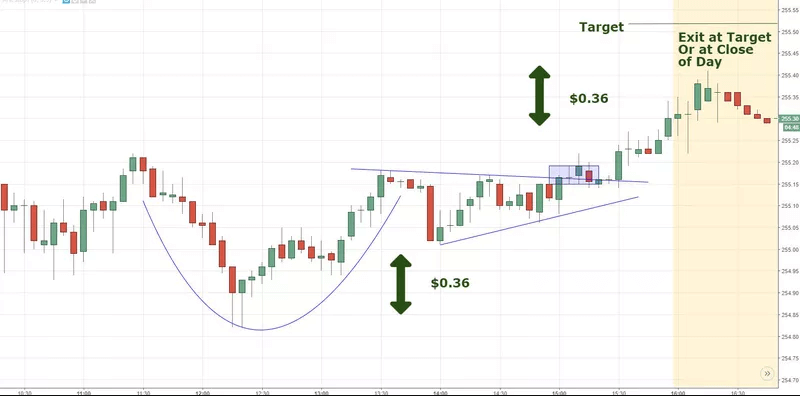
Determining the profit target is quite simple with this pattern; all you need to do is add the height of the cup to the point of breakout.
There will be times when the left side of the cup is a slightly different height than the right side. In this case, you should use the smaller height to stay on the conservative side, or the larger height for an aggressive approach.


In addition to using the cup and handle formation, you can use the Fibonacci extension indicator to create a great crypto trading strategy (as seen on the chart). Draw the extension tool from the low of the cup to the high on the right side of the cup. Then, connect the tool down to the handle low. The 1, or 100%, level represents a conservative price target, while the 1.618, or 162%, and represents a very aggressive target. The possible targets can then be placed anywhere in between 1 and 1.618.

Things to consider

Traditionally, the cup has a pause at the bottom of the cup built in the formation, where it moves sideways or forms a rounded bottom. This movement shows that the price found a support level and will not drop below it. However, this pattern can also have a so-called V-bottom.
A V-bottom occurs when the price drops and then sharply rallies. Some traders like trading this form of a cup and handle, while others do not. The argument of V-bottom traders is that the sharp reversal of the downtrend shows that buyers stepped in aggressively, signaling strength. Opponents of the V-bottom say that the price didn’t stabilize before bottoming, therefore making the price unstable and susceptible to retesting the level.
When trading this pattern, always look for additional confirmation. It can be found by looking for the bottom of the cup and seeing if it aligns with a longer-term support level. Consider using indicators and tools to determine the support and resistance levels and check if they align or interfere with the cup and handle targets.

Categories
Crypto Videos

Master Crypto Trading With The Cup & Handle Formation Part1!

Make money in Crypto by spotting the Cup and Handle pattern – part 1/2

Chart patterns occur on charts when the movements of the price of an asset resemble a common shape. In this case, we will be talking about the cup and handle formation. These patterns are a visual tool that helps traders make their market decision. Cup and handle provide a logical entry point, a stop-loss target for managing risk, as well as a price target for exiting a profitable trade.

The Cup and Handle

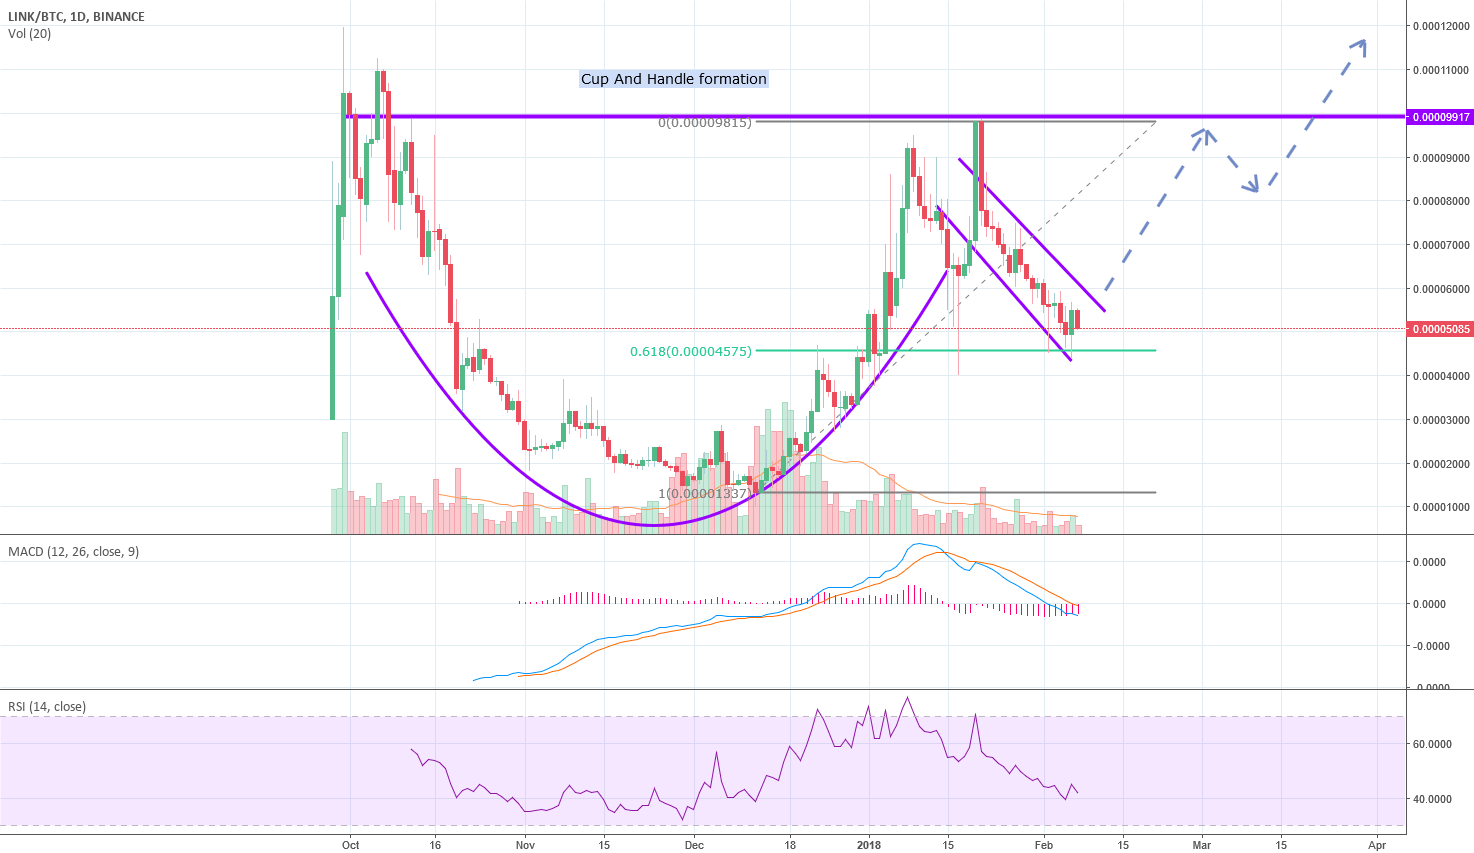
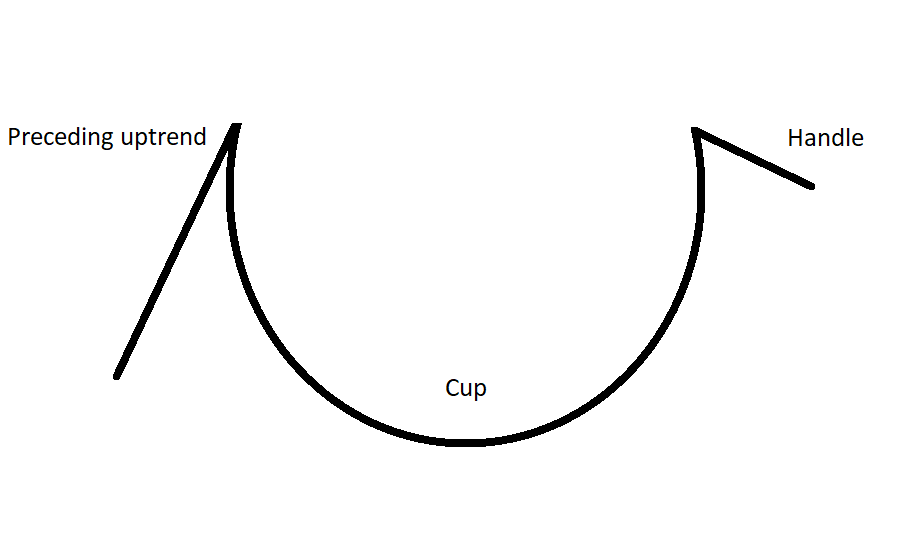
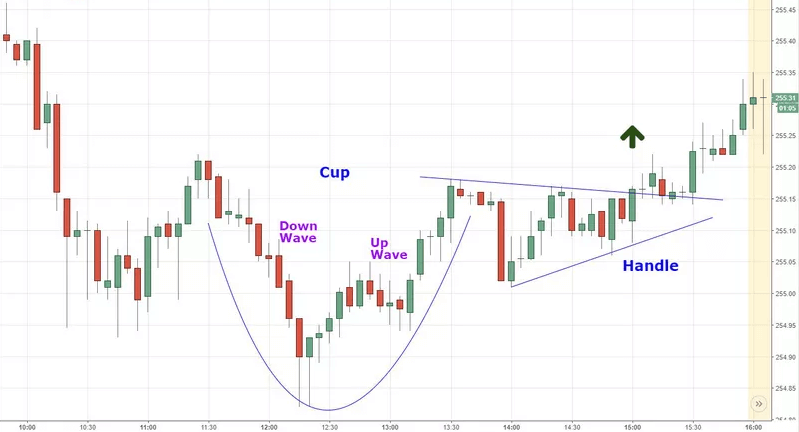
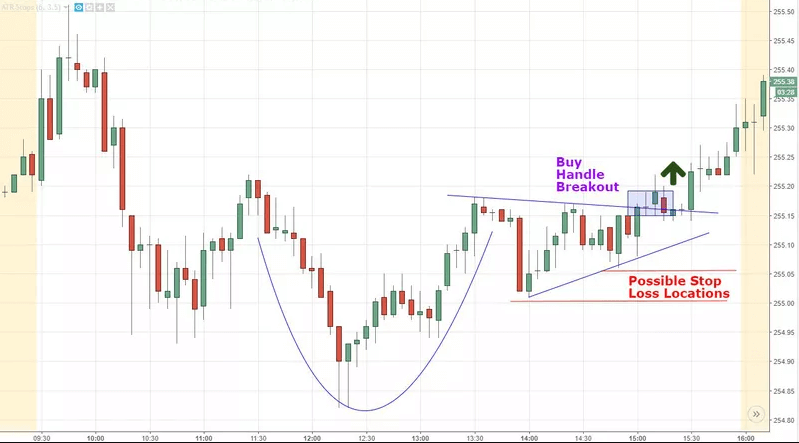
The cup and handle pattern is a strong tool for both small time frames (such as one-minute charts) and in large time frames. It occurs when the price trends down, then have a stabilizing period, then followed by a rally of approximately equal size to the aforementioned decline. This creates a U-shape, which is the “cup” in the “cup and handle” formation. However, this is only a part of the pattern. The price then moves sideways or goes down within a channel, which forms the handle. The handle can also take the form of a triangle.
An important rule to keep in mind is that the handle should always be smaller than the cup. Ideally, the handle should stay in the upper third of the cup. If it is too deep, it will erase most of the gains of the cup, which makes it quite an unsafe bet when it comes to trading on this pattern.

A cup and handle chart may signal one of two things! A reversal pattern, or A continuation pattern. A cup and handle signals a reversal pattern when the price is in a long-term downtrend. If a cup and handle pattern is formed during that time, it will signal a trend reversal. However, if the cup and handle formation occurs during an uptrend, then the pattern would signal trend continuation.

How to trade the cup and handle pattern
Determining the Entry point

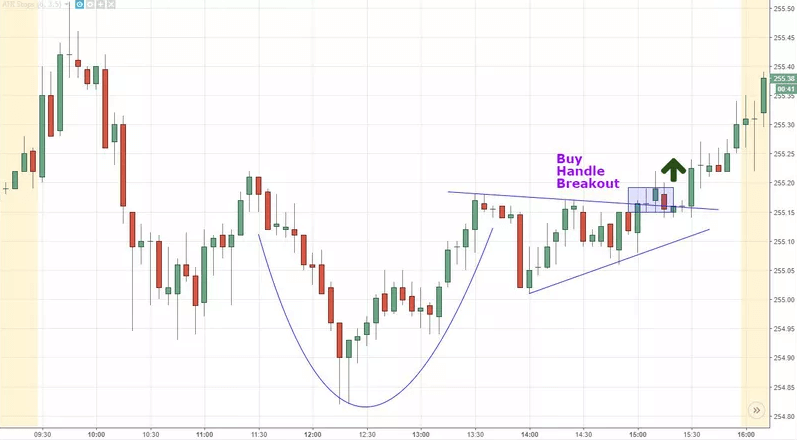
In order to trade this pattern well, wait for a handle to form and the full pattern to play out. The handle often goes sideways, descends, or creates a triangle. The entry point should be when the price breaks above the top of this channel or triangle. As soon as the price moves out of the handle, the pattern should be considered complete. However, you might want to wait for a full candle to form outside of the pattern, so you get a real confirmation of the move, rather than blindly entering a false breakout.

Setting up a Stop-Loss

A stop-loss order is a risk-control measure on the trade. It works by selling the position if the price goes the opposite way and declines enough to invalidate the pattern. The stop-loss should be put below the lowest point of the handle or below the most recent swing low (only if the price oscillated up and down often).

Since the handle occurs within the upper half of the cup, a stop-loss that is properly placed should not end up in the lower half of the cup. If the stop-loss happens to be below the half-way point of the cup, try to avoid the trade if possible. Ideally, the stop-loss should be placed in the upper third of the cup pattern.

Check out part 2 of our Cup and Handle crypto trading guide to learn more about setting profit targets as well as some other important info regarding this candlestick formation.

Categories
Crypto Daily Topic

Understanding Cryptocurrency Metrics

The crypto market is flooded with thousands of coins, and every new week we hear of another one joining the bandwagon. With this level of proliferation, it can be daunting to pick apart the real thing from the chaff.

Cryptocurrency metrics go beyond the market cap or popularity of a coin. These are pretty limited ways of determining the measure of a cryptocurrency’s utility. So how do you distinguish between a robust currency poised for long-term success and a weak or fake one? 

Alternative metrics that can help you track and understand the value of different cryptos.

i) Decentralization of Nodes

How many nodes does a cryptocurrency have in its network? Nodes are the computers supporting the network from around the world. The more nodes a network has, the safer it is. Having a few nodes makes it easier to attack a network. Why does having decentralized nodes matter?

Resilience under attacks: having many nodes in a network makes it almost impossible to carry out a 51-percent attack.

Censorship-resistance: having a wide base of nodes makes it hard for states or governments to control or shut down the network. Nodes from around the world can replace each other in case some country manages to clamp down on node running.

Store of value guarantee: if many nodes are supporting a network, it means that the network is credible and can be trusted as a store of value.

ii) Main Developers

Who are the main developers behind the project? Do they have the relevant experience to create a robust cryptocurrency? Developers should also be able to provide regular updates about the network to ensure users of their and their funds’ security and privacy.

For instance, Bitcoin is regularly checked for security by hundreds of developers who are enthusiastic about the crypto. Developers should also be able to regularly fix bugs and come up with new functions to improve the functionality of the network. They should also be able to add useful new layers to the network, for example, sidechains – which can, for example, improve transaction speed by unclogging the network.

Developers also need to be able to sustain the value proposition of a cryptocurrency. They are also important for brand support of the cryptocurrency.  For instance, Ethereum boasts a solid reputation thanks to its creator Vitalik Buterin who is actively involved in the development of the network.

There is also the need for an opposing side to the main developers. For instance, Ethereum Classic and Bitcoin Cash act as a check and catalysis for functionality upgrades for Ethereum and bitcoin, respectively.

iii) The Solution the Coin Provides

Does the cryptocurrency have new insights for space? Does it have any unique features that solve problems that its predecessors have not been able to? Look at Zcash’s technology, zk-Snark, which allows the network to anonymize transaction histories.  Consider also Ethereum’s trailblazing smart contracts and decentralized applications that allow people to create contracts without the need for expensive intermediaries and create uncensorable applications, respectively.

iv) Daily Transactions Volume

A cryptocurrency should be able to maintain a certain level of daily transactions. If a cryptocurrency cannot achieve a certain daily threshold, it will slowly fade.  To check how many transactions a network is supporting, visit sites such as:

  •   BTC/ BCH: txhighway.com, blockchain.com
  •   Ethereum: etherscan.io
  • bitinfocharts.com

 By comparing your favorite coins, you can discover unexpected results that will help you decide which cryptocurrency is worth investing in.

v) The Number of In-Use Wallets

A network should show the number of non-empty wallets growing at an appreciable rate. A network should gain at least 175, 000 wallets per year.

This shows the network has active users – a non-negotiable for any crypto.

vi) Network Hashrate

This is a metric that shows how much computational power a network is using. A high hash rate signifies a healthy network. It means the network is being supported by many nodes, which, as we saw above, is a good sign.

vii) Daily Trade Volume

The trade volume of a cryptocurrency is demonstrated by such things as being available on many exchanges, having many trading pairs, and so on. If a cryptocurrency has been on the team for several years and it has a weak daily trade volume, that should tell you one or two things about its worth in the market.

viii) 24-hour Price Change

The crypto market is known for its wild price swings. But that does not mean that gains or losses of 250% to 900% in a span of 24 hours are normal. Such swings should point to something unusual behind the scenes, such as the crypto being centralized or some artificial price action.

Final Thoughts

For you to measure the value of that crypto, you’ve been angling, check out the above metrics and see if the numbers point to a healthy, thriving coin, or one that’s floundering. The more decentralized a network is, the stronger and safer it is. If its daily transaction volume shows active interaction with the network, then it’s a safe bet. Also, a coin’s value proposition must bring something fresh to the crypto space, or it risks fading into irrelevance in the ultra-competitive crypto market.

By utilizing these metrics, you’re on solid footing the next time you’re shopping around for crypto to invest in.

Categories
Crypto Market Analysis

Daily Crypto Review, Feb 5 – XRP Skyrockets after Breaking a 2-year Downtrend; Bitcoin SV Upgrade Tesults in Chain Split

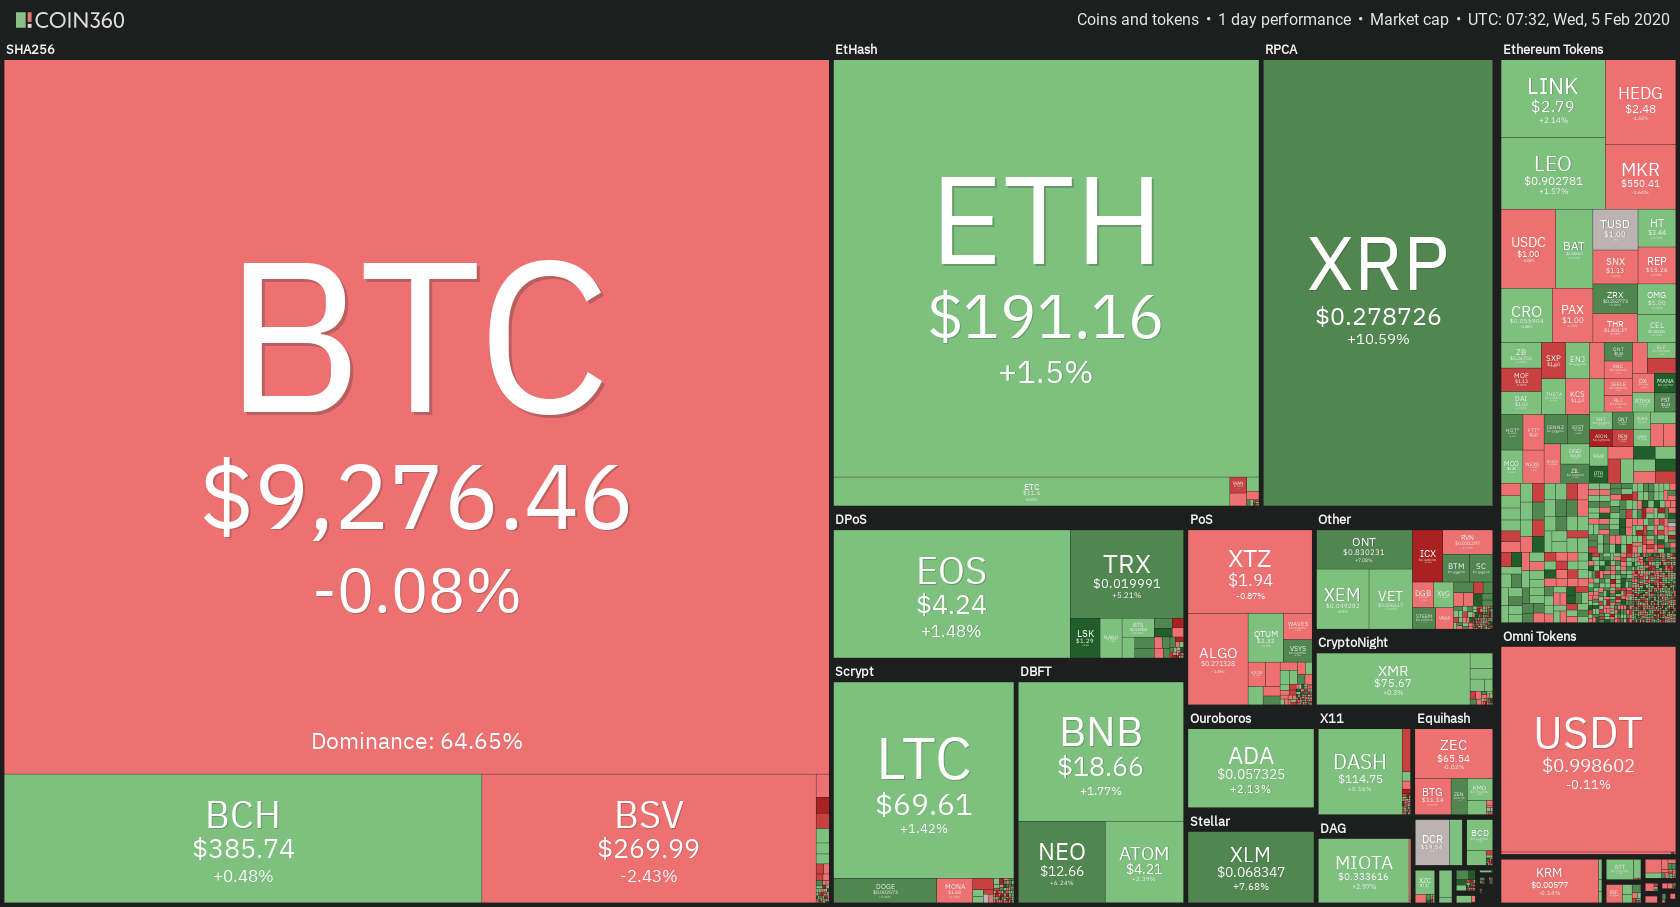
While the crypto market is still mostly in the consolidation phase, the outlook is much greener in the past 24 hours. Cryptocurrencies are mostly in the slight green with a cryptocurrency losing a tiny bit of their value here and there. Bitcoin, the largest cryptocurrency by market cap, is currently trading for $9276, which represents a 0.08% decrease on the day. Meanwhile, Ethereum gained 1.5% on the day, while XRP went parabolic and gained 10.59%.

Decentraland took today’s most prominent daily gainer title with gains of 19.82%. On the other side, ICON lost 16.64% on the day, which made it the most prominent daily loser.

Bitcoin’s dominance kept decreasing over the past few days as altcoins outperformed it slightly each day. It is now at 64.65%, which represents a decrease of 0.17% when compared to the value it had yesterday.

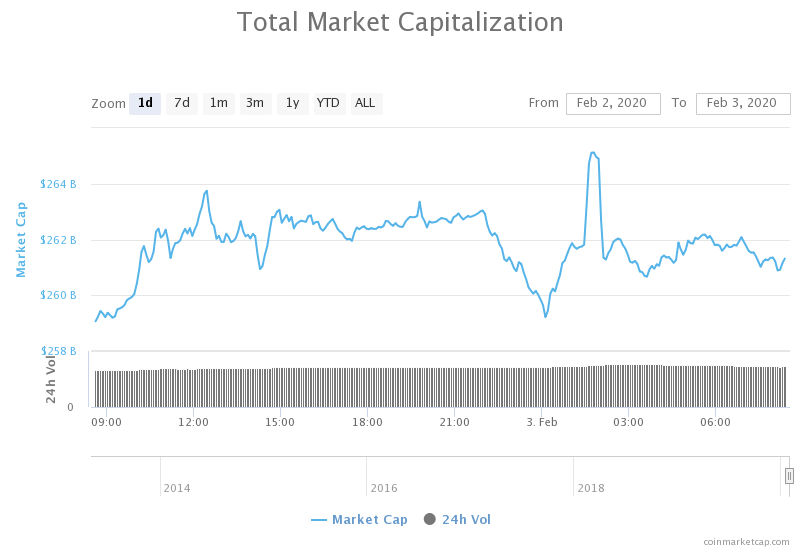
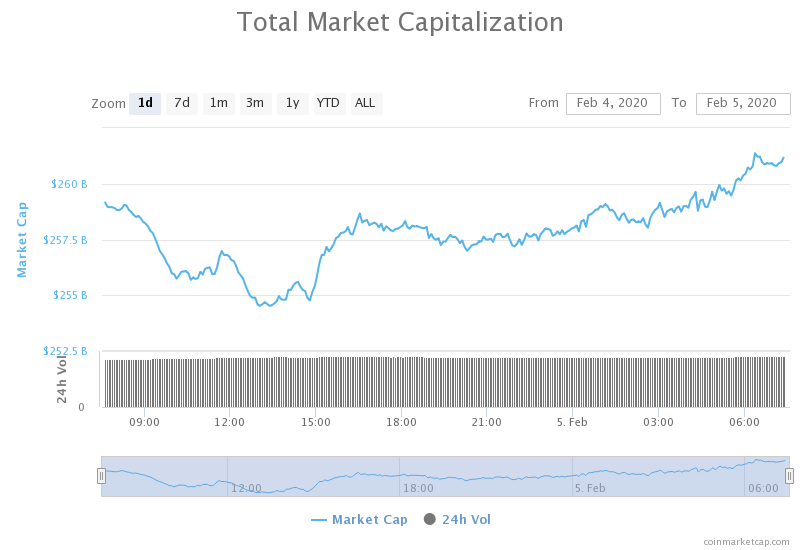
The cryptocurrency market capitalization stayed at pretty much the same level as yesterday. It is currently valued at $261.13 59.66 billion, which represents an increase of $1.47 billion when compared to yesterday’s value.

What happened in the past 24 hours

Gemini, a well-known cryptocurrency exchange founded by Tyler and Cameron Winklevoss, announced the integration of the popular trading analysis service TradingView.

As TradingView announced on Feb. 4, Gemini added the trading service as a trading partner. This will allow its institutional customers to trade directly through TradingView. As part of this integration and partnership, Gemini is now listed in the TradingView’s Trading Panel. It can also be found in the TradingView’s Brokerage Section.

Honorable mention

Bitcoin SV 

Bitcoin SV performed a scheduled chain upgrade called Genesis on Feb. 3. However, most nodes have not yet updated, which resulted in a minor chain split. Bitcoin SV is now split into two versions.

Somewhere around 1/4 of all blockchain nodes are still running the old version, which means that they cannot synchronize to the main BSV chain. On top of this, a chain split occurred several hours later, where the old chain got extended by one block, which means that some miners also failed to upgrade to the new chain.

This event does not appear to be a premeditated attempt at creating a new BSV sub-chain.

_______________________________________________________________________

Technical analysis

_______________________________________________________________________

Bitcoin

Bitcoin’s price might be in trouble as the sentiment grows bearish for the short-term. The largest cryptocurrency fell out of the consolidation range bound by $9,251 which indicated the possibility of price going further down. However, the $9,120 resistance was strong enough to keep Bitcoin bears at bay, and Bitcoin is now trying to regain its position above $9,251.


Bitcoin’s RSI is slowly rising in value while its volume is slightly below average.

Key levels to the upside                    Key levels to the downside

1: $9,251                                           1: $9,120

2: $9,585                                           2: $9,070

3: $9,732                                          3: $8,905


Ethereum

Ethereum also went down slightly as the ETH bears tried to test the $185 support. However, the support held and the downward-facing trend got rejected. Ethereum’s price is now pushing above the middle of the range, bound by $185 to the upside and $193.6 to the upside.


Ethereum’s volume increased greatly in the past few hours, while its RSI level is approaching overbought territory.

Key levels to the upside                    Key levels to the downside

1: $193.6                                            1: $185

2: $198                                              2: $178.5

                                                         3: $167.8


Ripple

XRP is certainly the best performer out of the top3 cryptocurrencies (and beyond). After breaking a downtrend it was in for two years, the price skyrocketed and reached above $0.266. The price increase was accompanied by a major spike in volume. XRP is now trading in-between $0.266 to the downside and $0.285 to the upside.


XRP’s volume is enormous when compared to the volume it had previous days/weeks. Its RSI level on the 4-hour chart is deep into overbought territory.

Key levels to the upside                    Key levels to the downside

1: $0.285                                            1: $0.266

2: $0.31                                              2: $0.2454

3: $0.324                                            3: $0.235


Categories
Crypto Market Analysis

Daily Crypto Review, Feb 3 – Cardano, the most decentralized crypto in the world? Altcoin season coming?

The crypto market went into a consolidation phase over the weekend. Altcoins seem to move up slightly more than Bitcoin in these phases. Bitcoin, the largest cryptocurrency by market cap, is currently trading for $9,372, which represents a 0.16% increase on the day. Meanwhile, Ethereum gained 1.55% on the day, while XRP went up 4.66%.

ICON took today’s most prominent daily gainer title with gains of 22.65%. On the other side, BitShares lost 9.72% on the day, which made it the most prominent daily loser.

Bitcoin’s dominance decreased significantly over the weekend. It is now at 65.30%, which represents a decrease of 0.56% when compared to the value it had yesterday.

The cryptocurrency market capitalization stayed at pretty much the same level over the weekend. It is currently valued at $261.34 billion, which represents an increase of $0.97 billion when compared to Friday’s value.

What happened in the past 24 hours

The UAE’s Ministry of Health and Prevention, alongside the Ministry of Presidential Affairs, Dubai Healthcare City, as well as other relevant authorities, started operating on a blockchain-based health data storage platform.

The blockchain-based platform is built to improve the efficiency of MoHAP and others by using smart health services. Users will benefit from having a more streamlined search for health facilities as well as its licensed medical and technical personnel. It will also help with all inquires about medicine supply chains.

Honorable mention

Cardano (ADA)

Cardano (ADA) seems to be on a green path, as its price is constantly rising. This is happening because of all the positive news surrounding it. Cardano’s co-founder and CEO of IOHK Charles Hoskinson announced building a new commercial strategy by partnering with PriceWaterhouseCoopers. This news was greeted well by the market participants, and the price of ADA surged over 30%.

Hoskinson claimed in an interview that once all the upgrades of the protocol are implemented, Cardano could become the most decentralized cryptocurrency the world has ever seen.

_______________________________________________________________________

Technical analysis

_______________________________________________________________________

Bitcoin

Bitcoin bulls tried to push the price above $9,500 over the weekend, but failed to do so on a couple ocasions. The largest cryptocurrency took the time after each failed attempt to establish its footing right around $9,300 levels. This is exactly where Bitcoin currently is, guided by the 14.6% Fib retracement from the move – usually not a well-respected retracement level. Bitcoin is currently trading between its nearest strong support of $9,251 and the $9,585 resistance level.


Bitcoin’s RSI is slowly reducing while its volume is average or slightly below.

Key levels to the upside                    Key levels to the downside

1: $9,585                                           1: $9,251

2: $9,732                                           2: $9,120

3: $10,000                                         3: $8,905


Ethereum

Unlike Bitcoin, Ethereum did not consolidate in the past 24 hours. The second-largest cryptocurrency managed to push over the next resistance in the line ($185) and push towards new highs. The move faded as the bulls could not break $193.6 resistance. Ethereum is now trading below the level of $193.6 and above the support of $185.


Ethereum’s volume increased slightly while it was running up in price. Its RSI level dropped out of overbought on the 4-hour chart and is now in the upper part of the value range.

Key levels to the upside                    Key levels to the downside

1: $193.6                                            1: $185

2: $198                                              2: $178.5

                                                         3: $167.8


Ripple

XRP was explosive today. Its price surged as the bulls gathered to break the resistance of $0.2454. The move was fast and extremely explosive and brought the price from $0.236 all the way up to $0.262. However, XRP moved slightly down as the bulls got exhausted. It is now consolidating in the middle of the range, somewhere around $0.25.


XRP’s volume was elevated during the move but quickly came to normal. Its RSI level is near the overbought territory.

Key levels to the upside                    Key levels to the downside

1: $0.266                                            1: $0.2454

2: $0.285                                            2: $0.235

3: $0.31                                              3: $0.227


Categories
Candlestick patterns Forex Candlesticks

Candlestick Reversal Patterns II: Let’s know The Engulfing Patterns


The engulfing pattern is a major reversal figure, and it is composed of two inverted candlesticks, as in the case of the Piercing pattern and the Dark Cloud Cover figure. Typically, this figure appears at the end of an upward or downward trend. It is common that the price pierces a significant resistance or support level, then making a gap up or down in the following session, to, suddenly, change its direction and end the day entirely covering the first candle.

The Bullish Engulfing

The bullish engulfing candle shows at the bottom of the trend. After several sessions with the price controlled by sellers, another black candle forms. The next session opens below the previous session close and closes above the last open, thus, completely covering the body of the black candle made on the previous session.

Criteria:

  1. The body of the second candlestick covers completely that of the black candle.
  2. There is evidence of a downward trend, even a short-term one.
  3. The body of the second candle is white and of the opposite color of the first candlestick. The exception is when the first candlestick is a doji or a tiny body. In this case, the color of the first candle is unimportant.
  4. The signal is enhanced if a large body engulfs a small body.
  5. a Large volume on the engulfing day also improves the signal.
  6. A body engulfing more than one previous candle shows the strength of the new direction.
  7. Engulfing also the shadows of the previous candle is also good news.
  8. In case of a gap, the larger the gap, the higher the likelihood of a significant reversal.

Market Sentiment:

After a downtrend, the next day, the price starts lower than the previous close but, after a short while, the buyers step in and move the price up. The late sellers start to worry, as they see their stops caught, adding more buying to the upward movement. As the price moves up, it finds a combination of profit-taking, stop-loss orders, and new buy orders. At the end of the day, this combination creates a strong rally that moves the price above the previous close.

 Fig 1- Bearish and Bullish engulfing patterns in the Bitcoin 4H  chart

The Bearish Engulfing

The Bearish engulfing pattern is the specular figure of a Bullish engulfing figure. And more so in the Forex market where assets are traded in pairs, making every move symmetrical.

The bearish engulfing forms after an upward trend. It is composed of two different-colored bodies, as in the above case. This time, though, the order is switched, and a bullish body is followed by a black candle. Also, the black body engulfs completely the body of the previous white candlestick. Sometimes that comes after the price piercing a key resistance, to then come back, creating a fake breakout.

Criteria:

  1. The uptrend is evident, even short-term.
  2. The body of the second day engulfs the body of the previous day.
  3. The body of the second candle is black, and the previous candle is a white candlestick, except for tiny bodies or dojis. In that case, the color of the first candlestick is unimportant.
  4. A large body engulfing a small body is an enhancement, as it confirms a change in the direction.
  5. A large volume on the engulfing day is also good for the efficacy of the signal.
  6. A body engulfing more than one previous candle shows the strength of the new direction.
  7. Engulfing also the shadows of the previous candle is also good news.
  8. In case of a gap, the larger the gap, the higher the likelihood of a substantial reversal.

Market sentiment:

After an uptrend, the price opens higher but, after a while, it reverses and moves below the previous open and below. Some stops trigger and add more fuel to the downside. The downward action accelerates on a combination of profit-taking, more stops hit, and new short orders. At the end of the day, the price closes below the open of the previous session, with the sellers in control. 

—- 

References:

The Candlestick Course: Steve Nison

Profitable candlestick Patterns, Stephen Bigalow

Categories
Crypto Market Analysis

Daily Crypto Review, Jan 22 – Companies abandoning Libra project, BNB on the rise

The markets didn’t make any significant gains over the past 24 hours. Prices remained at the same level for the second day in a row. Bitcoin’s price went down 0.07% on the day. It is currently trading for $8,641. Meanwhile, Ethereum gained 0.56% on the day, while XRP went down 0.64%.

Komodo gained 23.90 on the day, making it the biggest daily gainer. Golem followed with a gain of 21.47% on the day. On the other side, Centrality lost 7.80% on the day, which makes it the biggest daily loser. Centrality was the biggest daily loser for two days in a row.

Bitcoin’s dominance didn’t move at all. It is now at 65.5%, which represents a decrease of 0.18% when compared to the value it had yesterday.

The cryptocurrency market capitalization did not move today. It is currently valued at $240.15 billion, which represents an increase of $1.62 billion when compared to the value it had on yesterday.

What happened in the past 24 hours

After Facebook’s Libra project had a successful start with many big companies supporting it, things started falling apart. We can now add the telecom giant Vodafone to the list of companies that cut ties with the Libra association. Vodafone’s spokesperson confirmed the news on Jan. 21, 2020.

Dante Disparte, Libra association’s head of policy and communications, confirmed this news in a statement. “We can confirm that Vodafone is no longer a member of the Libra Association.”

Honorable mention

Binance Coin

Binance Coin was one of the few top cryptocurrencies that gained over 2% on the day. Binance Coin managed to go up by 3.44%, making it today’s top performer in the top10. The reason for that is not technical, but rather fundamental.

Binance announced that it officially launched its Peer-to-Peer (P2P) Merchant Program. This program is a user-oriented fiat currency trading platform, which started working yesterday.

According to Coin360’s reports, Binance managed to achieve a staggering 30% growth in trading volume just over the past month. The Hong Kong-based firm also has the largest average monthly traffic at the moment, counting over 18 million users.

With the increased volume which means more users transacting with BNB, as well as the good news regarding the P2P platform launch, Binance Coin has a great fundamental outlook.

_______________________________________________________________________

Technical analysis

_______________________________________________________________________

Bitcoin

Bitcoin is trading in a very tight range for 48 hours straight. The largest cryptocurrency traded sideways for around 2 days now, which is an incredibly long time for this tight of a range. The price movement shows lack of respect for the $8,650 trend line, which should be removed from the equation, at least for now (we will keep the line on our charts for now, but the price level will be removed from the “key levels” table). Each time Bitcoin consolidated in this way, the break afterwards was explosive.


Bitcoin’s volume stopped decreasing. It is now maintaining a certain level. Its RSI is hovering around the middle of the value range.

Key levels to the upside                    Key levels to the downside

1: $8,815                                           1: $8,436

2: $8,905                                           2: $8,130

3: $9,115                                           3: $7,880


Ethereum

Ethereum’s chart looks very similar to Bitcoin’s chart. The second-biggest cryptocurrency is consolidating as well at the moment. Its price is sitting right on top of the $167.8 line, and it is currently unknown whether the price will move up or down. If the price moves to the downside, Ethereum will face a support level of $163.5. On the other hand, if the price goes up, it will have leeway because the next resistance level is further away, sitting at 178.65.


Ethereum’s volume currently on the lower end of the spectrum, while its RSI level is precisely in the middle of the range (just like yesterday).

Key levels to the upside                    Key levels to the downside

1: $167.8                                             1: $163.5

2: $178.65                                          2: $160

3: $185                                               3: $154.2


Ripple

XRP was not performing any differently than the rest of the market. Its price is going through consolidation for the second day now. Its price is sitting right at the key level of $0.235, struggling to go up or down. If the price goes down, XRP will face support at the $0.227 level. If, on the other hand, it goes up, the price will face resistance at the $0.24545 level.


XRP’s volume is on the lower end of the spectrum, while its RSI is just precisely in the middle of the value range.

Key levels to the upside                    Key levels to the downside

1: $0.24545                                        1: $0.227

2: $0.253                                           2: $0.221

3: $0.266                                           3: $0.211


Categories
Crypto Market Analysis

Daily Crypto Review, Jan 17 – Russia making a national digital currency; Bitcoin fighting for $9,000

The cryptocurrency market went on a bull ride once again in the past 24 hours. Most cryptos ended up in the green, with altcoins usually performing better than Bitcoin. Bitcoin’s price went up 3.46% on the day. It is currently trading for $8,943. Meanwhile, Ethereum gained 6.95% on the day, while XRP went up 4.42%.

The past 24 had quite a few gainers, but we will mention only the most prominent ones. Mona Coin and Ethereum Classic were the best-performing digital assets today, gaining 29.15% and 28.32%, respectively. On the other side, Swipe lost 10.65% on the day, which makes it the biggest daily loser.

Every cryptocurrency in the top10 by market cap performed better than Bitcoin (excluding USDT).

Bitcoin’s dominance lost more than half a percent in the past 24 hours. It is now at 65.84%, which represents an increase of 0.53% when compared to the value it had yesterday.

The cryptocurrency market capitalization increased by quite a bit when compared to yesterday’s value. It is currently valued at $245.82 billion, which represents an increase of $10.88 billion compared to yesterday.

What happened in the past 24 hours

The new Prime Minister of the Russian Federation announced that the country will prioritize the development of the digital economy.

Mikhail Mishustin, who was confirmed for the Prime Minister position earlier today, said that Russia should improve and walk towards modern information technologies. One of the main things to develop, he said, was a national digital economy program.

_______________________________________________________________________

Technical analysis

_______________________________________________________________________

Bitcoin

Bitcoin had another explosive gain today. Even though its price rise is small in comparison to other cryptocurrencies, it still did move up with quite a good bull presence. Bitcoin bulls pushed the price to $9,000. The bull move is still in play, so this doesn’t have to be the biggest price we will see today. This move crushed all the upside levels, including $8,640, $8,815 and $8,905.


Bitcoin’s volume is quite high and stable. Its RSI level hit the overbought level on the 4-hour chart.

Key levels to the upside                    Key levels to the downside

1: $9,115                                          1: $8,905

2: $9,250                                          2: $8,815

3: $9,580                                          3: $8,640


Ethereum

Ethereum moved up along with other cryptos. Its move was bigger than Bitcoin. Ethereum’s price breezed through the resistance level of $167.8 and is currently trading at around $171. This move outperformed Bitcoin’s as well as XRP’s, making Ethereum the biggest gainer out of the top3 cryptocurrencies.


Ethereum’s volume is quite high due to the bull presence. Its RSI level is currently in the overbought territory.

Key levels to the upside                    Key levels to the downside

1: $178.5                                             1: $167.8

2: $185                                              2: $160

3: $193.5                                           3: $154.2


Ripple

XRP had a good day, as it too had quite an explosive gain. The price movement was quite linear and moved to the upside from $0.221 all the way to $0.237, which is XRP’s current price. There is still a place for XRP to move further up as the next resistance is quite far away.


XRP’s volume decently high and steady, while its RSI is touching the overbought territory at the moment. It has not, however, entered it yet.

Key levels to the upside                    Key levels to the downside

1: $0.24545                                        1: $0.2332

2: $0.253                                           2: $0.227

3: $0.266                                           3: $0.221

Categories
Forex Market Analysis

Daily F.X. Analysis, January 14 – Top Trade Setups In Forex – Eyes on U.S. Inflation!

On the forex front, the U.S. Dollar Index kept trading within a tight range on Monday, closing flat on the day at 97.38. The U.S. government reversed its decision to brand China a currency manipulator. U.S. Treasury Secretary Steven Mnuchin said: “China has made enforceable commitments to refrain from competitive devaluation while promoting transparency and accountability.” China offshore yuan strengthened to the strongest level in six months, with USD/CNH dipping 0.5% to 6.8822.

Economic Events to Watch Today


EUR/USD – Daily Analysis

The euro rose 0.2% to $1.1135. Dismissals from the 1.1100-15 are aiming at higher marks. The initial point is 1.1152, supported by 1.1167. On Monday, the Euro has traded slightly bullish during the trading session but hasn’t been overly convincing. It seems as if we are yet striving to decide out where the pair is likely to go. 

An unexpectedly weaker figure will likely leave a bearish impact on the greenback, and supporting the EUR/USD pair may cross the range of 1.1150. The U.S. dollar was weak on Friday after the release of the negative wage growth figures for December.

Looking forward, the speeches by FOMC’s E.Rosengren (Boston Fed) and R.Bostic (Atlanta Fed) should keep the attention on the buck later in the N.A. session. Moreover, the traders will closely observe the critical event in the upcoming days, which includes the German GDP and the ECB Accounts on Wednesday and Thursday, as well.


Daily Support and Resistance

  • S3 1.1062
  • S2 1.1097
  • S1 1.1115
  • Pivot Point 1.1131
  • R1 1.115
  • R2 1.1166
  • R3 1.12

EUR/USD– Trading Tips

The EUR/USD has traded slightly higher as investors seem to price in weaker CPI sentiments ahead of the news release. The support becomes a resistance level of 1.1145 is holding the pair below this level. We may have a bullish or bearish breakout upon the release of U.S. CPI data during the U.S. session. 

A bullish breakout of 1.1145 can open further room for buying until 1.1208. Conversely, the closing of bearish candles below 1.1145 can drive the selling trend until 1.1100 support. The next support is likely to be found around 1.1075 today.


GBP/USD– Daily Analysis

The British pound lost 0.4% to $1.2987. Official data showed that U.K. Gross Domestic Product (GDP) shrank 0.3% on month in November (flat estimated), and industrial production slid 1.2% (flat expected).

At the GBP front, despite the significant recovery from the 3-week low of 1.2691, the GBP currency trader remained cautious from the bearish risk-sentiment due to increased sentiments of Bank of England’s rate cut as early as this September.

The Bank Of England Governor Carney said last week that there are the chances to deliver a rate cut by 250 basis points. Besides this, the BOE policymaker Vlieghe said during the weekend that if the improvement does not come in the economic data, he will back for a reduction.

Moreover, a series of depressing U.K. key data, including the monthly GDP reduction and a significant drop in the industrial and manufacturing production data, supports the case for the dovish BOE monetary policy stance.

Looking forward, the focus now will shift towards the U.S. inflation data, which is scheduled to release later in the N.A. session at 1330 GMT. Due to the lack of any critical data from U.K. docket traders will keep their eyes on U.S. inflation data and the Sino-US phase-one trade deal.   

Daily Support and Resistance

  • S3 1.2845
  • S2 1.292
  • S1 1.2955
  • Pivot Point 1.2996
  • R1 1.303
  • R2 1.3071
  • R3 1.3147

GBP/USD– Trading Tip

On Tuesday, the GBP/USD continues to trade with bearish bias around 1.2980 after violating the 1.3045 support level. On the 4 hour timeframe, the pair has formed a strong bearish candle which is supporting the bearish trend in GBP/USD. The pair is currently trading in a bearish channel, which is extending resistance around 1.3034 along with support around 1.2906. While the MACD is still staying in the selling zone. I will be looking to take sell trades below 1.3000 today to target 1.2925 and 1.2906. 


USD/JPY – Daily Analysis

The USD/JPY climbed 0.4% to 110.01, the highest level since May 22. The USD/JPY currency pair hit the bullish level above the110 handles for the first time since May, mainly due to the fresh optimism surrounding the United States and China trade deal. 

As in result, the traders are selling the safe-have Japanese Yen in the wake of risk-on sentiment in the market. As of writing, the USD/JPY currency is currently trading at 110.08, having hit the high of 110.20. 

During the night, the USD/JPY currency pair strengthened its Asian session gains to a high of 109.94, a high since May 2019, in line with positive risk appetite. 

Meanwhile, the report came that the United States trade representative removed the currency manipulator tag for China, which also helped in increasing the risk-on market sentiment and also boosted the U.S. dollar.

The U.S. two-year Treasury yields increased to 1.585% (from 1.57% and a mild curve steepening allowed ten-year yields to test 1.85% from 1.82%. Fed funds futures indicated a modest (1bp) increase in implied yields across the curve, with the implied terminal rates up to 1.33% in early 2021.

Daily Support and Resistance

  • S3 109.02
  • S2 109.28
  • S1 109.38
  • Pivot Point 109.54
  • R1 109.64
  • R2 109.8
  • R3 110.06

USD/JPY – Trading Tips

The USD/JPY pair has traded in line with the previous forecast as it continues to trade bullish at 110.017 after breaking above 109.600 triple top resistance level.  

On the 4-hour timeframe, the candlestick pattern three while soldiers are likely to extend buying trend until the next resistance level of 110.570. Moreover, the RSI and MACD are still staying in the buying zone. Today, I will be looking for buying trades over 109.84 level with a target of 110.570. 

All the best for today! 

Categories
Crypto Market Analysis

Daily Crypto Review, Jan 13 – Block.One releasing EOS.io 2.0, Bitcoin back over $8,000 over the weekend.

The cryptocurrency market managed to restore some of its losses over the weekend. However, the past 24 hours were without much movement. Most cryptocurrencies made slight losses and are in the red. Bitcoin’s price went down 0.13% on the day. It is currently trading for $8,118. Meanwhile, Ethereum lost 0.54%, while XRP lost 1.51% on the day.

DxChain Token gained 31.22% on the day, making it the most prominent daily gainer. On the other side, Energi lost 8.52% of its value when compared to yesterday, making it the biggest daily loser.

Bitcoin’s dominance decreased by approximately half a percent during the weekend. It is now at 67.8%, which represents an increase of 0.58% when compared to the value it had on Friday.

The cryptocurrency market capitalization increased by over $10 billion over the weekend. It is currently valued at $217 billion. This value represents an increase of $11.11 billion on Friday’s value.

What happened in the past 24 hours

Blockchain software development company Block.One publically announced the release of EOS.io 2.0. EOS.io 2.0 is an update to the software that operates under the EOS blockchain.

Block.One called this update “faster, simpler, and even more secure” in the announcement.

This change is implemented with the aim to improve smart-contract execution performance. After testing the update behind close doors, Block.One claims that this update is supposedly up to 16 times faster when compared to their previous version of the engine.

_______________________________________________________________________

Technical analysis

_______________________________________________________________________

Bitcoin

Bitcoin managed to get over $8,000 over the weekend. It is currently in a tight range, bound by support level of $8,000 and resistance level of $8,165. There are currently no sure ways to see where Bitcoin’s price will go from here. Traders might consider abandoning range-trading and wait for the breakout to happen so they could catch the move.


Bitcoin’s volume is descending and is undoubtedly lower than what it was over the past week. Its RSI level is currently at 54.34, just above the middle point.

Key levels to the upside                    Key levels to the downside

1: $8,165                                           1: $8,000

2: $8,630                                           2: $7,780

3: $8,820                                           3: $7,530


Ethereum

Ethereum followed other cryptos on their move up over the weekend. It gained some upward momentum and reached over $141.15 level, which is where it’s at right now. Ethereum is now bound within a range between $148.5 to the upside and $141.15 to the downside.


Ethereum’s RSI is currently in the middle part of the value range. Its volume is descending but is still pretty high.

Key levels to the upside                    Key levels to the downside

1: $148.5                                             1: $141.15

2: $154.2                                            2: $130

3: $160                                              3: 128.1


Ripple

XRP is also following the industry trend of moving up after the consolidation, which brought the price down. XRP managed to bring its price above $0.211 over the weekend. However, unlike Ethereum and Bitcoin, XRP is now struggling to keep above that support. Its price is currently right on the $0.211 line or slightly below it. Whether the price will end up above or below this level plays an important role in this move, as passing above will mean consolidating at a much higher price. Consolidating below the line will most likely mean that XRP will fall into the middle of the range it was in on Friday.


XRP’s volume is much lower than yesterday, while its RSI is in the middle part of the value range.

Key levels to the upside                    Key levels to the downside

1: $0.211                                           1: $0.205

2: $0.221                                           2: $0.1978

3: $0.227                                           3: 0.1892

Categories
Crypto Market Analysis

Daily Crypto Review, Jan 10 – Blockchain will be used to tackle climate change; KPMG leader predicts

The cryptocurrency market is on the second day of consolidation after a big swing up. Bitcoin’s price went down 2.16% on the day. It is currently trading for $7,732. Meanwhile, Ethereum lost 1.64%, while XRP lost 1.17% on the day.

Aidos Kuneen gained 10.25% on the day, making it the most prominent daily gainer. On the other side, Bytecoin lost 20.76% of its value when compared to yesterday, making it the biggest daily loser.

Bitcoin’s dominance increased marginally in the past 24 hours. It is now at 68.38, which represents an increase of 0.23% from yesterday’s value.

The cryptocurrency market capitalization decreased slightly in the past 24 hours. It is currently valued at $205.89 9.65 billion. This value represents a decrease of $3.76 billion when compared to yesterday’s value.

What happened in the past 24 hours

One of the big four world-recognized accounting giants, KPMG, provided the media with its stance on the blockchain. KPMG US blockchain lead, Arun Ghosh, said that blockchain, alongside with the Internet of Things could be used to manage climate change in 2020 and beyond.

Ghosh also noted that the convergence of these two technologies enables organizations to accelerate their environmental governance. Blockchain’s chain of custody would be deployed as a central component in this system and it would be used to drive sustainability.

_______________________________________________________________________

Technical analysis

_______________________________________________________________________

Bitcoin

Bitcoin on a downward-facing path yet again. However, this may not be a bearish thing at all. Though some see this move as another short-term bear trend, many see it as the retracement to the base of the inverted H&S pattern which Bitcoin just left.


Bitcoin’s price went broke the $7,780 resistance and is right above it at the moment. Its volume is slowly descending, while its RSI value on the 4-hour chart is right in the middle of the value range.

Key levels to the upside                    Key levels to the downside

1: $7,780                                           1: $7,530

2: $7,990                                           2: $7,415

3: $8,165                                           3: $7,275


Ethereum

Ethereum followed Bitcoin on its downward path yet again today. The consolidation above the $141.15 support line currently does not seem like an option, as Ethereum continued its move down and is currently trying to stabilize in the middle of the range, bound by $141.15 at the top and $130 at the bottom.


Ethereum’s RSI is currently in the lower part of the value range. Its volume is descending but is still pretty high.

Key levels to the upside                    Key levels to the downside

1: $141.15                                            1: $130

2: $148.5                                            2: $128.1

3: $154.2                                            3: 122.1


Ripple

XRP is also following the industry trend of consolidating or going down in price. Its price fell under the $0.205 support level and is currently in the middle of the range, bound by $0.205 at the top and $0.1978 at the bottom. As momentum fades, volume lowers, and RSI drops down, further sharp downward movement is less likely to happen.


XRP’s volume is much lower than yesterday, while its RSI is in the lower part of the value range.

Key levels to the upside                    Key levels to the downside

1: $0.205                                           1: $0.1978

2: $0.211                                           2: $0.1892

3: $0.221                                           3: 0.1758

Categories
Crypto Guides

Understanding The Fundamentals Of Blockchain

Introduction

We have understood the basics of DLT in the previous guide. In this article, let’s see one of the most popular applications of DLT, which is known as the blockchain. Many say that the blockchain technology is the new internet. By allowing information to be distributed not copied and tampered, blockchain did create the backbone of a new type of internet. Initially, blockchain found its application only in digital currencies, but today’s tech has now found other potential uses for the technology.

Blockchain, a distributed ledger, is a time-stamped series of immutable records of data that is controlled by different nodes in the network and not owned by any single entity. The records are stored in blocks that are secured and bound to each other by cryptographic principles.

The blockchain technology is completely decentralized. There is no central regulatory body on the blockchain network. The ledger on the blockchain is shared and immutable. The information in it is open to anyone to access. Hence, the blockchain is transparent in nature, and everyone involved in the network is accountable for their actions.

How does the Blockchain function?

In a blockchain, information is passed from one source to another in a fully automated and secure manner. When a party makes a transaction via blockchain, the peers in the network create a block for this transaction, which is secured using cryptography. This block is verified by several nodes (computers) distributed across the network. Once the block is successfully verified, it is added to the chain. Each block in the chain has a unique record with a unique history. Falsifying a single record means to falsify millions of instances in the chain. This is virtually impossible.

Features that hold Blockchain Strong

There are three properties of blockchain technology, which have helped it gain widespread applause.

  • Decentralization
  • Transparency
  • Immutability

📌 Decentralization

Before the appearance of Bitcoin, the public was used to only the centralized systems. And the idea of centralized systems was simple. There is a centralized entity that stores user’s information. To get this information, the user must interact solely with this entity. The main drawback of centralized systems is the absence of transparency.

Imagine if the centralized system was taken out. Everyone in the network can now view the data. It simply eliminates the existence of a third party. The data now can be shared one to one without any intermediary. This will eradicate the costs to be paid to the intermediaries as well. And this system is referred to as a decentralized network, making it a great property of the blockchain.

📌 Transparency

Transparency is another property that makes blockchain much appealing. Some say that blockchain is transparent, while some say it is private. Though it may sound counter-productive, blockchain is both transparent and private. When a transaction is made between two parties, one cannot see ‘who’ has sent it to ‘whom.’ Instead, we will be able to see something called the hash of a transaction. And this will be visible to everyone. Hence, this brings both transparency and privacy in the blockchain.

📌 Immutability

The blocks in the blockchain are immutable. It is impossible to tamper with. Technically speaking, blockchain is a linked list whose structure contains data and a hash pointer to the next block, hence creating a chain. This chain makes blockchain immutable.

For instance, let’s say a hacker hacks block 3 in the chain and tries to change the data. But, a slight change in the block will affect the other blocks drastically. That is, a change in block 3 will change the hash stored in block 2. This continues up to block 1. This will change the entire blockchain, which is impossible. Hence, making blockchain immutable.

Above are just the primary properties of the blockchain. There are other beneficial properties too, which is the reason blockchain has still sustained and is developing at a rapid pace.

Categories
Crypto Market Analysis

Daily Crypto Review, Jan 09 – China announcing its cryptocurrency launch date

The cryptocurrency market got a well-deserved consolidation phase after the big moves to the upside it made over the past couple of days. As far as daily price changes go, Bitcoin’s price went down 4.88%. It is currently trading for $7,899. Meanwhile, Ethereum lost 3.74%, while XRP lost 3.55% on the day.

Lisk gained 23.41% on the day, making it the most prominent daily gainer. On the other side, Centrality lost 11.45% of its value when compared to yesterday, making it the biggest daily loser.

Bitcoin’s dominance fell quite drastically in the past 24 hours. Its dominance is now at 68.15, which represents an increase of 0.84% from yesterday’s value.

The cryptocurrency market capitalization decreased in the past 24 hours. It is currently valued at $209.65 billion. This value represents an increase of $8.83 billion when compared to yesterday’s value.

What happened in the past 24 hours

China announced that its nationwide blockchain network called the Blockchain-based Ser­vice Net­work (BSN) would be operational in April 2020. This is only six months after it’s testing phase started.

This project is fully backed by Chinese government policy. It is created to provide a platform on top of which new blockchain projects could be made, but also to help with the development of smart cities and the digital economy as a whole.

_______________________________________________________________________

Technical analysis

_______________________________________________________________________

Bitcoin

Bitcoin is following the price movement that most analysts predicted so far. Even though it fell under the 200-day moving average (1-day time-frame) which it was under since November, this doesn’t have to be considered bearish at all. After creating an almost perfect head and shoulders pattern and breaking it to the upside, the true confirmation of a successful move would be a retracement to the neckline and then a burst in upwards momentum. This price movement seems exactly like a pullback that was expected.From a fundamental standpoint, Bitcoin is more and more bullish as the tension between the US and Iran rises.


Bitcoin’s price went under $8,000 and broke the $8,165 and $7,790 resistances.

Key levels to the upside                    Key levels to the downside

1: $7,990                                           1: $7,780

2: $8,165                                           2: $7,530

3: $8,640                                           3: $7,415


Ethereum

Ethereum didn’t have an additional day of gains, which resulted in it falling slightly less than Bitcoin. The consolidation above the $141.15 support line continues until the bearish pressure pushed the price below support.


Ethereum’s RSI moved away from the overbought territory and is currently in the lower value range. Its volume, on the other hand, is still above average.

Key levels to the upside                    Key levels to the downside

1: $141.15                                            1: $130

2: $148.5                                            2: $128.1

3: $154.2                                            3: 122.1


Ripple

XRP did not have a day last time we reported, as it was falling in price while other cryptocurrencies were either rising or consolidating sideways. However, XRP might have found a strong support line to consolidate at. After creating a downtrend line, which dates from two days ago, XRP managed to find its support at $0.205. The price is currently right at that level and is testing it to the downside.


XRP’s volume lower than yesterday, while its RSI moved out of the overbought territory and is currently moving towards oversold on all time-frames.

Key levels to the upside                    Key levels to the downside

1: $0.211                                           1: $0.205

2: $0.221                                           2: $0.1978

3: $0.227                                           3: 0.1892

Categories
Crypto Market Analysis

Daily Crypto Review, Jan 08 – Bitcoin moves above 8,000 as people move to safer assets and from USD

The cryptocurrency spent most of its day consolidating and being in the slight green. However, Bitcoin continued moving higher and higher as the US attacks Iraqi bases. As far as daily price changes go, Bitcoin’s price went up 5.58%. It is currently trading for $8,317. Meanwhile, Ethereum gained 1.08%, while XRP lost 1.42% on the day.

Quant gained 17.68% on the day, making it the most prominent daily gainer. On the other side, MaidSafeCoin lost 7.93% of its value when compared to yesterday, making it the biggest daily loser.

Bitcoin’s dominance increased massively in the past 24 hours. Its dominance is now at 68.99, which represents an increase of 1.01% from yesterday’s value.

The cryptocurrency market capitalization increased by almost $10 billion just in the past 24 hours. It is currently valued at $218.48 billion. This value represents an increase of $7.56 billion when compared to yesterday’s value.

What happened in the past 24 hours

Coinbase has expanded on its Coinbase Pro trading platform compatibility. The Coinbase Pro mobile app can be downloaded off the Android’s application store. This news got announced by Coinbase a Jan. 7 blog post. The exchange also unveiled its Pro app for iOS users in October 2019.

_______________________________________________________________________

Technical analysis

_______________________________________________________________________

Bitcoin

Bitcoin is currently at a level of great importance for the long-term movement of its price as well as the price of the entire crypto industry. Taking a look at the 1-day chart shows us that Bitcoin just passed the 200-day moving average which it was under since November. On the shorter time-frames, the move to the upside looks overextended as its RSI is in the overbought territory. Its price broke the $7,990 and $8,165 resistances from when we last reported.


From a technical standpoint, this move looks like a continuation of the inverted head and shoulders pattern (which still requires a pullback to be confirmed). However, from a fundamental standpoint, this move is explained by many as people moving to gold and crypto as tensions between the US and Iran rise. The majority of the most recent push actually happened soon after the news of the US attacking two military bases in Iraq got released.

Key levels to the upside                    Key levels to the downside

1: $8,640                                           1: $8,165

2: $8,820                                           2: $7,990

3: $9,125                                           3: $7,780


Ethereum

Unlike Bitcoin, Ethereum did not skyrocket to the upside. It continued its consolidation above the $141.15 support line, which it conquered the day before. Its price looks quite stable above this support and has a bigger chance to move upwards than downwards when it gets ready for a move.


Ethereum’s RSI is moving away from the overbought territory, while its volume is still above average.

Key levels to the upside                    Key levels to the downside

1: $148.5                                             1: $141.15

2: $154.2                                            2: $130

3: $178                                              3: 128.1


Ripple

XRP did not have as good a day as some other cryptocurrencies did. Its price fell down slightly and managed to breach the $0.221 support level. However, it remained above the $0.211 support line. Even though it did lose a bit of value and broke one support line, XRP did not cause any move that could cause a further selloff. This pullback can only be a healthy thing after such explosive rise in price.


XRP’s volume is quickly dwindling down, while its RSI moved out of the overbought territory and is currently above the middle of the value range.

Key levels to the upside                    Key levels to the downside

1: $0.221                                            1: $0.211

2: $0.227                                            2: $0.205

3: $0.233                                            3: 0.1978

Categories
Crypto Market Analysis

Daily Crypto Review, Jan 07 – XRP making steady gains, state of Virginia considering using blockchain for elections

The cryptocurrency market had yet another great day. The majority of the crypto market ended up in the green and made some great progress to the upside. As far as daily price changes go, Bitcoin’s price went up 4.24%. It is currently trading for $7,887. Meanwhile, Ethereum gained 1.19%, while XRP gained 3.81% on the day.

Centrality gained 35.68% on the day, making it the most prominent daily gainer. On the other side, Synthetix Network lost 16.69% of its value when compared to yesterday, making it the biggest daily loser.

Bitcoin’s dominance increased by a fraction of a percent in the past 24 hours. Its dominance is now at 67.98, which represents an increase of 0.29% from Friday’s value.

The cryptocurrency market capitalization increased by almost $10 billion just in the past 24 hours. It is currently valued at $210.92 billion. This value represents an increase of $8.24 billion when compared to the value it had when we last reported.

What happened in the past 24 hours

The United States’ state of Virginia is looking into studying blockchain to improve its election process and voting.

A new bill which involved a request to study blockchain-based elections was prefiled on Dec. 27 and scheduled for offering on Jan. 8. The bill is called House Joint Resolution 23 and asks the Department of Elections to investigate and dettermine whether blockchain technology will improve the security of voter records and election results.

_______________________________________________________________________

Technical analysis

_______________________________________________________________________

Bitcoin

Bitcoin bulls were not stagnant today either. After Bitcoin’s price moved explosively to the upside yesterday, it did the same today as well. During the yesterday’s price increase, Bitcoin broke the $7,260, $7,415 and $7,525 resistances. In the most recent price movement, it managed to break the $7,780 resistance as well. It is now consolidating right above $7,780 whcih now turned support.


Bitcoin’s RSI is deep inside the overbought territory, while its volume was extremely high during the spike and is currently reducing to average daily levels.

Key levels to the upside                    Key levels to the downside

1: $7,990                                           1: $7,780

2: $8,165                                           2: $7,525

3: $8,640                                           3: $7,415


Ethereum

Ethereum did not stay stagnant either. It continued its move to the upside after breaking the descending trend line and made some solid gains yet again. Ethereum ended the move right below the $141.15 resistance line yesterday. In the past 24 hours, that line of resistance was broken, and Ethereum is now consolidating above it.


Its RSI stepped into the overbought territory but went out of it shortly after. Ethereum’s volume is above average for a couple of days already.

Key levels to the upside                    Key levels to the downside

1: $148.5                                             1: $141.15

2: $154.2                                            2: $130

3: $178                                              3: 128.1


Ripple

XRP’s move to the upside went from $0.185 to $0.211 yesterday. Most analysts thought that this is where the move would end, but XRP pushed through and broke the $0.211 resistance line. On top of that, it gained more momentum and broke the $0.221 resistance as well. However, once it could not break through its next obstacle ($0.227), the price tumbled down at $0.216. XRP is now trying to consolidate.


XRP’s RSI left the overbought territory once the price started going down. Its volume is extremely high throughout the day.

Key levels to the upside                    Key levels to the downside

1: $0.221                                            1: $0.211

2: $0.227                                            2: $0.205

3: $0.233                                            3: 0.1978

Categories
Crypto Market Analysis

Daily Crypto Review, Jan 06 – Qatar against crypto, Ripple skyrocketing

The cryptocurrency market had another good weekend, as the price seems to recover from the downturn it was in before 2020. The price of most cryptos increased when compared to when we last reported. If we talk about daily changes, Bitcoin’s price went up 1.62%. It is currently trading for $7,565. Meanwhile, Ethereum gained 2.97%, while XRP gained an astounding 7.04% on the day.

Dash gained 15.43% on the day, making it the most prominent daily gainer. On the other side, Bytecoin lost 12.74% of its value when compared to yesterday, making it the biggest daily loser.

Bitcoin’s dominance decreased by over half a percent over the weekend. Its dominance is now at 67.69, which represents a decrease of 0.62% from Friday’s value.

The cryptocurrency market capitalization increased by over $10 billion over the weekend. It is currently valued at $202.68 billion. This value represents an increase of $10.98 billion when compared to the value it had when we last reported.

What happened in the past 24 hours

The Qatar Financial Centre Regulatory Authority (or QFCRA for short) announced a flat-out ban on cryptocurrency businesses. They forbid any form of conducting virtual asset services in or from the Qatar Financial Centre (QFC).

The regulator announced this news in a tweet, where it stated that authorized firms are not allowed to provide or facilitate the provision or exchange of cryptocurrencies as well as any related services until further notice.

_______________________________________________________________________

Technical analysis

_______________________________________________________________________

Bitcoin

Bitcoin bulls gathered over the weekend and brought its price from $7,000 all the way to $7,570. Its price moved explosively to the upside and gained a couple of hundred dollars before consolidating. Successful consolidation at the top of the move led to another spike which brought the price to its current levels. During the price increase, Bitcoin broke the $7,260, 7,415 and 7,525 resistances. It is now consolidating right above 7,525 and testing its strength.


Bitcoin’s RSI is very close to the overbought territory, while its volume is above average.

Key levels to the upside                    Key levels to the downside

1: $7,780                                           1: $7,525

2: $7,990                                           2: $7,415

3: $7,165                                           3: $7,260


Ethereum

Ethereum also moved up along with Bitcoin. It quickly broke the descending trend line and spiked to the upside. Its price went from $126 all the way to $141, where it is currently. Ethereum is currently right below the $141.15 resistance line, which it is attempting to break. However, RSI, which already reached overbought, as well as descending volume, are not promising indicators when it comes to price rises.


Key levels to the upside                    Key levels to the downside

1: $141.15                                           1: $130

2: $148.5                                            2: $128.1

3: $154.2                                            3: 122.15


Ripple

XRP’s move to the upside reminds us of the 2017 spike. Its price skyrocketed and went from $0.185 to $0.21. However, the $0.211 resistance line stopped the move. XRP is now trying to recover from hitting a resistance it can’t pass. It is still unknown at which price XRP will consolidate.


XRP’s RSI is deep in overbought territory, while its volume is extremely high.

Key levels to the upside                    Key levels to the downside

1: $0.211                                            1: $0.205

2: $0.221                                            2: $0.1978

3: $0.227                                            3: 0.19

Categories
Crypto Market Analysis

Daily Crypto Review, Jan 03 – Bitmain reportedly laying off 50% of their workforce, Crypto bulls back in the game today

The cryptocurrency market took a step towards the upside in the past 24 hours. The price of most cryptos increased when compared to yesterday. However, not many cryptos made significant gains, and some even lost in value. If we talk about daily changes, Bitcoin’s price went up 1.1%. It is currently trading for $7,214. Meanwhile, Ethereum gained 0.6%, while XRP lost 0.9%.

BlockStamp gained an astounding 297.56% on the day, making it the most prominent daily gainer. On the other side, EDUCare lost 13.05% of its value when compared to yesterday, making it the biggest daily loser. EDUCare is the biggest daily loser for the third time in a row.

Bitcoin’s dominance increased from when we last reported. Its dominance is now at 68.31, which represents an increase of 0.5% from yesterday’s value.

The cryptocurrency market capitalization gained some value in the past 24 hours. It is currently valued at $191.7 billion. This value represents an increase of $2.13 billion when compared to the value it had when we last reported.

What happened in the past 24 hours

Cryptocurrency mining mogul Bitmain reportedly plans to reduce its workforce by fifty percent. This news got reported by a Chinese news media outlet Wushuo Blockchain on Dec. 2. It reported that Bitmain’s “personnel optimization plan” is to layoff a significant portion of its employees before the BTC halving of May 2020.

The world’s largest cryptocurrency mining hardware producer will reportedly hold an annual meeting on January 17. It is expected that the layoffs will happen before that date.

_______________________________________________________________________

Technical analysis

_______________________________________________________________________

Bitcoin

Bitcoin gathered its bulls and attempted to make new short-term highs in the past 24 hours. Its price moved explosively to the upside and gained a couple of hundred dollars, but then hit the first resistance level and stopped there. The $7,260 resistance level seemed unbreachable at the moment, and the price backed off a tiny bit and started to consolidate. Its price is, therefore, still bound witin a range, with its resistance sitting at $7,260 and support at $6,940.


Bitcoin’s RSI spiked from oversold to a high value under overbought territory for the duration of the move.

Key levels to the upside                    Key levels to the downside

1: $7,260                                           1: $6,940

2: $7,415                                           2: $6,640

3: $7,525                                           3: $6,410


Ethereum

Ethereum also moved up along with Bitcoin. However, it is in a different spot than Bitcoin at the moment. Even though it is bound to the upside by the descending trend line, which it could not pass, the price is still on the rise and managed to stay above the $130 line, turning it into support. As the descending trend line will soon cross the $130 level to the downside, Ethereum will have to make a decision of whether to stay in a descending trend or stay above $130.


Ethereum’s volume seems to be above average, and the possibility for a move (up or down) in the short term is extremely high.

Key levels to the upside                    Key levels to the downside

1: $141.15                                           1: $130

2: $148.5                                            2: $128.1

3: $154.2                                            3: 122.15


Ripple

XRP broke its $0.19 support level in the past 24 hours but managed to recover. As we reported yesterday, XRP  made a lower high compared to Dec 29/30, which indicated a possible retest of the support level in the short-term. This is exactly what happened. Its value fell below $0.19 level and reached $0.185. However, it quickly bounced back, led by the bull presence in the overall crypto market. The price is yet again above $0.19 level and seems stable.


Key levels to the upside                    Key levels to the downside

1: $0.198                                            1: $0.19

2: $0.2058                                          2: $0.178

3: $0.211                                            3: 0.1678

Categories
Cryptocurrencies

Breaking Down the Populous Cryptocurrency

Many small and medium-sized businesses grapple with the issue of late invoice payments. Late invoices cause businesses to miss many money-making opportunities, not considering the error and fraud-prone paper-based trails of the existing invoicing system.

Blockchain technology can solve this by enabling decentralized, transparent, and error-free invoice financing that would save businesses money and time.

Populous is a platform that promises to simplify invoicing for businesses. In this explainer, we explore in more in-depth detail on how Populous achieves this, the role of its three tokens, how the future looks for the platform, and more.

What is Populous?

Populous is a peer-to-peer platform built on Ethereum’s blockchain that uses its distributed ledger technology to provide small and medium-sized businesses a global and efficient invoice financing platform. Populous describes invoice finance as “a form of funding that instantly unlocks the cash tied up in outstanding sales invoices. Business owners allow invoice buyers to buy invoices at a discounted rate in order to unlock the cash quicker. Once invoices are paid by the invoice debtor, the invoice buyer receives the amount previously agreed upon.”

In short, Populous wants to reduce or eradicate the need for third parties, intermediaries, or moderators in invoice processing and transactions.

How Does Populous Work?

On the Populous platform, there are two types of transacting parties: buyers and sellers. These parties exchange invoices via smart-contract-based auctions. We can think of invoice sellers as borrowers, with invoice buyers as investors.

To sell an invoice, you must first register your company. You will then wait until you receive approval from a Populous administrator. Once you’re approved, you can offer an invoice with specific sales goals. This will also need to be approved.

If your invoice offer is approved, an invoice buyer will view available invoices and identify which one they would like to invest in. The buyer will then make a bid for the invoice. They will also set an interest rate for the invoice.

Next, the invoice seller will view the bid, and if satisfied, confirm it. The seller then releases the invoice and then, via a smart contract, receives funds equivalent to the bid.

Populous’s Altman Z-Score Formula

The approval of bidders is done using an in-house credit rating system called the Altman Z-Score Formula. The formula is a financial modeling tool that assesses businesses’ credit risk based on these three factors:

  • The probability that a business will become bankrupt within two years
  • The probability that a business will default on terms of the agreement
  • The control measures of a business in times of financial distress

The Z-Score formula solely assesses a company’s suitability for the platform.

Sellers’ bids usually only last for 24 hours. A bid ends under either of the following circumstances:

  • An auction is successful – meaning your sales goal is matched with a bid
  • 24 hours elapse before your sales goals match a bid. In this case, you can either take the best available bid, cancel your offer, or submit another offer
  • You withdraw your offer, in which case you can completely cancel the auction or accept the best bid available 

Explaining Populous Tokens

The Populous platform has three tokens, which can be confusing at first glance. Let’s break them down below. 

Pokens

Pokens are the in-house currency of the Populous platform. The currency is pegged to an equivalent of fiat currency. For example, in the U.K, 1GBP Poken is equal to 1GBP, and in the US, 1USD token is equal to 1USD. Pokens are ERC 20 tokens, and users pay with them to acquire invoices. The Pokens themselves can be directly purchased from Populous with GBP, USD, EUR, and Yen. Other currencies will be converted to GBP on the London Stock Exchange rate before you can purchase the tokens. You can also buy Pokens using supported cryptocurrencies such as Bitcoin and Ethereum.

Pokens are ERC 20 tokens, meaning you can store them in any ERC 20 compatible wallet. 

Populous Platform Token (PPT)

These tokens were distributed to the public during the ICO and are used for investment purposes. PPT tokens have a capped supply of 53, 252, 246.

Apart from holding PPT, you can use it to invest in invoices. When you invest in an invoice through Populous, your tokens are put up as security for the investment, after which you receive Pokens in exchange. Once the invoice is paid, you receive Pokens as profit together with your Original PPT investment.

PXT

PXT (Populous eXtensible Business Reporting Language (XBRL) Token) is a token that allows you to access Business Intelligence (BI) data on the Populous XBRL Platform. With PXT, you can access the one quadrillion bytes of business on the Populous Data Platform. This data enables you to create customized reports regarding credit scores, SWOT analyses, your business’s financial health, and so on.

PPT Statistics

As of December 19, 2019, PPT has a market cap of $21, 423, 195, and a 24-hour trading volume of $1, 108, 105. Its all-time high was $76.49, while its all-time low was $0.298937. The token has a circulating and fixed supply of 53, 252, 246 tokens.

Where to Buy and Store PPT

Most exchanges do not allow you to buy crypto with fiat currency. You’ll thus need to buy BTC or ETH so as to exchange it with PPT. You can get the token on exchanges like Binance, Kucoin, P2PB2B, IDEX, Coinplace, LATOKEN, Bitrue, Livecoin, etc.

PPT is an ERC 20 token, meaning you can store it in any ERC 20 supported wallet, e.g., MetaMask and MyEtherWallet.

If you prefer tighter security (and who doesn’t?), you’re better off using a hardware wallet. Trezor, Ledger Nano, and Parity are some of the popular PPT compatible wallets.

What’s the Future of Populous?

So far, there doesn’t seem to be any serious competitor of Populous. The biggest challenge it faces is getting clients to ditch existing invoicing models and transition to their platform. For now, the Populous system is limited to the UK and China/HongKong markets. That means only invoices originating from those territories can be sold on the platform. Populous is likely working to implement support for more countries – something that will help it achieve its goal of being a global trading platform.

Conclusion

Populous is a platform with an excellent model and vision but is yet to truly capture the imagination of cryptoverse. This can partly be blamed on its current country limitation, or it could be because it’s still a ‘teething’ project. Either way, PPT needs to expand its platform and market itself better if it hopes to make a bigger impact on the crypto and blockchain sphere.


Categories
Forex Videos

Steemit Economy Explained – One Of The Most Adopted Cryptocurrencies

Steemit economy explained

Steemit has been one of the most used cryptocurrencies as well as the gateway to newcomers around the world. However, it’s fair to say that Steemit as a platform can be very confusing for newcomers. Steemit is one of the few cryptocurrency projects that is working as intended. It has seen mass adoption, even from outside the cryptocurrency space.

Steemit Currencies

Steemit consists of three currencies that make the Steemit economy.

Steem 
Steem power
Steem dollar

This guide will try to explain how these cryptocurrencies work. Let’s explore Steemit currencies.

Steem

Steemit operates on its own blockchain. Its blockchain issues the Steem (STEEM) token, which is the unit of accounts of the Steem ecosystem. This token has two use cases:
It can be used by the Steemit economy to boost accounts’ Steem power.
It can be exchanged for Steem dollars (SBD).
The Steem token has the option to be traded on public exchanges such as Bittrex or Binance. Steem is the highly liquid component of the ecosystem. Steem power, as well as Steem dollars, derive their value from Steem’s value.

Steem Power

Steem Power is very similar to Steem, except for its actual use case. Steem power is locked and is meant to be a long-term asset. Your Steem can be converted to Steem Power in a process called ‘Power Up.’ It can also be converted back to steem in a process called ‘Power Down.’ The strength of the whole Steemit economy depends on this. Powering down is only possible for 1/104th of your steem power weekly.

Steem Power is held by many people as it has proven to be quite valuable. The more Steem Power a user has, the more influence they have over the Steem network. Their upvotes and comments will be worth more than those of people who have locked up less Steem Power.

The amount of Steem in supply doubles every year (which translates into 100% annual inflation). 90% of the new Steem gets distributed to the Steem Power holders.

Steem Dollar

The steem dollar (SBD) is Steemit’s attempt to bring stability to the cryptocurrency industry. The steem dollar can be considered a stablecoin and is meant to be worth roughly $1 at all times. A steem dollar is a transferable and convertible debt that can be transferred to an exchange or sold to someone else. Steem dollar is essentially a promise to pay one dollar’s worth of steem when converting back to steem tokens. Businesses are more comfortable accepting steem dollar due to its stability.

Steem dollars can be earned by publishing content on the Steemit platform. An author of the topic will receive both steem power and steem dollars as a reward for adding content to the platform.

All steem dollars can be redeemed at any time when its price is lower than $1. You will receive steem coins worth $1. The steem dollar exchanged will be destroyed. As there are fewer steem dollars circulating each time someone converts their SBT into steem tokens, the price of steem dollar constantly goes back to $1.

However, Steem Dollar is far from perfect. In December 2017, the price reached $12.

Conclusion
Steemit economy is trying to introduce cryptocurrency to people that didn’t know what it is through their very popular platform. Even though they had a few drawbacks, they still remain one of the most used cryptocurrencies in the world.

Categories
Crypto Market Analysis

Daily Crypto Review, Jan 2 – Ripple releasing funds from escrow, markets in the red due to low volume

The cryptocurrency market declined in price slightly due to the lack of volume during the New Year’s celebration. The price of most cryptos decreased when compared to when we last reported the prices. If we talk about daily changes, Bitcoin’s price went down 1.79%. It is currently trading for $7,095. Meanwhile, Ethereum lost 1.15%, while XRP lost 2%.

Seele gained 11.10% on the day, making it the biggest daily gainer. EDUCare lost 12.72% of its value when compared to yesterday, making it the biggest daily loser.

Bitcoin’s dominance decreased from when we last reported. Its dominance is now at 67.81%, which represents a decrease of 0.26% from our report on Monday.

The cryptocurrency market capitalization decreased by a significant amount since Monday. It is currently valued at $189.57 billion. This value represents a decrease of $7.78 billion when compared to the value it had when we last reported.

What happened in the past 24 hours

Ripple, the blockchain payment network which made the altcoin XRP, started the year 2020 by releasing funds from its escrow account. The value released from the account is $192 million.

Whale Alert, the monitoring resource that performs data scans, caught the latest consignment of XRP tokens. This forms one installment of a pre-planned release schedule that Ripple began in 2017.

_______________________________________________________________________

Technical analysis

_______________________________________________________________________

Bitcoin

Bitcoin entered the new year in without much volume and entusiasm. Its price moved down slightly from our last report. Bitcoin managed to break the $7,260 level to the downside, turning it from a support level to a resistance level. Its price is currently bound witin a range, with its resistance sitting at $7,260 and support at $6,940.


Bitcoin’s RSI almost touched the oversold territory but quickly bounced above it.

Key levels to the upside                    Key levels to the downside

1: $7,260                                           1: $6,940

2: $7,415                                           2: $6,640

3: $7,525                                           3: $6,410


Ethereum

Ethereum also moved down a bit during the holidays. Its price is currently sitting at the $130 level. Whether the price goes above or below the $130 line, it will be met by a support or resistance trend line, which Ethereum was forming since Dec 29.


Ethereum’s RSI level is gradually going down over the days. Its volume is somewhat elevated, but still far from the levels that could indicate any form of a big move.

Key levels to the upside                    Key levels to the downside

1: $141.15                                           1: $130

2: $148.5                                            2: $128.1

3: $154.2                                            3: 122.15


Ripple

XRP is bound by the same support and resistance levels as before the New Year, as it didn’t break any in the meantime. However, it made a lower high compared to Dec 29/30, which could indicate a possible retest of the support level in the short-term.


XRP’s RSI level is slowly reducing while its volume is on levels lower than average.

Key levels to the upside                    Key levels to the downside

1: $0.198                                            1: $0.19

2: $0.2058                                          2: $0.178

3: $0.211                                            3: 0.1678

Categories
Cryptocurrencies

What Is Augur (REP)?

Ethereum’s blockchain has made it possible to build all sorts of exciting decentralized applications on its platform. Augur was one of the very first projects to take advantage of Ethereum’s smart contract and Solidity tools and create its unique protocol.

Unlike many of its contemporaries, Augur does not seek to improve upon any aspect associated with the crypto or blockchain technology like block sizes, scalability, transaction fees, or centralization. Rather, the project seeks to capitalize on blockchain technology to improve the traditional prediction markets model.

In this guide, we’ll look into this exciting project, how it works, whether it’s worth sinking your money into, and more.

What is Augur (REP)

Augur is a decentralized, peer-to-peer, and open-source prediction platform built on the Ethereum blockchain. When trading on Augur, you’re rewarded if you correctly predict the outcome of any future event – whether it’s an election, a football match, political events, policy decisions, a natural disaster, market crashes, weather events, and so on. The project’s website says “anything is fair game” – if you can’t find your preferred choice of a bet, you can create your own.

Augur leverages the “wisdom of the crowd” – the idea that a collective group of people is smarter than individual experts when it comes to problem-solving, general knowledge, predicting, etc. Those who predict the right outcomes win and those who don’t, lose. The more unlikely an event to occur, the bigger the reward for the accuracy of its prediction.

The platform has its own currency known as REP – “Reputation,” which people use to report on and dispute the outcome of events. Coin holders are rewarded for accurate predictions of events if they occur, while others can object if they don’t agree.

What Does Augur Aim to Achieve?

As a decentralized application on the Ethereum blockchain, Augur is censorship-resistant, is not owned by anyone, and thus cannot be shut down by anyone. Blockchain experts Jack Peterson and Joey Krug created the project in 2014 to ‘democratize’ the prediction markets.

With the creation of Augur, Peterson, Krug and the team had the following goals in mind:

  • To design a prediction market model operated and accessible by anyone
  • To enable people to make predictions with as little fees as possible
  • To achieve better accuracy of predictions compared to the traditional prediction model

How Does Augur Work?

Augur is more or less a decentralized take on traditional betting. The Augur protocol utilizes four processes in the prediction model, which we will expound below.

Creating Markets. Anyone can create a market of their choice on the platform. All you need is a small amount of ether and a hot betting topic. But first, you need to check the list of topics on the platform to avoid double coverage. You can come up with anything, from “Will Mark Zuckerberg Be Voted Out as CEO of Facebook in 2019?” to “Will France Take Home the World Cup in 2020?” to “Will Game of Thrones Return for a Sequel?” Users creating prediction markets usually set a ‘creator fee,’ which must be between 0 and 50%.

Trading. After a market is created, trading begins. Users can buy shares in the outcomes of the event, as well as receive rewards for participating and sharing their insights and opinions about the market. The price of the shares is calculated based on the likelihood of that event occurring. The more people buying into a particular event, the higher the price will be. Users also have the option to trade their shares with others or invest in unlikelier outcomes for better returns.

Reporting. This stage comes after a market closes – that is, a market’s underlying event takes place in the ‘real world.’ The potential result, known as ‘Outcome,’ is determined by profit-motivated ‘Reporters,’ who simply report the real-world outcome of the event. Any REP holder can be a reporter. Reporters who consistently provide accurate reports are financially rewarded, while those whose reports are not consistent with the actual outcomes are financially penalized. Note that users of the platform do not need to own or use REP, it’s only reporters who need it to participate in the reporting process.

Settlement. In this final stage, a trader can close their position by selling the position to another user in exchange for ether, or automatically settling their shares on Augur’s smart contracts. Predictions by users that turn out to be accurate are rewarded. Reporters whose reports were determined to be accurate are rewarded in reputation tokens, while reporters who did not respond or gave inaccurate information are penalized, with their share of tokens being given to reporters whose report was accurate.

REP Market Policy and Availability

As of December 12, 2019, REP’s market cap was $97, 856, 775, with a 24-hour trading volume of $7, 271, 550. At the token’s crowd sale in 2019, 8.8 million tokens were distributed to the public, with 2. 3 million tokens reserved for operational costs.

The REP token can be acquired on crypto exchanges such as Bittrex, Coinswitch, Poloniex, Coinbase, Kraken, etc.

Augur is an ERC 20 token, meaning you can store it in any wallet with ERC-20 support. Other options include hardware wallets such as Ledger Nano X, Ledger Nano S, Trezor, KeepKey, etc.

The Future of Augur, And Whether You Should Invest In It

Augur was one of the very first projects to launch on the Ethereum blockchain. It is also one of the Ethereum projects that made headlines upon its launch and continues to be consistent. Besides, the project has gotten the node of notable figures in the crypto and blockchain sphere.

Brian Armstrong, CEO of Coinbase, has described it as “an awesome project,” while Vitalik Buterin, Ethereum’s co-founder, noted its ingenuity when he called it “Uber for knowledge.”

We think that its uniqueness among other Ethereum tokens coupled with its solid reputation makes it a worthy investment. 

Conclusion

Augur has been on the scene for a while now – being one of the first to be built upon the Ethereum blockchain. It is a decentralized prediction market platform that’s available to anyone. With a small amount of ether, anyone can participate in event likelihood stock trading.

Categories
Cryptocurrencies

What is the ZRX Token?

Cryptocurrencies have stirred the financial space in a way that more and more people want to jump on this economic bandwagon. As the newest asset class, cryptos are overtaking other securities in an unprecedented fashion. But this is where we have a problem. For people to join the crypto revolution, they have to go through centralized exchanges. These exchanges, however, come with their own set of issues.

Enter decentralized exchanges (DEXs). DEXs, in which traders transact directly with each other, are fast becoming popular. 0x is one of the most high-profile of these types of exchanges, and it allows users to trade ERC 20 tokens via its native token, ZRX. In this guide, we’ll dive deeper into the 0x project, how it works, and the ZRX token and how to get your hands on it.

What is 0x?

0x is an open protocol designed to facilitate the peer-to-peer exchange of Ethereum tokens on the Ethereum blockchain. 0x was formed by industry experts Will Warren and Amir Bandeali in 2016.

The two envisioned a future where all kinds of securities, including stocks, precious metals, etc. could be traded as tokens publicly on the blockchain. 0x is created to be different from both centralized and decentralized exchanges and thereby provide the best combination of both their features.

It also seeks to solve problems that arise from both types of exchanges. Let’s begin with the issues facing centralized exchanges.

☑️ Susceptibility to Hacks

Centralized exchanges will always be prone to hacking attacks. Mt. Gox, Bitfinex and Binance are only some of the examples of centralized exchanges that have been hacked for Bitcoins worth millions of dollars. 

☑️ Subject to Mismanagement

Centralized exchanges are regulated by people who are fallible and prone to human error. The example of Mt.Gox is an exchange whose fate was caused by mismanagement.

☑️ Volume problems

Centralized exchanges often have trouble dealing with a sudden increase in demand. For instance, a sudden surge in demand for Bitcoin in November 2017 caused some exchanges to temporarily halt processing transactions while others experienced downtimes.

☑️ Subject to Regulatory Whims

Centralized crypto exchanges are registered in countries. This means they must play by the rules that the government of that country wishes to enact.

0x’s Technology and How It solves these, plus DEXes’ Problems

Decentralized exchanges rely on smart contracts for trading of ERC tokens. However, the sheer proliferation of tokens on Ethereum’s blockchain presents the problem of confusion and scalability. At the time of writing, there are more than 200,000 token contracts on the blockchain.

0x’s whitepaper notes: “End users are exposed to smart contracts of varying quality and security with unique configuration processes and learning curves, all of which implement the same functionality.”

This has caused several problems for the network, including increasing transaction costs for the network. This means for crypto exchanges, transactions would be charged a specified amount of ether. Also, as the volume of orders increases, the costs of operating it increases as well.

Second, the numerous exchanges have led to a fragmented user base and with it, fragmented liquidity for the DEXs crypto market. 

0x’s technology attempts to solve this by combining two technologies – State channels and Automated Market Maker. State channels take transactions off the blockchain, therefore reducing transaction fees. Automated Market Maker (AMMs) are algorithms that conduct trades between two parties, while also acting as the opposite party in transactions.

0x relies on “relayers” to host the off-chain order book and connect buyers and sellers.

Having seen how the platform aims to improve the DEX model, let’s look at how it addresses the main issues faced by centralized exchanges:

  • It provides a more secure platform as there is no single point of failure, thanks to the Ethereum blockchain which is open-source, pubic and distributed 
  • It eliminates the possibility of a rogue or malicious exchange running away with people’s crypto funds
  • It eliminates the whims of governments or regulators  
  • It makes crypto trading an affordable endeavor for all types of traders
  • It makes it effortless to swap tokens on the blockchain by removing the high transaction fees associated with centralized as well as smart contract decentralized exchanges. It intends to do this by taking transactions outside of the blockchain

What is ZRX?

0x has its own Ethereum token, known as ZRX. The token is used to pay relayers for their services. However, 0x’s main intention for the token is to facilitate decentralized governance over the 0x protocol upgrade system. This means anyone who owns ZRX gets to have input – proportional to their holdings, into any upgrades the protocol may get over time.

How to Buy ZRX

The ZRX token is available on the majority of crypto exchanges, including Coinbase, Binance, Bittrex, Shapeshift, Poloniex, Changelly, KuCoin, Huobi, Coinswitch, Bitit, and Idex.

Being an Ethereum token, ZRX can be stored in an Ethereum wallet. Other options include MyEtherWallet, Exodus, Eidoo, and Ledger wallet.

There is a fixed supply of one billion ZRX. During its launch, 50% of the tokens were released to the public, with the 0x project retaining 15%, 15% going to the developer fund, 10% to the founding team, and 10% to the project’s advisors and early supporters.

The Problems With 0x’s Approach

0X is an ambitious project and one that could be the solution to both centralized exchanges and DEXes problems. However, some crypto experts assert that the ZRX token has no clearly defined purpose.

Also, the staking approach – in which the more ZRX you hold the more you can contribute to the project’s development, means that it can be hijacked by investors with large holdings – which does not keep up with the spirit of decentralization. 

Also, some experts contend that the business model is not sustainable. By having its platform open and free, the project might be foregoing revenue from trades and setting itself up for failure in the future.

Conclusion

The 0x project has its flaws, but the protocol is a promising proposition. It solves the challenges presented by centralized exchanges while improving the decentralized exchange model. Its flexibility, versatility and its free availability may very well catapult it to be the future of cryptocurrency exchanges. It’s going to be interesting to see how this project pans out in the future.


Categories
Crypto Market Analysis

Daily Crypto Review, Dec 30 – Coinbase getting hit by Apple, Crypto market gains size over the weekend

The cryptocurrency market had a slightly green weekend. The price of most cryptos increased while compared to when we last reported the prices. If we talk about daily changes, Bitcoin’s price went down 0.93%. It is currently trading for $7,374. Meanwhile, Ethereum gained 4.13%, while XRP gained 1.12%.

BitTorrent gained 14.66% on the day, making it the biggest daily gainer. EDUCare lost 15.24% of its value when compared to yesterday, making it the biggest daily loser.

Bitcoin’s dominance decreased by almost half a percent over the weekend. Its dominance is now at 68.07%, which represents a decrease of 0.43% from when we last reported.

The cryptocurrency market capitalization increased by a significant amount over the weekend. It is currently valued at $197.35 billion. This value represents an increase of $6.2 billion when compared to the value it had on Friday.

What happened in the past 24 hours

After Google announced the removal of the Ethereum-based DApp browser MetaMask from its application store for Android devices, Apple may do the same with Coinbase’s DApp browser feature.

Coinbase warned its users that they might have to remove the DApp browser feature from its wallet application in order to comply with the App Store policy.

_______________________________________________________________________

Technical analysis

_______________________________________________________________________

Bitcoin

If we take a look at the chart price movement, we can conclude that Bitcoin had quite a good weekend. Its price broke the 38.2% Fib retracement level which acted as resistance and stayed above it. It also attempted to go up in price further and passed the $7,415 and line but got stopped out at the $7,525 level. After hitting a wall, Bitcoin’s price returned below $7,415 which now acts as its immediate resistance.


Even though Bitcoin has seen its price go down on the daily overview, it still made progress to the upside over the weekend.

Key levels to the upside                    Key levels to the downside

1: $7,415                                           1: $7,260

2: $7,525                                           2: $6,940

3: $7,780                                           3: $6,640


Ethereum

Ethereum performed far better over the weekend when compared to Bitcoin. It, too, had an upward-facing price movement, but it did not lose any of its gains. The price broke the immediate resistance level of $128.1, as well as the next resistance level of $130. Its price is now in between the $130 support line and the $141.15 resistance line.


Ethereum’s RSI level stepped into the overbought territory. Its volume is has dropped significantly, which may result in a price drop in the short term.

Key levels to the upside                    Key levels to the downside

1: $141.15                                           1: $130

2: $148.5                                            2: $128.1

3: $154.2                                            3: 122.15


Ripple

XRP also had a great weekend, along with Ethereum. Its price went up as the bulls rallied. However, only the $0.19 resistance was broken. However, that is not such a significant event as XRP just fell under the $0.19 line during the weekend as well. Its price is now consolidating between $0.19 and $0.198. There were a couple of attempts to break the $0.198 resistance, but all failed.


XRP’s RSI level just passed below the overbought territory and seemed to be staying right below it. Its volume is average and showing no signs of reducing at the moment.

Key levels to the upside                    Key levels to the downside

1: $0.198                                            1: $0.19

2: $0.2058                                          2: $0.178

3: $0.211                                            3: 0.1678

Categories
Crypto Market Analysis

Daily Crypto Review, Dec 27 – Russia’s central bank testing stablecoins

Bitcoin and the rest of the cryptocurrencies had quite a slow day. The price of most cryptos remained at the same place it was yesterday. Bitcoin’s price went up by 0.1% on the day. It is trading for $7,224 at the time of writing. Meanwhile, Ethereum gained 1.8%, while XRP gained 0.48%.

LUNA gained 32.04% on the day, making it the biggest daily gainer. The biggest loser of the day was the same as yesterday. Silverway lost 21.43% of its value when compared to yesterday.

Bitcoin’s dominance decreased by a tiny bit on the day. Its dominance is now at 68.5%, which represents a decrease of 0.2% from when we last reported.

The cryptocurrency market capitalization stayed at the same place it was at yesterday. It is currently sitting at $191.15 billion. This value represents a decrease of $0.17 billion when compared to the value it had 24 hours ago.

What happened in the past 24 hours

Russia’s central bank, the Bank of Russia, has reportedly started testing cryptocurrencies. The cryptocurrencies mentioned were stablecoins pegged to real assets. They are reportedly being tested in a regulatory sandbox.

Elvira Nabiullina, the head of Russia’s central bank, said that the bank does not assume the functionality of these stablecoins when it comes to them being means of payment or becoming a substitute for money.

_______________________________________________________________________

Technical analysis

_______________________________________________________________________

Bitcoin

Bitcoin spent the day without much action price-wise. Once its price fell under the 38.2% Fib retracement line of $7,260, there weren’t many attempts to break it. The past 24 hours went by with Bitcoin trying to break the resistance level once, but the push failed quickly after the bulls couldn’t break the $7,415 level. After failing to pass these levels, Bitcoin returned to its previous levels and remained there.


Bitcoin’s volume is higher than yesterday, especially during the price push. Its RSI quickly entered and left the overbought territory during the time of the push.

Key levels to the upside                    Key levels to the downside

1: $7,260                                           1: $6,940

2: $7415                                            2: $6,640

3: $7,525                                           3: $6,415


Ethereum

Ethereum followed Bitcoin in almost every possible way. Its price is still contained within the resistance level of $128.1 and the support level of $122.5. Just like Bitcoin, Ethereum attempted to move above its resistance line but quickly failed as the price could not reach past $130. The price is now consolidating at the level it was at before the push.


Ethereum’s RSI level stepped into the overbought territory but quickly left it. Its volume is exceptionally high during the spikes and rather average during consolidation.

Key levels to the upside                    Key levels to the downside

1: $128.1                                             1: $122.07

2: $130                                               2: $117

3: $141.15


Ripple

Unlike Ethereum and Bitcoin, XRP made some progress to the upside in the past 24 hours. Its price rose above $0.19 and returned to where it was before Christmas. It is now consolidating just above the $0.19 support level. XRP’s attempt to reach past this price failed quickly, just as with other top cryptocurrencies. After reaching $0.195, the price went down to the nearest support line.


XRP’s volume was extremely high during the price spike but is quickly fading away. Its RSI levels also stepped into the overbought territory for a brief moment but returned to the middle of the value range quickly.

Key levels to the upside                    Key levels to the downside

1: $0.198                                            1: $0.19

2: $0.2058                                          2: $0.178

3: $0.211                                            3: 0.1678

Categories
Crypto Market Analysis

Daily Crypto Review, Dec 26 – Youtube censoring crypto-related videos; content creators have spoken

Bitcoin, along with the rest of the cryptocurrencies, didn’t move much during Christmas. The price tanked a bit due to a lack of volume, but the price drops are sporadic and negligible. Bitcoin’s price went down by 0.59% on the day. It is trading for $7,247 at the time of writing. Meanwhile, Ethereum lost 0.7%, while XRP lost 0.4%.

Tomo Chain gained 21.44% on the day, making it the biggest daily gainer. The biggest loser of the day was Silverway, which lost 7.88% of its value when compared to yesterday.

Bitcoin’s dominance gained half a percent during Christmas time. Its dominance is now at 68.7%, which represents an increase of 0.5% from when we last reported.

The cryptocurrency market capitalization lost around four billion dollars during Christmas. It is currently sitting at $191.32 billion at the time of writing. This represents a decrease of $3.69 billion when compared to the value it had 24 hours ago.

What happened in the past 24 hours

YouTube, the biggest video-sharing social media platform, has unexpectedly started to delete cryptocurrency-related content from the platform. Both big and small content creators are affected.

Countless Twitter and Reddit threads popped up, all about YouTube suddenly deleting a number of crypto-related videos Dec. 23. On top of the video deletion, YouTube sent out an official warning to content creators in the form of a “strike.” When the account gets “struck” 3 times, it gets shut down.

YouTube has yet to respond on why it censored these videos.

_______________________________________________________________________

Technical analysis

_______________________________________________________________________

Bitcoin

Bitcoin spent Christmas losing some value, but the loss is almost insignificant. Its price did fall under the 38.2% Fib retracement line of $7,260. After falling under the support level which now turned resistance, Bitcoin seems to have consolidated near the top of the range.


Bitcoin’s volume was quite low, which can be explained by the holidays. Its RSI was quite stable and around the middle of the value range.

Key levels to the upside                    Key levels to the downside

1: $7,260                                           1: $6,940

2: $7415                                            2: $6,640

3: $7,525                                           3: $6,415


Ethereum

Ethereum also spent Christmas losing some of its value. The price is still contained within the resistance of $128.1 and support of $122.5. The price is now consolidating in the middle of the range.


Ethereum’s RSI level is currently on the rise, with the volume being on the lower end of the spectrum.

Key levels to the upside                    Key levels to the downside

1: $128.1                                             1: $122.07

2: $130                                               2: $117

3: $141.15


Ripple

XRP’s broke a key support during Christmas. Its price dropped below $0.19 and could not make it back above. It is now consolidating just below this level, which currently acts as resistance. XRP has quite a free fall if it decides to drop in price. The next support level is at $0.178.


XRP’s volume is, just like Ethereum’s and Bitcoin’s, pretty low. This is, again, most likely due to fewer traders being involved with the market during the holidays. The key level of $0.19 is now acting as resistance.

Key levels to the upside                    Key levels to the downside

1: $0.19                                              1: $0.178

2: $0.198                                            2: $0.1678

3: $0.2058

Categories
Crypto Market Analysis

Daily Crypto Review, Dec 24 – Chinese national digital currency will be “different” from Bitcoin and Stablecoins

Bitcoin, as well as the rest of the cryptocurrencies, lost some of their value in the past 24 hours. Bulls could not sustain the prices after the price spike, which resulted in consolidation below the most recent highs. Bitcoin’s price went down by 2.96% on the day. It is trading for $7,302 at the time of writing. Meanwhile, Ethereum lost 3.23%, while XRP lost 2.45%.

Bytecoin gained 42.47% on the day, making it the biggest daily gainer. The biggest loser of the day was Aeternity, which lost 9.00% of its value when compared to yesterday.

Bitcoin’s dominance finally stopped rising and took a healthy push to the opposite side. Its market dominance is currently 68.2%, which represents a decrease of 0.52% when compared to the value it had yesterday.

The cryptocurrency market capitalization lost some of its value when compared to yesterday. It is currently sitting at $195.01 billion at the time of writing. This represents a decrease of $4.92 billion when compared to the value it had 24 hours ago.

What happened in the past 24 hours

Whoever invests their time in learning about cryptocurrencies, knows that China is one of the biggest players in the game. What many people do not know, however, is that China is already designing its cryptocurrency.

The People’s Bank of China’s deputy director Mu Changchun announced that China will be introducing the world to a digital form of the yuan. However, the digital currency will be different to Bitcoin (BTC) and stablecoins. China’s digital currency will be made, so there is no room to speculate on its value. However, it will not be backed by a basket of currencies either.

Mu recently indicated that the digital Yuan would operate in a two-tier system. The top layer would be governed by the PBoC while the bottom layer would be reserved for commercial banks.

_______________________________________________________________________

Technical analysis

_______________________________________________________________________

Bitcoin

Bitcoin is trying to find a price at which it could consolidate safely. That price, it seems, is below the 38.2% Fib retracement line of $7,260. Bitcoin spent the past 24 hours dropping past the levels beat to the upside just a day ago. The price breezed through the $7,525 and $7,415 levels to the downside just as it did to the upside yesterday.


Bitcoin’s volume during the price drop was at almost the same level as it was during the price spike. However, the volume is now slowly reducing. RSI has left the overbought territory and is hurling towards the lower part of the value spectrum.

Key levels to the upside                    Key levels to the downside

1: $7,260                                           1: $6,940

2: $7415                                            2: $6,640

3: $7,525                                           3: $6,415


Ethereum

Ethereum also spent its day losing all of the gains it made yesterday. The price managed to reach past the $128.1 and $130 resistances yesterday, and even stay above it for some time now. However, the bull presence faded, and Ethereum lost all of its gains, returning its price to almost exactly the same spot as before the price spike.


Ethereum’s RSI level is currently in the lower part of the value register, with its volume dropping as the bear presence faded.

Key levels to the upside                    Key levels to the downside

1: $128.1                                             1: $122.5

2: $130                                               2: $117

3: $141.15


Ripple

XRP’s price did not move much to the upside yesterday, which resulted in not moving as much to the downside in the latest crypto price drop. The price drop was contained within a range, as it dropped from XRP’s immediate key resistance level of $0.198 to its key support level of $0.19. XRP’s price seems to have stabilized above $0.19 and there is no indication of it dropping down further unless the market as a whole loses much of its value due to some unexpected event.


Key levels to the upside                    Key levels to the downside

1: $0.198                                            1: $0.19

2: $0.2058                                          2: $0.178

3: $0.2121                                          3: 0.16

Categories
Crypto Market Analysis

Daily Crypto Review, Dec 23 -Cryptos having a Green Weekend

The cryptocurrency market has spent the weekend without much sudden movement. The vast majority of the cryptocurrencies, however, did end up in the green. Bitcoin’s price increased by 5.75% on the day. It is trading for $7,589 at the time of writing. Meanwhile, Ethereum gained 4.32%, while XRP gained 1.49%.

TRON managed to gain 9.12% on the day, making it the biggest daily gainer. Out of the cryptos that ended up in the red, the biggest loser was Matic Network, which lost 17.41% of its value when compared to yesterday.

Bitcoin’s dominance increased over the weekend. Its dominance in percentage is currently 68.72%, which represents an increase of 0.34% when compared to the value it had yesterday.

The cryptocurrency market capitalization gained quite a bit of value over the weekend. It is currently sitting at $199.93 billion at the time of writing.

What happened in the past 24 hours

Self-proclaimed Bitcoin (BTC) creator Craig Wright, who claimed many times that he is Satoshi Nakamoto, revealed that he has a document that explains the origins of the Satoshi Nakamoto pseudonym.

Wright showed this document during an interview he was the main guest of.  This document represents an article from the digital database of an academic journal’s JSTOR, which dates Jan 5, 2008. It shows how the pseudonym Satoshi Nakamoto was created.

Satoshi Nakamoto is known to be the creator of Bitcoin. He also mined the origin blocks on the Bitcoin blockchain which are called “Satoshi” blocks.

_______________________________________________________________________

Technical analysis

_______________________________________________________________________

Bitcoin

Bitcoin had a couple turbulent few weeks, dropping its price to as low as $6,415. However, this weekend was not so bad for Bitcoin. It spent the past 24 hours establishing bull presence and attempting to break a couple of resistance levels. The price breezed through the $7,260 and $7,415 levels and even passed the $7,525 level. It seems to be losing momentum and it is still unknown whether the $7,525 level will hold up as new-found support or not.


Key levels to the upside                    Key levels to the downside

1: $7,785                                           1: $7,525

2: $8,646                                           2: $7,415

3: $8,820                                           3: $7,260


Ethereum

Ethereum also spent its day trying to reach higher prices. The price managed to reach past the $128.1 and $130 resistances and stay above it for some time now. However, it is still uncertain of which of these levels will hold when the bull presence fades.


Ethereum’s RSI level is approaching the overbought territory quite fast as the bull presence seems to be fading slowly.

Key levels to the upside                    Key levels to the downside

1: $141.4                                             1: $130

2: $148.5                                            2: $128.1

3: $154.1                                            3: $117


Ripple

XRP’s “bull run” made the least impact of the top3 cryptocurrencies. Its price didn’t move up and break resistance levels as Bitcoin’s and Ethereum’s did. The bull move was quickly stopped at the 38.2% Fib resistance line of $0.198. However, the line of $0.19 broke during the weekend, and XRP has tested and established it as a resistance line.


Passing $0.198 to the upside seems like an impossible feat to XRP at the moment, with the current bull presence.

Key levels to the upside                    Key levels to the downside

1: $0.198                                            1: $0.19

2: $0.2058                                          2: $0.178

3: $0.2121                                          3: 0.16

Categories
Crypto Market Analysis

Daily Crypto Review, Dec 20 – South Korean Telecom launching a blockchain-based currency

The cryptocurrency market has spent the past 24 hours stabilizing from the past and current week’s volatility. The vast majority of the cryptocurrencies either gained or lost an insignificant percentage of their value. Bitcoin dropped in price by 0.39%. It is trading for $7,136 at the time of writing. Meanwhile, Ethereum lost 1.24%, while XRP lost 1.96%.

LUNA, on the other hand, managed to gain 19.73% on the day, making it the most prominent daily gainer. Out of the cryptos that ended up in the red, the biggest loser was Lisk, which lost 5.93% of its value when compared to yesterday.

Bitcoin’s dominance increased yet again, as other cryptocurrencies fell in price a tad bit more than it did. Its dominance in percentage is currently 68.38%, which represents an increase of 0.45% when compared to the value it had yesterday.

The cryptocurrency market capitalization rose slightly in the past 24 hours. Its total market value is currently $190.39 billion. This value represents a decrease of $3 billion when compared to the value it had yesterday.

What happened in the past 24 hours

South Korea’s biggest telecom company, KT, announced that it is launching a local blockchain-based currency in Busan. Busan is one of Korea’s largest cities.

Their currency, Dongbaekjeon, will be a blockchain-based card-type local currency. It will be issued by Busan City in an attempt to revitalize Busan’s local economy as well as ease the management burden of small business.

_______________________________________________________________________

Technical analysis

_______________________________________________________________________

Bitcoin

Bitcoin had a couple turbulent few weeks. The past 24 hours were spent in consolidating and establishing price security. The price oscilated in a range, bound by the 38.2% Fib resistance line of $7,260 and the 23.6% Fib retracement line which acted as support, sitting at $6,940.


Bitcoin’s volume has decreased when compared to yesterday, which is only natural in periods of consolidation. It’s RSI level is slowly falling from the near-overbought values.

Key levels to the upside                    Key levels to the downside

1: $7,260                                           1: $6,940

2: $7,415                                           2: $6,410

3: $7,525


Ethereum

Ethereum also spent its day trying to consolidate. The price fluctuated above and below the $128.1 line but finally decided to stay below it. Even though it is currently trading within a range and bound by strong support and resistance lines, Ethereum has quite a bit more space down until it hits the support line of $120.35.


Ethereum’s volume has decreased significantly when compared to yesterday, even more so than Bitcoin’s volume.

Key levels to the upside                    Key levels to the downside

1: $120.35                                            1: $117

2: $128.1

3: $130


Ripple

XRP followed the path of Bitcoin and Ethereum and took its time to consolidate as well. However, its price did attempt to pass above the resistance of $0.19. The attempt has failed, and its price slowly moved down. XRP established strong support at the $0.176 level, as well as resistance, which got re-confirmed at $0.19.


XRP’s volume went down when compared to yesterday due to consolidating, while its RSI level is currently very near oversold territory.

Key levels to the upside                    Key levels to the downside

1: $0.19                                              1: $0.176

2: $0.198                                            2: $0.16

3: $0.2045

Categories
Crypto Market Analysis

Daily Crypto Review, Dec 19 – Bitcoin above $7,000 while the market is in the green

Bulls have retaken the crypto market after quite a few red days. Most cryptocurrencies gained some value on the day, with some growing in value exponentially. Bitcoin gained 6.37%, and it is trading for $7060 at the time of writing. Meanwhile, Ethereum increased its price by 1.88%, while XRP gained 1.65%.

Aidos Kuneen, on the other hand, gained 50.04% on the day, making it the biggest daily gainer. Out of the cryptos that ended up in the red, the biggest loser was Centrality, which lost 4.71% of its value on the day.

Bitcoin’s dominance increased yet again in the past 24 hours, as cryptocurrencies (on average) gained less value than it did. Its dominance in percentage is currently 67.95%, which represents an increase of 0.36% when compared to the value it had yesterday.

The cryptocurrency market capitalization rose in the past 24 hours as the individual cryptocurrencies gained. Its total market value is currently $187.39 billion. This value represents a decrease of $7.39 when compared to the value it had yesterday.

What happened in the past 24 hours

Recent statistics show that 14.4% of Americans own at least some cryptocurrency. The cryptocurrency accounting firm Lukka announced its “do-it-yourself” cryptocurrency tax preparation software that is suited for retail investors. The product will come live just in time for the 2019 tax season.

Lukka’s main focus was providing institutional-grade solutions to crypto funds in the past. However, the company decided to expand to the retail investor market.

_______________________________________________________________________

Technical analysis

_______________________________________________________________________

Bitcoin

After almost a week of its price continously falling, Bitcoin finally had a decent green day. In fact, the past 24 hours were amazing for Bitcoin price-wise. Its price went from $6,400 all the way to $7,500 before settling at around $7,050 for now. Many analysts show that Bitcoin is now bullish in the short-term.


Bitcoin’s volume has currently increased, while its RSI was dangerously approaching overbought territory. However, that quickly ended, and its RSI is now approaching the middle of the value range.

Key levels to the upside                    Key levels to the downside

1: $7,260                                           1: $6,940

2: $7,415                                           2: $6,410

3: $7,525


Ethereum

Ethereum has had a great day as well, though not as good in terms of the price increase as Bitcoin. Ethereum spent the past couple of days repeating the same price pattern over and over. Its price dropped severely during a short period, following by it trying to consolidate just above its lows for the day. Similar to yesterday and the day before, Ethereum started losing value extremely quickly.  However, the $117 line held up quite well, and Ethereum bounced off of it to $135. However, Ethereum’s direction is still unknown as the price fell back down to $128 at the time of writing.


If Ethereum falls under $117, new support levels will have to form naturally as Ethereum does not have any “prepared” ones yet.

Key levels to the upside                    Key levels to the downside

1: $120.35                                            1: $117

2: $128.1

3: $130


Ripple

XRP did not have a bad day, either. Its price gained some value today, too, while the gains were quite marginal compared to Bitcoin’s gains. XRP’s price found support in the $0.176 level, which propelled it to $0.2. However, that was just a short-term gain as XRP started going down almost as quickly as it went up. With the current price of $0.1865, XRP has not broken any resistance lines since the price started rising.


Unlike Bitcoin, which had its RSI almost reach overbought levels during the price spike, XRP has its RSI still walking on the edge of being oversold.

Key levels to the upside                    Key levels to the downside

1: $0.19                                              1: $0.176

2: $0.198                                            2: $0.16

3: $0.2045

Categories
Crypto Market Analysis

Daily Crypto Review, Dec 18 – Bears hitting the Crypto Market yet Again

Bears seem to have taken over the crypto market yet again this week. Cryptocurrencies keep falling further and further down each day. Bitcoin held up better than most of them, while the majority of the market lost over 5% on the day. Bitcoin fell by 3.49% in the past 24 hours, and it is trading for $6.652 at the time of writing. Meanwhile, Ethereum dropped by 7.26%, while XRP fell 6.92%.

Silverway, on the other hand, was the crypto that gained some value today. Its price increased by 21.96%, making it the biggest daily gainer. Out of the cryptos that ended up in the red, the biggest loser was Kyber Network, which lost 18.61% of its value on the day.

Bitcoin’s dominance increased yet again in the past 24 hours, as cryptocurrencies lost far more value than it did. This time, however, the increase was marginal. Its dominance in percentage is currently 67.58%, which represents an increase of 0.35% when compared to the value it had yesterday.

The cryptocurrency market capitalization lost quite a bit of value yet again. Its total market value is currently $180 billion. This value represents a decrease of $6.45 when compared to the value it had yesterday.

What happened in the past 24 hours

Cryptocurrency regulation is coming to Europe as well. The Fifth Anti-Money Laundering Directive (or 5AMLD for short) is a piece of legislation that intends to bring regulation to fiat-to-crypto exchanges as well as custodial wallets that operate in the European Union. All exchanges must comply with the legislative rules by January 10, 2020.

David Carlisle, the former US Treasury Anti-Money Laundering (AML) specialist, acknowledged that regulation might hurt crypto companies in the short term. However, he thinks that, in the medium and long term, regulation will enable and improve adoption and success for the companies who choose to embrace it.

On the other hand, Russian legislators are still struggling to define the legal status of cryptocurrencies. That has been the case since at least 2017, which is when the first bill was getting drafted. There has been no regulatory action announced by the Russian government so far.

_______________________________________________________________________

Technical analysis

_______________________________________________________________________

Bitcoin

Another red day for Bitcoin , another broken support level . Bears have taken over the market for now and the price has definitely shown that. Bitcoin broke the $6,640 key support level which put it in a very vulnerable spot. Its price is now hovering right below this level, trying to return and stabilize above it.


Bitcoin’s volume is incredibly high when compared to its average last week’s daily volume. Its RSI is in the oversold territory for quite some time now, but it seems like it will manage to reach non-oversold values soon.

Key levels to the upside                    Key levels to the downside

1: $6,640                                           1: $6,505

2: $7,000                                           2: $5,940

3: $7,314


Ethereum

Ethereum is repeating the price pattern it had yesterday, almost to a tee. Its price dropped severely and, then, tried to consolidate just above its lows for the day. Similar to yesterday, Ethereum lost close to 8% of its value.  The current price of ETH/USD is currently $123, which is quite problematic as the cryptocurrency broke all of its current support levels. It will have to find some significant support as soon as possible, or its price will dwindle down.


Ethereum’s volume extremely high at the moment, while its RSI value is deep in the oversold territory.

Key levels to the upside                    Key levels to the downside

1: $128.1                                             1: $120.35

2: $130                                              2: $117

3: $133.5


Ripple

XRP did not lose as much price-wise as yesterday, but it is still lost quite a bit (over 6%). Its price drop continues as it broke all of the known key support levels. It is still unknown where XRP might find its support levels, as the $0.19 level was broken as well.


XRP’s volume skyrocketed in the past 24 hours as bears “played” with its price. As with Bitcoin and Ethereum, its RSI values are deep in the oversold territory.

Key levels to the upside                    Key levels to the downside

1: $0.19                                              1: $0.1785

2: $0.2025                                          2: $0.1634

3: $0.207

Categories
Crypto Market Analysis

Daily Crypto Review, Dec 17 – Bitcoin below $7,000, investors buying the dip

Bitcoin, as well as the majority of the cryptocurrency market, had a significant price drop in the past 24 hours. The psychological resistance of $7,000 has been broken to the downside. Most cryptos stabilized for now, but no one knows where this price action will lead us. Bitcoin fell by 2.87% in the past 24 hours, and it is trading for $6.881 at the time of writing. Meanwhile, Ethereum lost a staggering 8.13%, while XRP fell 9.01%.

There were, however, cryptocurrencies that gained some value in the past 24 hours. The cryptocurrency that gained the most was Waves, which increased in price by 23.97%. On the other hand, the biggest loser of the day was EDUCare, which lost 16.92% of its value on the day.

Bitcoin’s dominance skyrocketed in the past 24 hours, as cryptocurrencies lost far more value than it did. Its dominance in percentage is currently 67.23%, which represents an increase of 1.14% when compared to the value it had yesterday.

The cryptocurrency market capitalization plunged due to the price drop of almost every single large cryptocurrency. Its total market value is currently $186.45 billion. This value represents a decrease of $7.09 when compared to the value it had yesterday.

What happened in the past 24 hours

The price drop that occurred was not a surprise for most people, though many expected it to be a bit less sudden and explosive. However, not everything is terrible.

Traders and long-term investors are buying into this dip, which suggests that they view the price drop as an opportunity to open their long positions or accumulate more Bitcoin.

Further proof of this can be found in the seemingly unaffected level of Bitfinex BTC/USD longs. The number of long positions that opened skyrocketed after the drop has happened, and it is still on the increase. On top of that, the significant rise in long positions started near the end of November.


_______________________________________________________________________

Technical analysis

_______________________________________________________________________

Bitcoin

Bitcoin broke yet another key support as its price plunged below $7,000. The price is currrently trying to stabilize at around $6,850. It’s currently bound by the $7,000 line which now turned resistence, as well as the $6,640 support line.


Bitcoin’s volume soared during the price drop but quickly dwindled to its regular levels. RSI finally went into the oversold territory after hovering around it for many days. The key level of $7,000 moves to the “upside” key levels.

Key levels to the upside                    Key levels to the downside

1: $7,000                                           1: $6,640

2: $7,314                                           2: $6,505

3: $7,415


Ethereum

Ethereum also had a major price drop. However, this one was far bigger than the one Bitcoin had. Ethereum fell under another key support line. The pressure on the downside was so strong that the price fell over 8% in just 24 hours. However, it quickly found support after dropping below the key level. It is now stabilizing just above $130.


Ethereum’s volume is slightly below average when compared to the past couple of days if we take away the significant volume spike that occurred during the price drop. Its RSI value is deep into the oversold territory.

Key levels to the upside                    Key levels to the downside

1: $133.5                                             1: $130

2: $144.1                                           2: $128.1

3: $150.5


Ripple

The biggest loser out of the top3 cryptocurrencies by market cap was XRP. Not only it lost most of its value (over 9% on the day), but it also broke all of the known key support levels. Its price movement to the downside, as well as the support levels it may form, are an enigma for now. There certainly have been some levels that had some traction, but these possible support levels are from over two years ago, and it is still unknown if they are valid. All we know is that, for now, XRP stabilized and created an immediate support level at $0.19.


Key levels to the upside                    Key levels to the downside

1: $0.2025                                          1: $0.19

2: $0.207

3: $0.2117

Categories
Crypto Market Analysis

Daily Crypto Review, Dec 16 – China’s courts adopting blockchain, people prepare for the possibility of the next bear market

The cryptocurrency market had another lousy weekend price-wise. Most cryptocurrencies spent the weekend being in the red. However, though many people call for another bear market, it might be too soon to tell. Bitcoin decreased in price by 0.21% in the past 24 hours. Its price is currently $7,054. Meanwhile, Ethereum lost 0.52%, while XRP fell 1.47%.

The cryptocurrency that gained the most was Aurora, with daily gains of 50.82%. On the other hand, the crypto dropping in price the most is EDUCare, which lost 17.07% of its value on the day.

Bitcoin’s dominance fell during the weekend. Its dominance in percentage is currently 66.09%, which represents a decrease of 0.31% when compared to the value it had on Friday.

The cryptocurrency market capitalization decreased over the weekend as cryptocurrencies dropped in price. Its total value is currently $193.54 billion. This value represents a decrease of $2.74 when compared to the value it had on Friday.

What happened in the past 24 hours

China’s courts are continually applying more and more innovative technologies to improve effectiveness. This includes implementing blockchain and artificial intelligence technologies to decide on millions of legal cases.

China’s official Xinhua news agency reported that over 3.1 million Chinese court activities that happened from March to October of 2019 were settled by using the blockchain and AI-powered smart internet courts.

_______________________________________________________________________

Technical analysis

_______________________________________________________________________

Bitcoin

Bitcoin did not have an especially fruitful weekend. If we take a look at the price chart, we can see two big red candles that occured on Dec 14. Even its price dropped slightly, Bitcoin did not break any key support levels. Its price is still trading between the 38.2% Fib retracement of $7,314 and 23.6% Fib retracement of $7,000, as it did on Friday.


Bitcoin’s volume tends to decrease over time until a volume spike, which propels the price up or down occurs. This is the case today as well, as Bitcoin’s volume is on lower levels than during the past week.

Key levels to the upside                    Key levels to the downside

1: $7,314                                           1: $7,000

2: $7,415                                           2: $6,640

3: $7,565                                           3: $6,505


Ethereum

Unlike Bitcoin, Ethereum did not manage to stay above its key support level. The price rose above the key level of $144.1 and stayed there for about 48 hours. However, Dec 14th brought a price drop for Ethereum as well, which brought its price below this key level. Retesting this level as resistance was successful, and the price remained below it.


Ethereum’s volume is lower than what it was during the past week, while its RSI value is in the bottom half of the register. The $144.1 key level returns to the “upside” key levels.

Key levels to the upside                    Key levels to the downside

1: $144.1                                             1: $133.5

2: $150.5                                            2: $128.9

3: $155.8


Ripple

Even though the whole crypto market had a bad weekend, XRP got hit the hardest. Its price fell and broke, not one but two support key levels. The Fib retracement 50% and 61.8% lines were broken as XRP descends. However, it is still unsure whether XRP’s price will end up above or below the 61.8% Fib retracement line because its RSI level is very near to being in the oversold territory with volume levels on the lower side.


Key levels to the upside                    Key levels to the downside

1: $0.2145                                          1: $0.2094

2: $0.2182                                          2: $0.2025

3: $0.222

Categories
Crypto Videos

The Best Cryptocurrencies To GPU Mine In 2020 – Part 2

Best Cryptocurrencies to GPU mine in 2020 – part 2


Part 2 of the series will continue with listing cryptocurrencies worth mining with your GPU in 2020. Once again, the cryptocurrencies listed in the guide are a personal choice, and you will have to do your research and choose your favorite cryptocurrencies to mine.

Monero (XMR)


Monero is one of the most unusual cryptocurrencies as it pioneered the era of privacy and private money itself when it comes to the crypto industry. Monero is an open-source private cryptocurrency that is aimed towards people who want to transact funds and messages privately. The ability to be completely private gives Monero a serious use case, as well as a probable long life in the world of crypto. On top of that, Monero recently got included by many wallets. Value miners, which mine cryptocurrencies solely based on their use case and future potential (rather than current profitability), are certainly considering XMR as their cryptocurrency of choice.
Monero is based on the CryptoNightV8 proof of work algorithm. It generates 3.38 XMRs per block, which occurs every 2 minutes.
Recommended GPUs for XMR mining are NVIDIA cards as well as AMD cards.

Ubiq (UBQ)


Ubiq is a decentralized platform that is used for hosting smart contracts and DApps, just like Ethereum. It is another fork of the Ethereum network itself. However, Ubiq markets itself as stable as well as a bug-free version of Ethereum. Ubiq’s main advantage is its ease of use. It can be complicated for developers to build their projects on a dynamic platform such as Ethereum, as it is continuously evolving.
Ubiq has tweaked its proof of work algorithm from Ethash to Ubqhash. It is also mineable using GPUs, but it has a few differences from its original algorithm. Its block time is 1.25 minutes, while its block reward is 7 UBQ per block. One thing to note is that Ubiq’s profitability is less than the profitability of ETH & ETC.
Recommended GPUs for UBQ mining are NVIDIA and AMD graphics cards.

Bitcoin Diamond (BCD)


Bitcoin Diamond yet another Bitcoin hard fork. It came to life in November of 2017 with the intent to overcome the so-called shortcomings of Bitcoin. The shortcomings addressed by BCD were Bitcoin’s lack of privacy and its slow transaction confirmation, amongst other things. BCD has increased its total supply from 21 million to 210 million, which in turn increased its block reward ten times than that of BTC. Bitcoin Diamond mining has a block reward of 125 BCD, released approximately every 8 minutes.
NVIDIA, as well as AMD cards, are recommended GPUs for BCD mining.

Aion (AION)


The Aion Network is a blockchain project that addresses problems that DApps of today face. These problems include scalability, privacy, as well as interoperability. AION uses a proof of work algorithm called Equihash, which is well-suitable for GPU mining. This cryptocurrency has the lowest block timing of all the cryptos mentioned here. Its block timing is a staggering 10 seconds. The Equihash algorithm releases 1.5 AION as its block reward each block. This block speed allows miners to expect their rewards much faster, which is useful in some cases.
AION is also quite a popular choice amongst miners who mine cryptocurrencies that they expect will increase in value in the future.
NVIDIA and AMD graphics cards are recommended GPUs for AION mining.

Energi (NRG)

Energi is, without a doubt, one of the most profitable cryptocurrencies minable with GPU. While this one is not the most popular choice for value-driven miners, it is for the miners guided by current profitability. If you don’t care about the use case of the cryptocurrency and are optimizing rigs to mine the most profitable currencies at this very moment, Energi is one of the best, if not the best choice for you.
Energi miners can expect 2.28 NRG approximately every 1 minute.
As with every cryptocurrency so far, recommended GPUs for NRG mining are NVIDIA and AMD.

Conclusion

This was the part 2/3 of the “Best cryptocurrencies to mine in 2020” series. Mine with caution and always take into consideration both the future value of a cryptocurrency as well as its current profitability.

Categories
Crypto Market Analysis

Daily Crypto Review, Dec 12 – Bitcoin mining owned by China, Market in the Red for the 3rd Consecutive Day

The cryptocurrency market’s price dropped yet again today, making this the third consecutive red day ina row. Most cryptocurrencies were in the red, with average 24-hour price drops of 1-3%. Bitcoin’s dropped 1.39% of its value in the past 24 hours. Its price is currently $7,143. Meanwhile, Ethereum dropped by 3.85%, while XRP fell 1.5%.

The cryptocurrency that saw most gains in the past 24 hours was Waves, with gains of 16.89%. On the other hand, the crypto that lost the most was the Matic Network, which lost 12.39% of its value.

Bitcoin’s dominance increased slightly, as its price went down just marginally less than the market. Its dominance is currently 66.52%, which represents an increase of 0.22% from yesterday’s value.

The cryptocurrency market’s market cap continues its downtrend for the third consecutive day. Its total value is $194.82 billion at the time of writing. This represents a decrease of $2.93 to yesterday’s value.

What happened in the past 24 hours

Chinese Bitcoin miners were always a force to reckon with. They are currently responsible for controlling around two-thirds of the global hash rate. China’s Sichuan province alone accounts for over 50% of the global hash rate.

Bitmain as well as Canaan Creative are the top mining chip suppliers in China. Bitmain appears to be on track to monopolize China’s crypto mining market as a whole. Many reports claim Bitmain to be the hardware supplier for 75% of the world market.

_______________________________________________________________________

Technical analysis

_______________________________________________________________________

Bitcoin

Bitcoin has lost some of its value in the past 24 hours yet again. Unlike yesterday, there were no key level breakings. Its price is currently trading between the 38.2% Fib retracement of $7,314 and 23.6% Fib retracement of $7,000. Bitcoin’s volatility peaked when its price went from $7,300 to $7,070 and then back to normal, all in one 4-hour candle.


Bitcoin’s volume is currently average, while its RSI value is just barely keeping itself out of the oversold territory.

Key levels to the upside                    Key levels to the downside

1: $7,314                                           1: $7,000

2: $7,415                                           2: $6,640

3: $7,565                                           3: $6,505


Ethereum

We compared Ethereum and Bitcoin yesterday and discovered that even though the price drops matched, Ethereum did better as it didn’t break any support levels. The situation has turned around, and Ethereum is now the one that broke the key support, while Bitcoin traded in a range. After following the downtrend, Ethereum went under the $144.1 support level without much fight. After falling below it, it tried to come back but failed.


Ethereum’s volume is at a reasonably healthy level compared to the previous days. Its RSI almost hit the oversold territory but is currently on the upswing.

Key levels to the upside                    Key levels to the downside

1: $144.1                                             1: $133.5

2: $150.5                                            2: $128.9

3: $155.8


Ripple

XRP was following the market today, which means that its price also went down. It is currently trading between the 38.2% Fib line of $0.222 and 50% Fib retracement line of 0.2182. XRP had a hard time staying above the $0.222 key level for a couple of days now. That battle was now lost, with this level becoming resistance as XRP fell under.


XRP’s volume is average when compared to the daily volume throughout the week. Its RSI value is currently around 36.5 and is trending towards oversold.

Key levels to the upside                    Key levels to the downside

1: $0.222                                            1: $0.2182

2: $0.2267                                          2: $0.2145

3: $0.234                                            3: $0.2092

Categories
Crypto Market Analysis

Daily Crypto Review, Dec 11 – NIKE patents blockchain-based system for their business, crypto markets in the slight red

The crypto market is consolidating and trying to find a price to stabilize. Most cryptocurrencies did end up in the red. However, the losses were quite negligible. If we look at the past 24 hours, Bitcoin’s fell by 0.84%. Its price is $7,238 at the moment of writing. Meanwhile, Ethereum lost 0.7%, while XRP fell 0.09%.

The biggest daily crypto gainer for the largest market cap cryptos is MINDOL, with gains of 67.83%. On the other hand, the biggest daily crypto loser is EDUCare, which lost 9.55% of its value.

Bitcoin’s dominance fell slightly in the past 24 hours. Its dominance sits at 66.3% at the time of writing. This value represents a decrease of 0.26% from yesterday’s value.

The cryptocurrency market’s market cap fell slightly in the past 24 hours. Its total value is currently $197.75 billion. This represents a decrease of $1.71 billion when compared to yesterday’s value.

What happened in the past 24 hours

Another good indicator of blockchain’s popularity is the number of companies trying to utilize it’s potential. Nike recently became one of these companies as they patented shoes that are tokenized as a non-fungible token. This tokenization will work on the Ethereum blockchain.

The patent thoroughly describes a digital asset for footwear as well as ways to use it. The document explained how Ethereum’s ERC721 or ERC1155 tokens are used to authenticate and transact a physical shoe.

_______________________________________________________________________

Technical analysis

_______________________________________________________________________

Bitcoin

Bitcoin had another small price drop in the past 24 hours. Even though the drop seems negligable, its price actually fell under another support line. The price was consolidating between the $7,415 resistance and $7,314 Fib retracement line yesterday. However, the $7,314 line got broken and turned resistance. Bitcoin’s next support level would be $7,000.


Bitcoin’s volume was on an upswing during the price drop but normalized quite fast at lower levels. Its RSI value fell and is now very close to the oversold levels.

Key levels to the upside                    Key levels to the downside

1: $7,314                                           1: $7,000

2: $7,415                                           2: $6,640

3: $7,565                                           3: $6,505


Ethereum

Ethereum had almost the same red candle that moved the market down slightly as Bitcoin. However, its price recovered a bit better, and Ethereum created a few small green candles.

On top of that, the second-largest cryptocurrency by market cap didn’t break any support levels. Its price now trades between the $150.5 key resistance and $144.1 critical support level. After the price drop, the support level got tested and held up quite well.


Ethereum’s volume is at a reasonably normal level compared to the previous days. Its RSI almost hit the oversold territory but is currently on the upswing.

Key levels to the upside                    Key levels to the downside

1: $150.5                                             1: $144.1

2: $155.8                                            2: $133.5

3: $161.1                                            3: $128.9


Ripple

XRP’s chart is looking like it’s having an identity crisis, as bulls and bears are constantly fighting. As stated before, it’s underwhelming to say that XRP just broke its uptrend. Rather, the price drop looks like a downtrend. Still, there is good news for XRP after all. After its price dropped below $0.222, which was the next key support and the 38.2% Fib retracement line, bulls rallied and brought the price above it. That way, the $0.222 level still acts as an immediate support level.


XRP’s volume is currently extremely low, while it’s RSI value is closer to the bottom half of the range. No key levels changed as XRP didn’t break any of them.

Key levels to the upside                    Key levels to the downside

1: $0.2267                                          1: $0.222

2: $0.234                                            2: $0.2182

3: $0.2351                                          3: $0.2145

Categories
Crypto Market Analysis

Daily Crypto Review, Dec 10 – JP Morgan launching its blockchain network in 2020

The crypto market has its first red day after a green weekend. Most cryptocurrencies ended up in the red. If we look at the past 24 hours, Bitcoin’s price decreased by 1.76%. It is now trading for $7,353. Meanwhile, Ethereum lost 0.43%, while XRP fell 2%.

The biggest top100 crypto gainer for today is Chainlink, with gains of 10.85%. On the other hand, the cryptocurrency that lost the most today was Matic Network, which lost 50.4% of its value.

Bitcoin’s dominance stayed at the almost exact place when compared to where it was yesterday. Its dominance is currently 66.56%, which represents an increase of 0.03% from yesterday’s value.

The cryptocurrency market’s market capitalization dropped in the past 24 hours. The market cap is currently at roughly $199.46 billion. This value represents an increase of $4.7 billion against the value it had on yesterday.

What happened in the past 24 hours

JPMorgan announced the launch of its blockchain-based payment network for the Japanese market in early 2020. The payment network is based on JPMorgan’s in-house blockchain platform, Quorum. The Interbank Information Network (IIN) wants to improve payment transactions as well as data sharing between banks.

Bloomberg’s report says that over 80 Japanese banks have a serious intent to join the platform. Out of the 365 total members that announced to join the platform, over 20% are Japanese banks.

_______________________________________________________________________

Technical analysis

_______________________________________________________________________

Bitcoin

After a great weekend, Bitcoin came back to almost the exact same spot it was in before it. The biggest cryptocurrency managed to lost its gains and fall under the $7,415 resistance, which is now turned support. The price is now consolidating between the $7,415 resistance and $7,314 Fib retracement line which is now acting as support. The immediate support line got tested twice, but held up both times.


Bitcoin’s volume spiked during the price drop but is now normalizing at lower levels. Its RSI levels fell down from being close-to overbought and normalized as well.

Key levels to the upside                    Key levels to the downside

1: $7,415                                           1: $7,314

2: $7,565                                           2: $7,240

3: $7,828                                           3: $7,120


Ethereum

Ethereum followed Bitcoin once again, which became almost a daily occurrence whenever big moves happen. Ethereum bulls stepped in and brought the price above the resistance of $150.5 over the weekend. After that happened, Ethereum immediately had a small level retesting, but the real test was ahead (as we reported yesterday). As the bears gathered and pulled the price down, the $150.5 resistance did not hold up, and Ethereum went under it.


Ethereum’s volume is currently really low relative to the previous days. Its RSI is in the middle of the value range.

Key levels to the upside                    Key levels to the downside

1: $150.5                                             1: $144.1

2: $155.8                                            2: $133.5

3: $161.1                                            3: $128.9


Ripple

It’s underwhelming to say that XRP broke its uptrend. After a whole week of a steady increase in price, it dropped significantly and lost around 40% of its gains from the whole uptrend move. After a sudden burst towards the upside on Dec 8, the price reached $0.234 but quickly started falling due to bulls not having enough buying pressure. The downward-facing move continued, and XRP’s price dropped from $0.234 all the way down to $0.222. However, this key level held up, and the price stabilized, at least for the time being.


There was no volume increase when this price-drop happened, which is quite interesting. XRP’s RSI value also returned to the bottom half of the range.

Key levels to the upside                    Key levels to the downside

1: $0.2267                                          1: $0.222

2: $0.234                                            2: $0.2182

3: $0.2351                                          3: $0.2145

Categories
Crypto Market Analysis

Daily Crypto Review, Dec 9 – Microsoft announcing its blockchain business expansion, Cryptocurrency markets in the green over the weekend

The crypto market has had quite a solid weekend. Most cryptocurrencies ended up in the green both in the past 24 hours as well as over the weekend. If we look at the past 24 hours, Bitcoin’s price went up 0.82% and is now trading at the price of $7,534. Meanwhile, Ethereum gained 0.45%, while XRP went up 1.72%.

The biggest gainer from the top100 cryptocurrencies by market cap for today is Energi, with gains of 23.15% on the day. The biggest loser of the day was EDUCare, which lost 8.15% of its value.

Bitcoin’s dominance stayed at the same value when compared to where it was at on Friday. Its dominance is currently 66.53%, which represents an increase of 0.09% from Friday’s value.

The cryptocurrency market increased its total market capitalization over the weekend. The market cap is currently sitting at $204.19 billion. This value represents an increase of $3.11 billion against the value it had on Friday.

What happened in the past 24 hours

Microsoft Azure, Microsoft’s blockchain-based cloud service, posted an announcement of their new tokenization and blockchain data management services.

This news were posted on the official Microsoft Azure. Microsoft Azure also announced their non-fungible blockchain tokens called “Azure Heroes”, which are aimed at rewarding its developer community.

_______________________________________________________________________

Technical analysis

_______________________________________________________________________

Bitcoin

Bitcoin has had an amazing weekend if we look at it from a price perspective. The biggest cryptocurrency managed to rally its bulls and break its $7,415 resistance to the upside. The price got retested on Sunday, but the now-turned resistance level held up and managed to keep Bitcoin’s price above.


Bitcoin is currently decreasing in volume, with its RSI levels dangerously close to the overbought territory. However, the short-term outlook is still slightly bullish.

Key levels to the upside                    Key levels to the downside

1: $7,565                                           1: $7,415

2: $7,828                                           2: $7,240

3: $8,000                                           3: $7,120


Ethereum

Ethereum has followed Bitcoin’s bull rally and gained value yet again. After a long struggle and indecisiveness of whether ETH will go up above $150.5 or below $144, bulls stepped in and brought the price above the resistance. Ethereum had a small level retesting, which the resistance held up. However, the real test of the newly formed resistance might be ahead.


Ethereum is, just like Bitcoin, slowly dropping in volume while its RSI is approaching overbought levels.

Key levels to the upside                    Key levels to the downside

1: $155.8                                             1: $150.5

2: $161.1                                            2: $144.1

3: $163.4                                            3: $133.5


Ripple

XRP is on a short-term bull run. It was the best performing cryptocurrency out of the top 3 cryptos for a solid week. XRP had a great weekend as well, managing to pass several resistance levels. After passing above the $0.222 level, its price continued upwards and passed the $0.2267 level as well. It even attempted to get above the $0.234 price level, but this is where it got stopped. Its price is currently on a small downturn, which may indicate a retest of $0.2267 level to determine its strength as a resistance level.


XRP’s volume is much higher when compared to its value before the weekend. It is, however, dropping just like the rest of the top3 cryptocurrencies. Its RSI almost touched the overbought territory, but bounced back and is now in a small downtrend.

Key levels to the upside                    Key levels to the downside

1: $0.234                                            1: $0.2267

2: $0.2351                                          2: $0.222

3: $0.242                                            3: $0.2185

Categories
Crypto Market Analysis

Daily Crypto Review, Dec 6 – Cryptocurrencies will replace FIAT by 2030

We can see that the crypto market did not have many currencies move significantly in the past 24 hours. However, most of the market ended up in the green. If we look at the past 24 hours, Bitcoin’s price went up 0.52% and is now trading at the price of $7,402. Meanwhile, Ethereum managed to gain 1.48%, while XRP gained 2.54%.

The biggest gainer amongst the top100 cryptocurrencies by market cap for today is HedgeTrade, which managed to gain 48.72% on the day. The biggest loser of the day was iExec RLC, which lost 5.69% of its value.

Bitcoin’s dominance decreased a tiny amount as the market managed to gain a bit more in value than what Bitcoin gained. Its dominance is currently 66.44%, which represents a decrease of 0.3% from yesterday’s value.

The cryptocurrency market managed to increase in total market capitalization yet again. As the individual cryptocurrency values increased, so did the overall market cap. The market cap is sitting at $201.08 billion at the moment of writing. This value represents an increase of $2.16 billion against yesterday’s value.

What happened in the past 24 hours

Deutsche Bank researched how cryptocurrencies will do in 2030. They concluded that the demand for alternative currencies will rise and that digital currencies will eventually replace cash. This research was done for the “Imagine 2030” report.

Deutsche Bank strategist Jim Reid pointed out that crypto has solutions for many challenges the existing fiat system has encountered in recent years. On top of that, he said that crypto  itself poses one of the problems fiat has at the moment. He then said that people’s heightened demand for dematerialized means of payment and anonymity could possible bring more people to cryptocurrencies.

_______________________________________________________________________

Technical analysis

_______________________________________________________________________

Bitcoin

Bitcoin spent the whole day trying to pass its key resistance line of $7,415. almost every 4 hour candle managed to break the price but ultimately ended up below the line. If bulls don’t step up their game, Bitcoin’s price will remain under the key resistance level for the time being. If it happens, we could see a spike in volume followed by a sudden upward-faced spike.


Bitcoin’s volume is slightly lower than yesterday, while its RSI is slowly going towards overbought. This could indicate that bulls have a limited time when they can make a strong push to the upside before being crushed by the bears coming to the market.

Key levels to the upside                    Key levels to the downside

1: $7,415                                           1: $7,240

2: $8,000                                           2: $7,120

3: $8,425                                           3: $6,620


Ethereum

Ethereum is on the other side of the coin when compared to Bitcoin. While Bitcoin is trying to push above its resistance, Ethereum is trying to save its price from falling below its support. Ethereum moved back to the $147 line, and it is still unsure whether the price will stay above it or whether it will drop further down. However, Ethereum has many small support points that ended up being well-respected by the market.


Key levels to the upside                    Key levels to the downside

1: $156.8                                             1: $144.1

2: $161.1                                            2: $133.5

3: $163.4                                            3: $127


Ripple

XRP spent the past few days rallying its bulls, which resulted in a major attempt to the upside yesterday and another one today. While today’s move was not so explosive, it was much healthier. The 0.02267 resistance was strong again, and XRP failed to reach above it, but it did make some daily gains nevertheless. The green 38.2% Fib retracement line ended up being well-respected by the market, and the price managed to consolidate near it. However, it is unknown whether this line will play any role in the short future as XRP is moving down at the moment of writing.


XRP’s volume is much higher when compared to the previous days. Its RSI slowly gained momentum to the upside until the consolidation phase, where it settled down a bit.

Key levels to the upside                    Key levels to the downside

1: $0.222                                            1: $0.2185

2: $0.2267                                          2: $0.214

3: $0.234                                            3: $0.209

Categories
Crypto Videos

Cryptocurrency fundamental analysis part 3 – Finding Fundamental Sources


Crypto fundamental analysis part 3 – project analysis

Cryptocurrency projects aren’t like traditional companies, both in terms of how they operate and how they are analyzed. As people don’t have as much data to sift through as you would with traditional stock investments and not everything is straightforward as it is with the financial reports.
Since crypto is still a new industry, it is highly speculative. However, there are several factors to look out for when analyzing an investment that can help decide whether a cryptocurrency is potentially a good moneymaker or not:


  • Target market
  • Competitor comparison
  • Team
  • Roadmap
  • Partnerships
  • Demand, token economics, and utility
  • Status and active users
  • Whitepaper
  • Community and reviews
  • Price history and age
  • Liquidity
  • Regulation

Target market

Every product has a market that they are trying to target. This means you should consider market size when trying to assess the fundamentals of a project. A broader market is, however, not always better. Large markets could already be over-saturated with possible solutions to the same problem. This would, in turn, decrease the likelihood of adoption. Niche markets are, on the other hand, small but could be highly receptive to a new solution to a problem.

Competition

Competition is extremely significant in any industry. It could be used to gauge the effectiveness of a cryptocurrency project. If we take a look at how many competitors a project has and how does it compare to the competition, we can conclude the possibility of the project succeeding in the market. Cross-checking with competitors can highlight both the strengths and weaknesses of a project. That can, in turn, suggest whether this project is likely to beat its competitors in the long-term.
Evaluating the level of competition and deciding whether a project is in good standing relative to the rest rather than just in absolute terms is essential. If a product is unique, it could mean that it is tapping into an unsaturated market or a non-existing one.

Team

Successful products always have great teams behind them. Looking at the team and the advisory board can tell you a lot about the project and how it will be managed.
When examining the project team, check who they are, where they are from, what’s their work history, etc. If a team with a good experience behind them runs the project, that’s definitely a good sign.

Roadmap

Crypto projects often have roadmaps that signify how fast their development will be. They show what upcoming plans they have and how they will move the project forward. Roadmaps can show how long it will take until a project becomes tradable, which is extremely important.
However, watch out for roadmaps that are too ambitious. Missed deadlines bring negative hype around the projects, making it a lousy investment in no time.

Partnerships

When assessing cryptocurrency projects, partnerships are essential for assigning the value of the project. They are more important for determining the validity of the project than the possible outcome of the partnership. However, make sure to understand the details of the partnership before passing judgment, as not all partnerships are created equal.
Demand, token economics, and utility
Price and value are, as with any tradable asset, driven by supply and demand. Theoretically speaking, the larger the demand, the higher the price. In cryptocurrencies, the demand is controlled by token economics and utility.
Looking into the token economics, which is the economy based around the token, can tell us many things. The token should have a use-case within its ecosystem to create sufficient demand. However, its other factors should be investigated, as well. Token supply, emission, and distribution are some of the factors that should influence the decision of whether to invest in a project.

Status

Not all cryptocurrency projects start on a level playing field. Newer projects have far less market traction while established credible projects with their names recognized by the community are much safer investments.
A high number of users that use the cryptocurrency in question is definitely contributing to its value.

Whitepaper

Whitepapers outline the purpose of the project. They are technical documents that have every single detail about the project in them. It is advisable to read the whitepaper thoroughly before investing in any project.
Community and reviews
A community that stands behind a project is a crucial factor in the fundamental analysis of crypto projects. Reading real user reviews can tell you a lot about how the cryptocurrency stands in the market and what are its strengths and weaknesses.

Price history and age

There are thousands of cryptocurrencies currently on the market, and it is safe to say that most cryptocurrencies come and go. If a project has established its name for a long time and has consistently maintained value relative to other cryptocurrencies, it might potentially be a good investment. However, substantial returns may instead come from smaller, and relatively unknown cryptocurrencies that breakout and become mainstream rather than from already established projects.

Liquidity

How often is the cryptocurrency traded, and how easy it is to exchange it for other cryptocurrencies without experiencing slippage? If a particular cryptocurrency generates lots of interest, lots of trading will happen. This could potentially mean that a token is in high demand.

Regulation

A project’s approach to regulation matters greatly in this day and age. If a project does not adhere to certain laws and regulations, that could have negative effects on the price in the future, even if one might not agree that cryptocurrencies should be regulated.


Conclusion

Fundamental analysis can be tricky when it comes to cryptocurrencies. There are many factors to consider and look at, and most of them are entirely subjective. However, with enough projects analyzed, you can compare results and see which projects stand out as viable investments.

Categories
Crypto Videos

Cryptocurrency fundamental analysis part 2 – Finding Fundamental Sources

Crypto fundamental analysis part 2 – Early-stage ICO analysis

While investing in a particular project, one does not have to follow the crowd to be successful. During times when the market is not in the best position for investing (when the whole cryptocurrency market seems to be losing value), people do not want to diversify as much. The ICO market has fewer investors. Most crypto investors are now either Bitcoin maximalists or have a compact portfolio of cryptocurrencies. When it comes to ICOs, they mostly follow the crowd and the hype, or they don’t invest at all. There are, however, many factors that need to be included in the analysis of ICOs before an investment is made. ICO projects need to be looked at from every single perspective available ( and that includes token economics, team, social media, website SEO optimization…), but what happens when an ICO is in the early stages, and most of the information is not available?


Early-stage ICOs

Investing in the early stages of an ICO might be the way to acquire the best bonuses. However, it also brings enormous risks, as the conclusive analysis is usually impossible to do due to the missing data. So how can investors determine whether a project is worth investing?

Project Idea

– Every ICO has to start with a good idea. The problem a project is trying to solve is the lifeline of their project, and what it is based on. The potential acceptance of a project idea can always be determined, no matter how, when we analyze the ICO project.
Team – it’s what makes the idea transform from vision to reality. When looking at early-stage ICOs, this feature becomes even more critical. We have too little data to work with, and that makes the team one thing we can thoroughly inspect. Both the team and the advisory board need to be impeccable for the project to be eligible for investment this early on.

Roadmap

– This factor has less value than the first two but is used to estimate the time frame of the investment.
Potential social media coverage – As the project is still early in development, this part will probably be non-existent. However, some reviewers can be pretty quick when it comes to discovering new and promising projects. Of course, the more people are eager to invest in the project as early as possible, the better the chances it has of succeeding as far as price goes.

The X factor

– Something that will make other people want to invest in this project. This X factor often comes in the form of an idea (or a part of it) or their monetization plan, which makes the project particularly interesting.
If you haven’t noticed, token economics and market traction weren’t mentioned anywhere in the list of important factors here. This is because we are looking at a potential gem project way too early for them to have these. Most projects post their token economics way later, while the market traction will be non-existent when we investigate projects this early on.


Conclusion

Early-stage ICOs can be potential moneymaking opportunities and can bring you amazing returns. On the other hand, we are operating with insufficient data in the ICO analysis, which inherently brings more risk. This lack of data means that compromising on any of the factors analyzed might cost you your investment. It is advisable to pick only the best of the best ICOs when it comes to investing this early on. Another good way of being sure of the project’s possibility of success it just keeping an eye on it and waiting for the data to present itself naturally. This will make the investment safer and the analysis more conclusive.


Categories
Crypto Market Analysis

Daily Crypto Review, Dec 5 – France and Virgin Islands developing digital currencies, cryptos in the green

We can see a mix of green and red in the crypto market in the past 24 hours. Bulls rallied and attempted a price surge with Bitcoin, which most cryptocurrencies followed. However, bears prevailed, and cryptos stayed in the same place they were a day ago. If we take a look at the past 24 hours, Bitcoin went up 1.83% and is now trading at the price of $7,334. Ethereum managed to gain 0.03% of its value on the day. XRP gained 1.06%.

Of the top100 cryptocurrencies by market cap, the biggest gainer is Enjin Coin, which managed to gain 30.79% on the day. The biggest loser of the day was MINDOL, which lost 33.29% of its value.

Bitcoin’s dominance has increased slightly, as its price increase was that occurred in the market was bigger for Bitcoin. On top of that, Bitcoin kept more of the move than the other cryptos did. Its dominance is currently 66.74%, which represents an increase of 0.31% from yesterday’s value.

The cryptocurrency market managed to increase in total market capitalization due to the overall slight price increase. Its market cap is sitting at $197.92 billion at the moment of writing. This value represents an increase of around $2.9 billion when compared to the value it had yesterday.

What happened in the past 24 hours

More and more countries are getting officially interested in cryptocurrency and the concept of digitalization. Even though most of them are talking about digital currencies rather than cryptocurrencies (and the distinction should be made), this is a good sign of crypto acceptance.

A blockchain startup called LIFELabs, along with the British Virgin Islands, is developing a cryptocurrency that will act as a digital currency that will be sovereignly used on the island territory. This digital currency will be a stablecoin that is pegged to the value of the US dollar on a 1:1 ratio.

On top of that, The central bank of France will pilot a central bank digital currency for its financial institutions. This digital Euro pilot would happen in 2020. This news was announced by the governor of the Bank of France.

_______________________________________________________________________

Technical analysis

_______________________________________________________________________

Bitcoin

Bitcoin had bulls rallying and attempting to break its immediate resistance whole day. At one point, its price moved past the $7,415 resistance and reached $7,780. However, that move did not last long as the bull pressure wasn’t as strong. Bitcoin’s price remains under the key resistance level for the time being. There were a couple of other attempts of breaking the line, but they were far weaker and far less significant.


Bitcoin’s volume increased significantly during the big spike, which brought Bitcoin to $7,780. However, even though we can say that the volume is elevated when compared with yesterday’s volume, it is still on the decline when we look at it in the past 24 hours.

Key levels to the upside                    Key levels to the downside

1: $7,415                                           1: $7,240

2: $8,000                                           2: $7,120

3: $8,425                                           3: $6,620


Ethereum

Ethereum suffers the same fate as Bitcoin does. It managed to fall below its $147 zone, but this bull rally wanted to put the price above it. The price shot to $155 at one point, but could not hold up. This move ended quickly, and Ethereum moved back below the key resistance. Its price is now at the very $147 line, and bulls seem to be quite strong, so we might see another solid attempt of moving upward.


Ethereum’s price is currently in limbo, and its short-term support lines are unknown, but this information might not be as important as the bulls are currently in play.

Key levels to the upside                    Key levels to the downside

1: $167.8                                             1: $144.5

2: $178.6                                            2: $127

3: $185


Ripple

XRP spent the day rallying its bulls, which resulted in a major attempt to the upside. XRP’s price reached $0.227 but, as with most cryptocurrencies today, fell as the bull pressure wasn’t as strong as it needed to be. Some of the value was preserved, and XRP is currently trading in a range between the 50% and 61.8% Fib retracement green line.


XRP’s volume is elevated when compared to the previous days. Its RSI is slowly gaining momentum to the upside.

Key levels to the upside                    Key levels to the downside

1: $0.2185                                          1: $0.214

2: $0.222                                            2: 0.209

3: $0.2267                                          3: $0.202