Here you can find all the news about the upcoming hard fork, releases, exchange listings, updates, conferences, new launches, etc. We gather the most relevant events and conferences for you to pick from.
Here you can find all the news about the upcoming hard fork, releases, exchange listings, updates, conferences, new launches, etc. We gather the most relevant events and conferences for you to pick from.
Today´s Events 27/6/2018
NEO (NEO) — Snapshot for NNC Airdrop
Phore (PHR) — Partnership Announcement
Phore (PHR) — Blockchain Expo Europe in Amsterdam
Golem (GNT) — AMA on Reddit
IHT Real Estate Protocol (IHT) — CoinTiger Exchange Listing
Pundi X (NPXS) — Bit-Z Exchange Listing
ODEM (ODE) — Meetup in San Francisco
Creativecoin (CREA) — Weeklys Challenge
MyBit Token (MYB) — Meetup in Amsterdam
Publica (PBL) — Blockchain Summit in London
Bitcoin (BTC) — Snapshot for Airdrop
Cashaa (CAS) — Empire Startups Fintech Conference in Toronto
Fusion (FSN) — Meetup in London
Endor Protocol (EDR) — Blockchain Expo Europe in Amsterdam
The Crypto Markets were Recovering yesterday after Weekend Losses but today we are seeing negative 24h numbers in the top 10 currencies. Bitcoin is trading around $6,173 at the moment of this publication, down around -0.45% over the last 24-hours. Yesterday, BTC raised to $6.342 but since then, the price started to go down, crossed the 100-50 EMAs and seems to be bearish for the remaining time of the trading session, according to the indicators. As we said it, the ten first currencies of the market are in red and the one that loses the most at this moment is Ethereum with -3.16%
General Overview
Market Cap: $251.594.440.275
24h Vol: $17.855.718.044 .
BTC Dominance: 42.0%
Suddenly the market that came a little inactive has become bearish and there are some lost in major cryptos, we must be alert to a possible drop.
The market is turning negative in the last hours but it has only lost a Billion in the capital in 24H, contrary to what we were thinking, apparently the market is not going to have a long setback and would like to resume the low levels of the weekend.
News
20 Percent? Japan’s Finance Minister Ponders Crypto Tax Policy Change
Japan’s minister of finance has discussed the possibility of changing the country’s current capital gains policy which sees crypto investors face between 15 and 55 per cent in taxes.
Breaking New Ground: South Africa Gets Its First Bitcoin Atm
South Africa, whose citizens are increasingly interested in investing and trading in cryptocurrencies, is to have its first functional bitcoin Automated Teller Machine (ATM), following up on Zimbabwe and Djibouti.
Crypto Market Remains Relatively Stable: Theta Surges 30% as Tokens Record Big Gains
The crypto market has slightly rebounded by $4 billion over the past 24 hours, providing investors with a breathing room in a major mid-term sell-off and downtrend.
Robinhood Aims to Disrupt Further by Launching a Cryptocurrency Wallet
If established cryptocurrency exchanges didn’t take notice when commission-free trading app Robinhood started offering free cryptocurrency trading earlier in the year, they are likely to now.
Source: ccn.com
Analysis
BTC/USD
Bitcoin is trading around $6,173 at the moment of this publication, down around -0.45% over the last 24-hours. Yesterday, BTC raised to $6,342 but since then, the price started to go down, crossed the 100-50 EMAs and seems to be bearish for the remaining time of the trading session, according to the indicators in this 1H chart. The immediate support is $ 6,131 and next to the Pivot S1 around $6,096.
Market sentiment
4-H chart technicals signal a sell sentiment.
Oscillators are showing sell signals and pointing down.
Litecoin price has lost -1.99% in the last 24H after touching yesterday highs around $84.18. The price was moving over the central pivot point during the beginning of the session but this support was lost and now the price is testing the pivot S1 at $78.81 in this 1H chart.
Market sentiment
1-H chart technicals signal a Strongly Bearish sentiment.
Oscillators are showing sell signals and pointing down.
XRP has lost -1.17% in the last 24h after finding a strong resistance in the central pivot point around $0.4817 and now is testing the pivot S1 in $0.4711. As like some of the main currencies, XRP comes negative in the last hours. If the Pivot S1 can support the price pressure we could see a bounce to $0.4793, if a breakout happens, a considerable drop can come for the pair.
Market sentiment
1-H chart technicals signal a Strongly Bearish sentiment.
Oscillators are showing sell signals and pointing down.
There is a new bearish and unexpected scenario today. Although the losses have not been so big, the market is feeling nervous again, which may lead us to go back to the weekend minimums very soon if the selling pressure is still active.
This is the Cryptocurrency events calendar. All the news about the upcoming hard fork, releases, exchange listings, updates, conferences, new launches, etc.
Today´s Events 26/6/2018
Playkey (PKT) — Blockchain Summit in London
Storiqa (STQ) — Lunch Fireside Chat Seminar in Bangkok
Huobi Token (HT) — Huobi Europe Quant Trade Summit in Amsterdam
Phore (PHR) — Blockchain Summit in London
TRON (TRX) — Super Representative Election – Tradesatoshi Exchange Listing
Zoin (ZOI) — New Roadmap Release
Stipend (SPD) — IDAX Exchange Listing
Genaro Network (GNX) — Blockchain Connect Conference in San Jose
Zcash (ZEC) — Hard Fork
Odyssey (OCN) — TRON Super Representative Election
Civic (CVC) — Blockchain Connect Conference in San Jose
Qtum (QTUM) — Blockchain Connect Conference in San Jose
Storj (STORJ) — Blockchain Connect Conference in San Jose
Ripple (XRP) — Blockchain Connect Conference in San Jose
QuarkChain (QKC) — Blockchain Connect Conference in San Jose
Huobi Token (HT) — Blockchain Connect Conference in San Jose
U Network (UUU) — Blockchain Connect Conference in San Jose
aelf (ELF) — Blockchain Connect Conference in San Jose
THEKEY (TKY) — Blockchain Connect Conference in San Jose
ICON (ICX) — Blockchain Connect Conference in San Jose
ZClassic (ZCL) — Partnership Announcement
Pillar (PLR) — Blockchain Summit in London
Lisk (LSK) — Meetup in Amsterdam
Cardano (ADA) — Japan Blockchain Conference in Tokyo
SIRIN LABS Token (SRN) — Japan Blockchain Conference in Tokyo
Centrality (CENNZ) — Japan Blockchain Conference in Tokyo
Tokenomy (TEN) — Trading Competition on Coindelta Ends
The market is moving sideways today and there is not a real direction we can say it is going in right now. Most of the cryptos in the market have a lot of barriers to break in order to consolidate prices. Only 27 of the top 100 cryptos appears in green which is showing us that we are more likely to see a move down today.
General Overview
Market Cap: $286.905.409.179
24h Vol: $11.907.725.991
BTC Dominance: 40.1%
News
Korean Government Details Regulatory Plans After Multiple Crypto Exchange Hacks
Following multiple hack reports, the South Korean government explains how it will strengthen the regulatory framework for cryptocurrency exchanges. A bill has already been submitted which imposes multiple new obligations on crypto exchanges.
Source: bitcoin.com
US Congressional Members Ordered to Disclose Crypto Holdings
The House Ethics Committee has informed all US Congress members that they must disclose any investment worth more than $1,000 as of June, 18
Crypto Mining Mogul Hits the Big-time with Portable Mining Containers
Serial crypto entrepreneur Valery Vavilov of Bitfury has struck gold again with his latest venture by solving two of the main hurdles in mining cryptocurrency with some big black boxes.
Litecoin Futures are a Go on UK Crypto Exchange
Litecoin (LTC) derivatives are a go in the UK. Trading platform Crypto Facilities announced that as of Friday, June 22, their new dollar-denominated service will allow investors to trade in futures contracts which have Litecoin as the underpinning collateral, with weekly, monthly and quarterly maturities.
Source: newsbtc.com
Analysis
XRP/USD
The price of XRP has lost 1.14% in the last 24 hours and is trading above $0.53 after having rebounded in the EMA-50 in this 4 H chart. The pair is bearish in the last hours since the sellers have pressed hard and the attempts to exceed $0.54 have been unsuccessful. The price could continue to fall and reach $0.5286 (61.8% Fibonacci).
Market sentiment
4-H chart technicals signal a sell sentiment.
Oscillators are showing sell signals and pointing down.
Litecoin hasn’t been able to recover the $100 level and has been repeatedly bouncing in the EMA-50. The price will have to beat several lines in order to go for the $100 again, such as $97, very close to the Central Pivot Point. If the $100 level is achieved the bulls would have a good opportunity to look for higher levels such as $107 and then $110.
The next strong support is S1 Pivot Point in $95.93. Below that, there are no more barriers until the S2 Pivot at $93.96.
Market sentiment
4-Hourly chart technicals signal bearish.
Oscillators are showing sell signals and pointing down.
BTC has lost 0.85% in the last 24 hours and is moving right now at $6,717, trying to break the Central Pivot Point at $6.710. The buyers are trying with no success to get the $6,800 but this is a very important number because a break above this can send the price towards the $7,000. We can see here in this 1H chart a contracting triangle formed with support at $6,684 and resistance close $6,770.
The price is approaching both break lines of the triangle and I think the price will break below $6,700 to look for the S1 Pivot at $6.606.
The market continues indecisive but with a more downward trend in the pairs analysed today. There is a weekend coming where we must be very attentive to maybe strong movements, mainly bearish. However, many investors will be hoping for an upward trajectory that has not been seen in months.
The market today started in red for most of the 100 top cryptos with loses between -0.2% and -7%, while many buyers are with their fingers on the trigger waiting for the $ 5700 BTC level to put their money inside the market for a rally higher and good profits.
General Overview
Market Cap: $275.605.476.514
24h Vol: $10.142.645.562
BTC Dominance: 40.2%
marketCap18.06
This is the sentiment today, still bearish but very nervous on both sides and with bitcoin dominance back to 40%, percentage not seen in the last two months.
News
Bitcoin Miners in China’s Remote Regions are Undeterred By Restrictions
Though Chinese authorities have previously taken various measures aimed at curtailing the trading of cryptocurrencies, the mining of Bitcoin has continued unabated in some of China’s remote parts according to a Nikkei Asian Review report.
Ripple Donates $2 Million to Texas University’s Blockchain Initiative
One of 17 institutions chosen for Ripple’s $50 million academic pledge, the University of Texas at Austin will receive $2 million from San Francisco-based industry giant Ripple.
Korean Authorities Admit to Postponing Cryptocurrency Regulation Because it Legitimises Market
Authorities have admitted that the South Korean government had postponed the regulation of the cryptocurrency sector because it feared consumers will acknowledge it as the government legitimising the cryptocurrency market.
Walmart Patents System for Accessing Medical Records Stored on a Blockchain
Big-box retailer Walmart has been awarded a patent for a system that is designed to store a patient’s vital medical records in a blockchain database. The information can then be retrieved at the scene of an emergency when a patient is unresponsive and can’t communicate with first responders.
Japanese Police Arrest 16 Individuals in Monero Cryptojacking Case Cryptojacking is the process of installing mining scripts or outright malicious malware onto computers of unsuspecting users to mine cryptocurrencies. The most popular among these is Coinhive, a javascript mining script installed on websites. Hackers have been installing Coinhive on websites with weak security to mine Monero. Since Monero is a privacy coin, it makes it harder to catch criminals.
Source: ccn.com
Analysis
NEO/USD
NEO has lost -1.33% in the last 24 hours and -19% of its value in just 1 week. The price of the pair has been sidelined since June 13, when it touched the lower part of the Bearish Channel at $35.9 and bounced there until it reached $41.5, today it is moving in $37.1 below the Central Pivot Point and the indicators are shown in the oversold area.
The week begins bearish for the pair and the EMA’s are separating which indicates that lower minimums can come, the immediate support is in $35.8 and then the Pivot S1 in $33.7.
Market sentiment
4-H chart technicals signal a sell sentiment.
Oscillators are showing sell signals, and moving averages a strong sell.
Pivot points
R3 56.7R2 51.8R1 45.2P 40.4S1 33.7S2 28.8S3 22.3
EOS/USD
EOS has lost -2.10% in the last 24 hours and -33% in just 9 days, for now, it is moving at $10.2, below the Central Pivot Point and a little lateralised after having reached the Fibonacci retracement of 38.2 of the last drop, bouncing there and sending the price below the 23.6% retracement.
The Stochastic is showing oversold and the RSI is leaving the same area pointing up although the sentiment is still Bearish. For now, the price moves in the central part of the channel very close to the psychological number of $10 and the immediate support is $9.8 and below $9.1, minimum from last June 13th. The Central Pivot Point has also become important resistance and a bounce there could send the price quickly to the S1 pivot.
EOS network was frozen for several hours this weekend due to a bug in its consensus protocol. The EOS community went into panic however the price did not react negatively. EOS released a patch yesterday that restored the network functionality.
Market Sentiment
4H chart technicals signal Bearish.
Oscillators are on sell, and moving averages on a strong Sell.
Pivot points
R3 5.2R2 13.7R1 12.0P 10.5S1 8.8S2 7.4S3 5.7
ADA/USD
Two good news for Cardano this week: It was added to a tradable asset on eToro and will be added to CopyFund, this is an investment portfolio from eToro. The downtrend is still alive in ADA and it is now testing the support area of $0.1569.
The buyers did not have enough strength to cross the 38.2 Fibonacci retracement and now the price is moving into a narrow range.
The price is below the moving averages in these cryptos, while a bearish momentum will continue to manage the prices in the medium term. The sellers still have the influence in the market and there is a real expectation of new lows in the charts.
Happenings in the Cryptoverse
Bitcoin Vs Altcoins: The Cryptocurrency field is in quite of a rough spot when it comes to price at the moment. With altcoins being pegged to
Happenings in the Cryptoverse
Bitcoin Vs Altcoins: The Cryptocurrency field is in quite of a rough spot when it comes to price at the moment. With altcoins being pegged to
Happenings in the Cryptoverse
Bitcoin Vs Altcoins: The Cryptocurrency field is in quite of a rough spot when it comes to price at the moment. With altcoins being pegged to the price of Bitcoin, any movement seems to affect cryptocurrencies globally. Why is this happening and what to do?
Why Are Altcoins Dropping In Price More Than Bitcoin?
If, however, Bitcoin is rising in price, they are winding up slower because traders are riding the wave that Bitcoin created. After the spike up happens, altcoins take over and people diversify their portfolios from the previous gains they had.
Bitcoin price manipulation or something else?
Is this price fall an “attack” on Bitcoin and all of the Cryptocurrencies, or something else?
As you know, I am very conservative when it comes to accusing someone of price manipulation. There is always (in a way) a form of price manipulation from the big holders, but it’s usually not to shut down an asset, but rather just to profit from it. Also, the MtGox trustee has been a great source of fear and FUD with people, which further decreased optimism when it comes to Crypto.
So, it is price manipulation?
Only a small part of the price drop (I believe) is price manipulation. Investors were panic selling every step of the way down. Ultimately, the biggest reason for the drop in the value of Cryptocurrencies is nothing else but levelling of expectations and capabilities.
People had great expectations from day 1 of investing, but the truth is that Cryptocurrencies (most of them) were not ready for mass adoption and mass use, especially Bitcoin. This situation made the Crypto field a speculative field rather than an objective one. The price drop that happened levelled the expectation that people had regarding what Blockchain and Crypto could do for the world, rather than just turn a dollar into a few more, or into none.
A real quick update here on a trade I’ve been monitoring, a possible breakout of EOS in the Square of 90.
Following Gann’s Rule of Angles, when the price breaks and closes an angle, it will move to test the next. EOS is approaching an angle break AND the break of a downtrend structure. Great entry here at 14.83.
ETP/BTC moves in range but you should be ready for a breakout from this extended sideways movement. Are you long or short on this pair?
Metaverse ETP (ETP)
Market Cap: $30.46M
Circulating Supply: 35.79M ETP
Max Supply: 100ETP
Volume (24h) $4.60M
ETP/USD = $0.85474
Technical Analysis
ETP/BTC continues to move sideways in the short term, so we should wait for a valid breakout so we can take action again. The rate has found a bottom at the 0.00007820 level and failed to reach it again in the last attempts, signalling a potential rebound.
The pair remains under pressure in the short term as long as it is trading below two important resistance levels.
You can see on the Daily chart that it has found a strong demand zone right below the downside 50% Fibonacci line of the descending pitchfork and now moves towards the median line (ML). The rate could continue to move sideways, but you should also be ready for a breakout. Right now we need to wait to see the breakout direction.
Right now it seems a little exhausted because it has failed to reach the median line (ML). Personally, I believe that we could have a great trading opportunity if the rate will pass above the median line (ML) and if it will stay there. A great buying opportunity will appear only after a valid breakout above the 0.00012860 static resistance.
Conclusion
It remains to be seen if this sideways movement will be an accumulation or a distribution. We should wait for a valid breakout and only then to open a position. You can buy it from above the 0.00012860 static resistance having a first target at the upside 50% Fibonacci line. A selling opportunity will appear after a valid breakdown from this pattern.
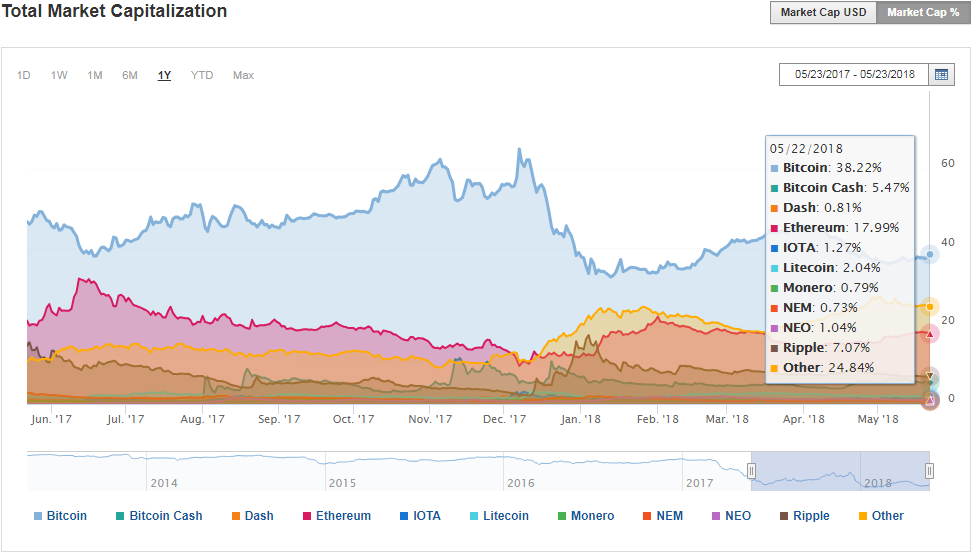
The crypto market total capitalisation has reached the $345,848,996,562 level and a $15,093,140,340 daily volume, much lower compared to January 2018. Nowadays everyone wants to make huge profits by trading or investing in the cryptocurrencies. There are all kinds of economists and specialists that continue to sustain that the cryptocurrencies should drop much deeper because they are overstated. You should know that what happened on Bitcoin won’t happen again because the conditions have changed and there are a lot of factors that influence the market.
Source: investing.com
Also, the crypto market is very volatile because the traders and investors are more cautious and they prefer to trade on the short term after last month’s major corrective phase. Last year’s amazing rally is history now, so we need to focus on what could happen in the upcoming period and maybe we’ll catch other important movements in the short to the medium term.
The high volatility makes trading very risky because the market could turn against you very fast and you can suffer a heavy loss.
In this editorial, I want to talk about the EOS because this crypto has become one of the most important and most traded cryptocurrency.
EOS/USD Analysis
As you can see on the Daily chart, EOS/USD rallied aggressively and reached fresh new highs in the last months. It has increased from 3.8723 on March 18, 2018, to 23.0290 level on 29 April 2018. So, EOS increased sharply and has brought amazing profits to those that have invested in it. That’s why more and more people want to trade or to invest in the crypto market. We still have great opportunities despite all the rumours and even if the market is very volatile. I’ve said in another editorial that the cryptocurrencies should be treated like any other speculative assets and that’s exactly what you should do if you don’t want to have any surprises.
EOS/USD plunged after reaching the 23.0290 top and now has found a strong support and a bottom on the median line (ml) of the ascending pitchfork, and right below the 61.8% retracement level. The two false breakdowns below the 61.8% retracement level have sent the rate higher again.
EOS/USD still has a huge potential if it stays above the median line (ml) of the ascending pitchfork, but you should know that only a valid breakout above the upper median line (uml) and above the 250% Fibonacci line will confirm another significant upside movement. The major target remains at the 23.0290 historical high.
Conclusion
You should know that there will be a lot of opportunities in the crypto market despite the high volatility and despite the bearish bias. If you’ll make a great analysis you may find cryptocurrencies with important potential, but you should take into consideration all the factors that could ruin your scenario and your expectations.
The CFI/BTC crypto pair increased today and it seems like we’ll have a breakout attempt above a very strong dynamic resistance. A valid breakout will announce a potentially larger rebound for the upcoming period. However, you should stay away for now because another leg higher needs to be confirmed. CFI/BTC has shown little action in the short-term, signalling that the bears could be exhausted. The price is moving sideways somehow in the short term, that’s why we need to be very careful because anything could happen.
You can see on the Daily chart that the rate has finally managed to break out above the first warning line (WL1) of the descending pitchfork and now has reached the downtrend again. The price has failed to reach and retest the downtrend line in the past week signalling a bearish pressure. A valid break out above the downtrend line could help us to go long on this cryptocurrency.
I’ve drawn a minor ascending pitchfork, so a breakout above the downtrend line followed by a retest of the lower median line (lml) will confirm a rebound in the short term.
Conclusion
We can buy CFI/BTC if the rate stays above the 0.00000711 static support and within the ascending pitchfork’s body. The first important upside target will be at the median line (ml) of the ascending pitchfork. A failure to breakout above the downtrend line and a valid breakdown below the 0.00000711 level will invalidate the bullish scenario for now.
XRP/BTC increased and maintains a bullish perspective in the short term. It remains to see what will really happen in the upcoming period because the crypto market is still weak. The rate dropped in yesterday’s trading session as the crypto market dropped further.
The price rebounded in the short term after the failure to reach the previous lows. The rate has managed to break out above some very important resistance levels and now is struggling to reach new highs.
The rate has made a false breakdown below the 150% line of the descending pitchfork signalling that we may have an oversold situation. It has moved sideways on the short term but now has started an upside movement after the breakout above the WL1 of the descending pitchfork.
The perspective will remain bullish in the short term as long as the rate stays above the 150% Fibonacci line of the minor ascending pitchfork. The next upside obstacle is at the 61.8% Fibonacci level, so we need a breakout above this level so we can think of a further increase.
It looks bullish in the short term, you can see that the price failed to retest the minor red uptrend line, signalling that the buyers are strong.
Conclusion
We can go long on this crypto pair if it will close above the 0.000091050 yesterday’s high and we can place a stop loss below the 0.000073170 low. A valid breakout above the 61.8% level will send the rate towards the 50% line and maybe towards the median line (ml) of the ascending pitchfork.
Monero plunged today and erased the yesterday’s gains. The price maintains a bearish perspective on the short-term after today’s drop. The rate has failed to close above a dynamic resistance (support turned into resistance) and now it seems determined to challenge a major support area. A valid breakdown will signal a further drop.
All the major cryptocurrencies have dropped today signalling that the rebound could be temporary and the crypto market could resume the downside movement.
You can see that the rate has increased a little after the false breakdown below the 151.260 static support, but yesterday’s failure to close above the lower median line (lml) of the ascending pitchfork has signalled that the rate could resume the corrective movement.
We can go short on this cryptocurrency if it will make a valid breakdown below the 151.260 static support, and if it will close below the 145.810 former low. The price could stabilise below the first warning line (WL1) of the ascending pitchfork, which represents another bearish signal. It has also retested the minor uptrend line which represents the downside line of the triangle chart pattern.
Conclusion
You can sell Monero if the bearish scenario will be confirmed. The first downside targets will be at the 150% lines. The Stop Loss can be placed above the 177.780 yesterday’s high.
BTG/BTC is on a declining path on the daily chart. The rate dropped significantly in the last months as the crypto market has crashed. Right now, it is very important to see what will really happen in the short term because the rate hovers right above a crucial support level. A valid breakdown will confirm a further drop in the upcoming period. The rate dropped today as the all major cryptocurrencies have dropped significantly today.
The price dropped and has found strong support at the 0.005564 level on April 12, 2018. It has increased a little and has made a valid breakout above the median line (ML) of the descending pitchfork. Unfortunately, the rate didn’t resume the rebound and has started another minor corrective phase in the short term.
BTG/BTC has found a temporary support again and has increased a little in the last days, that’s why I’ve drawn an ascending pitchfork. Unfortunately, the rate dropped significantly and could invalidate a further increase in the short term. The next few days will be crucial because a valid breakdown below the 0.005564 will signal a further drop.
We may have a buying opportunity only after a valid breakout above the downtrend line and if the rate will stay within the minor ascending pitchfork’s body.
Conclusion
You could go long after a valid breakout above the downtrend line. We’ll have an important upside target at the median line (ml) of the minor ascending pitchfork and another one at the UML.
UBQ/BTC is trading in the red today and seems under a lot of selling pressure after the last day’s failure to close on or near a dynamic resistance line. Technically, the perspective remains bearish in the short term despite the last day’s minor gains.
A further and a larger drop could be validated soon if the rate will take out a static support. Right now will be better to stay away and to go short only after the bearish scenario will be confirmed.
UBQ/BTC has made a valid breakdown below the uptrend line as the rate has come back to retest it. You can see that the rate has failed to close near the former uptrend line showing a bearish pressure. It has made only a false breakout above the sliding line (sl1) of the descending pitchfork. The rate is trapped between the inside sliding parallel line (sl and the sl1) of the descending pitchfork.
A failure to stay above the median line (ml) of the descending pitchfork will announce a further drop and a potential breakdown below the sliding line (sl) and below the 0.00017750 static support. You can see it from below the mentioned support levels. The next target will be at the downside 50% Fibonacci line (descending dotted line).
Conclusion
The corrective phase will continue if the UBQ/BTC rate will make a valid breakdown below the 0.00017750 static support and below the sliding line (sl). The first target will be at the downside 50% Fibonacci line and the second one at the WL1 of the former major ascending pitchfork. The Stop Loss can be placed above the 0.00022661 Wednesday’s high. You should know that a valid breakout above the upside sliding line (sl1) will signal a bullish opportunity.
Litecoin was into another correction phase on the short term as the crypto market has turned to the downside again. The price increased aggressively on Tuesday and has shown an oversold signal. However, it is still premature to talk about a significant increase after one strong bullish candle. I’ve seen a lot of analysts that are sustaining that the major cryptocurrencies will start to increase again and that the correction is completed. Personally, I need a confirmation before I’ll go long again because the major cryptocurrencies are still trapped below some very important and strong resistance levels.
You can see that Litecoin has developed a major triangle on the Daily chart, so only a breakout from this pattern will bring a clear direction for the upcoming period. Price has retested the downside line of the chart pattern and failed to reach and retest the 106.52 static support.
LTC/USD failed to reach and retest the upside 50% Fibonacci line of the descending pitchfork in the last two attempts signaling that the sellers are exhausted after last week’s drop.
We’ll see what will really happen when the rate will reach the fourth warning line (wl4) of the former ascending pitchfork. You should know that a valid breakdown below this dynamic support will signal a further drop. You can see that I’ve drawn a minor ascending pitchfork, so it could come to test and retest the lower median line (lml) in the upcoming days.
Conclusion
You can buy it only if the rate stays within the minor ascending pitchfork’s body, and if it stays above the triangle’s downside line. The first upside target it will be at the UML of the descending pitchfork and the second one at the upside line of the chart pattern. The Stop Loss can be placed below the 106.52 level.
ETP/USD decreased a little today, but it seems undecided in the short term. Price is narrowing right now, that’s why you should stay away and wait for a fresh trading signal. It could start a broader upside movement if it will take out the near term resistance levels.
It has developed a minor chart pattern, but we still have to wait to see the breakout direction. It has shown some oversold signs, but it is still under pressure as long as it is trapped below some very important upside resistance levels.
You can notice that the rate has failed to make a valid breakdown below the 50% Fibonacci line of the minor descending pitchfork signalling an oversold. It has run away from the 50% Fibonacci line of the major descending pitchfork signalling that the behaviour could change soon.
ETP/USD failed to reach and retest the 0.6000 psychological level, that is why we can think of another bullish momentum. However, the rate is trapped below the upper median line (uml) of the minor descending pitchfork, below the outside sliding line (sl) of the minor descending pitchfork, and much below the UML of the major descending pitchfork. Support can be found at the first warning line (wl1) of the ascending pitchfork.
Conclusion
We’ll have a perfect buying opportunity if the rate will make a valid breakout above the mentioned resistance levels. The next upside target will be at the 150% Fibonacci line of the ascending pitchfork and the second one at the lower median line (lml). A drop below the 0.6000 – 0.5701 static support will invalidate the bullish scenario.
QWARK/BTC slips lower on the Daily chart and is almost to reach a major and crucial support area. Price remains under selling pressure after the failure to climb towards a major dynamic resistance. Actually, the dynamic resistance has failed to attract the price, that’s why the sellers are still very strong.
The rate is pressuring some very important support level, that’s why you should stay away because right now we don’t have any trading opportunity.
Price moves somehow sideways on the short term after the amazing downside movement. The selling pressure is still very high in the short term. Right now we don’t have any reversal signal, that’s why we need to wait for a confirmation that the rate will start another leg higher.
Price hovers above several support levels, so a rejection from here or a false breakdown will signal a bullish momentum. QWARK/BTC is pressuring the 50% Fibonacci line of the descending pitchfork, the 0.00000939 static support and the lower median line (LML) of the ascending pitchfork.
The false breakout above the sliding line (sl) has sent the price down again. It is almost to reach the first warning line (WL1) of the major descending pitchfork as well, so only a valid breakout above this dynamic resistance and above the sliding line (sl) will really signal a bullish movement.
Conclusion
We’ll have a great buying opportunity if the rate will stay above the 0.00000860 and if it will make a valid breakout above the sliding line (SL) and above the WL1. The first target it will be at the median line (ml) of the descending pitchfork and the second one at the upside 50% line.
ADA/USD rallied in yesterday’s trading session and has invalidated the breakdown below the lower median line (LML) of the major ascending pitchfork. The crypto market has bounced back in yesterday’s session and is signalling that the sellers are too exhausted in the short term. However, the ADA/USD could still come back a little to test and retest the support levels before it climbs towards the next upside targets.
The corrective phase was natural and it was expected after the failure to stabilise above the median line (ML) of the ascending pitchfork. Personally, I would like to see a consolidation on all major cryptocurrencies before they will really start a larger upside movement. We need a confirmation before we’ll go long again.
Technically, the rate is expected to increase after the false breakdown below the LML of the ascending pitchfork and below the first warning line (wl1) of the minor descending pitchfork. It has escaped from the minor Falling Wedge signalling a reversal in the short term.
Another leg higher will be invalidated only by a valid breakdown below the lower median line (LML). It remains to be seen if it will increase from now or after a minor drop and after a retest of the LML, the warning line (wl1).
Conclusion
You can go long on Cardano (ADA) with a first upside target at the 50% Fibonacci line of the ascending pitchfork. The second target will be at the median line (ML) and the Stop Loss could be placed below the 0.170625 previous low or below the 0.166490 static support. This setup could have a Reward-to-Risk around 3.50.
SAN/USD moves sideways on the short term and seems determined to increase and to recover a little after the last bearish movement. The price developed a triangle chart pattern, so a breakout could bring us a perfect trading opportunity on the short term. Right now you should stay away because it is still under pressure. It is trapped below some very strong dynamic resistance levels, so only a breakout will announce a significant upside movement and will confirm the bullish scenario.
The rate dropped again after the breakout above the median line (ML) of the descending pitchfork. It has tested and retested the median line (ML) and now is moving away from it signalling that the bears are exhausted on the short term and that the bulls can step in again. It is still premature to say that we’ll have a sharp increase in the upcoming days.
We could have a great buying opportunity if the rate will make a valid breakout above the downtrend line and above the 1.6630 static resistance. The first bullish signal will be given by the breakout above the upside 50% Fibonacci line (descending dotted line) of the descending pitchfork.
Conclusion
You can go long on SAN/USD after a valid breakout above the downtrend line and outside the descending pitchfork’s body and you can place your Stop Loss somewhere below the former low or below the 0.8350 static support. We’ll have an important upside target at the first warning line (WL1) and another one at the median line (ml) of the ascending pitchfork. A drop below the 0.8350 level will invalidate the bullish scenario.
ETH/USD plunged in yesterday’s trading session and ignored another downside obstacle. Price registered humble gains today, but you should know that the perspective remains bearish on the short term. The crypto market has started to drop after the minor upside movement and could continue this downside movement because we don’t have any reversal signs.
The rate could increase a little in the short term and could test and retest the broken levels before it will drop further.
You can see that the price has retested the sliding parallel line (SL) of the descending pitchfork. It has failed to make a breakout above the confluence area formed between the 50% line with the SL. The price dropped below the first warning line (WL1) of the descending pitchfork and below the lower median line (LML) of the ascending pitchfork signaling a further drop.
ETH/USD could come back to test and retest the broken lines. So, we’ll have a great selling opportunity if the price will stay below the lines mentioned.
The current drop is natural and it was expected after the failure to reach the median line (ML). Right now only a false breakdown below the lower median line (lml) of the ascending pitchfork could invalidate a further drop, but is hard to believe that the buyers could force the rate to increase significantly from here.
Conclusion
The perspective remains bearish on the short term as long as the ETH/USD rate stays below the sliding line (SL) of the descending pitchfork. It could drop towards the 400 psychological level because it should be attracted by the 150% lines in the upcoming period. Only a valid breakout above the SL will signal a reversal.
Particl price resumes the downside movement and could reach lows soon as the pressure is very high. PART/USD approaches a very strong support area, so you can keep an eye on this to see how it will react in the upcoming days.
The current drop is natural as the crypto market has turned to the downside again and because the rate has failed to stay above a very strong dynamic support.
It was expected to drop further after the breakdown below the lower median line (lml) of the ascending pitchfork. The breakdown below the 150% line has attracted more sellers.
Technically, it is expected to drop towards the first warning line (wl1) of the ascending pitchfork and towards the downside line of the Falling Wedge pattern after the failure to approach and retest the downtrend line.
The rate has signalled that it is losing the bearish momentum in the last days when it has failed to reach and retest the upside 50% Fibonacci line of the descending pitchfork. However, the bearish bias remains intact as long as the rate continues to stay below the sliding parallel line (SL) of the descending pitchfork.
Conclusion
We may have a buying opportunity if the rate will be rejected by the 8.21276496 static support, if it will stay above the warning line (wl1) and if it will make a valid breakout above the SL of the descending pitchfork. A drop below the mentioned levels will invalidate the bullish scenario.
EOS/BTC edged higher today but it is premature to talk about a bullish movement for the upcoming period. We can go long only after a valid breakout above the SL2 of the ascending pitchfork.
Market Cap: $10.57B
Circulating Supply: 877.22M EOS
Max Supply: 1B EOS
Volume (24h): $2.04B
EOS/USD = $11.9681
Technical Analysis
EOS/BTC rallied aggressively today and erased the last day’s drop. It remains to see where it will close the day because the rate has slipped lower in the last two hours. It has increased significantly as the crypto market has rebounded a little today, but you should know that the crypto pair remains under massive selling pressure on the short term.
I want to show you a bullish scenario, if the rate will resume today’s rebound, and if it will manage to close and stabilise above the 0.0017000 psychological level.
The corrective phase was natural and normal after the impressive rally and after the false breakout above the upper median line. It has found a very strong resistance right above the 150% Fibonacci line. The price was trapped within a Falling Wedge pattern and now it has managed to escape from this pattern, signalling that the bulls can take the lead again. The breakout needs a confirmation, so we should stay away from this pair for now because we don’t have a buying opportunity yet.
EOS/BTC has broken below the uptrend line, but the today’s increase could invalidate the breakdown and could attract more buyer’s.
Conclusion
Personally, I believe that the rate could become bullish again if it will make a valid breakout above the SL2, above the 38.2% retracement level and above the median line (ml) of the ascending pitchfork. However, a valid breakdown below the SL1 will open the door for more declines. The major upside target remains at the 0.0019900 previous high.
The cryptocurrencies are into a corrective phase, after the temporary rebound. It remains to see how long this will be as the major cryptos are almost reaching crucial support levels. Technically, the current drop was somehow expected after the impressive rally.
However, we’ll see if the buyers will step in again and if they will have enough power to push the crypto market higher again. The pessimism sentiment drives the crypto market in the short term. The investors could run away from the crypto market if the bearish movement is to continue. If you read my editorials you’ll notice that I’ve talked about a corrective phase after the temporary upside movement.
I’ve mentioned previously that the cryptocurrencies could come back down to test and retest some demand zones before they will really start a major upside movement. The major cryptocurrencies could increase again after the current sell-off, but the next major upside movement will be slower compared to what happened in 2017.
Personally, I want to see a strong consolidation in the short term before we can say for sure that the crypto market will be on an uptrend again. The cryptocurrencies are very volatile in the short term, that’s why the investors are sceptical that these speculative assets represent good investments.
Bitcoin Technical Analysis
The most important cryptocurrency approaches a critical support. A valid breakdown could confirm a massive drop for the upcoming period. You should be careful if you are long on Bitcoin because a further downside movement will ruin your account or your investment.
Bitcoin failed to reach the 10,000 psychological level and now is located below the 8,000 psychological level. It approaches the outside sliding parallel line (SL) of the ascending pitchfork where it could find support again.
I’ve mentioned in the previous weeks that the rate could come down to test and retest the lower median line (LML), and the sliding line (SL) after the failure to stabilise above the 50% Fibonacci line.
Price will maintain a bullish perspective as long as it stays above the SL, while a breakdown will invalidate a further increase and will send the rate towards the 5,000 level again. This scenario will crash the crypto market again and many projects will die.
The next days will be crucial for Bitcoin because a breakdown is somehow expected after the failure to stay within the ascending pitchfork’s body. Only a false breakdown below the SL, followed by a retest and by an important increase will signal another leg higher.
Ethereum dropped by 10.59% in the last 7-days, while the Ripple decreased by 9.40% and they could slip much lower in the upcoming days.
Conclusion
You should stay away from the crypto market if you didn’t take a long position in the previous weeks and you should keep an eye on it if you invested in the major cryptocurrencies because you can still get out with a small loss if the market were to crash. However, the corrective phase may be temporary and could give us a great chance to go long again after a strong consolidation.
INCNT/USD continues to stay above some very important dynamic support levels and maintains a bullish perspective in the short term. The price could increase significantly in the upcoming period if it will make a valid breakout above some very important upside targets.
The rate is trapped below some very important resistance levels, that’s why we have to stay away until a further increase will be confirmed by the price action.
You can see that the rate was into a corrective phase, but it has found a bottom and a strong support right below the lower median line (lml) of the ascending pitchfork. I’ve drawn an outside sliding parallel line to show you where the crucial support line is. A further increase will be invalidated by a valid breakdown below this line.
You can see that the rate has failed to reach and retest the sliding line (sl) of the ascending pitchfork signalling that the bulls are still present in the game. However, only a valid breakout will be above the 150% Fibonacci line and above the 0.4226
Conclusion
You can go long on INCNT if the rate will jump and will stabilise above the 150% line and above the 0.42260400. The next upside targets will be at the WL1 and at the 50% line. You can place your Stop Loss somewhere below the outside sliding parallel line (SL). A drop below this line will really signal a further drop in the short term.
NEOS/BTC is trading right above a major support area, that’s why we can think of another rebound soon. It remains to see what will really happen because the rate could drop further and could invalidate a bullish scenario.
The crypto pair has changed little in the short term and after the last two breakout attempts above the near term resistance levels. Right now you should stay away until we’ll really have a confirmation that the rate will increase again.
Price moves somehow sideways on the Daily chart and has developed a triangle, but this pattern is far from being complete. The rate hovers above the major support area between the 0.00033923 and the 0.00026639.
NEOS/BTC could turn to the upside as long as it stays above this support zone. It has failed to reach and retest the downside 50% Fibonacci line of the descending pitchfork signalling a minor oversold.
Technically, it should approach the first warning line (WL1) of the ascending pitchfork after the breakdown below the 150% Fibonacci line. So, a test and retest of the WL1 could send the rate higher on the short term, but only a valid breakout above the median line (ml) of the descending pitchfork will signal a broader rebound.
Conclusion
The price should start another upside movement if the WL1 and the 0.00026639 support levels will hold. A valid breakout above the median line (ml) will signal an increase at least until the upside 50% Fibonacci line and towards the downtrend line.
MTL/USD changed little today and continues to be under pressure on the Daily chart. It approaches a critical support, so a valid breakdown will confirm a further drop. The price has developed an important chart pattern. It remains to see the breakout direction. MTL/USD has made a false breakout in the last days, which could attract more seller’s on the short term.
However, it is premature to say that we’ll have a further drop because anything could change when the rate will touch the dynamic support.
It moves sideways on the daily chart, but this range will end soon because it cannot move like this forever. The crypto is trapped within the upside 50% Fibonacci line and the downside 50% Fibonacci line of the descending pitchfork.
Personally, I believe that a rejection from the minor uptrend line and a failure to approach and reach the downside 50% Fibonacci line will signal an oversold and a potential upside movement.
Unfortunately, it has failed to make a valid breakout above the (SL) and above the median line (ml) of the descending pitchfork, signalling that the bears are very strong.
A false breakdown below the downside line of the chart pattern followed by an impressive jump above the median line (ml) and above the outside sliding parallel line (SL) could signal a broader upside movement.
Conclusion
We could buy Metal (MTL) if it will remain within the chart pattern’s body, and if it will stabilise above the median line (ml). We’ll have an important upside target at the warning line (WL1) of the descending pitchfork. However, a valid breakdown from the mentioned triangle will send the rate to at least the 50% line. A valid breakdown below the downside 50% line will give us a great chance to go short.
MUE/BTC posted humble gains in the last days, signalling that the buyers are still weak. The price hovers above a major support area, that’s why we can think of another upside movement. The rate is narrowing right now, but I really hope that we’ll have a major move after the breakout from this minor chart pattern.
The rate tested and retested a dynamic support and it has now increased, but it is premature to talk about a larger upside movement at this moment.
I’ve drawn an ascending pitchfork hoping that I’ll catch an important upside movement. The rate has come back down to test and retest the lower median line (LML) and now approaches the minor downtrend line. A valid breakout will signal a further increase towards the 50% Fibonacci line and towards the major downtrend line.
However, it remains to see if this sideways movement will be an accumulation or a distribution. Anything could happen right now. The rate could drop significantly if it fails to pass above the minor dynamic resistance.
Personally, I believe that we could have an important upside movement towards the downtrend line as long as the rate stays above the LML. A larger rebound will be confirmed only after a valid breakout above the major downtrend line.
Conclusion
You could go long on MUE/BTC if the rate jumps and it closes above the minor dynamic resistance. You can place a Stop Loss somewhere below the support area.
BAT/USD plunged in the last hours and could invalidate a further increase. However, I want to show you a great buying opportunity only if this will be a false breakdown below the lower median line (LML) of the ascending pitchfork.
The rate has it into a corrective phase on the short term after the impressive upside movement. Price has found a strong demand right above an important support area. Right now you should stay away because this could be only a temporary rebound and the rate could drop and could take out the support area.
Basic Attention Token Price Prediction
BAT/USD has made a false breakdown below the 50% and below the 61.8% retracement levels. It has increased and has closed above the 38.2% retracement level and above the lower median line (LML) of the ascending pitchfork. A false breakdown below the LML followed by a retest will signal a further increase in the short term.
However, you should know that the rate could take out the support from the outside sliding line (SL) if it will close on it, and will invalidate a further increase.
Conclusion
The perspective will remain bullish as long as the rate stays above the SL of the ascending pitchfork. We may have a buying opportunity only if the rate will stabilise above the 38.2% retracement level and above the LML. The first major upside target will remain at the median line (ML).
Internet Of People Price Prediction: IOP/BTC seems undecided right now and maybe you should be very careful because it could start an aggressive move very soon. The direction remains to be seen, that’s why you should keep an eye on this only to see a confirmation.
Price is somehow expected to increase in the upcoming period after the breakout above the downtrend line and above a very important dynamic resistance. Personally, I would like to see a minor consolidation here before I will make a decision.
The pair is located right above a major support area and above the lower median line (LML) of the red ascending pitchfork, that’s why it should climb higher as long as it will stay within the ascending pitchfork’s body.
The false breakdown below the lower median line (LML) could attract more buyers, which will drive the rate towards fresh new highs. You can see that the rate has failed to retest the broken downtrend line, signalling that the bulls can take the lead again.
It has also failed to reach and retest the 0.00016832 static support, that’s why we could think of another bullish movement. The next upside target will be at the second warning line (wl2) of the descending pitchfork, it could also be attracted by the 50% Fibonacci line and by the median line (ML).
Conclusion
We may have a great buying opportunity after a retest of the LML or after a failure to retest this dynamic support. You can place your Stop Loss somewhere below the LML and below the 0.00016832 static support.
Binance Coin Price Analysis:BNB/USD dropped and resumed yesterday’s bearish candle. It should drop further if the rate will close below the broken dynamic support levels. The price may resume the bearish movement without a retest of the broken downside obstacles.
You can see (https://www.forex.academy/binance-coin-could-we-sell-this/) where I’ve signalled a bearish movement since May 3, 2018. BNB/USD has managed to break below the warning line (WL1) of the ascending pitchfork, but more importantly, it was the failure to retest the broken line. It has retested only the inside sliding parallel line (SL), but it has closed a lot below it, signalling a bearish pressure.
The rate should drop at least until the downside of 50% Fibonacci line, as long as it will stay below the median line (ML). We have an important downside target at the lower median line (LML) of the descending pitchfork. It will approach and reach the second target only if the crypto market will resume the down move.
BNB/USD could try to test and retest the broken levels before it will drop towards the mentioned targets. A further drop will be invalidated only by a valid breakout above the sliding line (SL). Personally, I believe that it could take out the resistance from the SL if we will close on it.
Conclusion
If you want to go short, you should place a Stop Loss right above the 15.1822017 former high. Tomorrow will be crucial because an aggressive rally could invalidate this trade setup.
ZEC/USD dropped significantly in the last days as expected. The current drop is somehow natural after the false breakout above the downtrend line and after the failure to approach and reach the 50% Fibonacci line again.
The cryptocurrencies are into a down move again after the short-term rebound. Please read my analysis on this crypto (Zcash breakout still in cards) and you’ll notice that I’ve said that the rate will maintain a bullish perspective only if it will stay within the ascending pitchfork’s body, and if it will make a valid breakout from the chart pattern.
The false breakout above the downtrend line has invalidated a further increase and has signalled a reversal on the short term. ZEC/USD is pressuring the lower median line (LML) of the ascending pitchfork. The breakdown needs confirmation, so only a retest of the broken dynamic support will confirm a further drop.
The price could make a sharp drop from now, but it should turn back towards the LML to retest it. A great selling opportunity will appear after a retest of the LML and maybe after a false breakout above the LML followed by a significant drop.
ZEC/USD is expected to drop further if the other major cryptocurrencies will resume the bearish movement.
Conclusion
ZEC/USD is under massive selling pressure and could reach fresh new lows without a retest of the broken LML. You’ll have a great selling opportunity if the rate will come back to retest the broken dynamic because you could place your Stop Loss above a lower high. The next downside target will be at the 173.02 and at the 150% Fibonacci line.
OMG/USD is trading in the red on the Daily chart and could resume the corrective phase in the short term. I want to show you a bullish opportunity if the near-term support levels will hold and if it will reject the price.
The crypto is under massive selling pressure on the short term, but a false breakdown below the near-term support levels followed by an important rally will signal that it could increase at least till the 20.0000 psychological level.
The rate dropped after the failure to reach the median line (ml) of the ascending pitchfork and after its failure to stabilize above the 50% Fibonacci line of the ascending pitchfork. OMG/USD is pressuring the 38.2% retracement level and could pressure the lower median line (lml) as well very soon.
Personally, I believe that the OmiseGO perspective remains bullish on the short term as long as the rate will stay within the ascending pitchfork’s body. You should know that a valid breakdown below the lower median line will attract more sellers which will send the rate much lower.
It will be very important for the price to make only a false breakdown below the lower median line (lml) and to get back within the ascending pitchfork’s body and above the 38.2% retracement level.
Conclusion
You should stay away for now and wait for a confirmation that the price will increase again after the corrective phase. We’ll have a great buying opportunity if the rate will stay above the lower median line (lml) and only if it will make a valid breakout above the 150% Fibonacci line (descending dotted line).
The Crypto Market Rebound: The crypto market has reached an important supply area and now has turned to the downside again. It remains to see how larger the corrective phase will be. Technically, a minor decrease was expected on all cryptocurrencies after the impressive upside movement.
There are all kinds of rumours that said that the crypto market will crash again and will reach fresh new lows. Personally, I still believe that the major cryptocurrencies could resume the upside movement and could reach fresh new highs.
Please take a look at one of my editorials (Is the crypto market sell-off natural?), and you will notice that I have talked about a correction on the cryptocurrencies. The rates need to accumulate more directional energy to be able to resume the upside movement.
All main cryptocurrencies have started an important rebound in the short term, but we still need a confirmation that may increase in the medium to the long-term again. That is why we need a corrective phase followed by an accumulation or maybe an extended sideways movement before we can say for sure that we may have a major upside movement.
I believe that the next major upside movement will be slower because the fundamental factors are very strong. We may have a rough period on the crypto market with all the regulation talks.
You should know that some cryptocurrencies could drop significantly and could die even if the crypto market returns to its bullish condition because not all projects are viable. The cryptocurrencies were driven higher by the bullishness of the overall crypto market, but this could change in the future.
Bitcoin
Bitcoin dropped after another false breakout above the 50% Fibonacci line and after the failure to close above the third warning line. The price will drop much more only if will close and will stabilize below the sliding line (SL1). The rate could move towards the lower median line (LML) and towards the outside sliding line (SL) if the WL3 resistance will hold.
A further increase will be invalidated only by a drop below the outside sliding line (SL). However, we could go long on this crypto after a valid breakout above the WL3 and above the 50% Fibonacci line.
Ethereum
Ethereum has declined after the failure to reach the median line (ML) of the ascending pitchfork. The drop was somehow expected after the impressive breakout above the first warning line (WL1) of the descending pitchfork. The price has come back down to retest the broken WL1 of the descending pitchfork and now could increase again.
We may have another bullish movement as long as the rate stays above the WL1 and the 50% Fibonacci line (ascending dotted line). You should know that we will have a larger upside movement only after a valid breakout above the median line (ML).
Conclusion
You have noticed that the minor retreats were natural in the short term. Right now you don’t have to worry that the crypto market will crash again. Personally, I believe that only the fundamental factors could send the major cryptocurrencies down again. Otherwise, they should push up in the upcoming period.
The WAVES drops like a rock on the short term after another false breakout above a very strong dynamic resistance. Price approaches a strong support right now. It remains to see how it will react when it touches and retests the near-term support levels.
It is premature to talk about a larger drop in the short term as long as the rate is located above some crucial support levels. I said in last weeks report that the crypto marker rebound could be only temporary and it could come back down trying to capture more bullish energy.
We have important corrective movements on all major cryptocurrencies. This retreat is natural and it was expected after the impressive rally. I’ve told you in one of my editorials (Is the crypto market sell-off natural?) that the cryptocurrencies have reached important upside targets and could turn to the downside on the short term.
The WAVES/USD dropped sharply in the last days and now is pressuring the 6.28330036 static support. It should reach and retest the lower median line (LML) as well. A further increase on the Daily chart will be invalidated by a valid breakdown below the outside sliding line (SL) of the ascending pitchfork.
Conclusion
We could go long on this after a false breakdown below the mentioned support levels and after a retest. The first upside target will be at the 50% Fibonacci line. Only a valid breakout above the 50% line will signal a further increase towards the median line (ML).
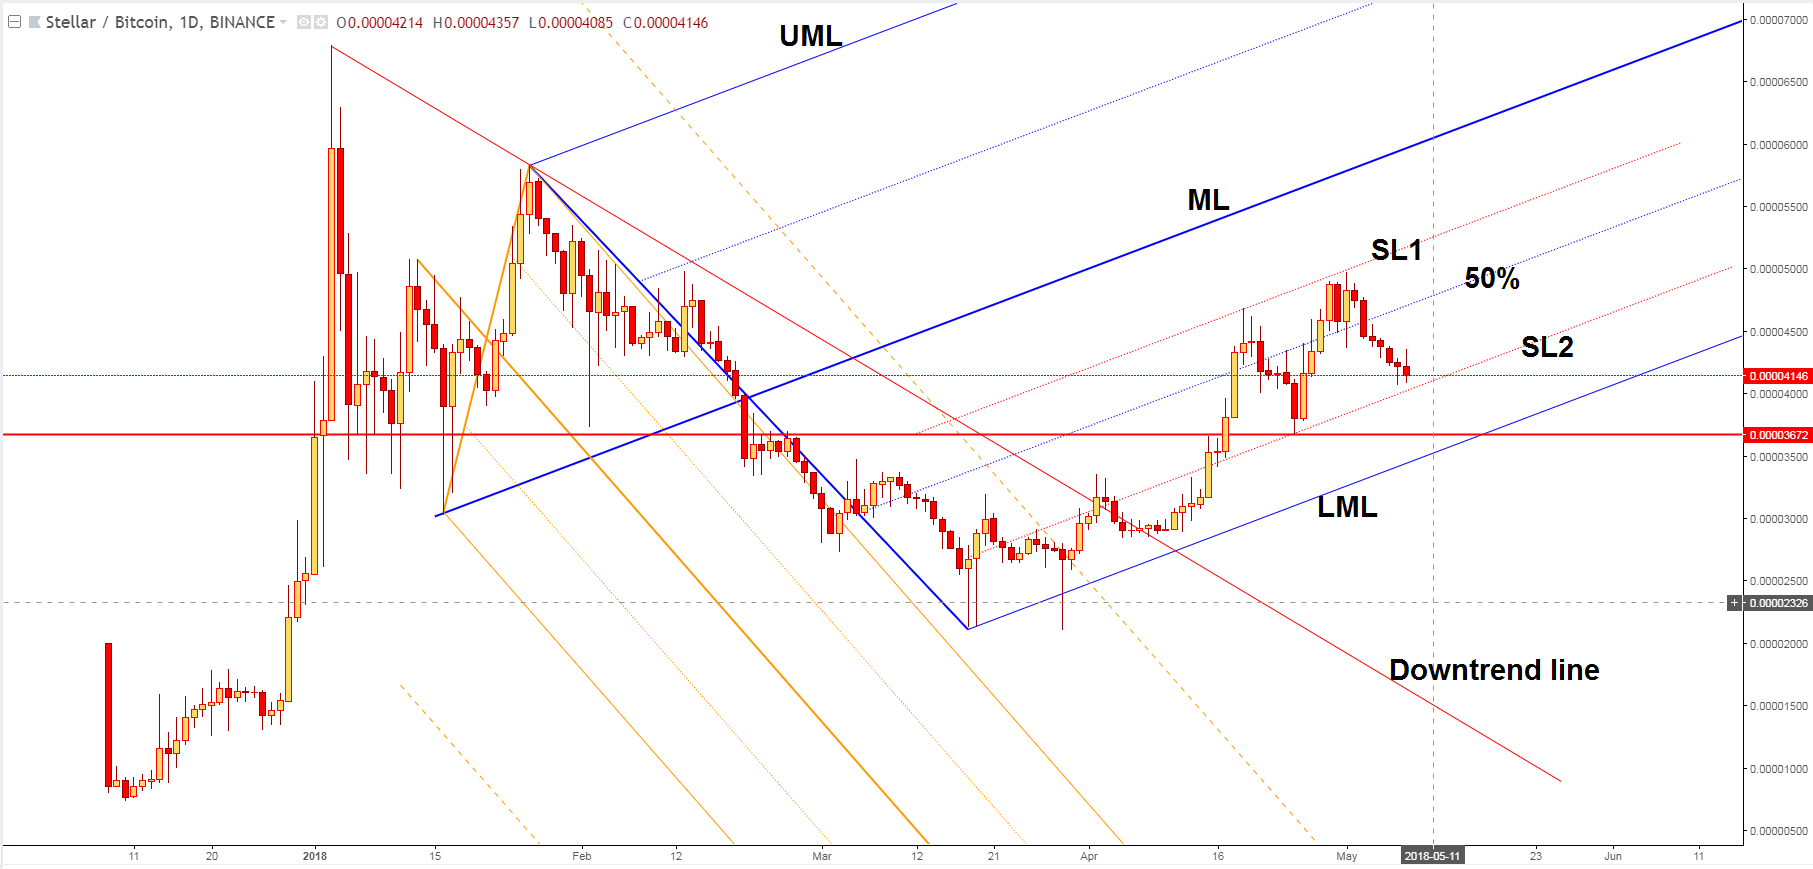
The XLM/BTC drops significantly after another false breakout above a dynamic resistance. It almost hits a dynamic support. A valid breakdown will confirm a further correction in the short term. Right now it will be better to stay away from this pair because we don’t have a great trading opportunity, but I really hope that we’ll have one very soon.
The XLM/BTC almost reaches the sliding parallel line (SL2) of the ascending pitchfork. A false breakdown below this dynamic downside obstacle followed by an important increase will signal a further increase in the upcoming days
However, a valid breakdown will send the rate to at least the lower median line (LML) of the ascending pitchfork. Support can be found at the 0.00003676 former low. A further increase will be invalidated after a breakdown below the lower median line (LML).
We still have a bullish perspective as long as the rate stays within the ascending pitchfork’s body. It will approach and reach the median line (ML) only if it will make a valid breakout above the sliding line (SL1) of the ascending pitchfork.
Personally, I believe that the rate will take out the support from the lower median line (LML) if will reach it and if will close on it.
Conclusion
I still believe that the crypto pair could increase in the upcoming period if will stay above the SL2. A drop below it will signal a high selling pressure and a larger drop. You could try to buy the retreat if the price will stay above the SL2.
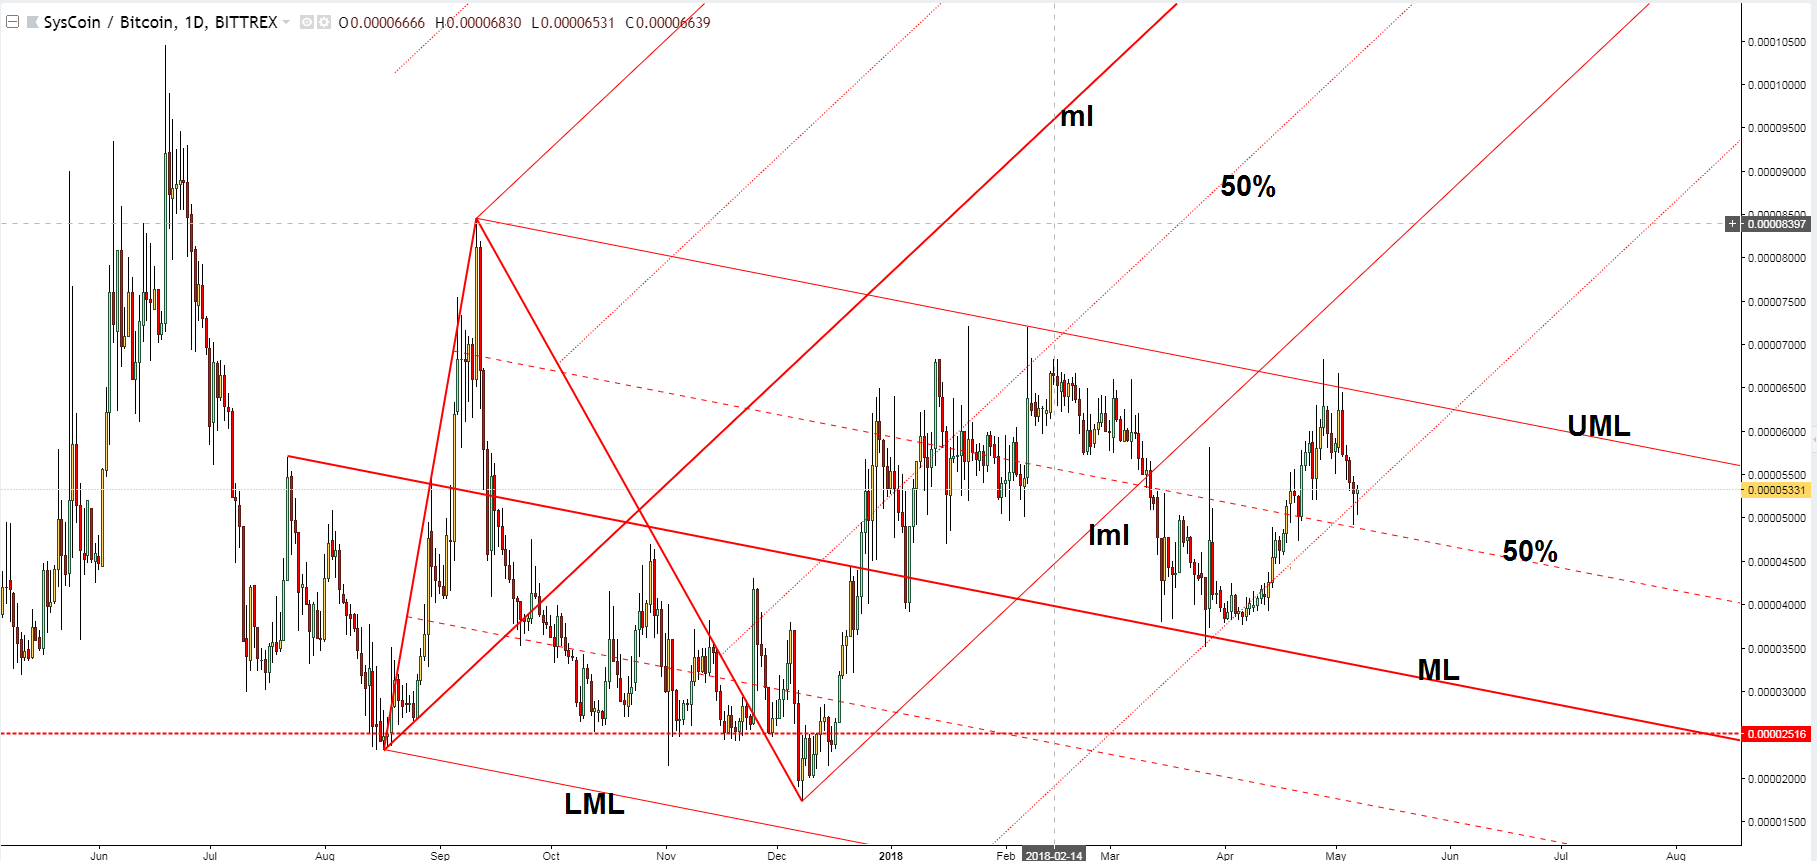
The SYS/BTC dropped aggressively in the last days and has reached an important support level. The bearish momentum was paused for the moment and is premature to talk about a significant rebound at this moment. Right now will be better to stay away because we don’t have a clear direction, but I really hope that we’ll have a great trading opportunity very soon.
The SYS/BTC has made two false breakouts above the upper median line (UML) of the descending pitchfork. The current drop is natural but remains to see how long this could be. We may have a perfect buying opportunity from above the upper median line (UML) of the descending pitchfork.
So, a rebound from here and a valid breakout from the descending pitchfork’s body will signal a further increase in the upcoming period. You can see that the 150% Fibonacci line represents a very strong dynamic support and could stop the retreat.
A drop below the 150% Fibonacci line will signal a further drop, and it could slip much below the 50% Fibonacci line as well, and it could be attracted by the median line (ML) again.
Price moves in range on the daily chart, that’s why only a valid breakout from the descending pitchfork’s body will signal a further increase and a breakout from the extended sideways movement.
Conclusion
The Syscoin dropped significantly after the false breakouts above the UML. Technically, it was somehow expected to climb much higher after the several failures to reach and retest the median line (ML) of the descending pitchfork. We’ll have an important upside target at the lower median line (lml) of the ascending pitchfork.
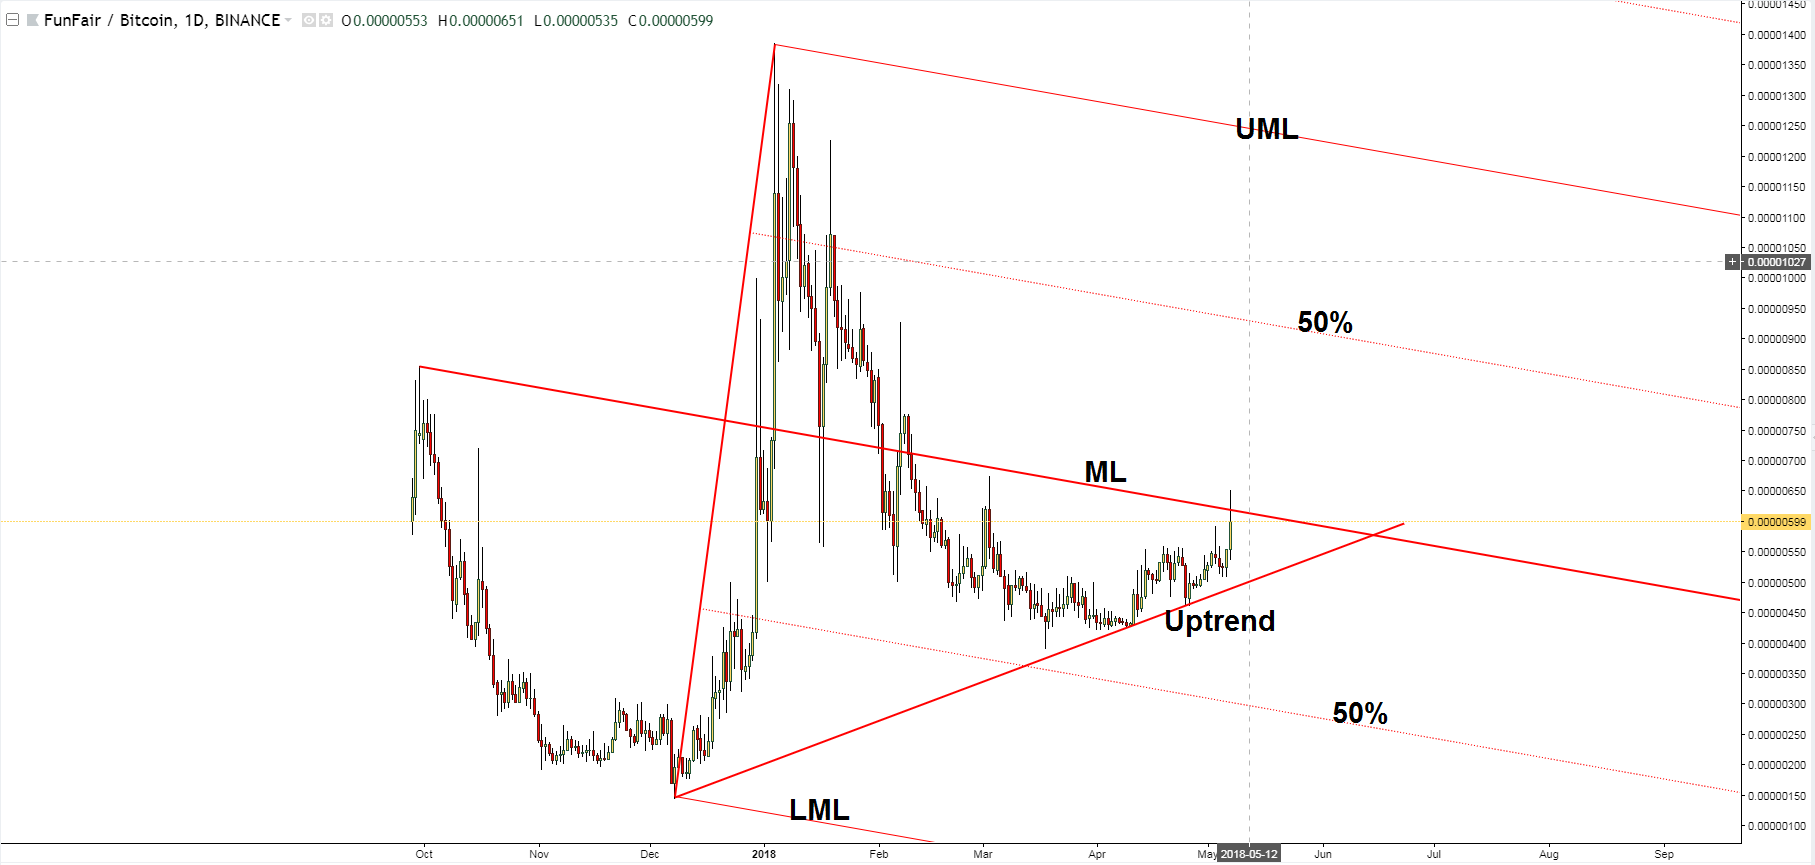
The crypto pair increased significantly today and has jumped above a crucial dynamic resistance. It remains to see what will happen because the price failed to stay above this obstacle. You should stay away, for now, to see if this will be a valid breakout.
We may have a great buying opportunity if the FUN/BTC will make a valid breakout above the near term dynamic resistance.
The FUN/BTC has finally managed to make a breakout above the median line (ML) of the major descending pitchfork, but it remains to see if this will be a valid one. Price has tested and retested the uptrend line and now is fighting hard to close and stabilize in the buyer’s territory.
A valid breakout above the median line (ML) will bring us a great buying opportunity with a Stop Loss below the uptrend line.
You should know that a failure to make a valid breakout will signal an overbought and exhaustion in the short term. This situation will send the rate towards the downside 50% Fibonacci line very quickly. The perspective will remain bullish as long as the rate stays above the uptrend line.
Conclusion
You can go long on this crypto pair after a valid breakout and after a minor increase. The Stop Loss should be placed below the uptrend line, while the first upside target will be at the upside 50% Fibonacci. The major upside target will be at the upper median line (UML) of the descending Pitchfork.
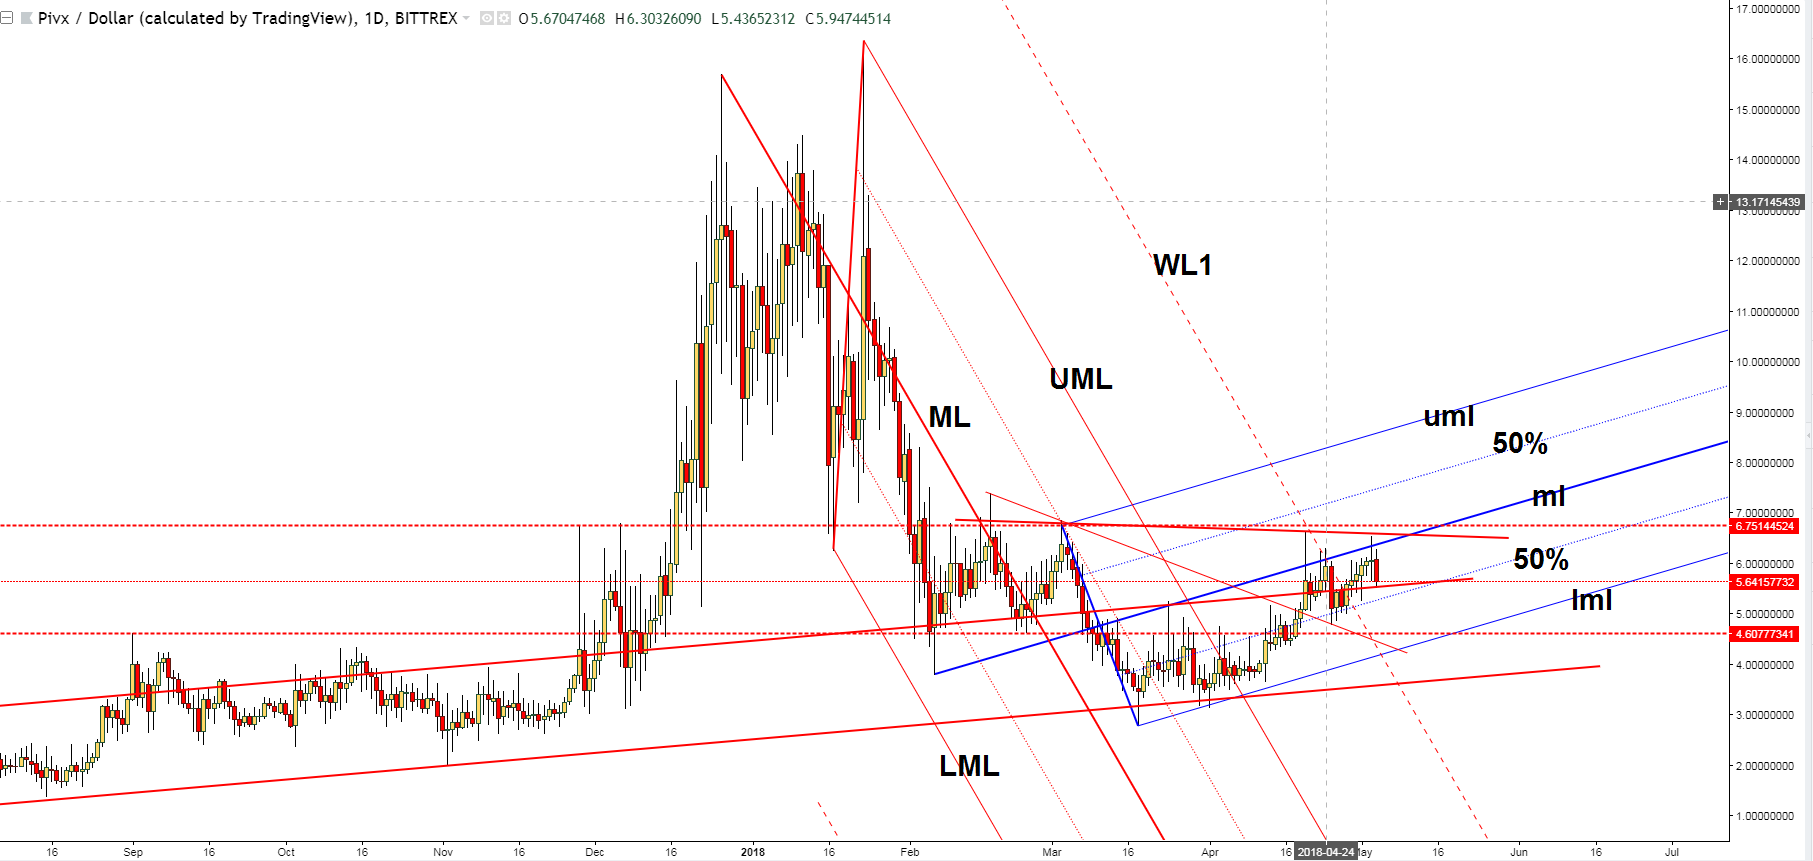
PIVX/USD dropped sharply today and failed to make a resumption of the bullish movement. The current drop could invalidate a further increase even if the perspective remains bullish on the short term.
Today’s drop has invalidated the latest day’s gains, but it could be stopped by the near-term support levels. We may have a great buying opportunity only if the rate makes a valid breakout above the near-term resistance levels.
You can see that the rate made another false breakout above the median line (ml) of the minor ascending Pitchfork. Technically, it was expected to climb much higher after the breakout above the first warning line (WL1) of the descending Pitchfork.
It could come back down to test and retest the 50% Fibonacci line (ascending dotted line) of the ascending pitchfork. Only a drop below this dynamic support will send the rate much lower in the short term.
The perspective will remain bullish as long as the rate is trading within the ascending pitchfork’s body. Only a breakdown will signal a further drop in the upcoming weeks and months.
Conclusion
You should buy it only after a valid breakout above the minor red line, above the median line (ml) and above the 6.75144524 static resistance level. The next upside target will be at the upper median line (UML). However, it will increase much more if the Inverse Head and Shoulders will be validated.
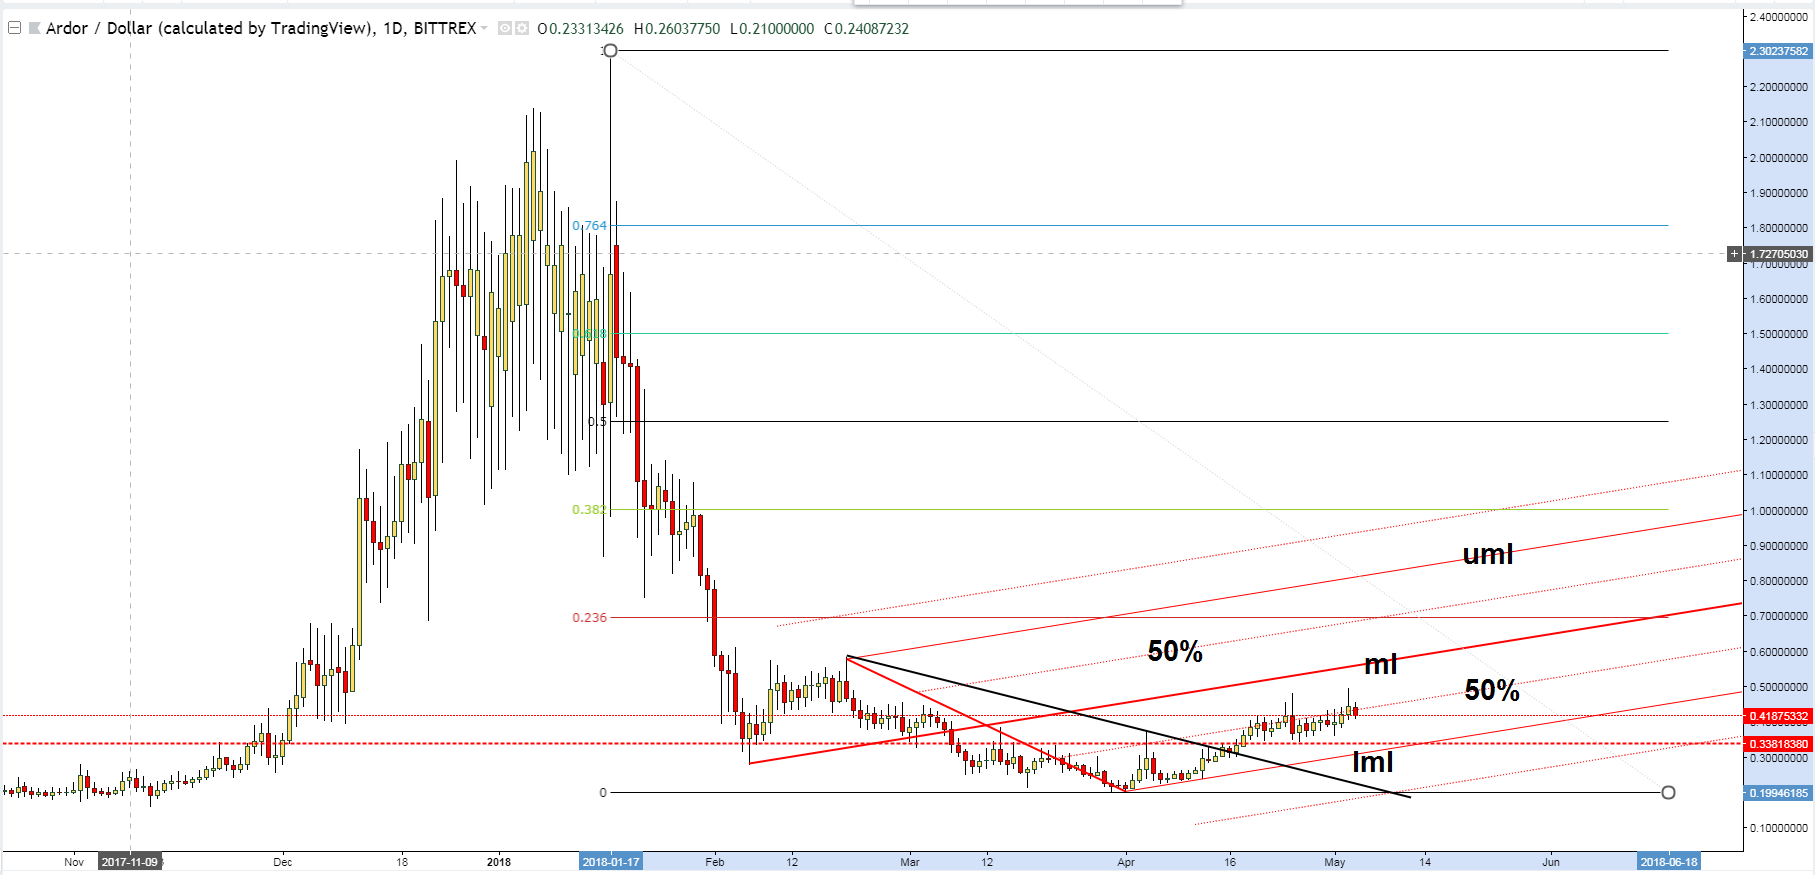
The ARDR/USD dropped today and could invalidate a further increase. It remains to be seen what will really happen in the upcoming days because the perspective is still bullish in the short term as long as the rate is trading above some very important support levels.
We may have a great buying opportunity if the rate will decrease a little to retest the near-term support levels.
You can see on the Daily chart that the rate has made another false breakout above the 50% Fibonacci line (ascending dotted line) of the ascending pitchfork signalling that we may have a minor drop. It could come back down to test and retest the lower median line (lml) and the 0.33818380 static support.
We could take a long position from the mentioned levels if the rate stays above them after a retest. However, we could also buy this crypto after a valid breakout above the 50% Fibonacci line. A valid breakout will signal a potential increase above the median line (ml).
The perspective remains bullish as long as the rate stays above the 0.3381 level and the lower median line.
Personally, I was expecting to see an important upside movement after the retest of the lower median line (lml) of the ascending Pitchfork, but the 50% Fibonacci line represents a very strong dynamic resistance.
Conclusion
You can buy the ARDR/USD from above the 50% Fibonacci line after a valid breakout or after a retest of the lower median line (lml) of the ascending pitchfork. We have an important upside target at the 23.6% retracement level and higher at the upper median line (uml).
The SNT/USD is trading in the green right now but it remains to see how long for, after the last false breakout above a crucial resistance level. Price maintains a bullish perspective in the short term as long as it is trading above the crucial support line.
The crypto price went up and is signalling that the bulls are still present in the game after the last drop. We still have to wait for a confirmation that the rate will increase further.
The SNT/USD has once again failed to make a valid breakout above the downside 50% Fibonacci line of the ascending Pitchfork and now has come back down to retest the 150% Fibonacci line.
The price has made a false breakdown below the 150% Fibonacci line and has closed above it, signalling that we could have further price increases. The rate approaches the 0.18600 previous highs. It will reach it only after a valid breakout above the lower median line (LML).
A larger upside movement will be confirmed by a valid breakout above the downside 50% Fibonacci line (ascending dotted line between the ML and the LML). If this scenario takes shape, then the rate would jump much above the median line (ML) as well, with a target at the upper median line (UML).
Conclusion
If you are long on this crypto, you should keep your position as long as the rate stays above the 150% Fibonacci line. We have an important upside target at the 23.6% retracement level. A valid breakout above this level will really signal a broader upside movement.
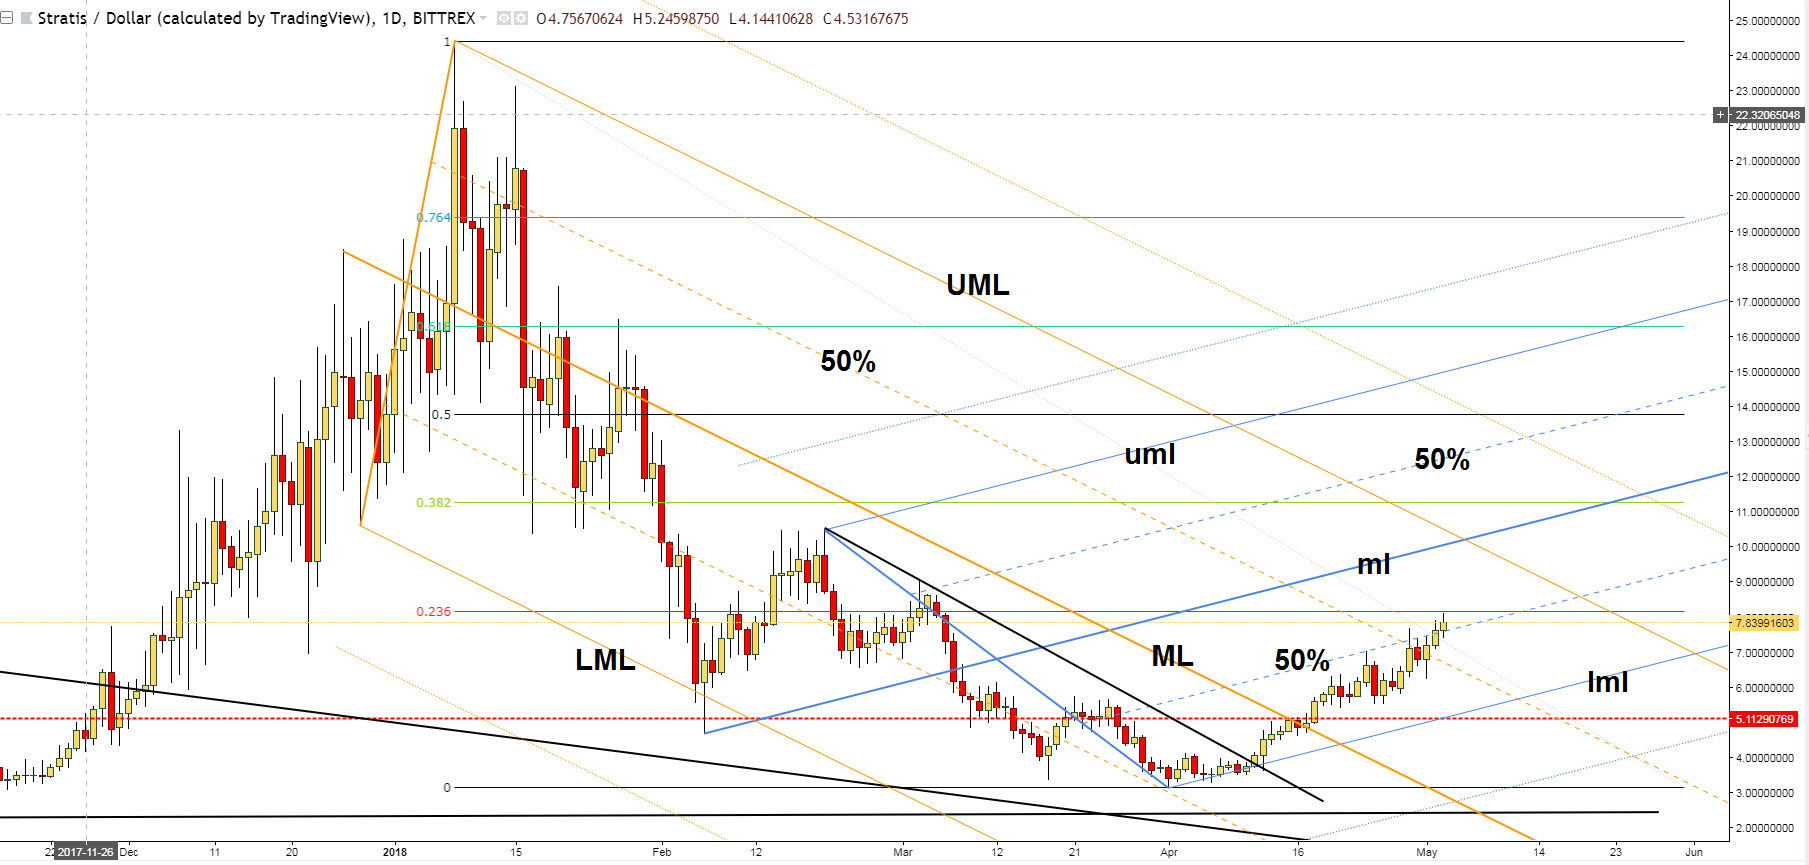
Stratis Coin Price Prediction: STRAT/USD rose up to 8.09944618 today and passed above 7.90072126, yesterday’s highs. The crypto has increased by 30.24% in the last 7-days, signalling that the buyers are very strong. STRAT/USD has managed to climb above a strong dynamic resistance line but it remains to see if this will be a valid breakout.
It is close to reaching a very strong static resistance, that’s why we have to stay away from this crypto for now because only a valid breakout will confirm a further increase towards the 10.00000000 psychological level.
STRAT/USD has closed above the 50% Fibonacci line in yesterday’s trading session signalling that we may have a valid breakout. A valid breakout above the 23.6% retracement level will validate a further increase towards the median line (ml) of the ascending pitchfork and the upper median line (UML) of the descending pitchfork.
Only an aggressive bullish momentum will drive the rate towards the confluence area formed between the median line (ml) with the UML. The confluence area acts as a magnet and attracts the price. The several retests of the lower median line (lml) have signalled an increase at least till the median line (ml). So, we need a valid breakout above the WL1 and above the median line (ml) to be convinced that the rate will move towards the 38.2% retracement level and towards the next upside targets.
Conclusion
The pair will maintain a bullish perspective as long as it is trading within the ascending pitchfork’s body. If you want to go long, you can place a Stop Loss below the 5.49432004 low.
Crypto Picks Review: EOS/USD increased significantly after the breakout above the sliding line (SL1) of the minor ascending Pitchfork as expected (EOS Bullish Perspective),(EOS reached a major target, now what?). It has increased as much as 23.0290 level where it has found a very strong resistance.
The price dropped significantly and failed to stay above the second warning line WL2 and above the 250% Fibonacci line. The rate decreased today, signalling a selling pressure after the failure to retest the 250% Fibonacci line. EOS/USD failed to stay above the 18.6850 former high and now could drop further in the short term.
It could increase and approach the previous high only if it makes a valid breakout above the 250% Fibonacci line. The minor drop is natural and was somehow expected after the impressive rally. A valid breakdown below the first warning line (wl1) will confirm a further drop.
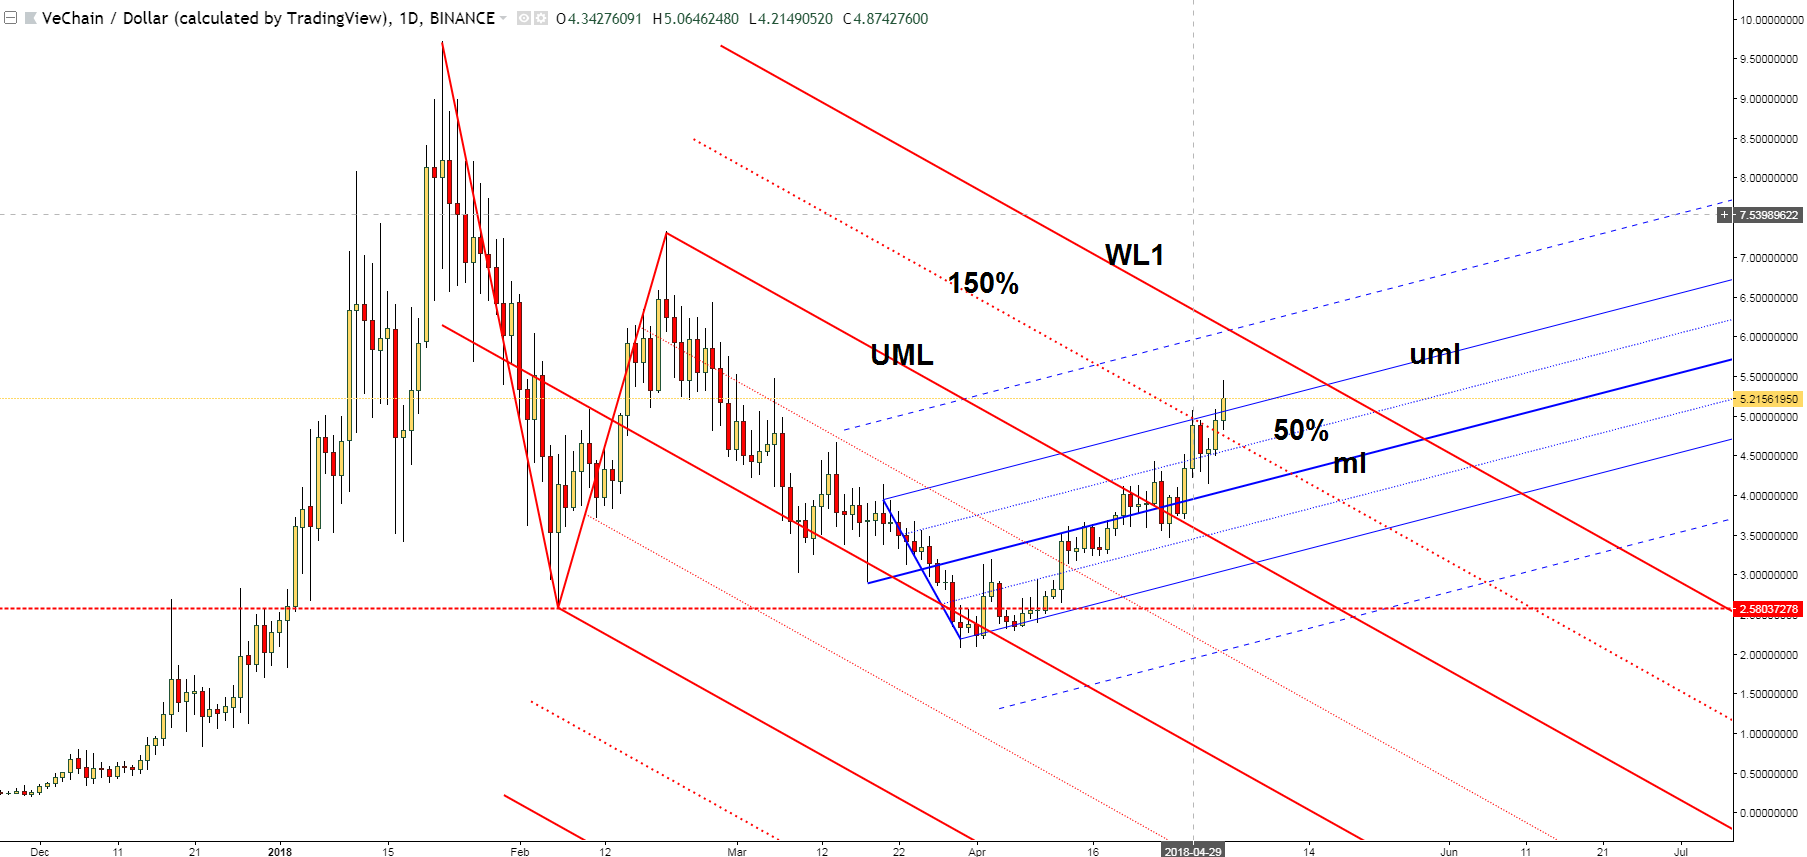
VEN/USD
The VEN/USD has increased as expected (VeChain broader increase validated) and has reached an important upside target. The rate is bullish and is targeting other major upside levels.
The next upside targets will be at the first warning line (WL1) of the descending Pitchfork and higher at the first warning line (wl1) of the minor ascending pitchfork. This scenario will happen as long as the rate will stabilize above the broken upper median line (uml) of the minor ascending pitchfork. Only a breakout above the next targets will signal a larger upside movement.
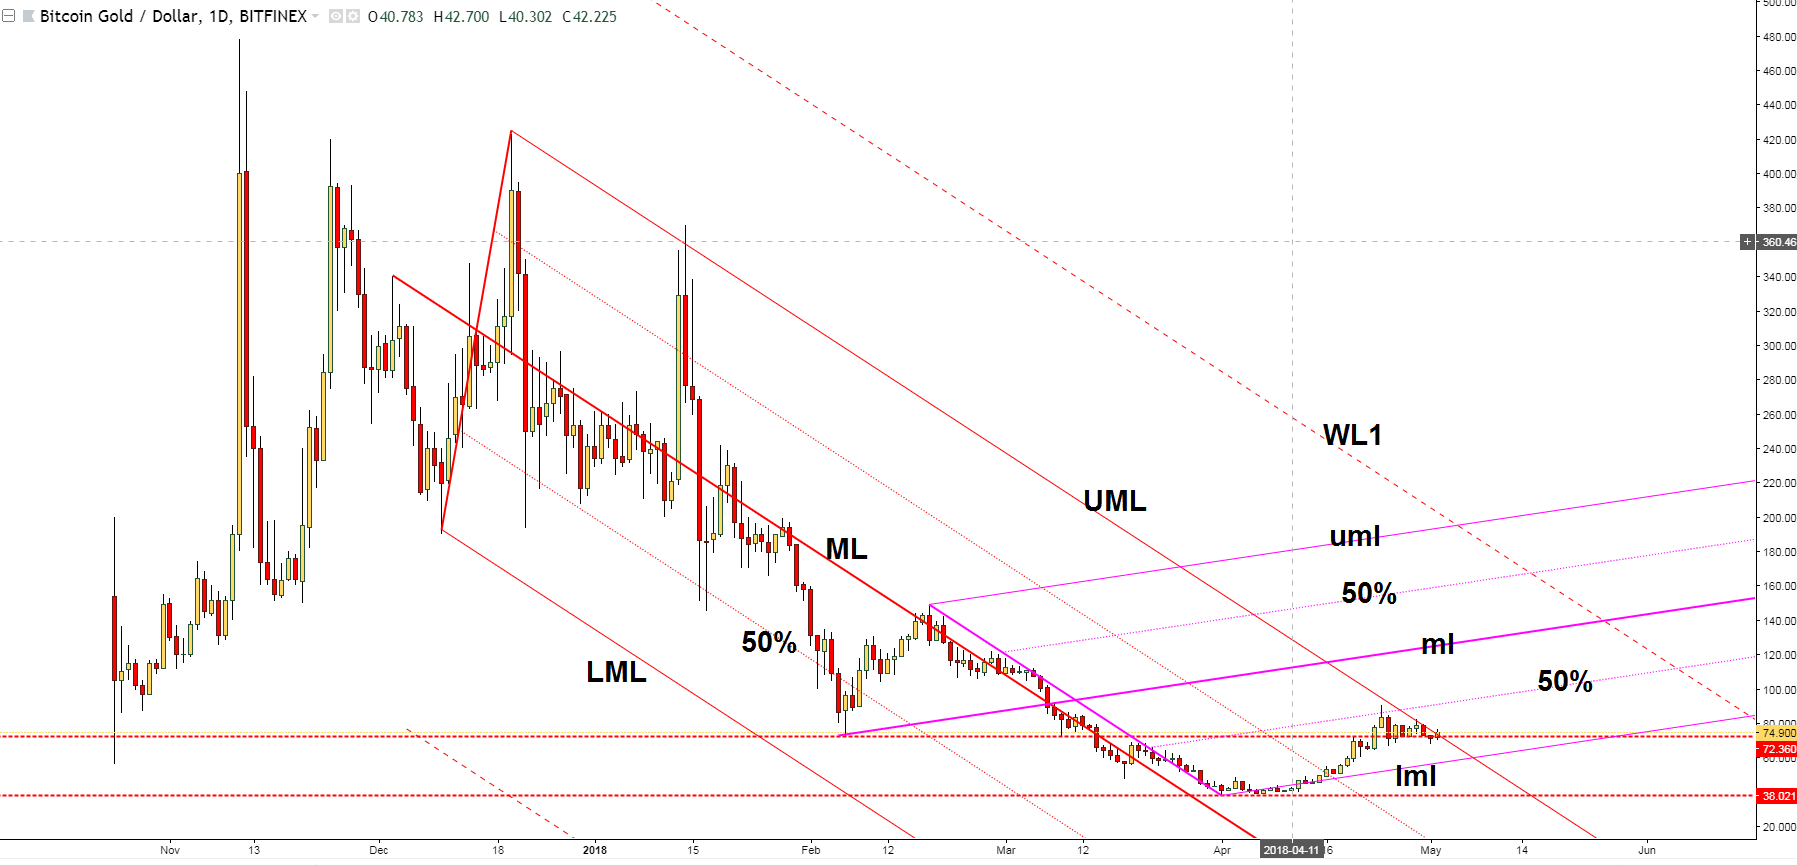
The Bitcoin Gold (BTG/USD) went up a bit today and is trying to make a valid breakout above a critical dynamic resistance. Price has found a temporary resistance in the short term, that’s why it went slightly down. It is trading at 74.900 level and is located above some very important support levels, but we still need a confirmation for a larger rebound.
The BTG/USD has found a bottom right above the 38.000 psychological level after the failure to reach and retest the median line (ML) of the descending Pitchfork. The price has shown some oversold signs after several false breakdowns below the mentioned median line (ML).
The crypto slipped below the lower median line (lml) of the ascending pitchfork but failed to stay there signaling a bullish movement. It has found strong resistance at the 50% Fibonacci line (ascending dotted line) of the ascending pitchfork and now has decreased a little to accumulate more directional energy.
A valid breakout above the upper median line (UML) of the descending Pitchfork will signal an increase at least till the 50% Fibonacci line. Only a valid breakout above this line will confirm an advance towards the median line (ml) and the first warning line (WL1) of the descending pitchfork. A significant increase will be invalidated by a valid breakdown below the lower median line (lml).
Conclusion
Bitcoin Gold (BTG/USD) could double its current value as long as will stay within the ascending pitchfork’s body. A valid breakout above the 50% will signal that the price is strongly bullish.
The LTC/BTC moves sideways on the short term signaling an oversold. It seems like that the corrective phase could be completed after the failure to approach and retest a dynamic support. It is trading at 0.016167 level, right above the 0.015669 crucial support level.
It remains to see if this will be an accumulation or a distribution movement. Price is narrowing, but I really hope that we’ll have a fresh trading opportunity soon.
The LTC/BTC could drop a little to test and retest the 0.015669 static support after another failure to close above the median line (ml) of the ascending pitchfork. Price has failed to drop towards the 50% Fibonacci line signaling that the bears could be exhausted. I’ve drawn a sliding parallel line (sl), the rate has failed to approach and retest this level so we could think of another bullish movement.
However, the rate could continue to move sideways in the upcoming days before will decide what will do next. We have a crucial support at the 0.015669, at the sliding line (sl) and at the 50% Fibonacci line of the ascending pitchfork. The rate could bounce back as long as it stays above these downside obstacles.
Personally, I believe that a valid breakout above the median line (ml) of the descending pitchfork it will signal another significant leg higher.
Conclusion
You can go long after a valid breakout above the median line (ml). You can place targets at the median line (ML) and higher at the upper median line (uml). Only a breakout above the second target will confirm an increase above the 0.025004 swing high.
A potential increase will be invalidated by a valid breakdown below the 50% line of the ascending pitchfork and below the sliding line (sl) of the descending pitchfork.
NEO/BTC decreased a little today and failed to resume the yesterday’s minor increase. Right now is premature to talk about the next move because is located between two crucial obstacles. It remains to see the breakout direction.
The crypto pair is trading at 0.008192 level after the failure to stabilize above the 0.009000 psychological level. Price has shown an overbought signal, but we still need a confirmation that the rate will turn to the upside and will reach new highs.
The NEO/BTC has found strong support at the 61.8% retracement level. It has retested it showing that the buyers could take the lead again in the short term. Price has managed to breakout from the descending pitchfork’s body and above the first warning line (WL1).
Unfortunately, the crypto pair failed to stabilize above the downside 50% Fibonacci line (ascending dotted line) and above the 50% Fibonacci level signaling a minor exhaustion.
The rate has tested and retested the broken warning line (WL1), and now he’s moving away. NEO/BTC could come down to retest the sliding line (SL) before will try another breakout above the 50% level and above the 50% Fibonacci line. A breakdown from the red ascending pitchfork’s body will confirm a further drop.
Conclusion
You could go long on this crypto pair after a valid breakout above the 50% Fibonacci line (ascending dotted line). The near-term target will be at the median line (ML), while the major upside target will be at the upper median line (UML) and the 0.015200 highest high.
ZEC/BTC changed little today and seemed undecided on the short term. The cryptocurrency pair dropped in the last two days as the crypto market crashed. It remains to see what will really happen in the upcoming days because the rate is still under some pressure.
We may have a great buying opportunity if the rate will come back down to test and retest some very important support levels. It is trading at 0.03192501 after the failure to reach the 0.03500000 psychological level.
The last corrective phase was expected after the failure to stabilize above the median line (ML) of the ascending pitchfork and after the valid breakdown below the downside 50% Fibonacci line. ZEC/BTC increase a little, but this could be only temporary if will fail to stay above the median line (ml) of the minor descending pitchfork.
The pair has shown an oversold when has failed to approach and reach the lower median line (lml) of the minor descending Pitchfork.
We’ll have a great buying opportunity if the price makes a minor consolidation in the upcoming days and if will continue to stay above the median line (ml) and above the first warning line (WL1) of the ascending pitchfork.
Conclusion
The rate is somehow expected to increase further after the breakout above the median line (ml). Price has come to retest the broken dynamic resistance. The rate could increase from here and could jump above the 50% Fibonacci line (descending dotted line), but personally, I would like to see a minor decrease and a consolidation before will climb much higher.
The DASH/BTC increased today and recovered a little after the yesterday’s massive drop. The pair remains under selling pressure in the short term because it is still located below two very important resistance levels. The minor retreat was natural after that important rebound. Right now we should wait for a confirmation that the rate will resume the upside movement.
The rate has come down to test and retest a broken dynamic resistance (resistance has turned into support), and now we could see another breakout attempt.
DASH/BTC has found strong resistance at the confluence area formed between the first warning line (WL1) with the 50% Fibonacci line (ascending dotted line) of the ascending pitchfork. It has come back down to test and retest the broken downtrend line and now is fighting hard to jump higher again.
The rate has started an increase after the failure to retest the upper median line (uml) of the former descending pitchfork. I’ve drawn an ascending Pitchfork hoping that I’ll catch a significant upside movement.
You can go long on this crypto pair only if the rate will increase and will make a valid breakout above the downside 50% Fibonacci line (ascending dotted line). The first upside target will be at the median line (ML) of the ascending pitchfork.
Conclusion
DASH/BTC will move towards the ML and towards the upper median line (UML) only if will make a valid breakout above the 50% line. The Stop Loss could be placed somewhere below the 0.04853320 level.
VeChain increased significantly today and erased the last day’s minor drop. It has finally managed to jump in the buyer’s territory, so we should have a further increase. The next hours could be crucial because we still need one more confirmation that it will jump much above the 5.0000000 psychological level in the upcoming period.
VEN/USD has finally made an aggressive breakout above the upper median line (UML) of the descending Pitchfork and now approaches the 50% Fibonacci line. It should climb towards the upper median line (uml) of the minor ascending Pitchfork and the first warning line (WL1) of the major descending Pitchfork.
The perspective will remain bullish on the Daily chart as long as the price stays within the ascending pitchfork’s body. The crypto could increase without a broken upper median line (UML) retest. You can notice that its price has been pressing the UML in the last days. However, it could still retest the median line (ml) of the ascending pitchfork in the upcoming days because it could try to capture more directional energy. A significant retreat could appear if the crypto market crashes again.
An important upside movement will be confirmed if the price gets enough directional energy to close above the 4.20381996 high. VEN/USD could be attracted by the confluence area formed between the upper median line (uml) with the150% Fibonacci line. A valid breakout will validate a further increase towards the WL1 of the major descending pitchfork.
Conclusion
If you go long on this crypto, you should place a Stop-loss somewhere below the lower median line (lml) of the ascending pitchfork. Technically, it is expected to double its value in the upcoming months, so it should approach and reach the 8.0000000 level again.
Dashcoin (DSH) increased by 7.48% today and by 40.26% in the last 7-days, signaling that the bulls are in full control. The rate has reached an important dynamic resistance and now has slipped lower in the last hours. The perspective is bullish on the short term so we may see the crypto at new highs soon.
DASH increased significantly after the valid breakout above the downtrend line and now is pressuring the 50% Fibonacci line (ascending dotted line). The perspective remains bullish as long as the rate stays within the ascending pitchfork’s body and most important above the outside sliding parallel line (SL).
Technically, it should be attracted by the median line (ML) of the ascending pitchfork which acts like a magnet. The major upside target is at the upper median line (UML), but we should have another retreat before the rate moves towards this upside obstacle.
Right now you should stay away from this crypto because is too higher to buy it at this moment. We may go long again after another minor correction. It remains to see if the correction will come now or after will reach the median line (ML).
Technically, it should approach and reach the $700 level in the upcoming period as long as it stays above the outside sliding line (SL).
We had a great buying opportunity after the rate has escaped from the minor consolidation. It has failed to retest the lower median line (LML) signaling a high bullish pressure. A valid breakout above the 50% Fibonacci line will confirm a further increase towards the median line (ML). Meanwhile, a false breakout or a failure to touch this line will send the rate towards the lower median line (LML) and the sliding line (SL) very quick.
Conclusion
You should stay away for now because we don’t have a trading opportunity at this moment. Another minor corrective phase will give you the chance to go long. You should place a Stop Loss somewhere below the sliding parallel line (SL).