On Wednesday, the dollar rose versus its peer currencies as a risk spread ahead of the British parliament’s vote on the Withdrawal Agreement Bill, which will reflect light on when and how Britain will exit the Eurozone.
The British Pound currency was found on the selling track, although Prime Minister Boris Johnsons Brexit bill gained the parliamentary support, the government timeline of just three-days discussion on the bill was rejected.
The European Union Consumer Confidence is scheduled to release at 14:00 GMT. Hence, the European Central Bank, Andrea Enria, is expected to deliver the speech at an event in Madrid at 08:45GMT.
Economic Events to Watch Today
Let’s took at these fundamentals.
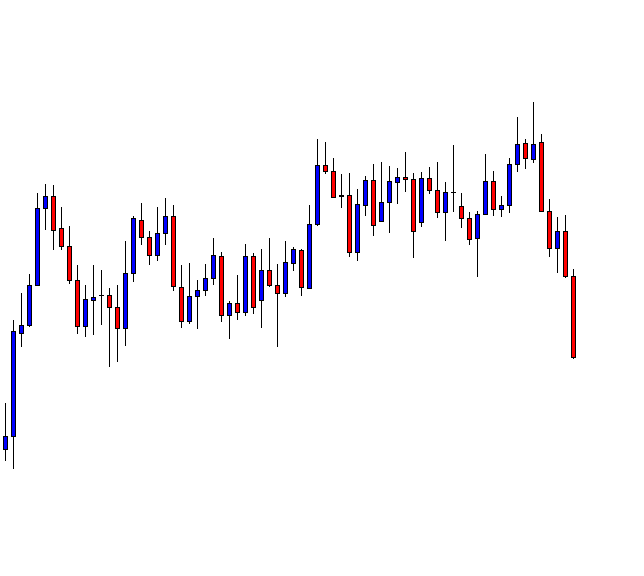
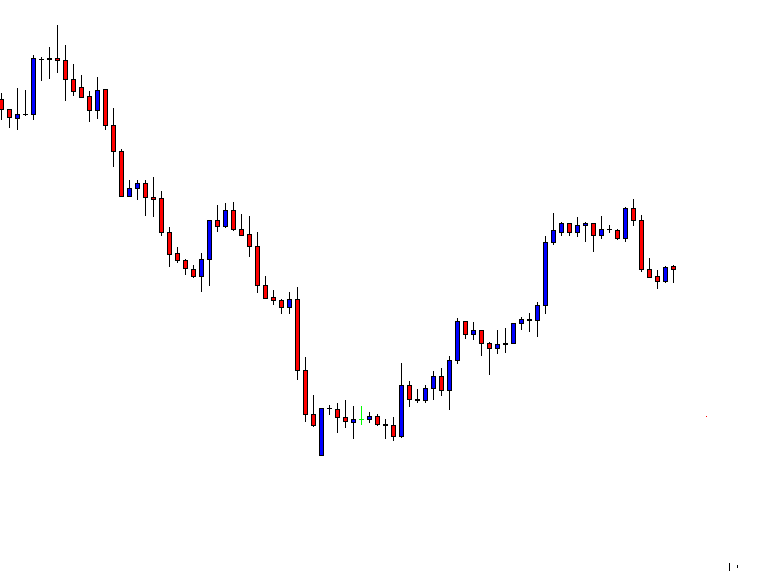
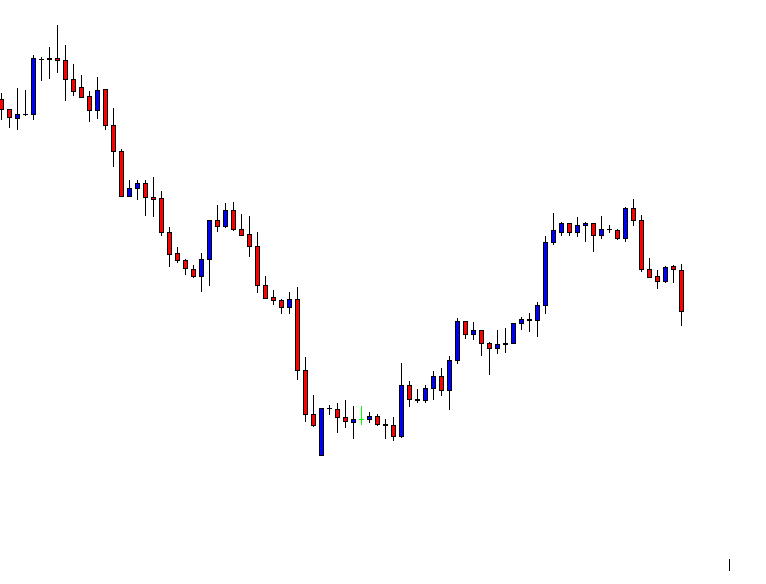
GBP/USD– Daily Analysis
The GBP/USD currency pair came under pressure, and the pair is currently trading below the 1.2850. As well as, the pair failed to hit the critical support range on Tuesday, mainly due to Brexit uncertainty and delay. The 50-hour and 100-hour Moving Averages are found at 1.2940 and 1.2905, respectively.
The British Pound currency was found on the selling track, although Prime Minister Boris Johnsons Brexit bill gained the parliamentary support, the government timeline of just three-days discussion on the bill was rejected.
The chances of Britain departing the European Union before the deadline date of October 31 has dropped sharply, mainly due to parliamentary failure.
On the other hand, the headline came from the Prime Minster Boris Johnson office said that if the European Union agree to a delay until January, then the only way to shift from Britain’s Brexit crisis is a new election.
Forecast view, the ongoing uncertainty regarding Brexit could continue to push the GBP lower. Moreover, the pair is trading well below the 100-hour Moving Average for the 1st time since October 11.
It should be noted that the greenback may gain some haven buying due to the risk-off sentiment in the equity markets and trade uncertainty.
Daily Support and Resistance
S3 1.264
S2 1.278
S1 1.2839
Pivot Point 1.292
R1 1.2979
R2 1.306
R3 1.32
GBP/USD– Trading Tips
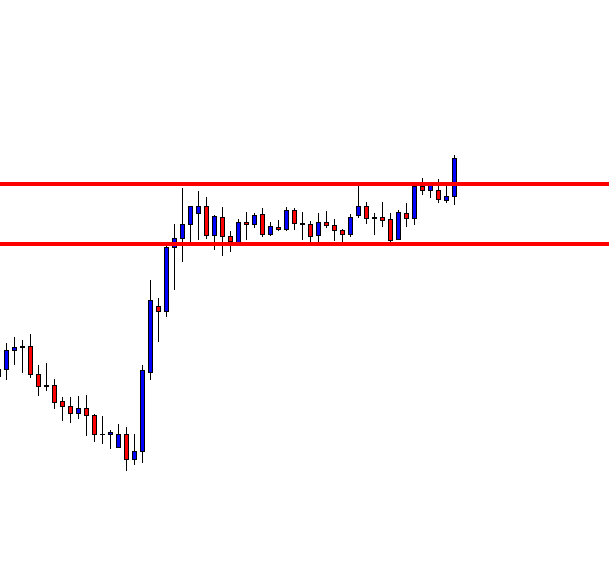
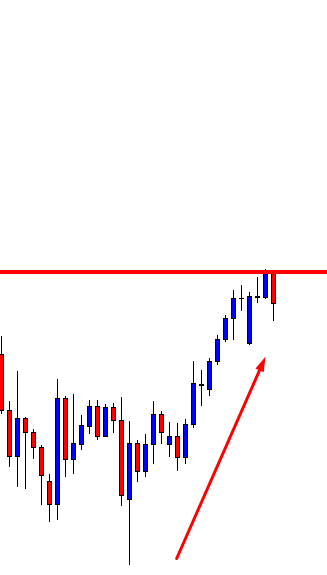
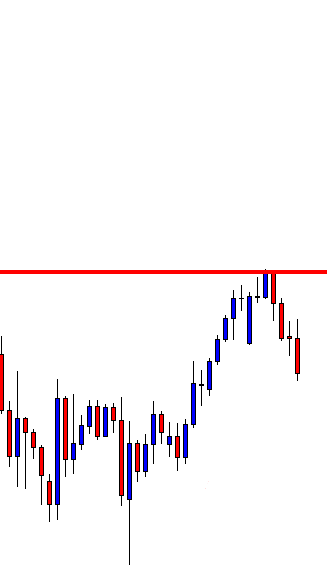
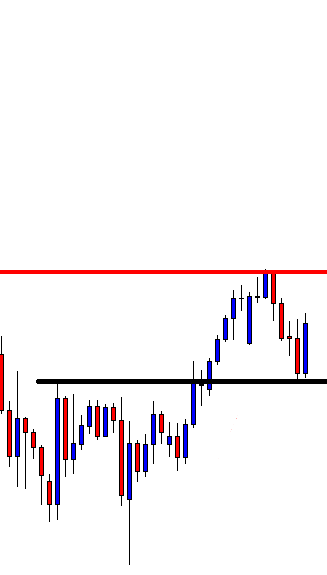
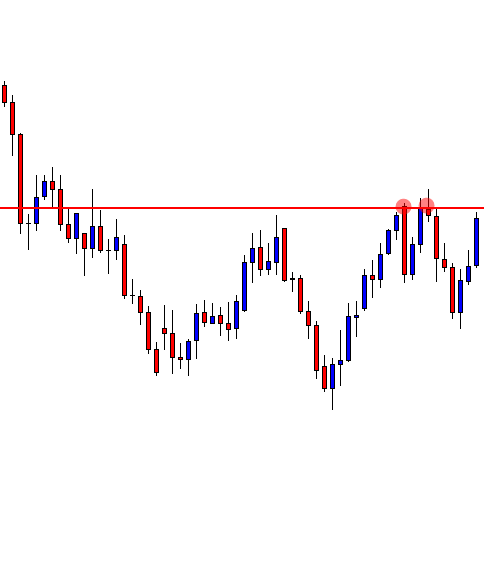
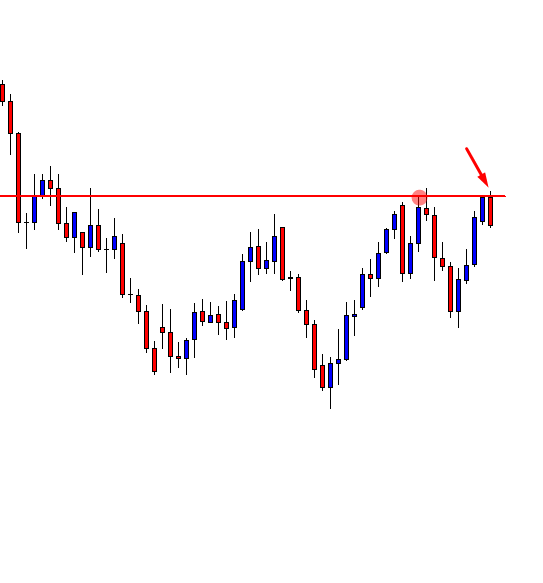
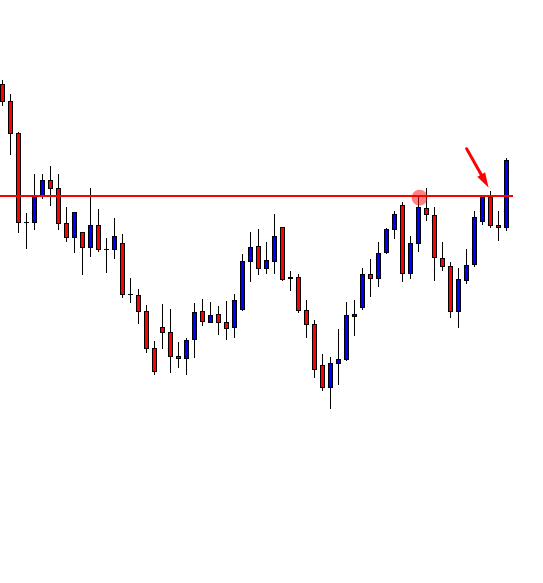
The GBP/USD has violated the bullish channel, which was supporting the pair around 1.2945. The formation fo a bearish engulfing candle is suggesting chances of a bearish reversal in the GBP/USD pair.
On the lower side, the Sterling may find support at 1.2785 level, which also marks a double bottom on the 4-hour chart. Besides, the resistance stays at 1.2945 level. Consider staying bearish below 1.2920 today.
EUR/USD – Daily Analysis
During the early Asian session, the EUR/USD currency pair hit the bearish track, having gained acceptance below the 100-day M.A. yesterday. The EUR currency came under selling pressure, mainly due to the decline in the GBP currency as the Brexit obstacle.
If talking about the past movement of EUR, Brexit certainty has sent the shared currency above the 100-day Moving Average on October 18.
On the technical side, the EUR/USD currency pair found on the inverted hammer on Monday and ended well below the inverted hammers low of 1.1139 on Tuesday.
So, the EUR currency could drop further, notably if the German ten-year bond yields extend Tuesdays 4-basis-points decline to -0.38%.
Moreover, the greenback may gain some haven buying, adding to the bearish pressures near the EUR/USD currency due to the risk-off sentiment in the equity markets.
On the other hand, the European Union Consumer Confidence is scheduled to release at 14:00 GMT. Hence, the European Central Bank, Andrea Enria, is expected to deliver the speech at an event in Madrid at 08:45GMT.
Daily Support and Resistance
S3 1.1056
S2 1.1096
S1 1.1113
Pivot Point 1.1135
R1 1.1153
R2 1.1175
R3 1.1214
EUR/USD – Trading Tips
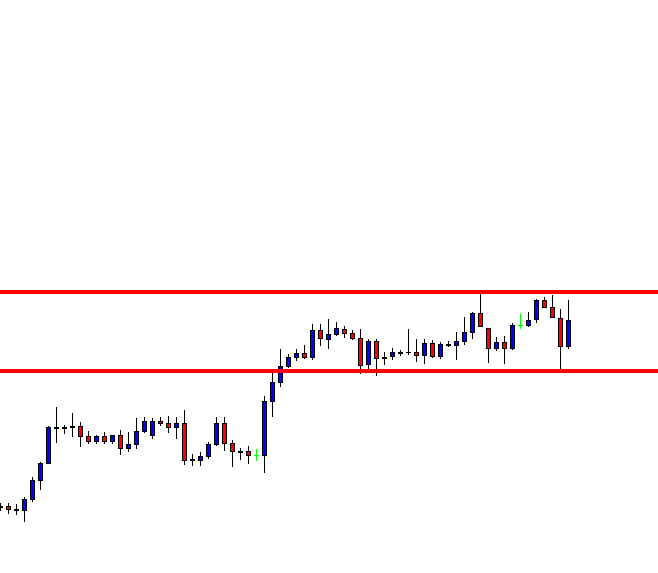
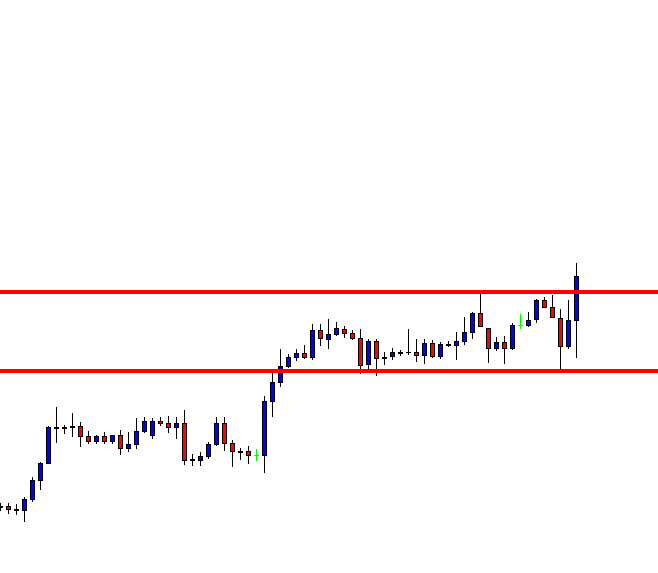
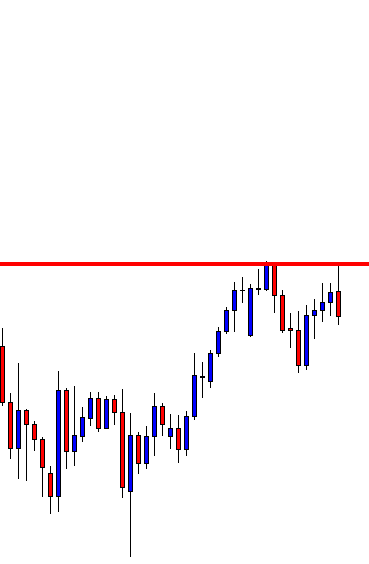
The EUR/USD currency was trading 1.1116 and 1.1157 yesterday, hit the lowest range. As for today, the EUR will likely to continue consolidating in the narrow range of 1.1110 – 1.1150.
The EUR/USD is also facing double bottom support at 1.1110 area, and above this, we can expect to buy a trend in the EUR/USD until 1.1150 and 1.1180. On the other hand, selling can be expected below 1.1110 until the 1.1065 area.
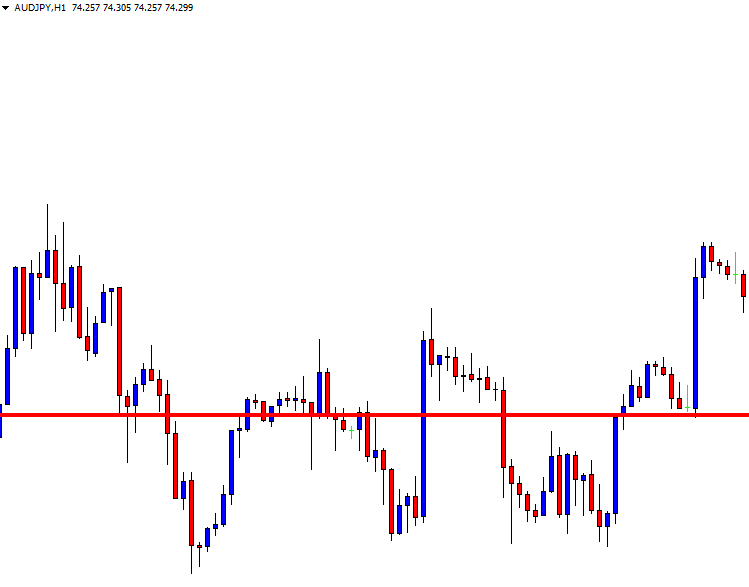
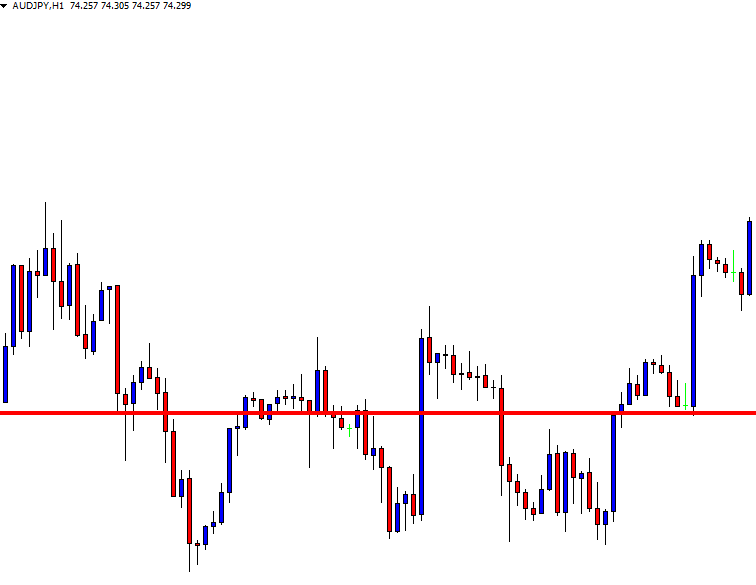
USD/JPY – Daily Analysis
The USD/JPY currency pair is flashing red and representing 0.16% declines on the day. As of writing, the USD/JPY currency pair currently trading at 108.30, as the time of writing, the pair traveled from a high range of 108.51 to a low range of 108.25.
The USD/JPY currency pair may end with a much higher daily loss, as the four-hour chart is showing a head-and-shoulders breakdown.
Such as Prime Minister Boris Johnsons Brexit bill gained the parliamentary support, but the government timeline of just three-days discussion on the bill was rejected.
Notably, Prime Minister Boris Johnson made a plan to meet with European Union leaders once again to discuss the timeline, and the chances of an early election are increasingly, but Brexit delayed beyond the elections.
At the data front, the Oct Richmond Fed manufacturing survey rose firmly to +8 (est. -7, prior -9). Increases were comprehensive, with noted raises in employment and new orders with expectations edging higher in addition to stronger current conditions. United Step Sep existing home sales slid -2.2%m/m (est. -0.7%m/m). However, at 5.38mn (est. 5.45mn), the annualized level continues close to post record highs, and NAR’s chief economist continues to cite a shortage of stock and supply.
The United States’ two-year Treasury yields were moving between 1.59% and 1.63, whereas the ten-year yield traveled between 1.76% and 1.80%. Markets are expecting 22-basis points of a rate cut at the October 30 meeting and a terminal rate of 1.24% against % currently.
Daily Support and Resistance
S3 108.09
S2 108.31
S1 108.41
Pivot Point 108.53
R1 108.63
R2 108.75
R3 108.97
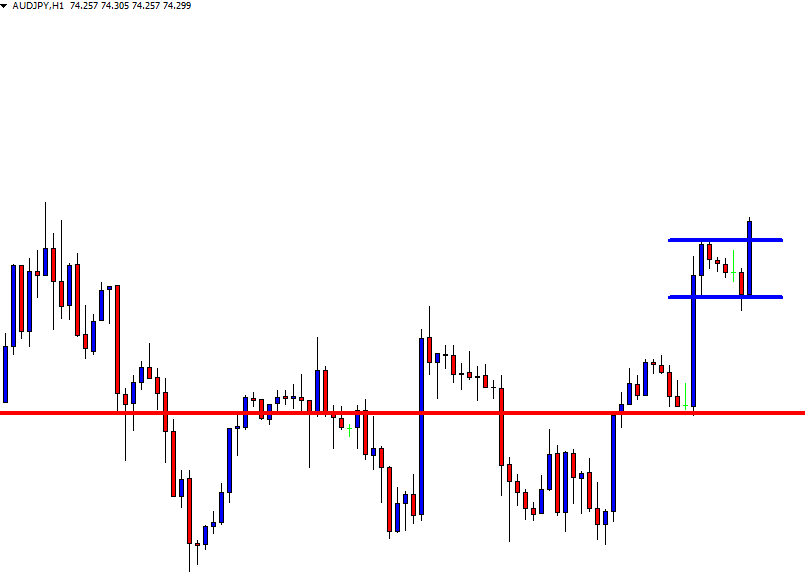
USD/JPY – Trading Tips
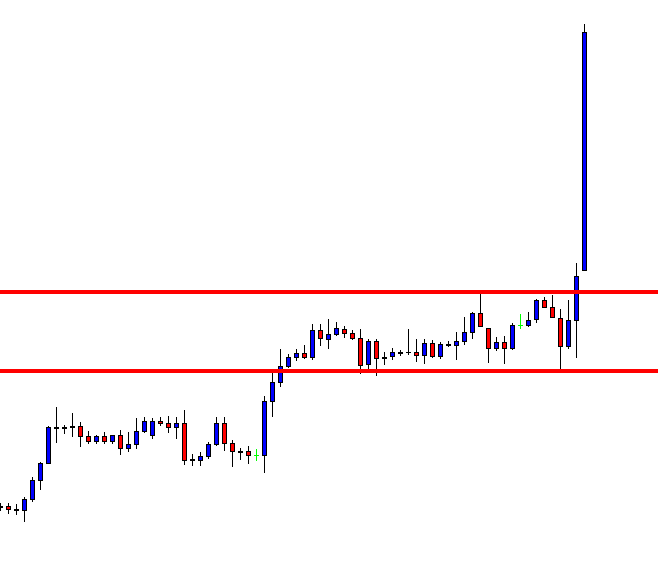
Recalling our previous update, the USD/JPY was trading in the bullish channel, which was extending support at 108.350. This bullish channel is now violated. As anticipated, the violation of 108.350 is extending bearish rally until the 108 level.
The MACD and Stochastics are consistently pointing into the selling zone, signaling odds of a bearish bias.
The USD/JPY may attain a critical resistance at 108.57, along with support at 108.300. Today, the violation fo 108.270 can help us capture a quick sell position until 107.950.
All the best!