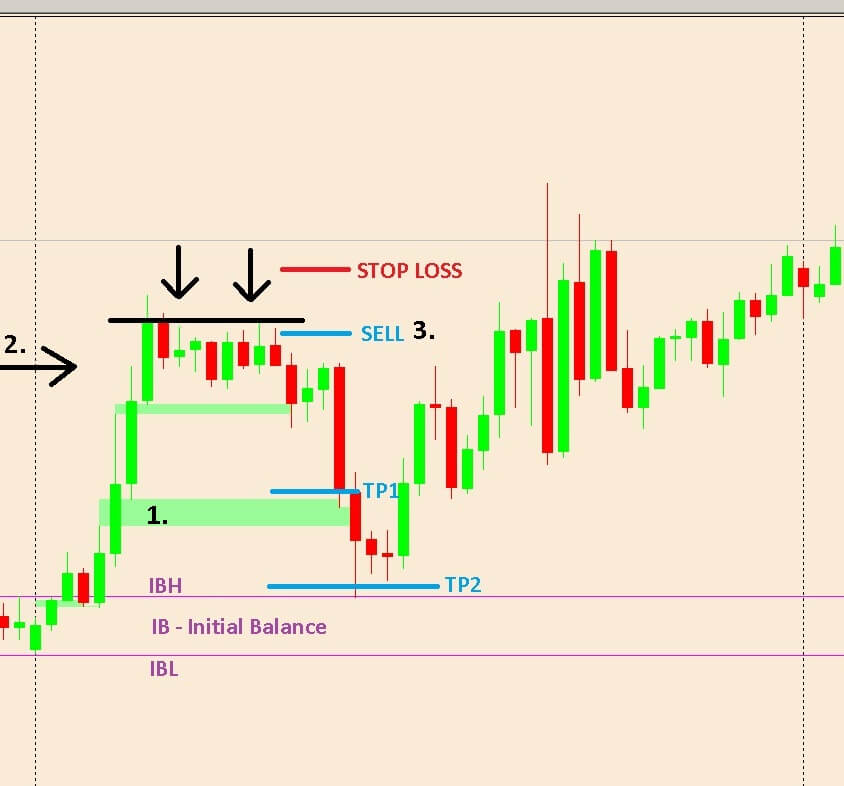
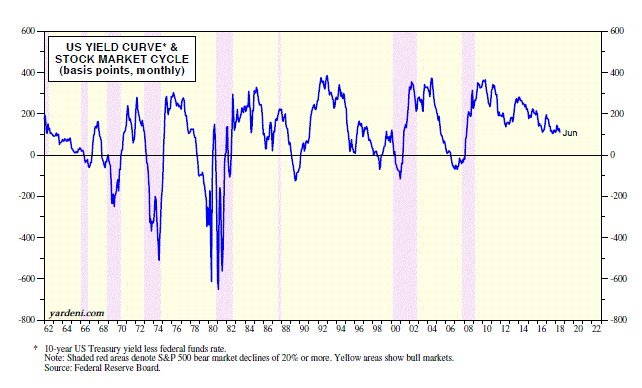
Trading the naked RSI system depicted in this series’s previous video as an overbought/oversold signal generator is too risky, and its long-term results questionable. The system is profitable only in sideways movements. Thus, a trending filter or a detrending step will be needed to avoid the numerous fake signals.
Divergences and Failure swings
Welles Wilder remarks on two ways to trade the RSI: Divergences and Top/Bottom failure swings.
Divergences
A divergence forms when the price makes higher highs (or lower lows), and the RSI makes the opposite move: lower highs (or higher lows). RSI divergences from the oversold area show the market action starts to strengthen, an indication of a potential swing up. In contrast, RSI divergences in the overbought area show weakness and a likely retracement from the current upward movement.
Failures
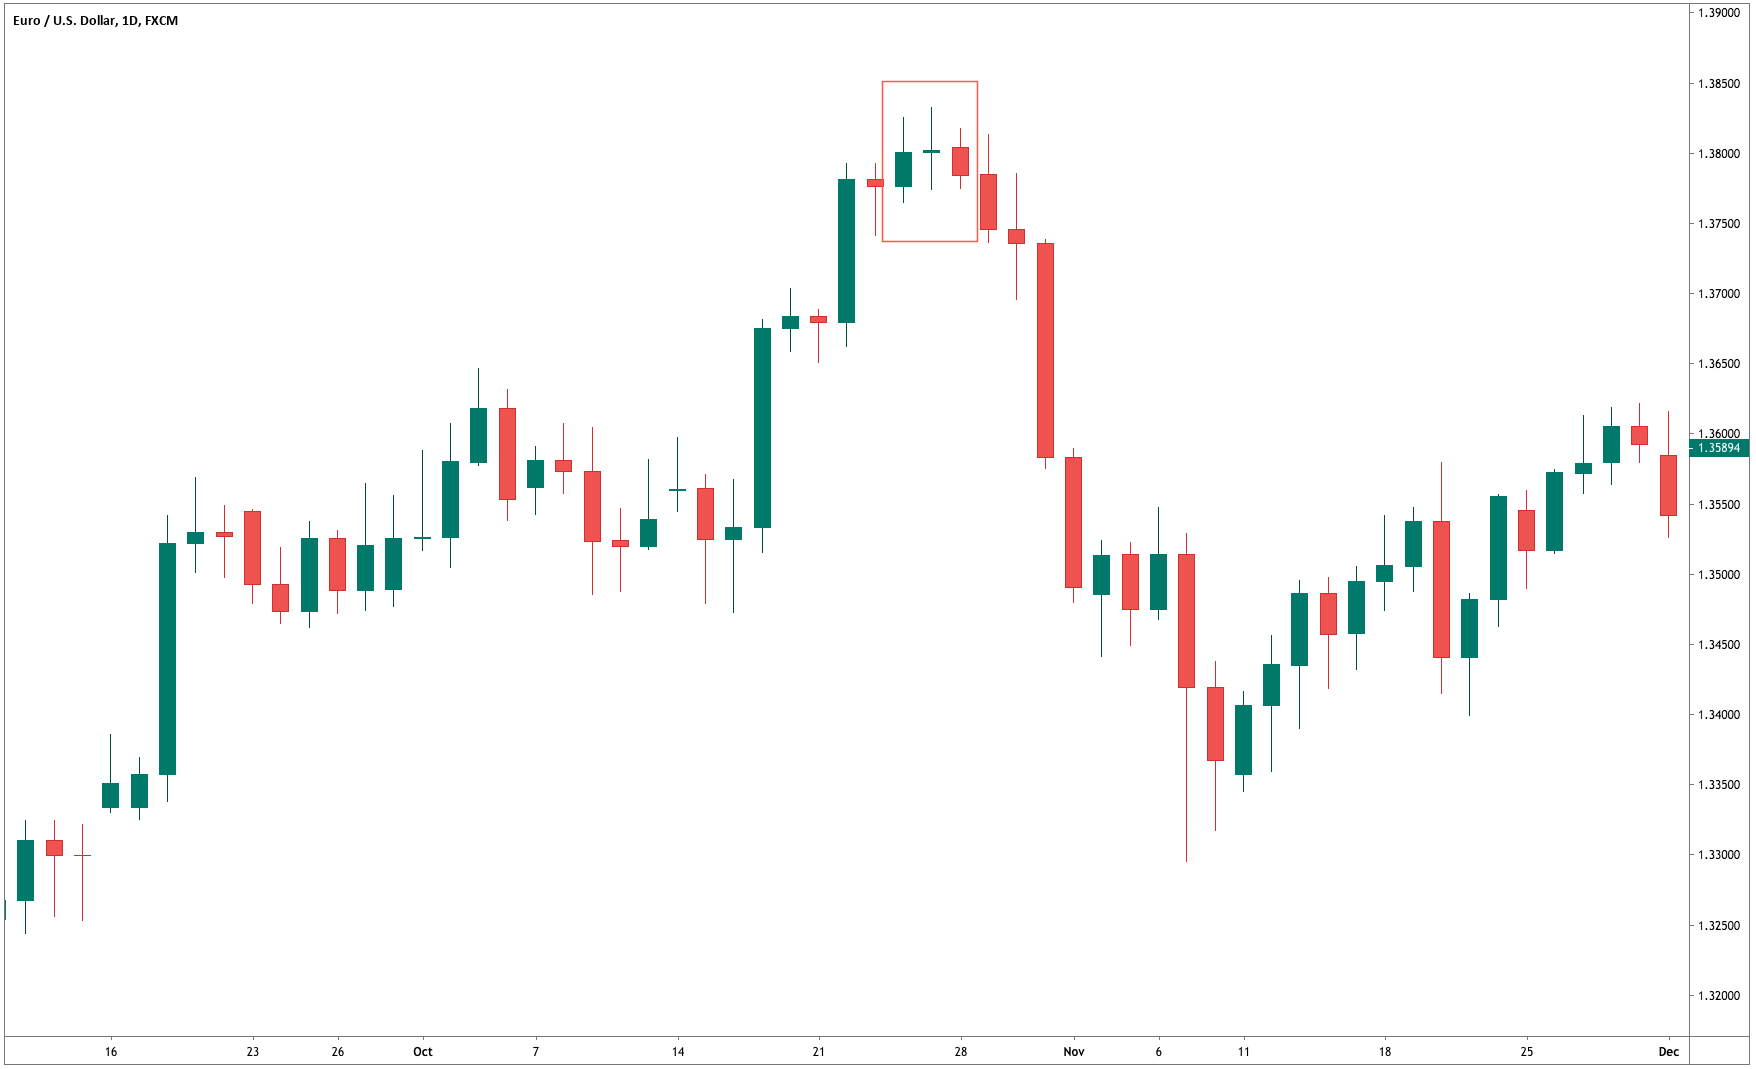
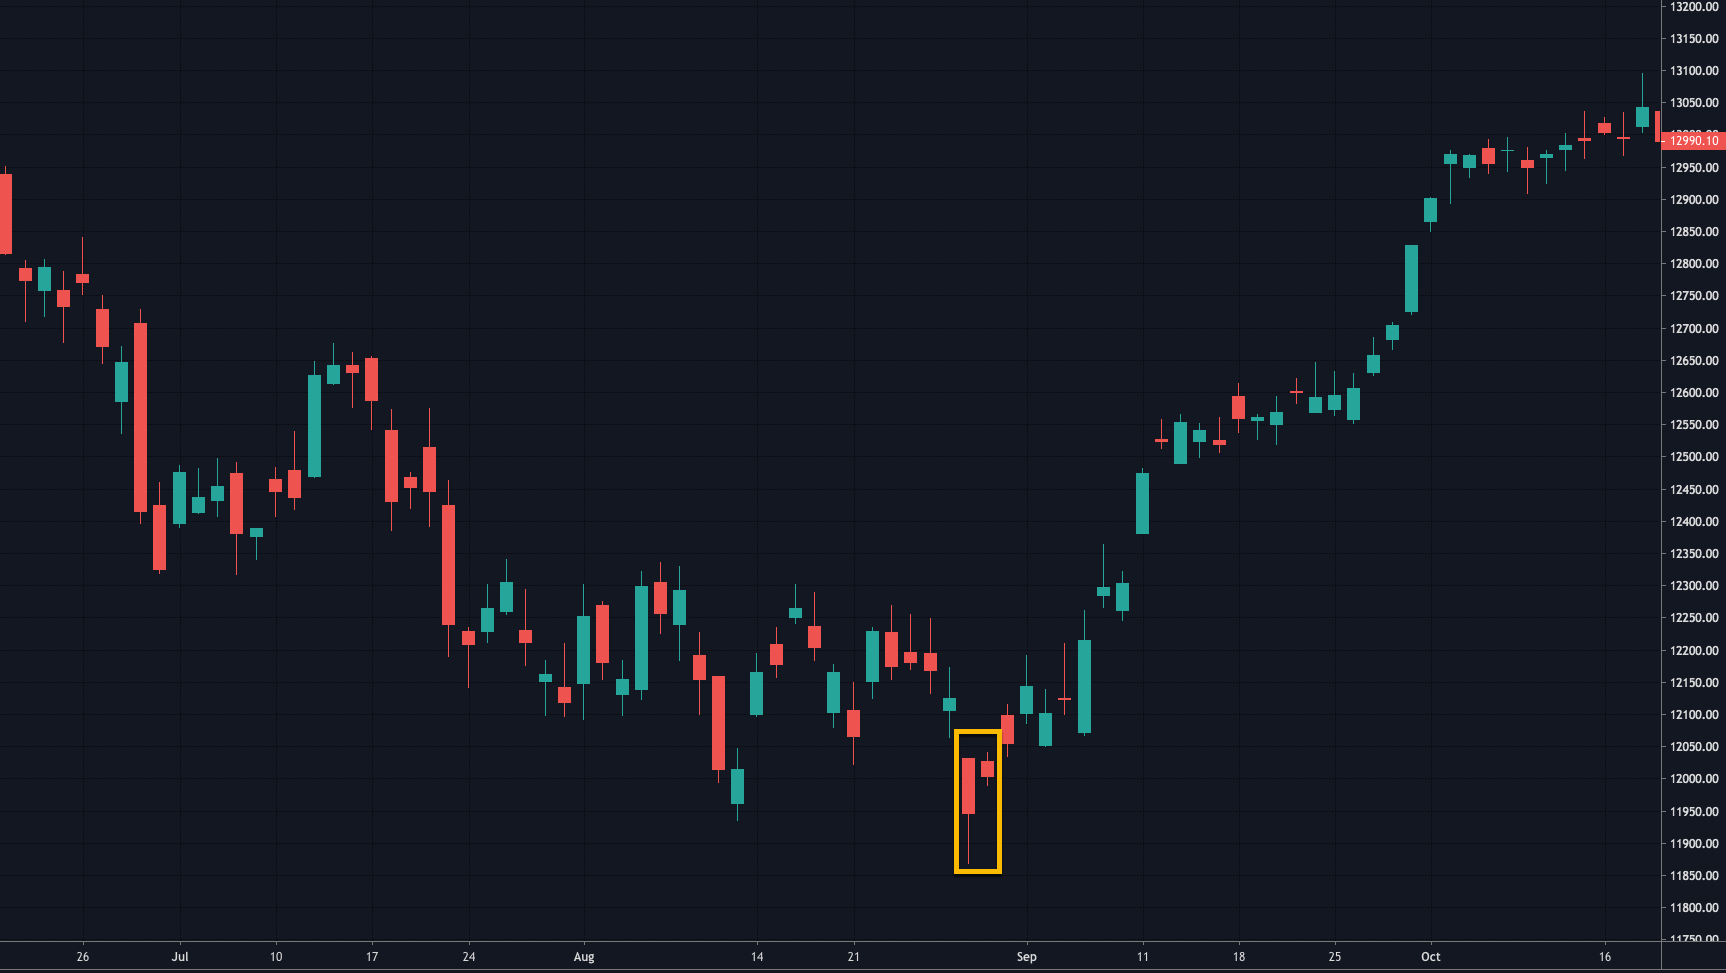
An RSI Top failure occurs with the following sequence of events:
- The RSI forms a pivot high in the overbought area.
- An RSI pullback occurs, and an RSI pivot low forms.
- A new RSI pivot high forms, which is lower than the previous pivot high
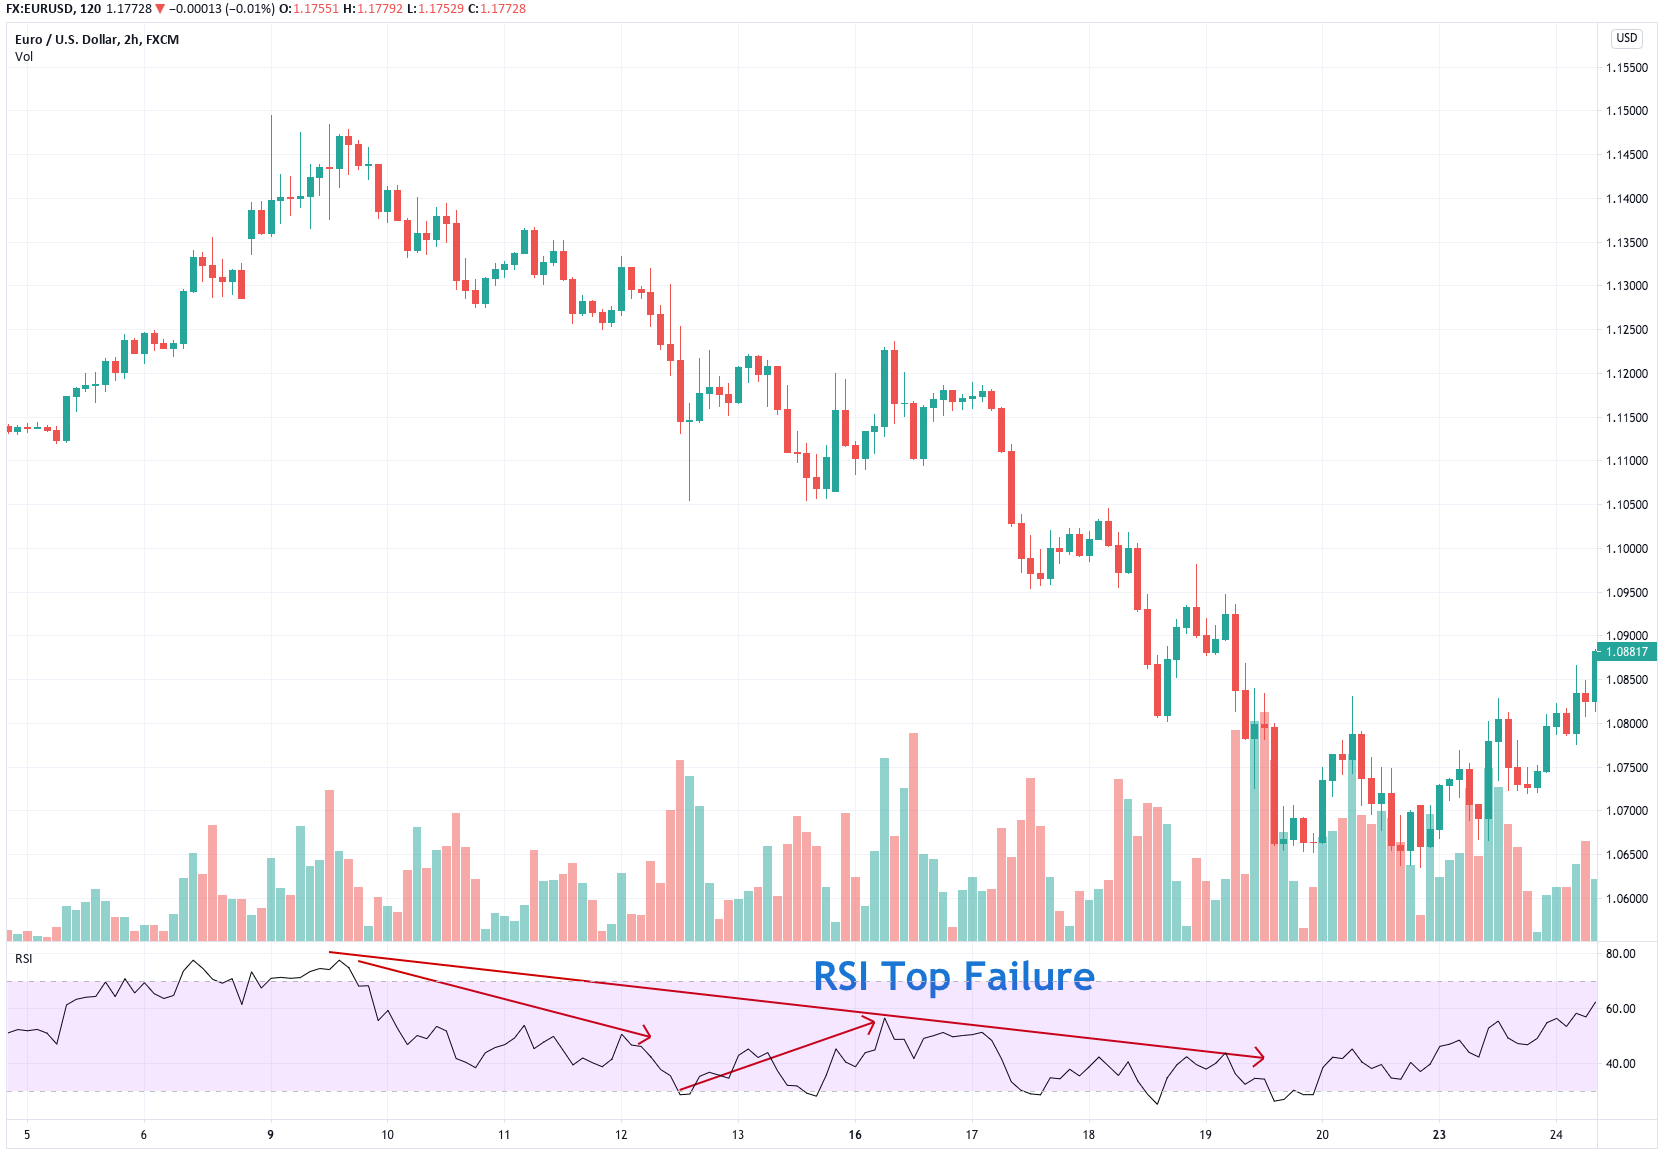
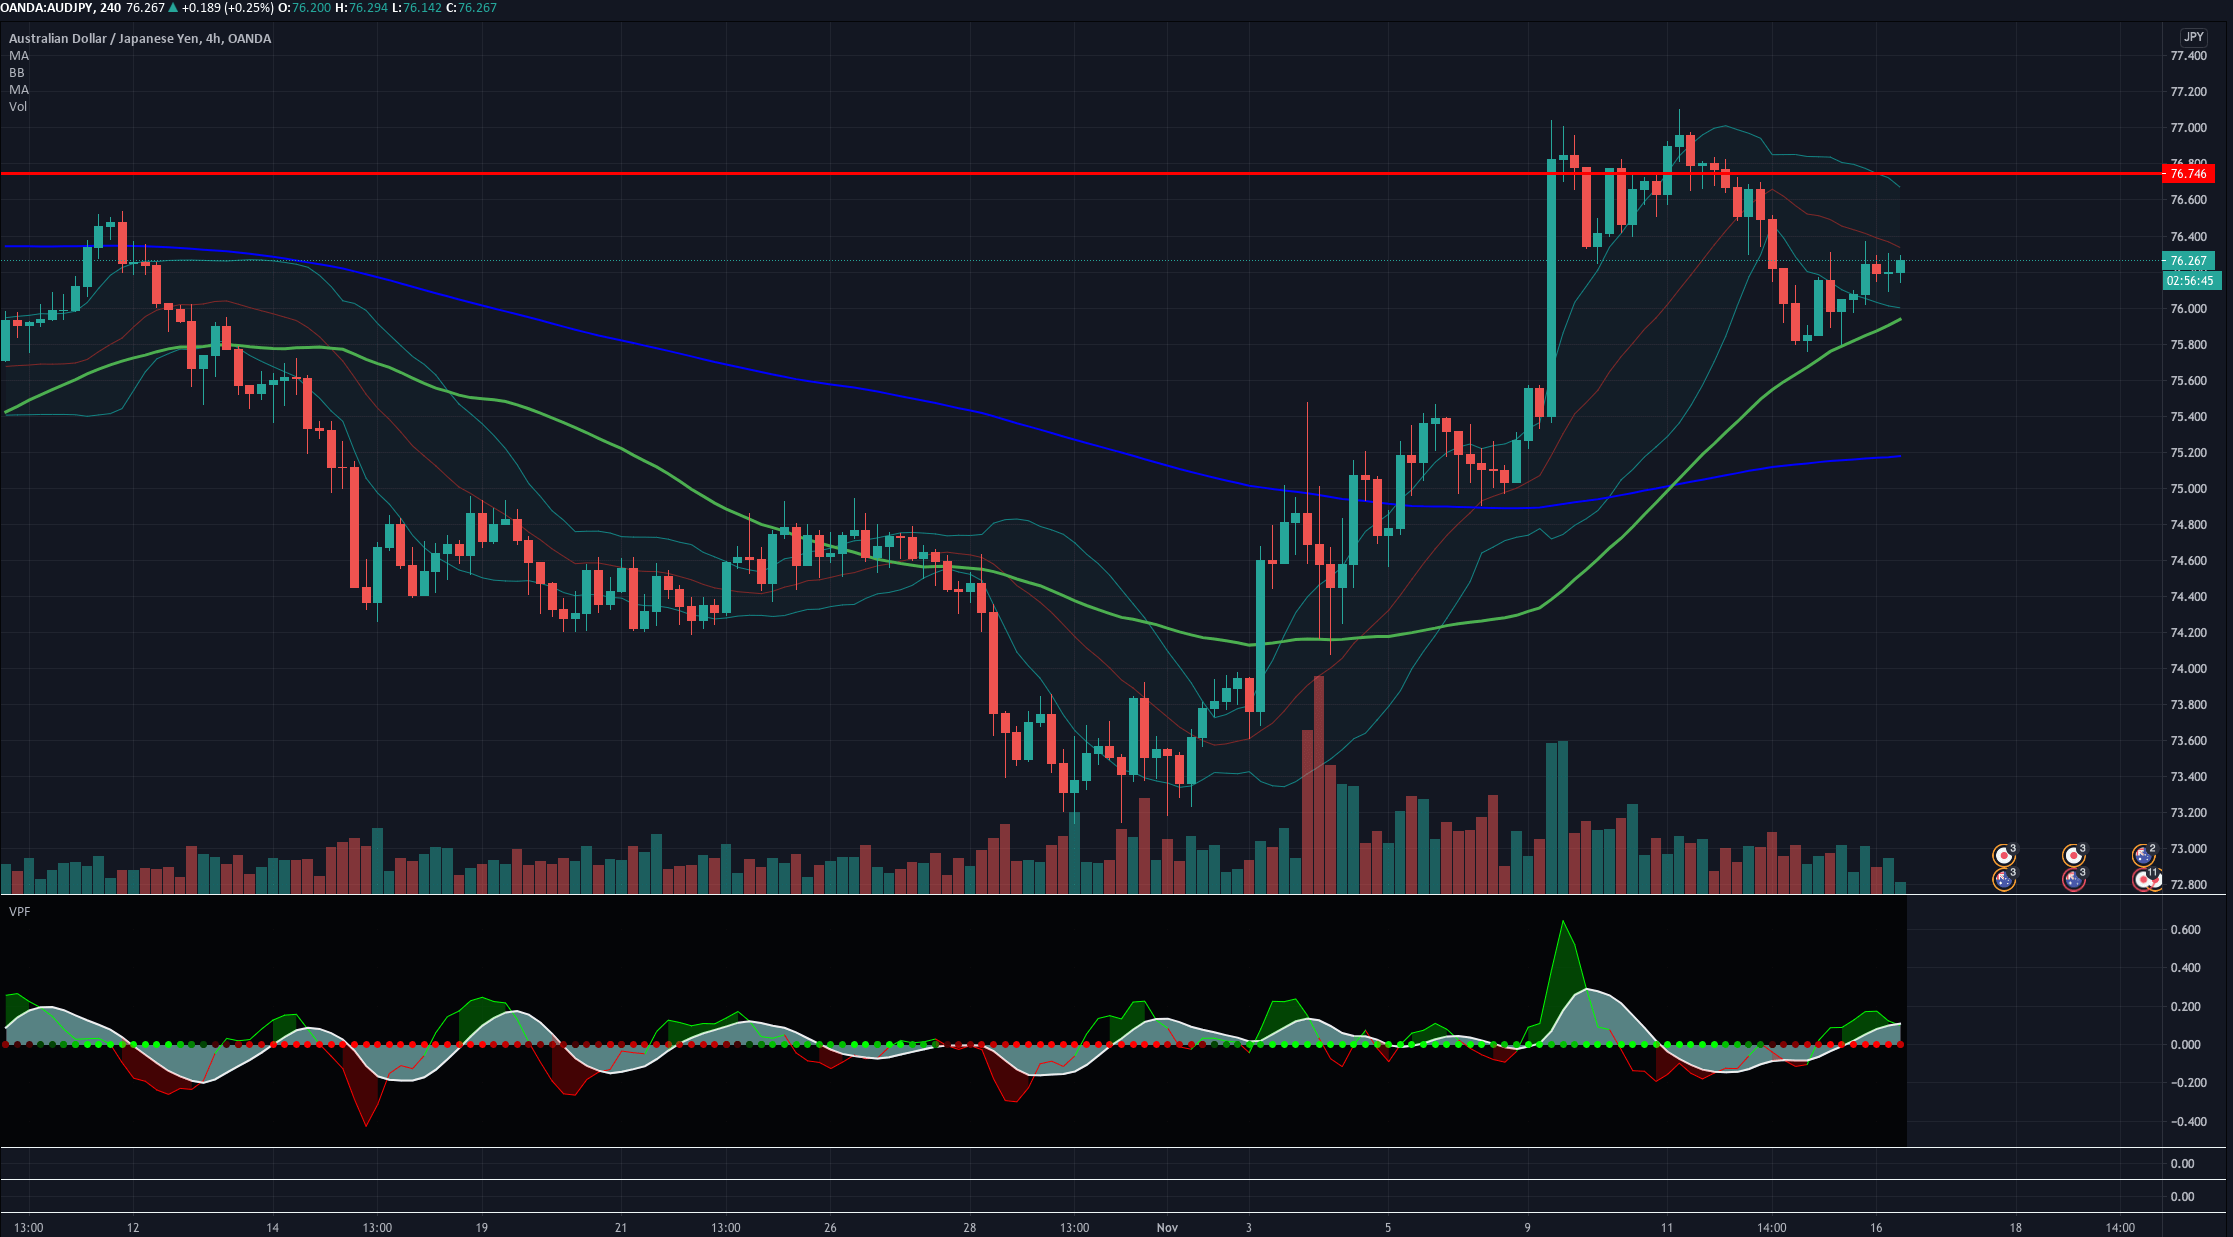
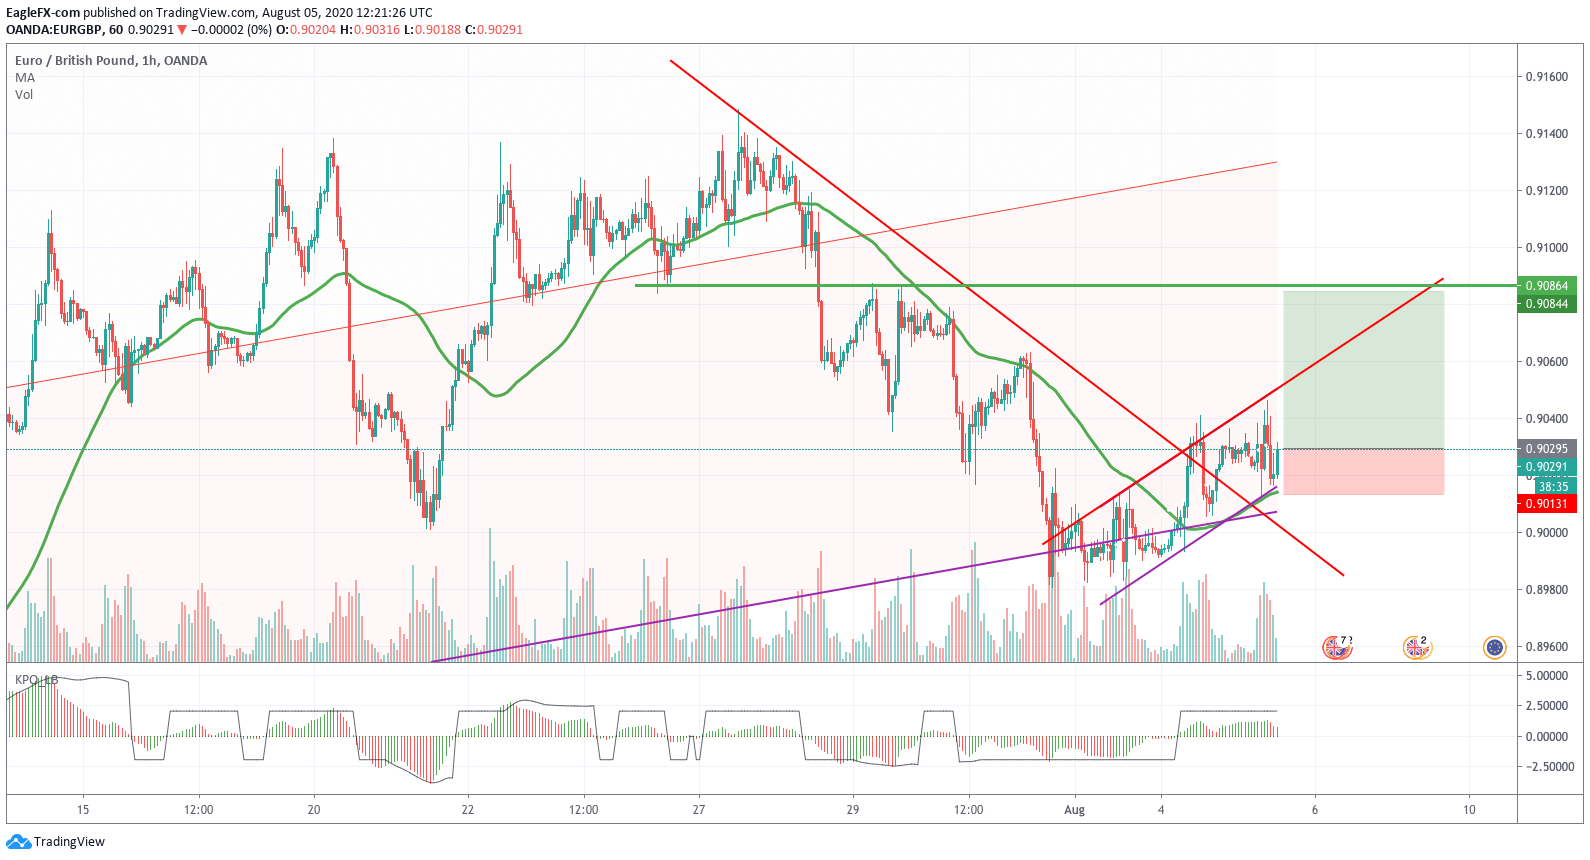
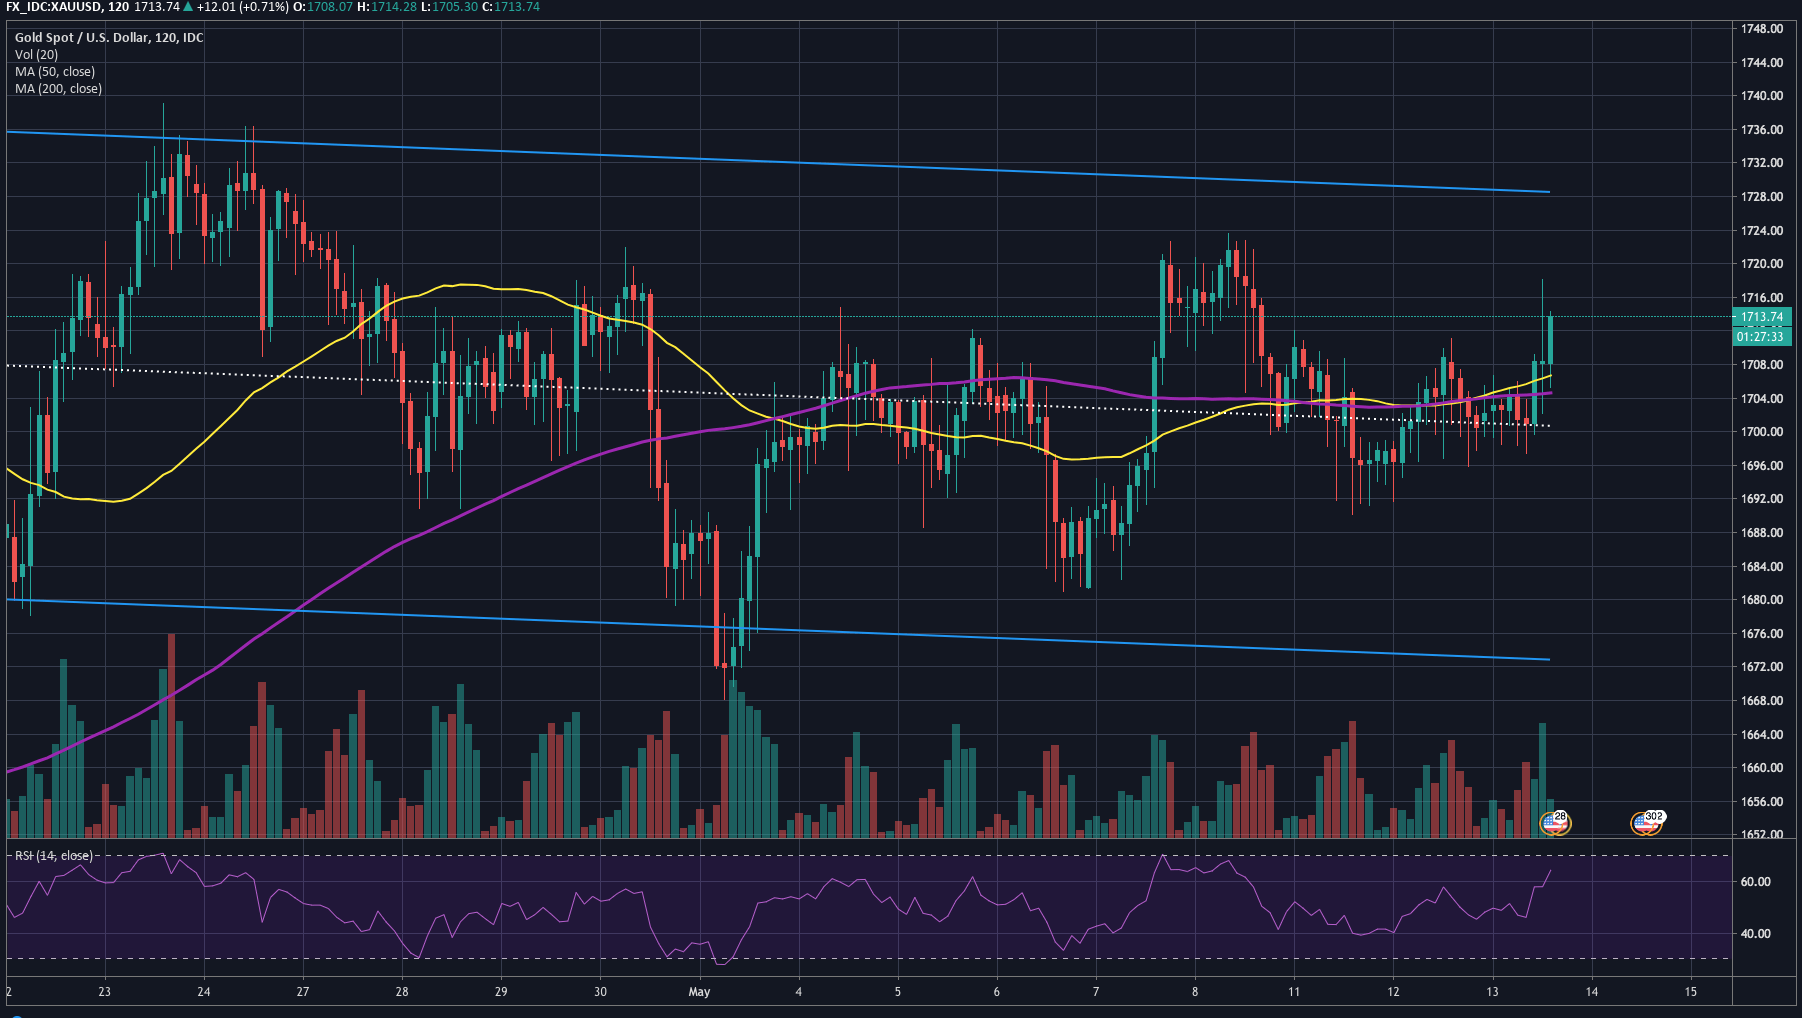
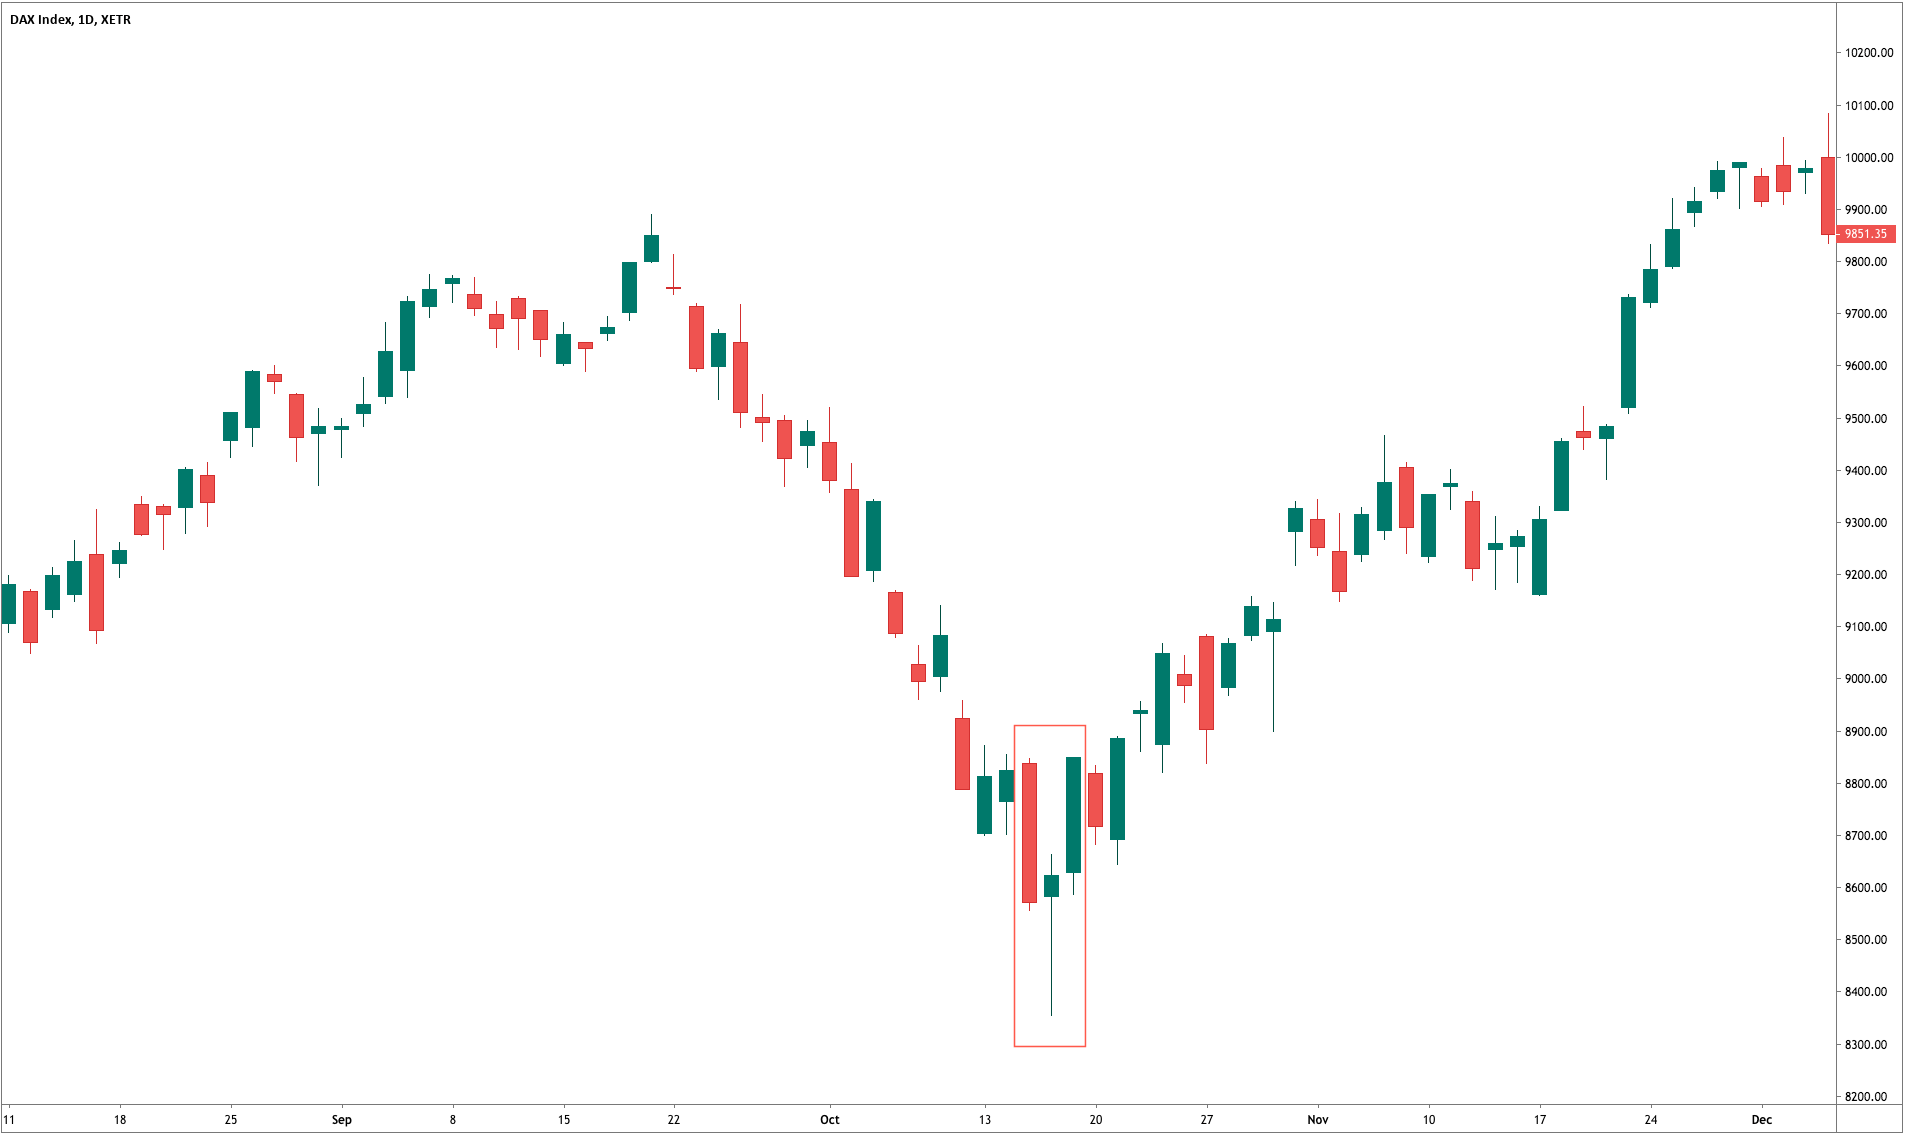
Fig 1 – RSI TOP failures in the EURUSD 4H 2H Chart
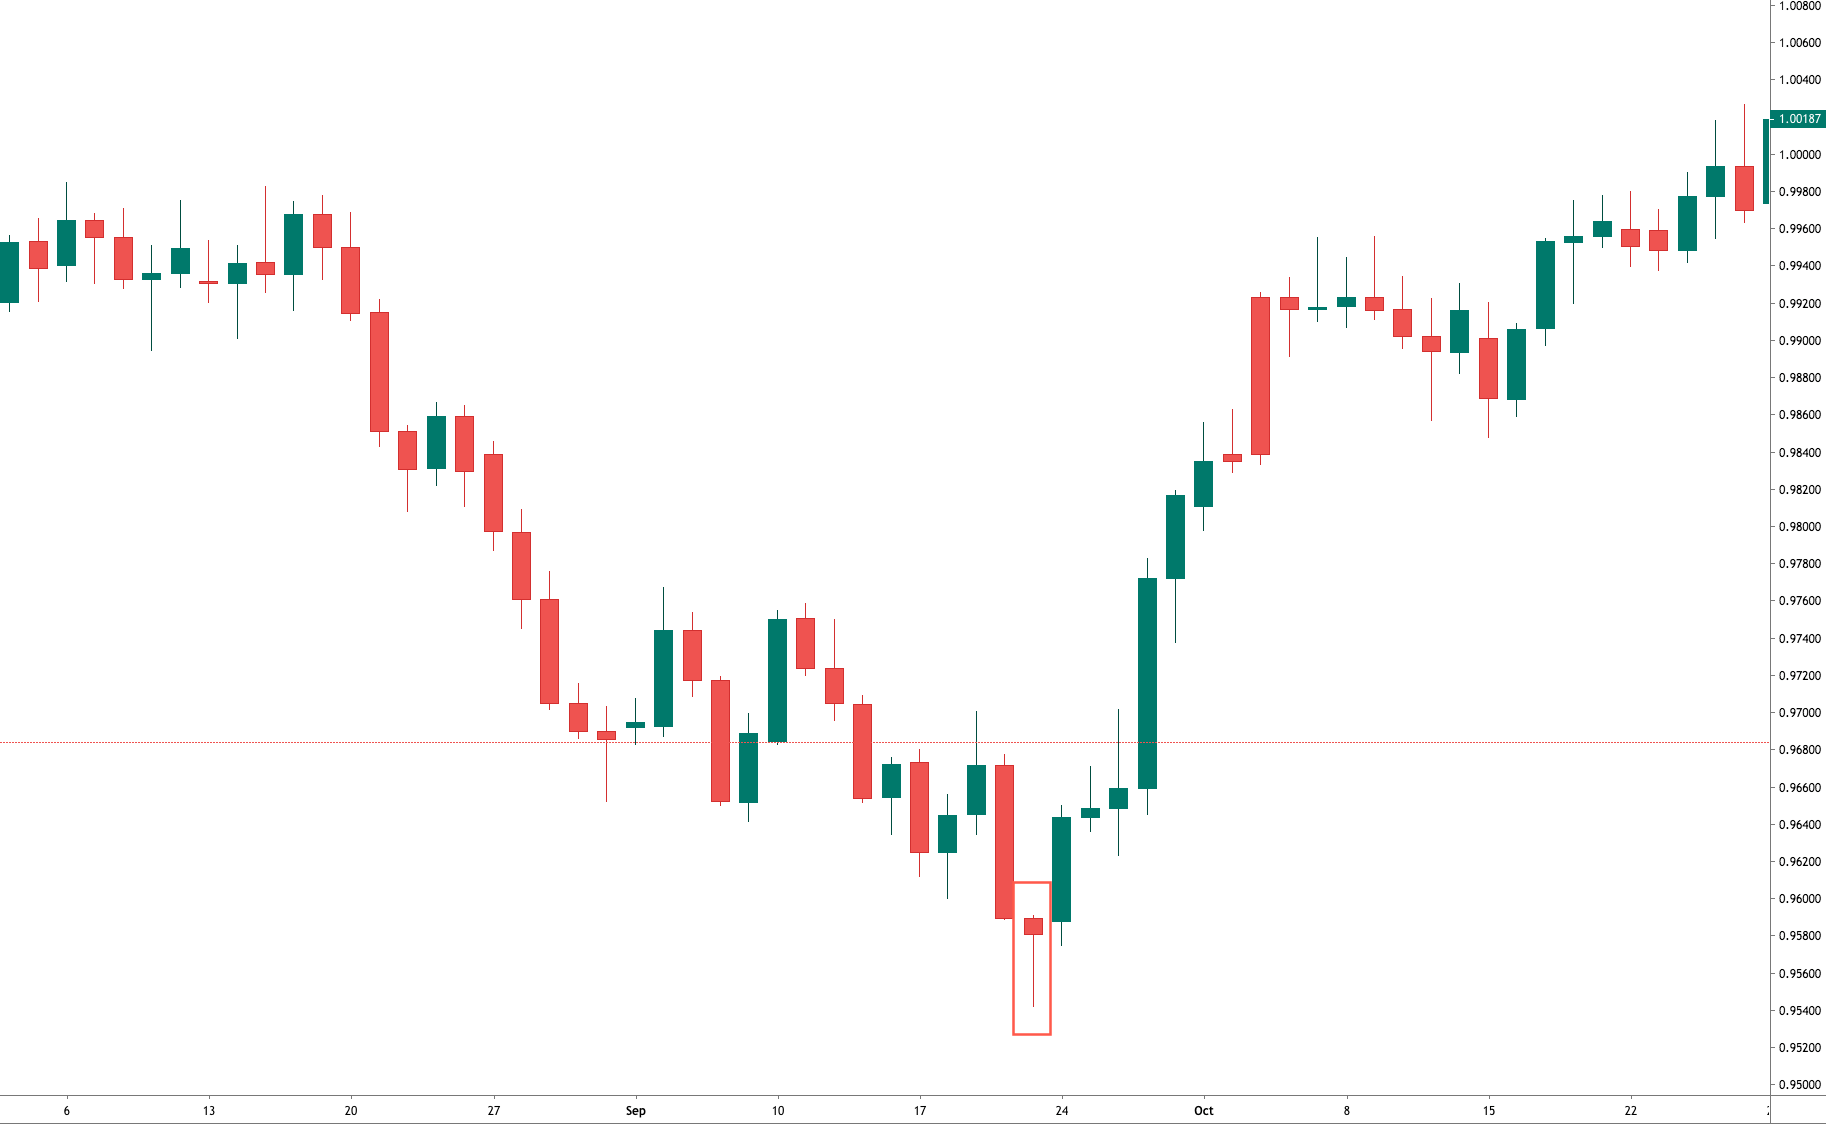
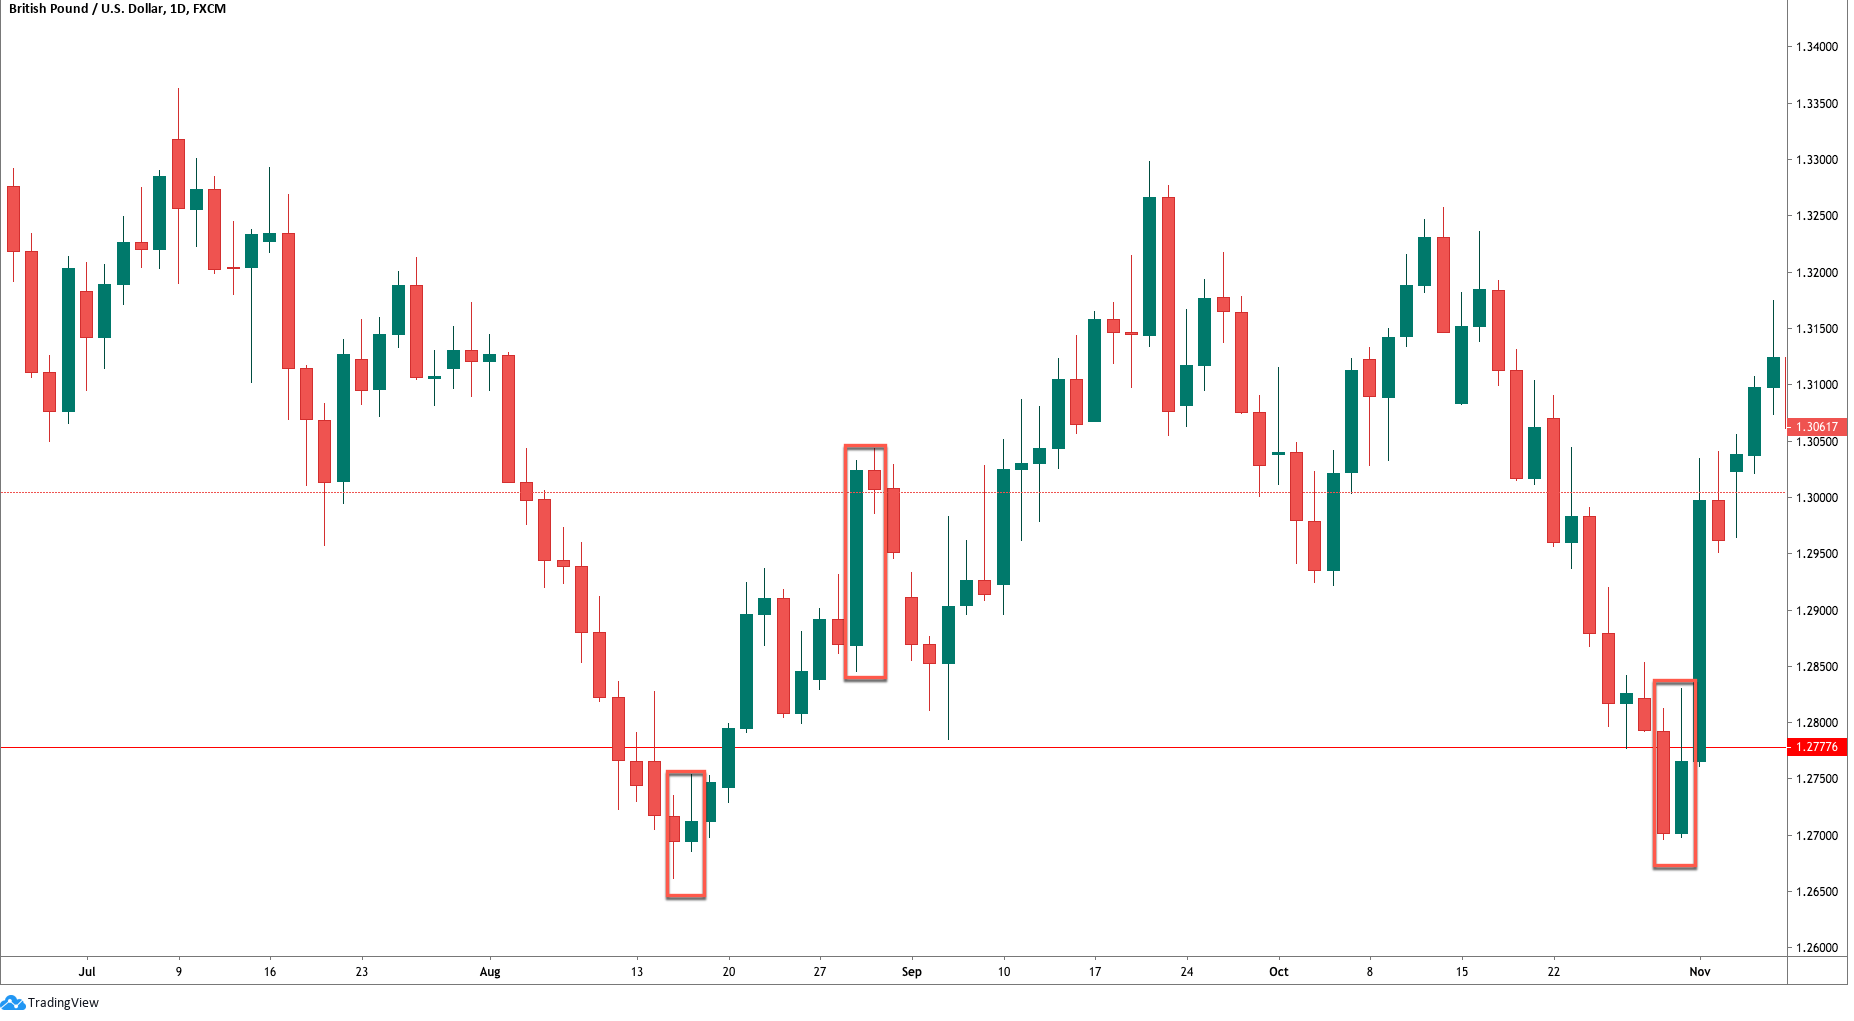
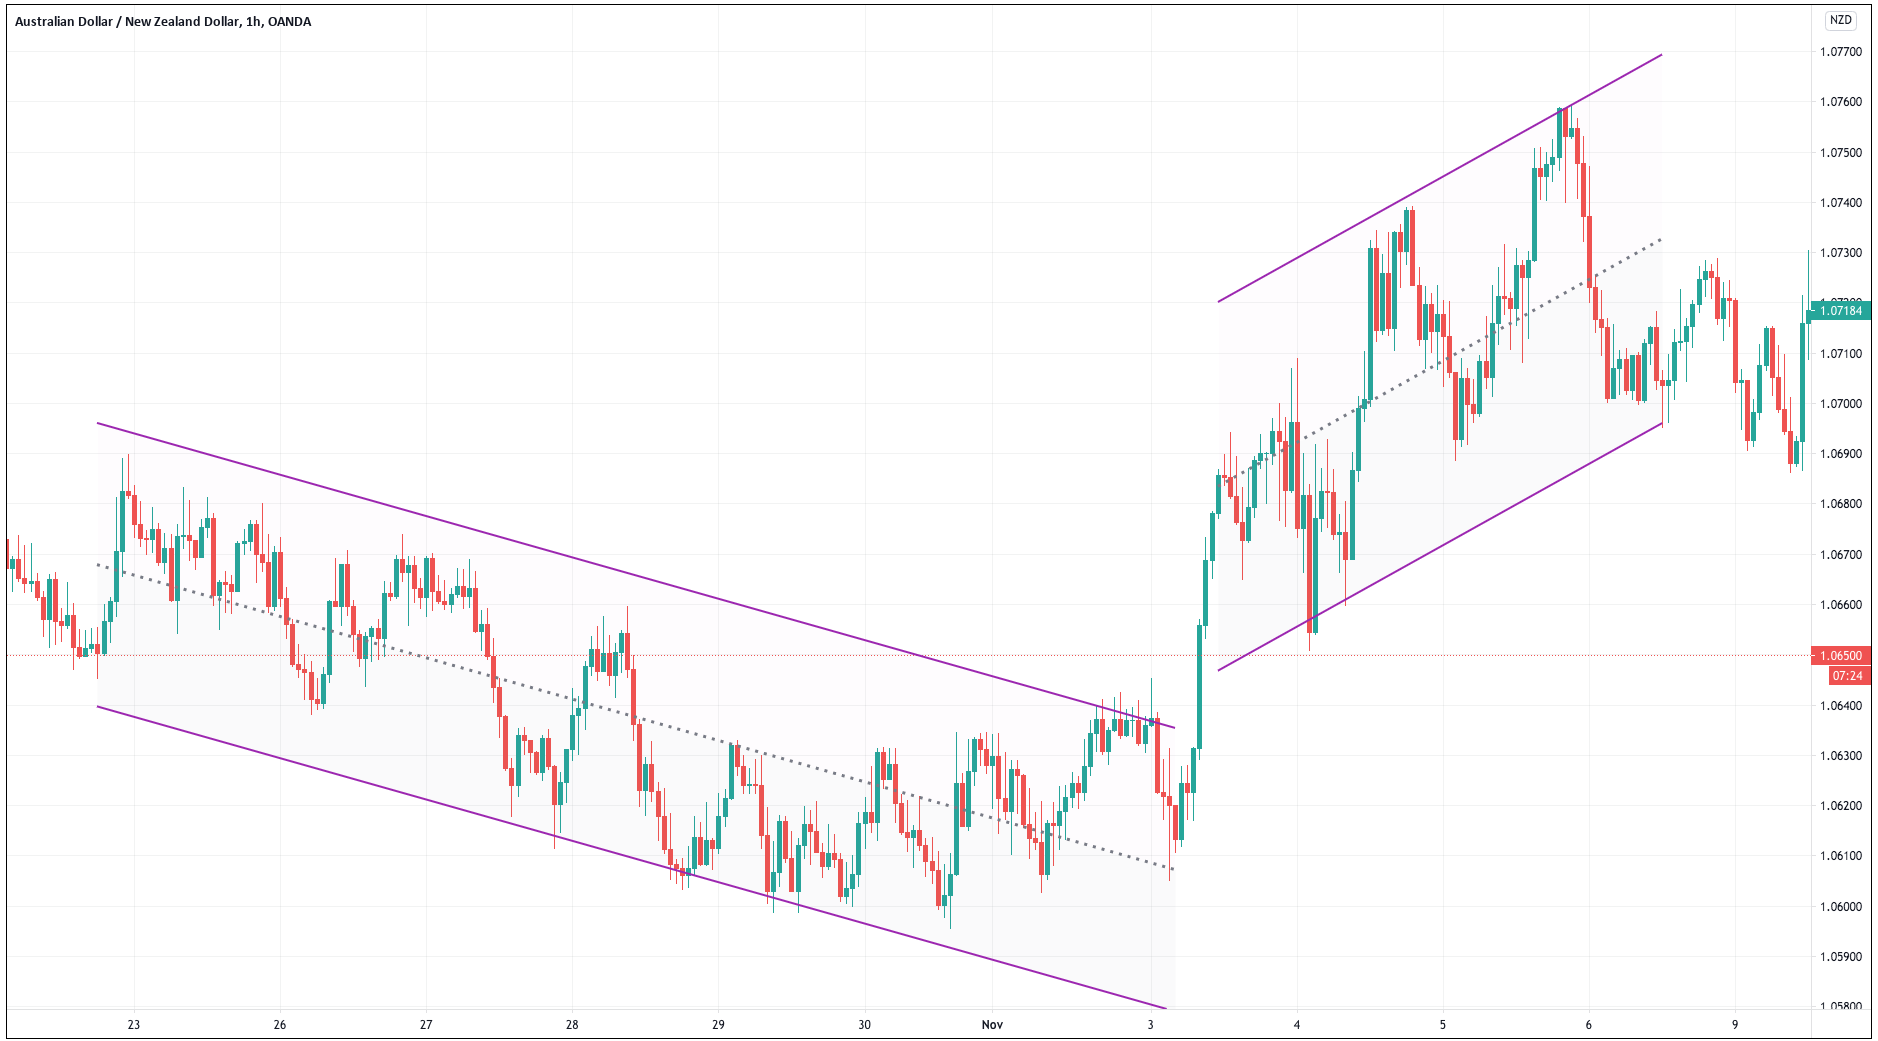
An RSI Bottom failure occurs with the following sequence of events:
- The RSI forms a pivot low below the oversold area.
- An RSI pullback occurs, and an RSI pivot high forms.
- A new RSI pivot low forms, which is higher than the previous pivot high.
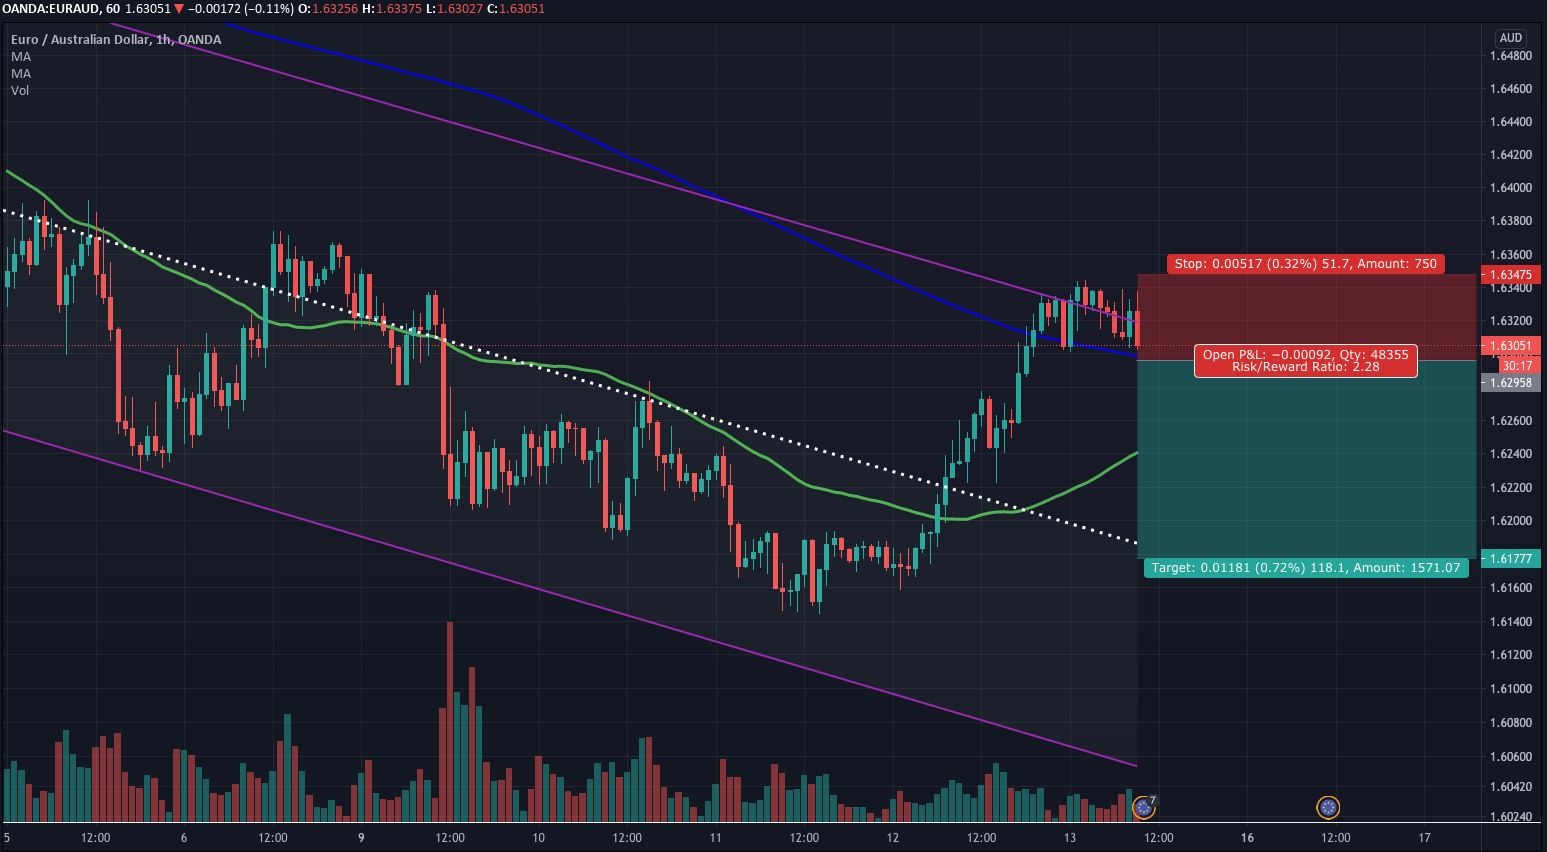
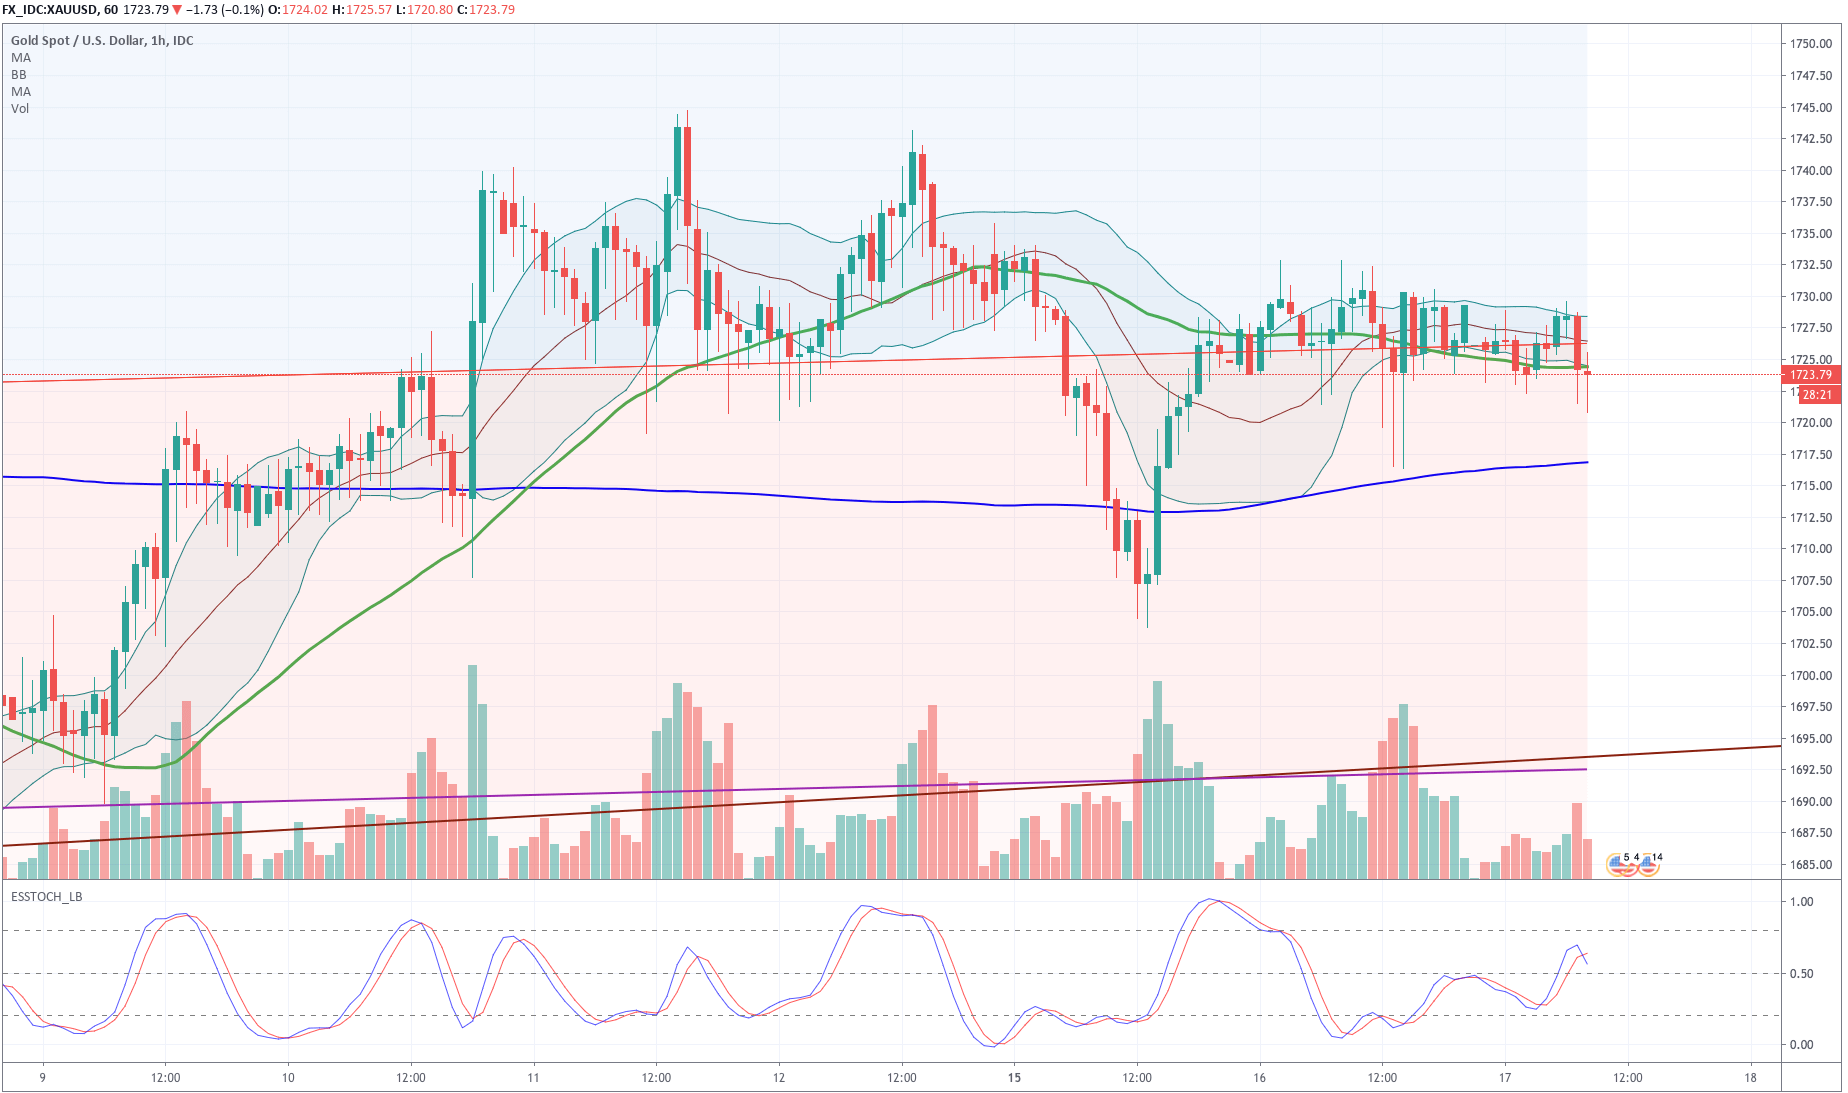
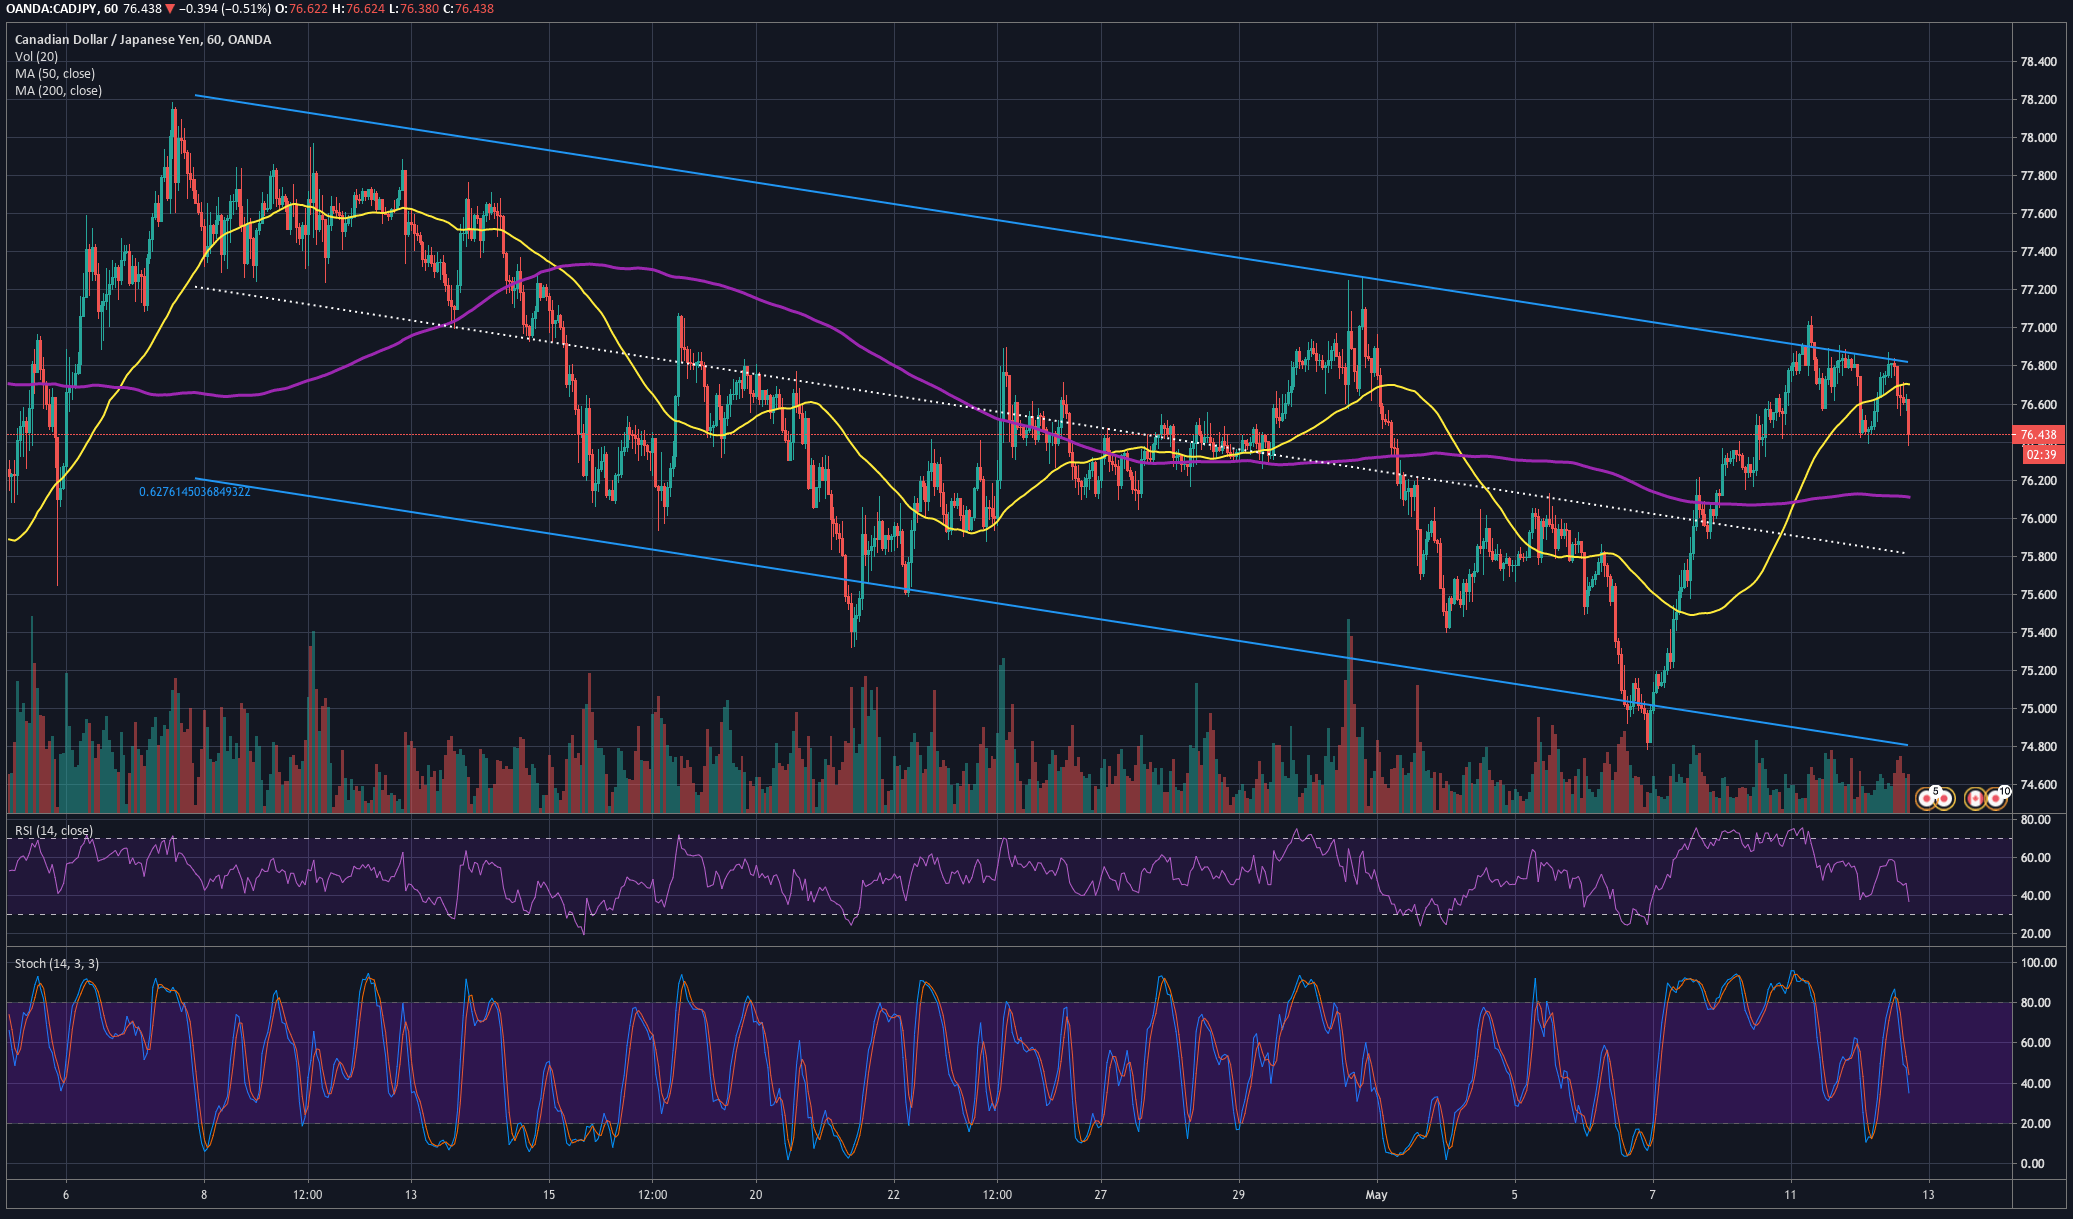
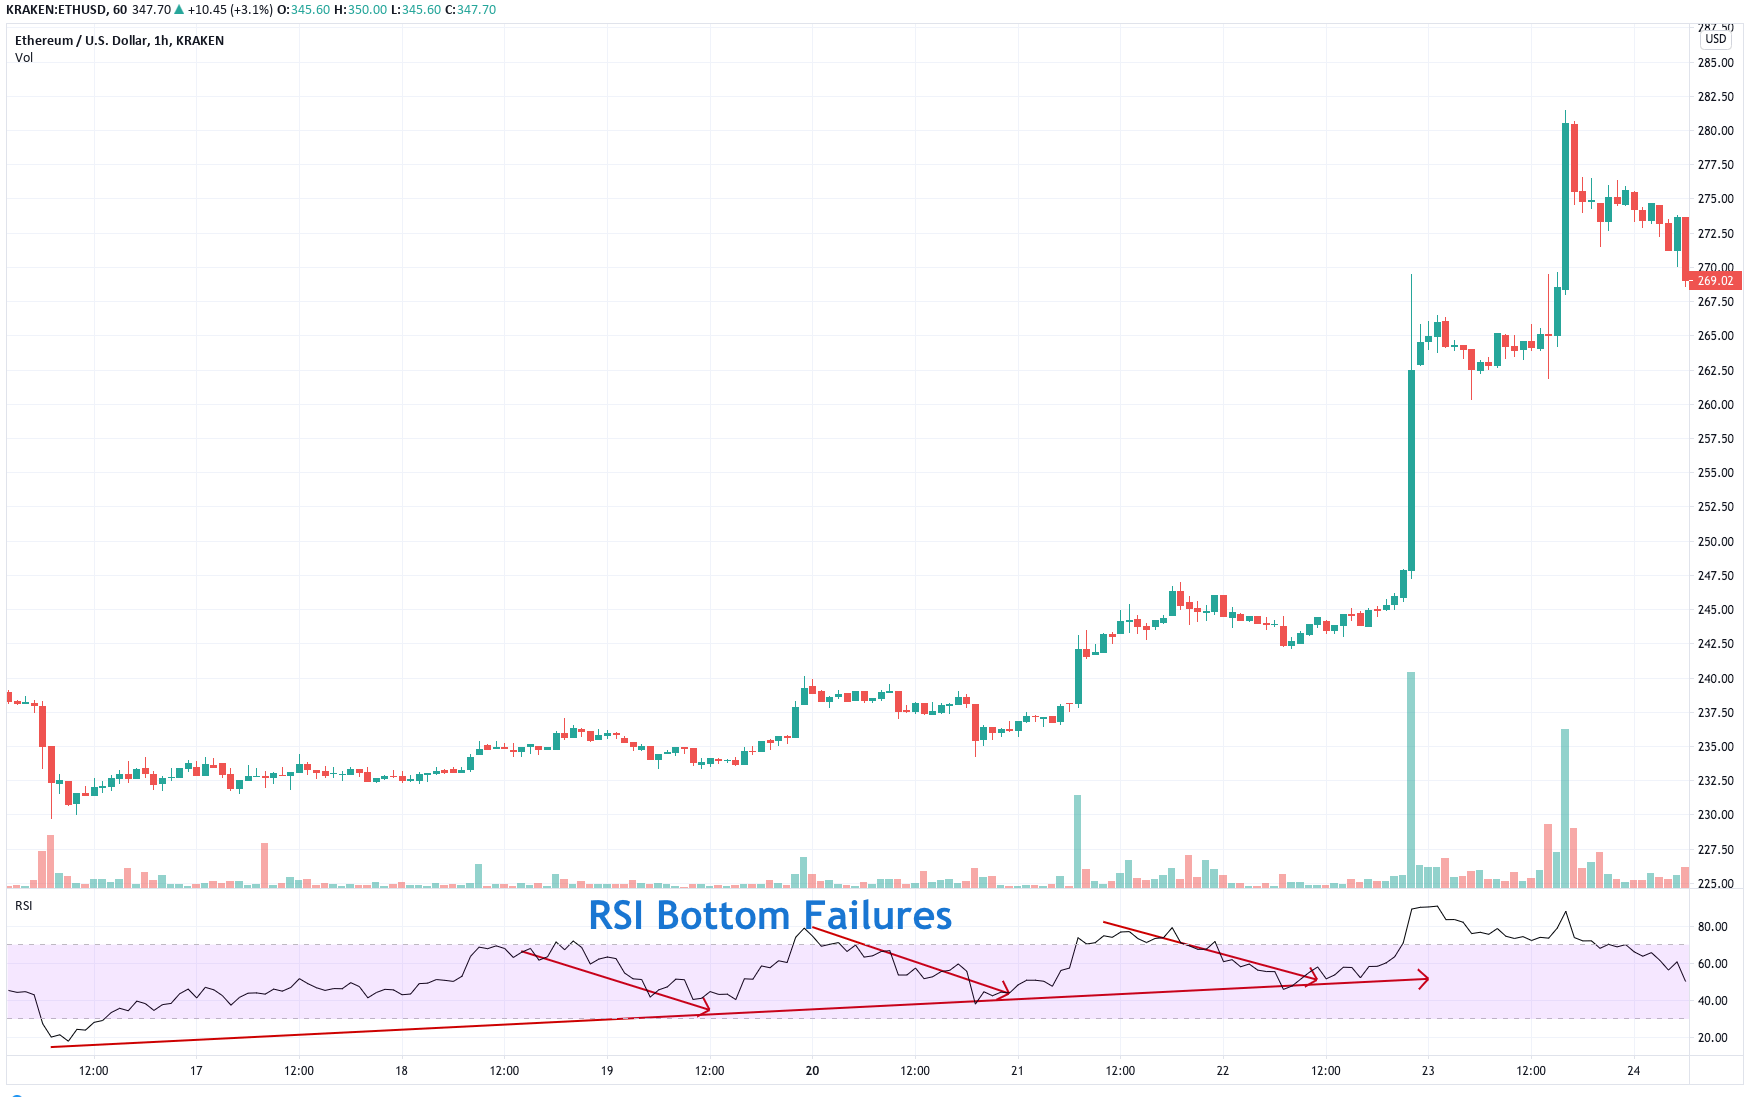 Fig 2 – RSI Bottom failures in the ETHUSD 1H Chart.
According to Welles Wilder, trading the RSI failure swings can be more profitable than trading the RSI overbought-oversold system. Thus, we will test it.
The RSI Failure algorithm
To create the RSI Failure algorithm, we will need to use the Finite State Machine concept, presented in this series’s seventh video.
The Easylanguage code of the RSI system failure is the following:
inputs:  Price( Close ), Length( 14 ), OverSold( 30 ), Overbought( 70 ),
takeprofit( 3 ), stoploss( 1 ) ;
variables: state(0), state1 (0), state2(0), state5 (0), state6(0), rsiValue(0),
 var0( 0 ), rsi_Pivot_Hi(0), rsiPivotHiFound(False),
rsiPivotLoFound (False),rsi_Pivot_Lo(0)  ;

rsiValue = RSI(C,Length);

If rsiValue[1] > rsiValue and rsiValue[1] > rsiValue[2] then
      begin
         rsiPivotHiFound = true;
         rsi_Pivot_Hi= rsiValue[1];
     end

else
     rsiPivotHiFound = False;

If rsiValue[1] < rsiValue and rsiValue[1] < rsiValue[2] then
      begin
         rsiPivotLoFound = true;
        rsi_Pivot_Lo = rsiValue[1];
     end

else
     rsiPivotLoFound = False;

If state = 0 then
      begin
        if rsiPivotHiFound = true and rsi_Pivot_Hi> Overbought then
             state = 1    {a bearih setup begins}
     else
           if rsiPivotLoFound = True and rsi_Pivot_Lo < OverSold then
                 state = 5; {a bullish Setup begins}
     end;

{The Bearish setup}

If state = 1 then
      begin
         state1 = rsi_Pivot_Hi;
         if rsiValue > state1 then state = 0;
         if rsiPivotLoFound = true then
             state = 2;
     end;

If state = 2 then
      begin
         state2 = rsi_Pivot_Lo ;
         if rsiValue > state1 then state = 0;
         if rsiPivotHiFound = true then
         if rsi_Pivot_Hi< 70 then state = 3;
     end;

If state = 3 then
     if rsiValue < state2 then state = 4;

If state = 4 then
      begin
        sellShort this bar on close;
        state = 0;
     end;


{The bullish setup}

If state = 5 then
      begin
       state5 = rsi_Pivot_Lo;
       if rsiValue < state5 then state = 0;
       if rsiPivotHiFound = true then
             state = 6;
     end;


If state = 6 then
      begin
         state6 = rsi_Pivot_Hi;
         if rsiValue < state5 then state = 0;
         if rsiPivotLoFound = true then
             if rsi_Pivot_Lo > OverSold then state = 7;

     end;


If state = 7 then
     if rsiValue > state6 then state = 8;

 If state = 8 then
      begin
         buy this bar on close;
         state = 0;
     end;


If state > 0 and rsiValue < OverSold then state = 0;
If state > 0 and rsiValue > Overbought then state = 0;

{The Long position management section}

If marketPosition =1 and close < entryprice - stoploss* avgTrueRange(10) then
    sell this bar on close;

If marketPosition =1 and close < entryPrice + takeprofit* avgTrueRange(10) then
    sell this bar on close;


{The Short position management section}


If marketPosition =-1 and close > entryprice + stoploss* avgTrueRange(10) then
     BuyToCover this bar on close;

If marketPosition =-1 and close < entryPrice - takeprofit* avgTrueRange(10) then
     BuyToCover this bar on close;
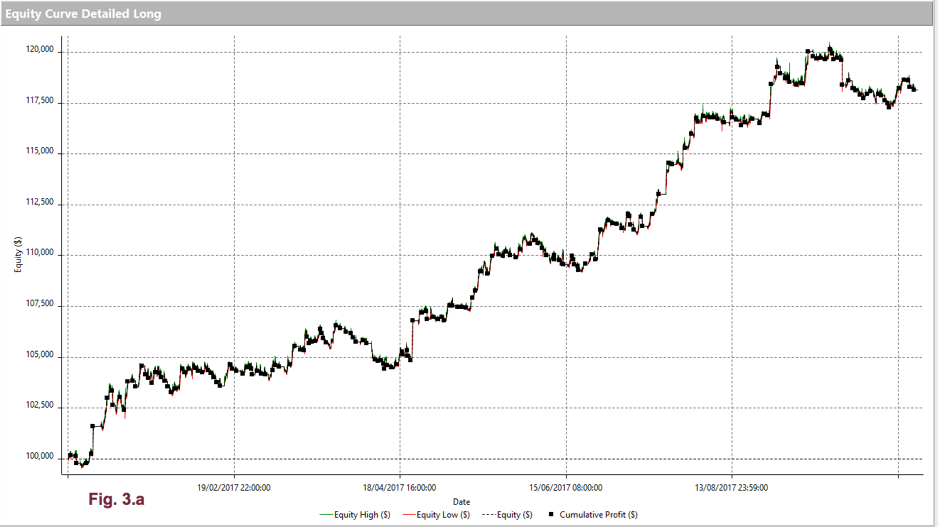
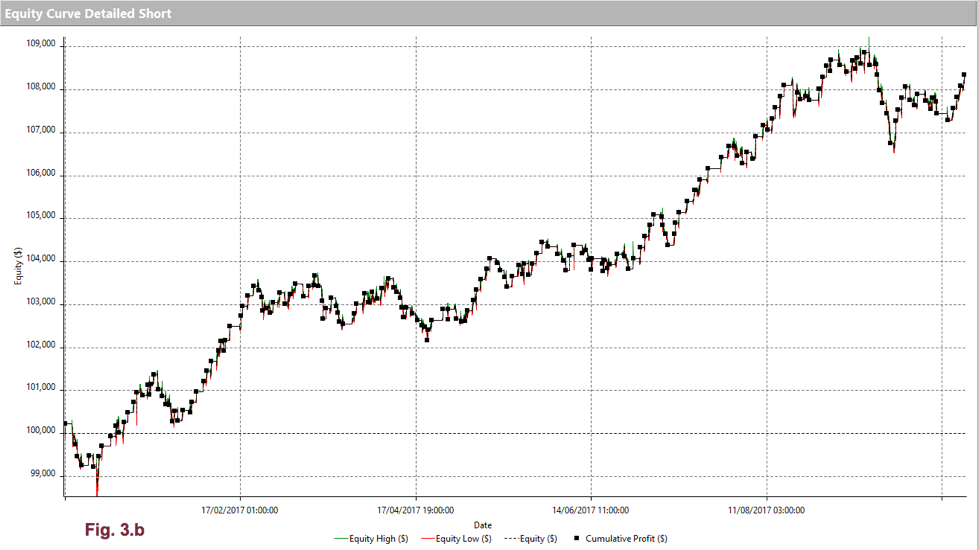
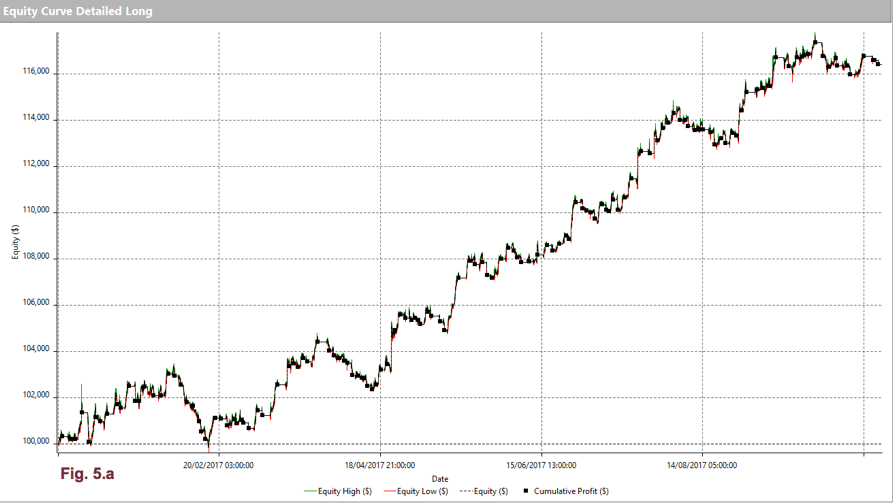
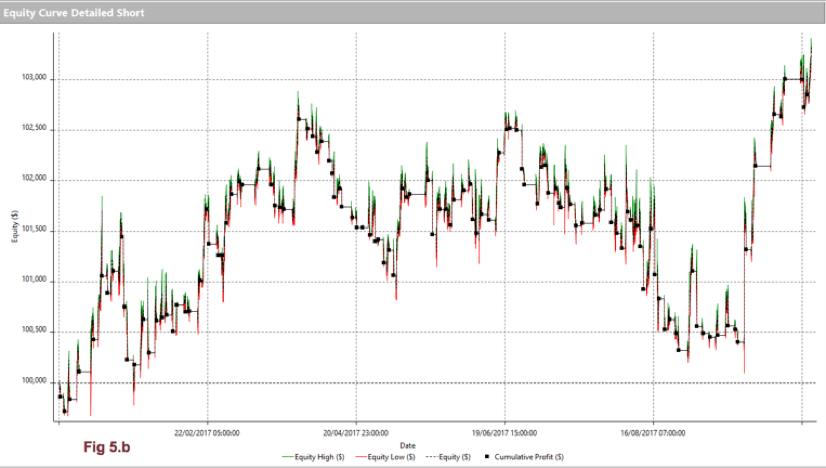
The results, measured on the EURUSD, are not as brilliant as Mr. Welles Wilder stated.
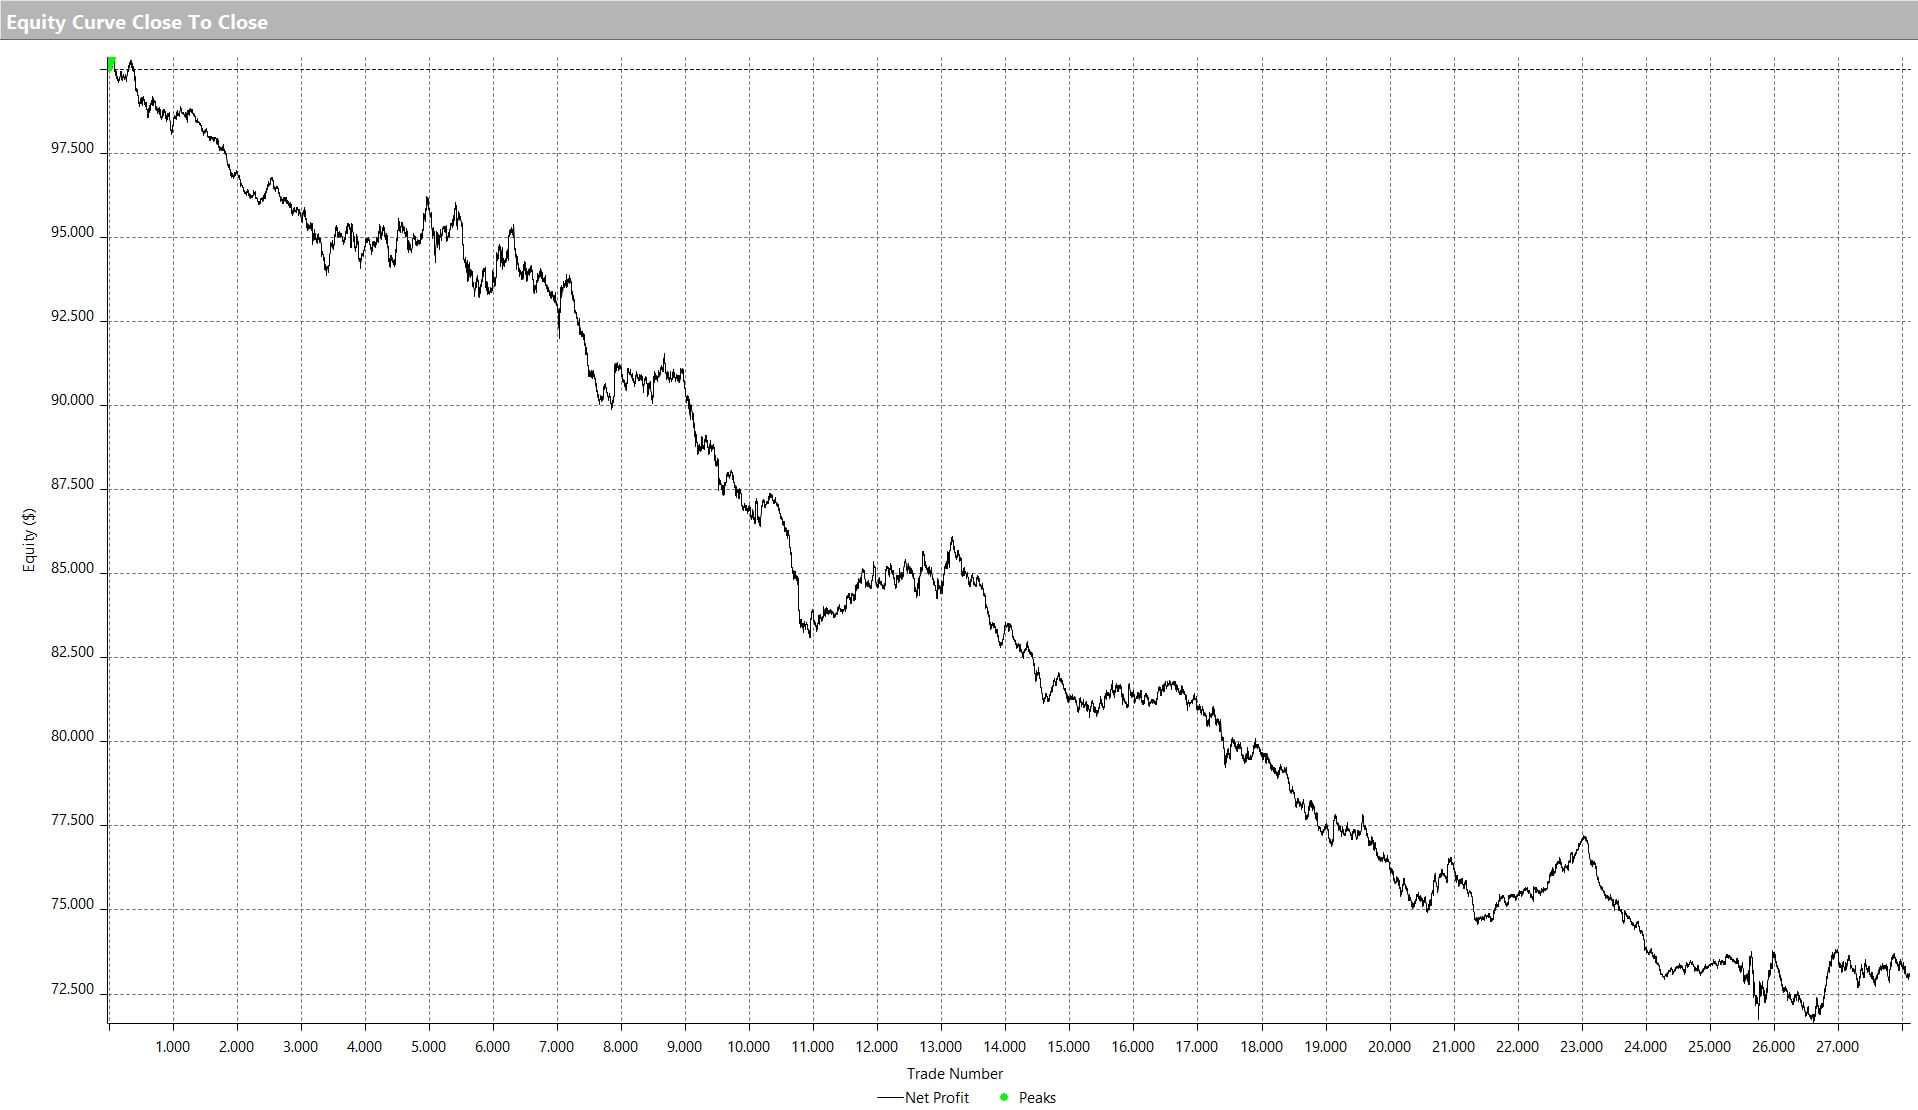
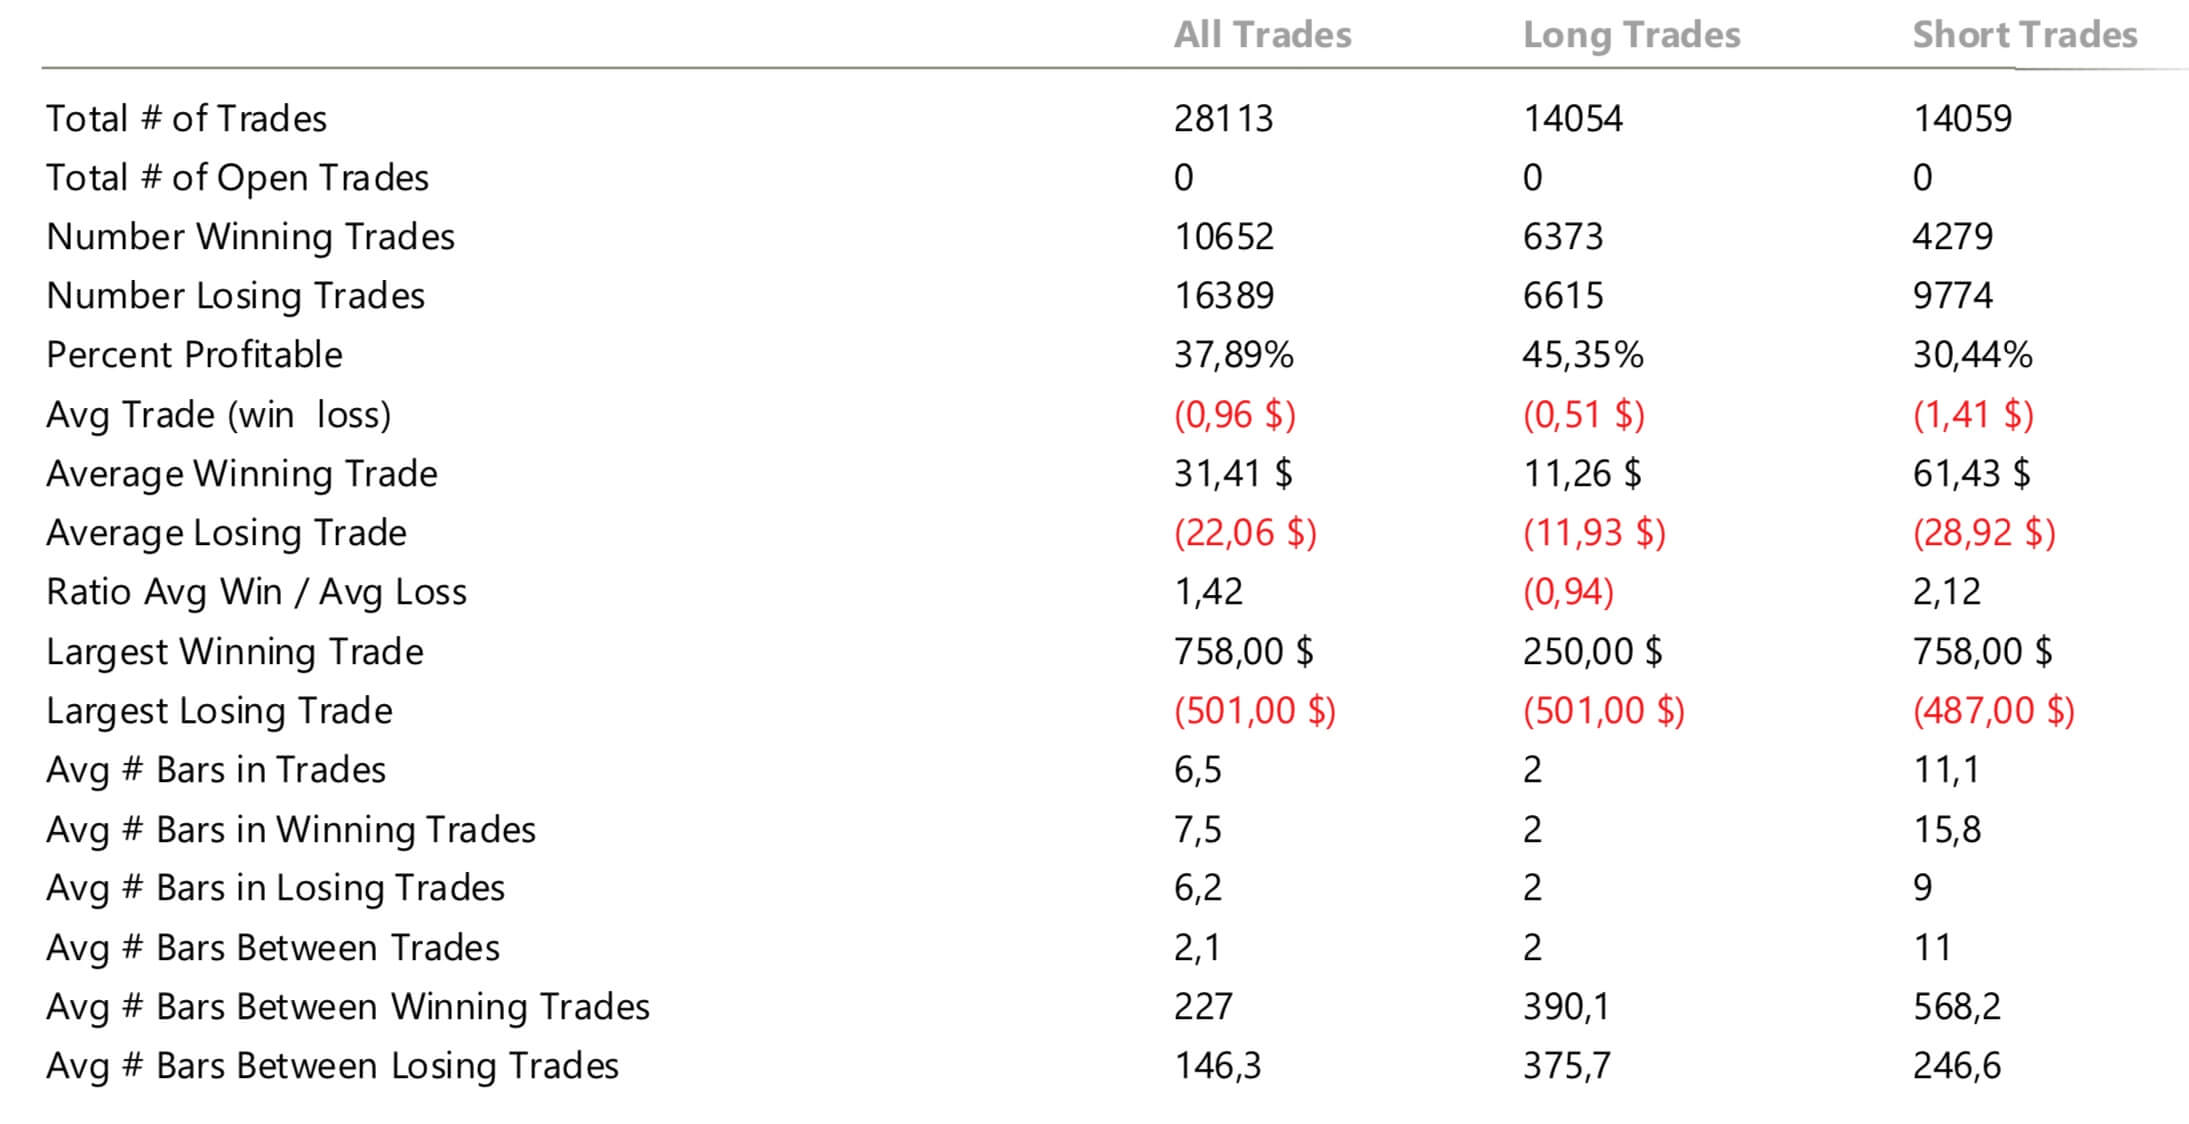
The trade analysis shows that the RSI Failures system, as is, is a losing system. This fact is quite common. It takes time to uncover good ideas for a profitable trading system. In the meantime, we have developed a practical exercise using the finite state machine concept, handy for the future development of our own trading ideas.


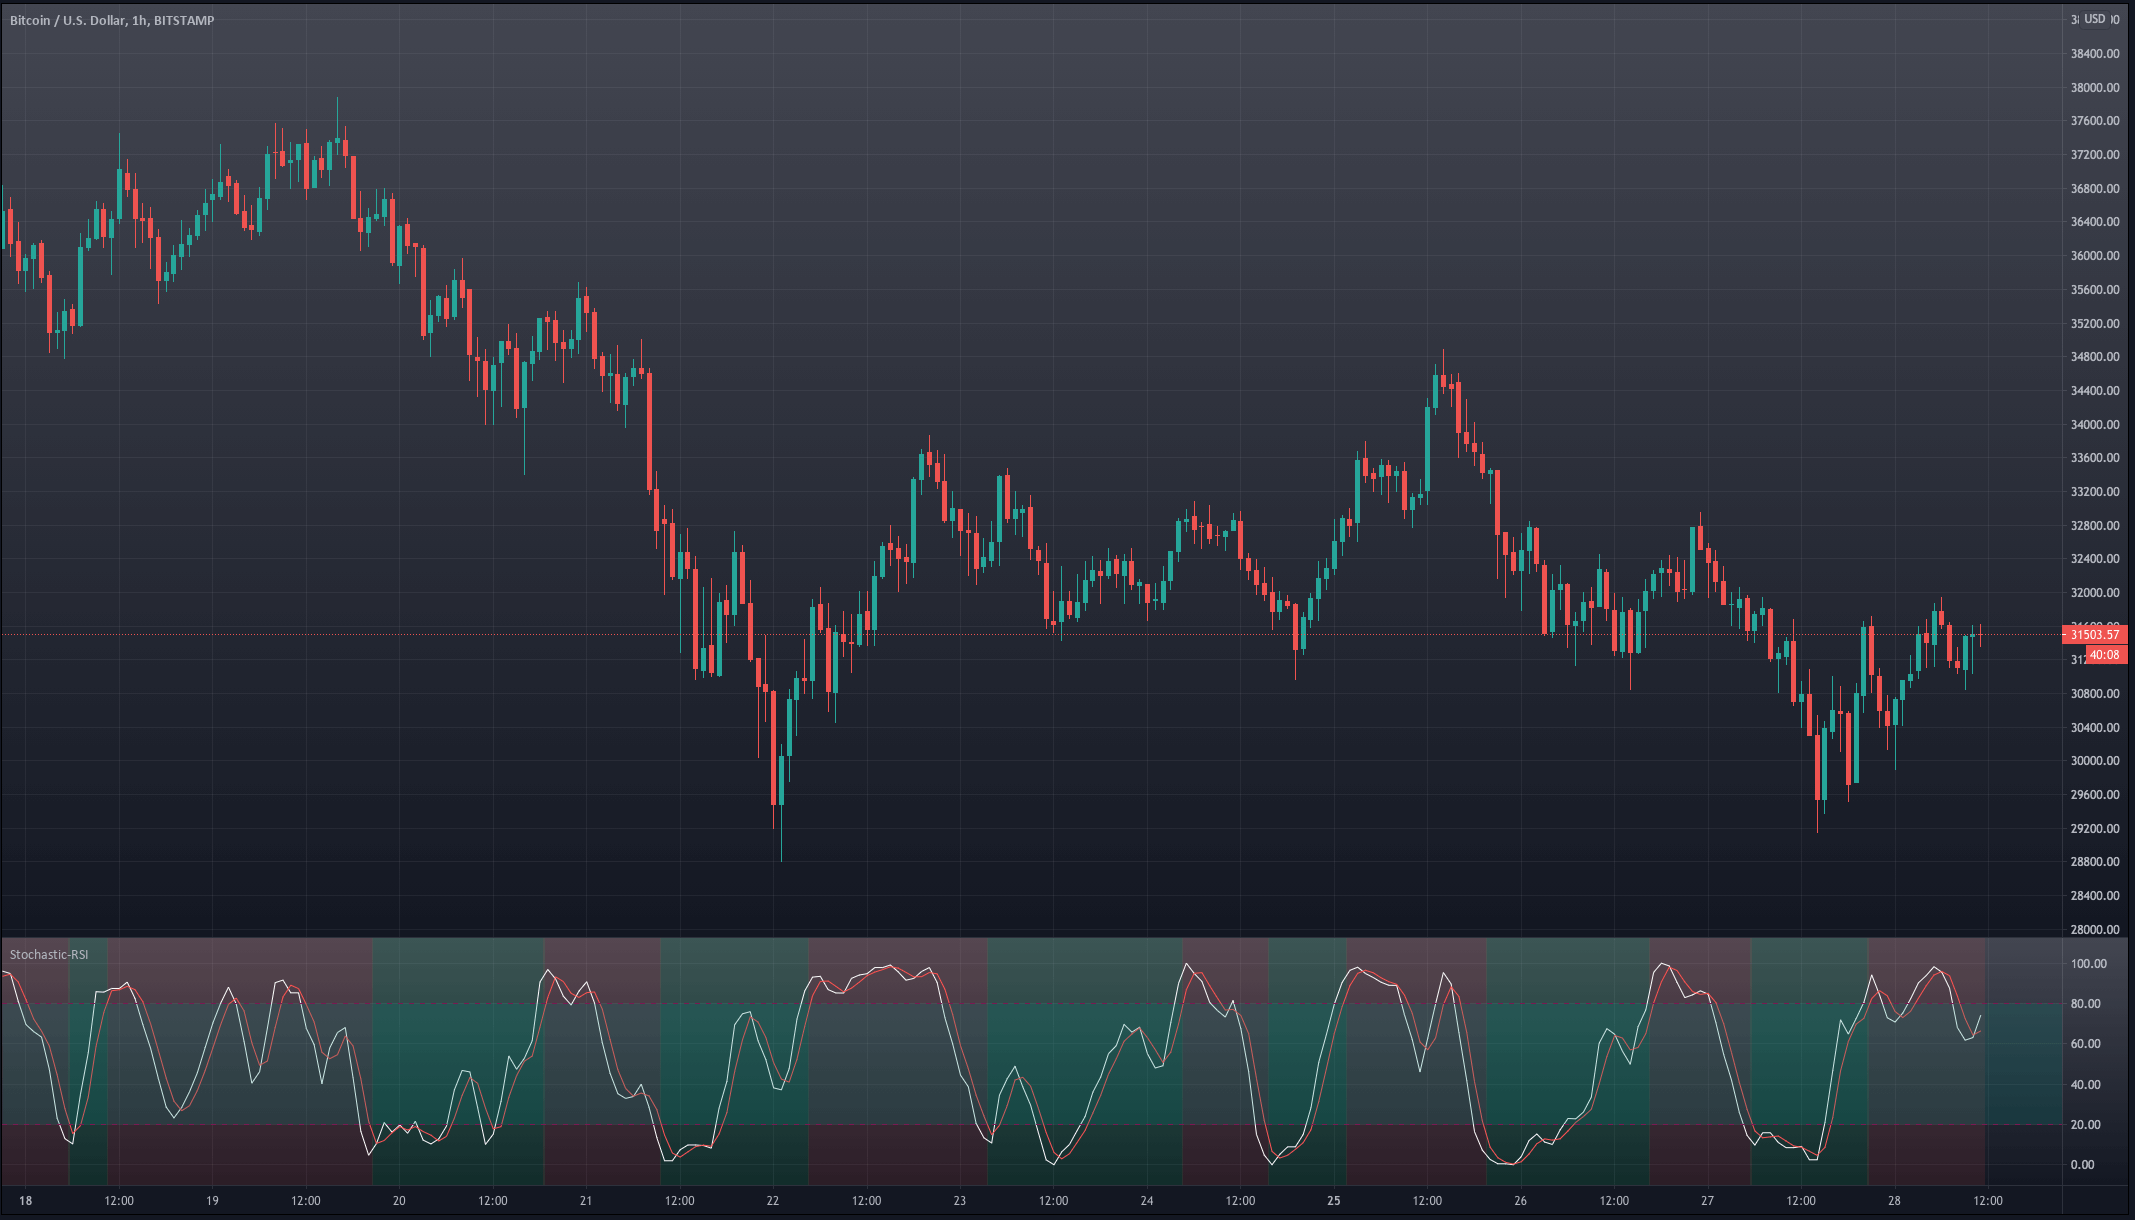
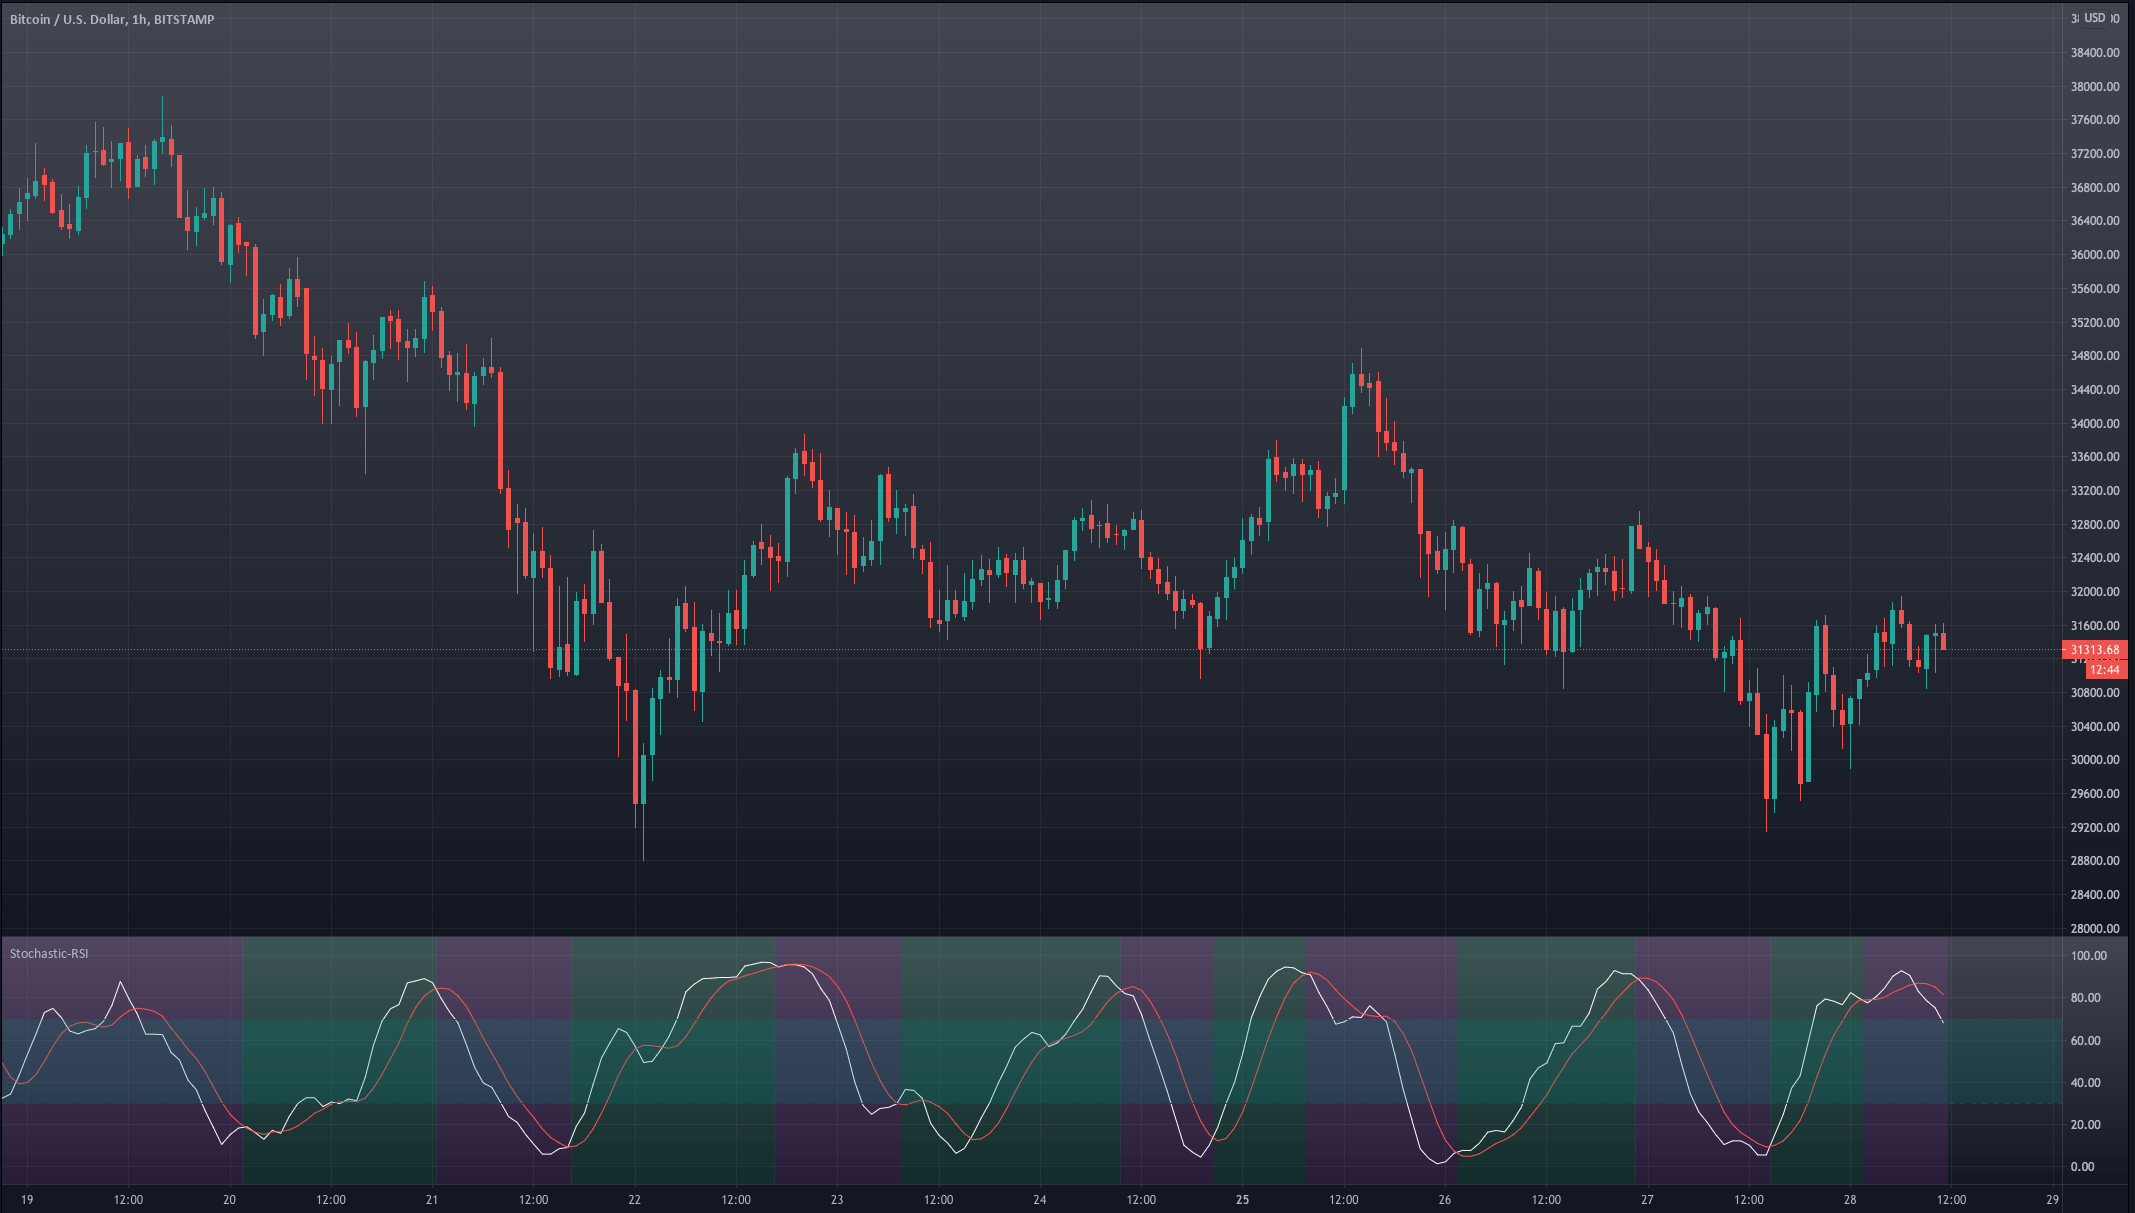
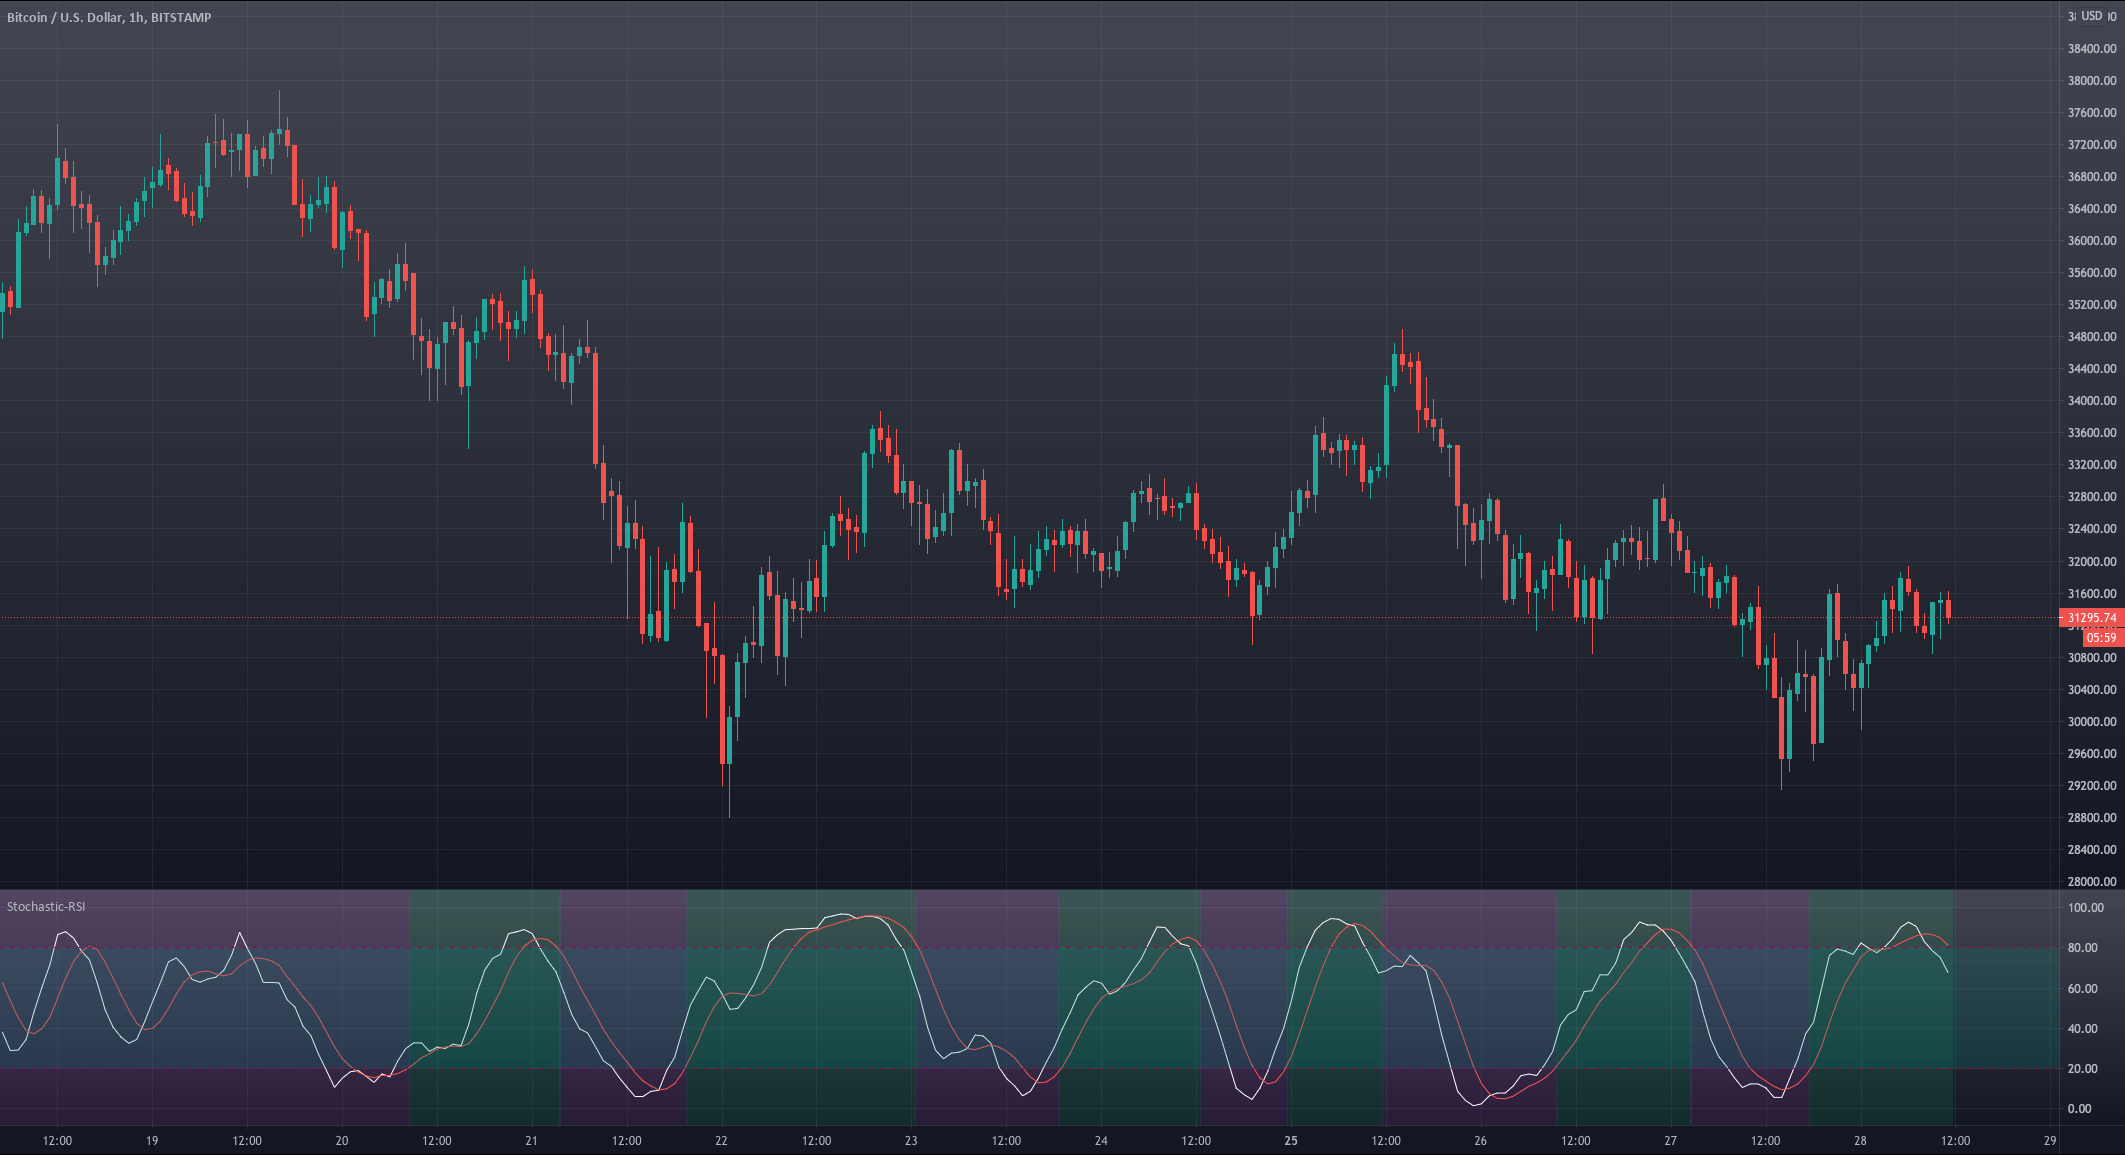

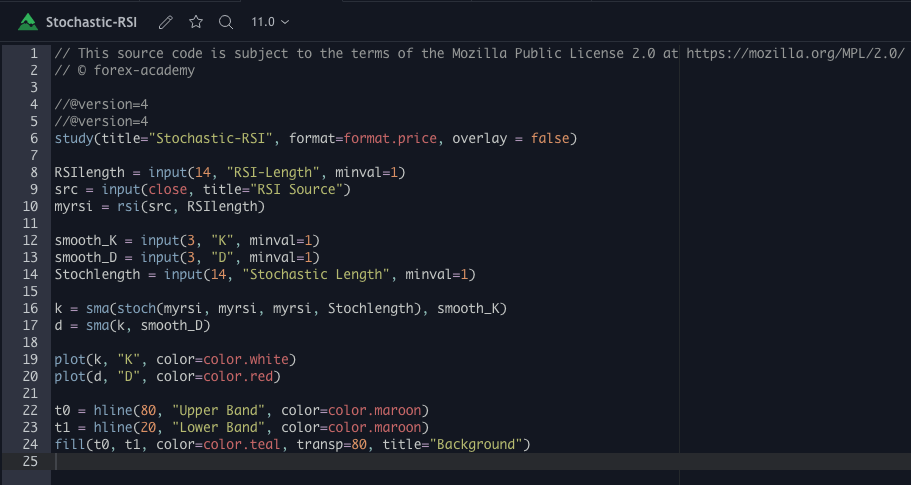
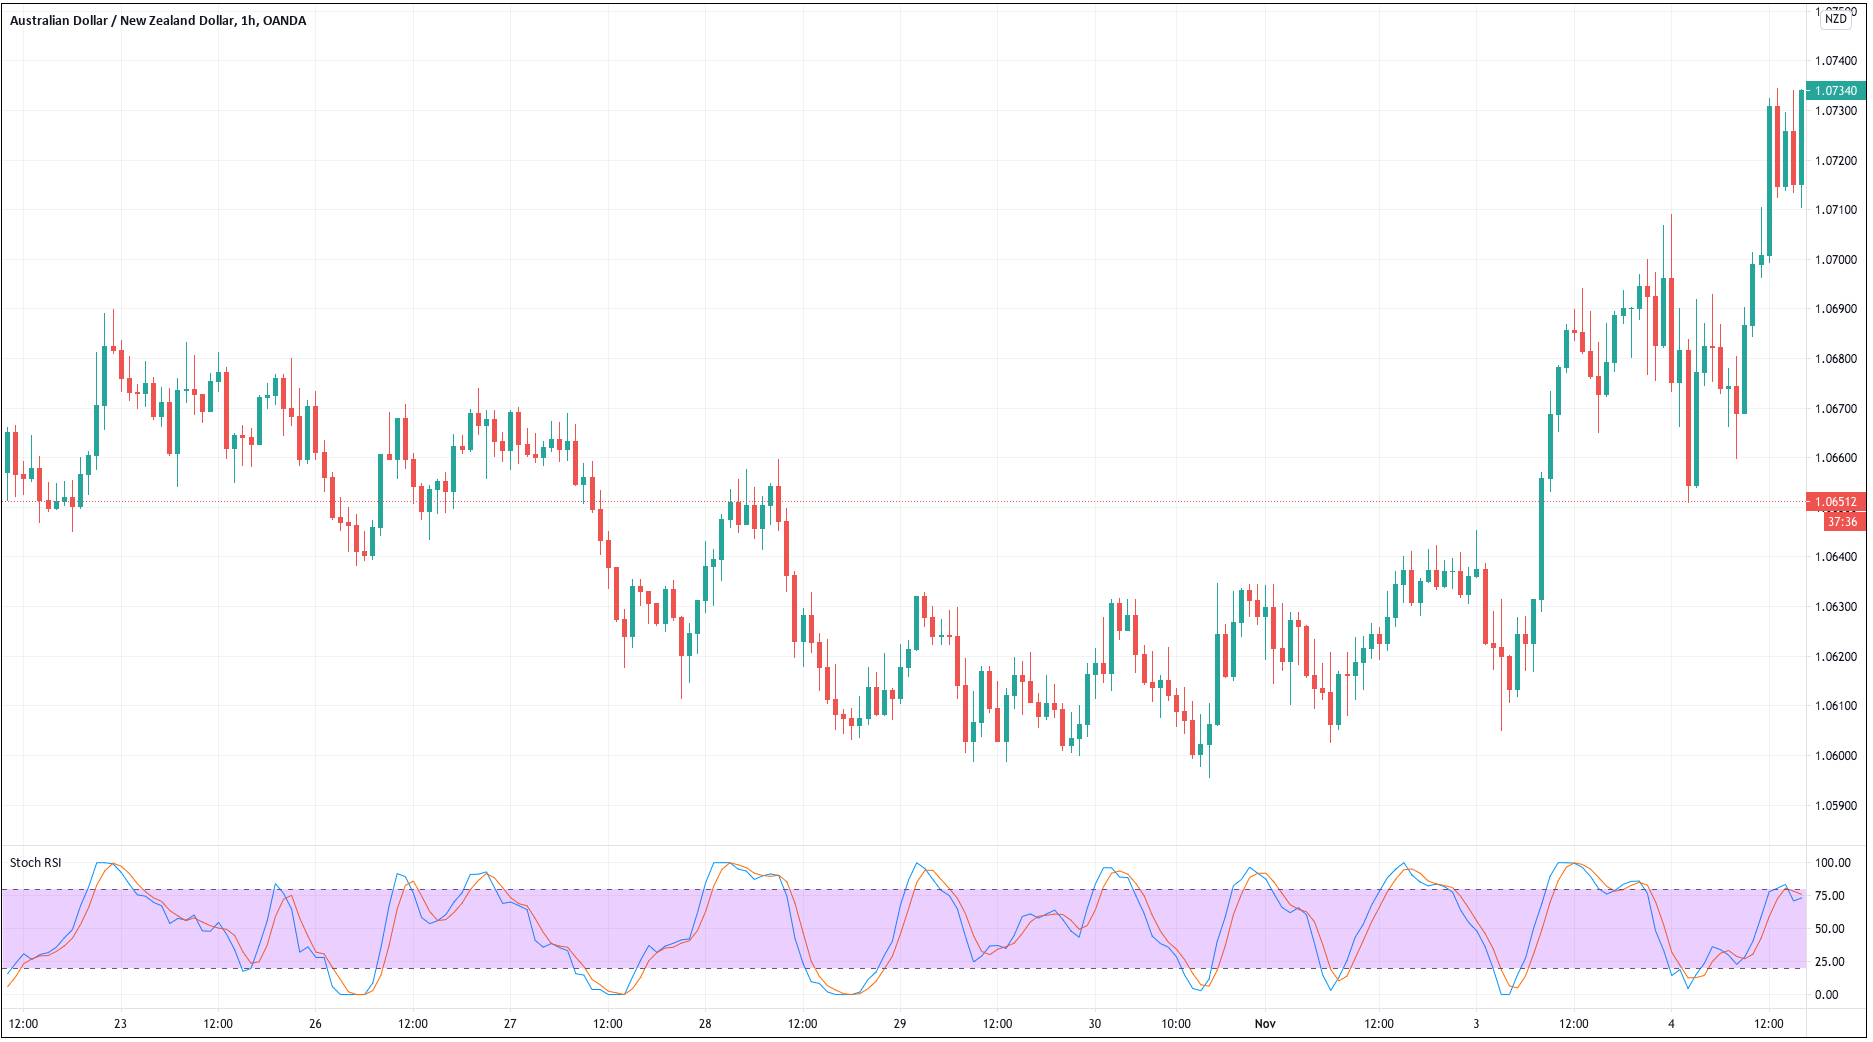
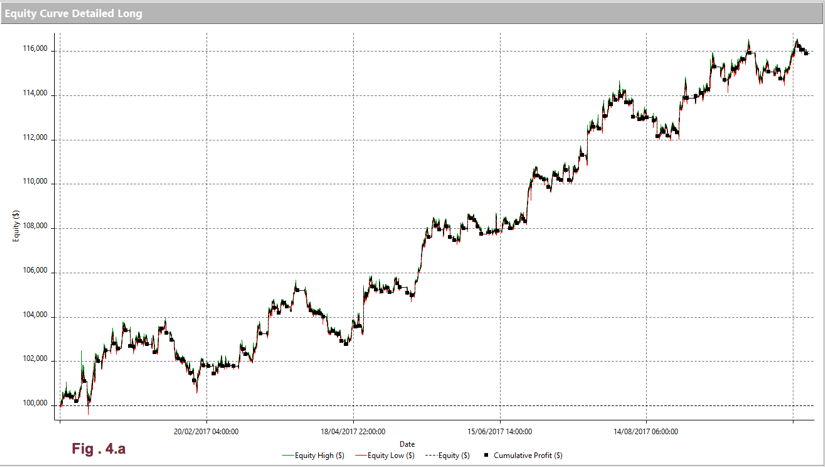
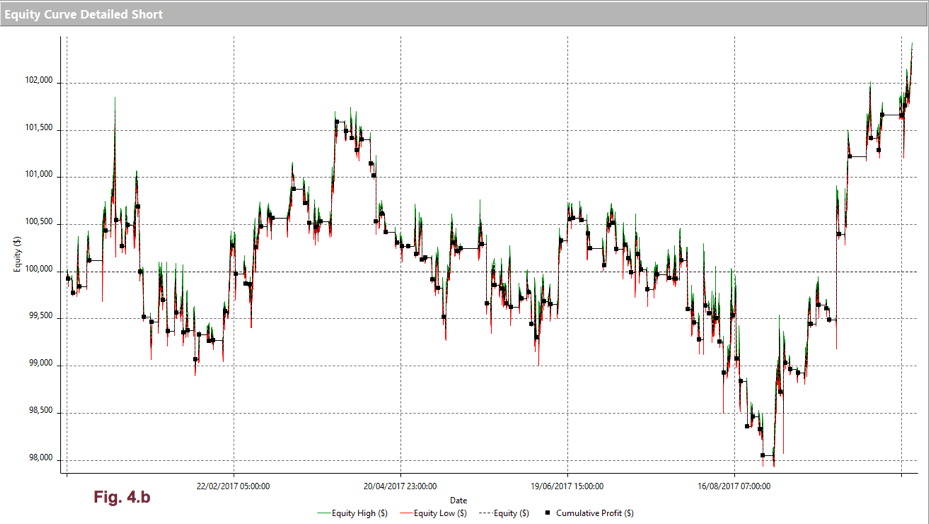
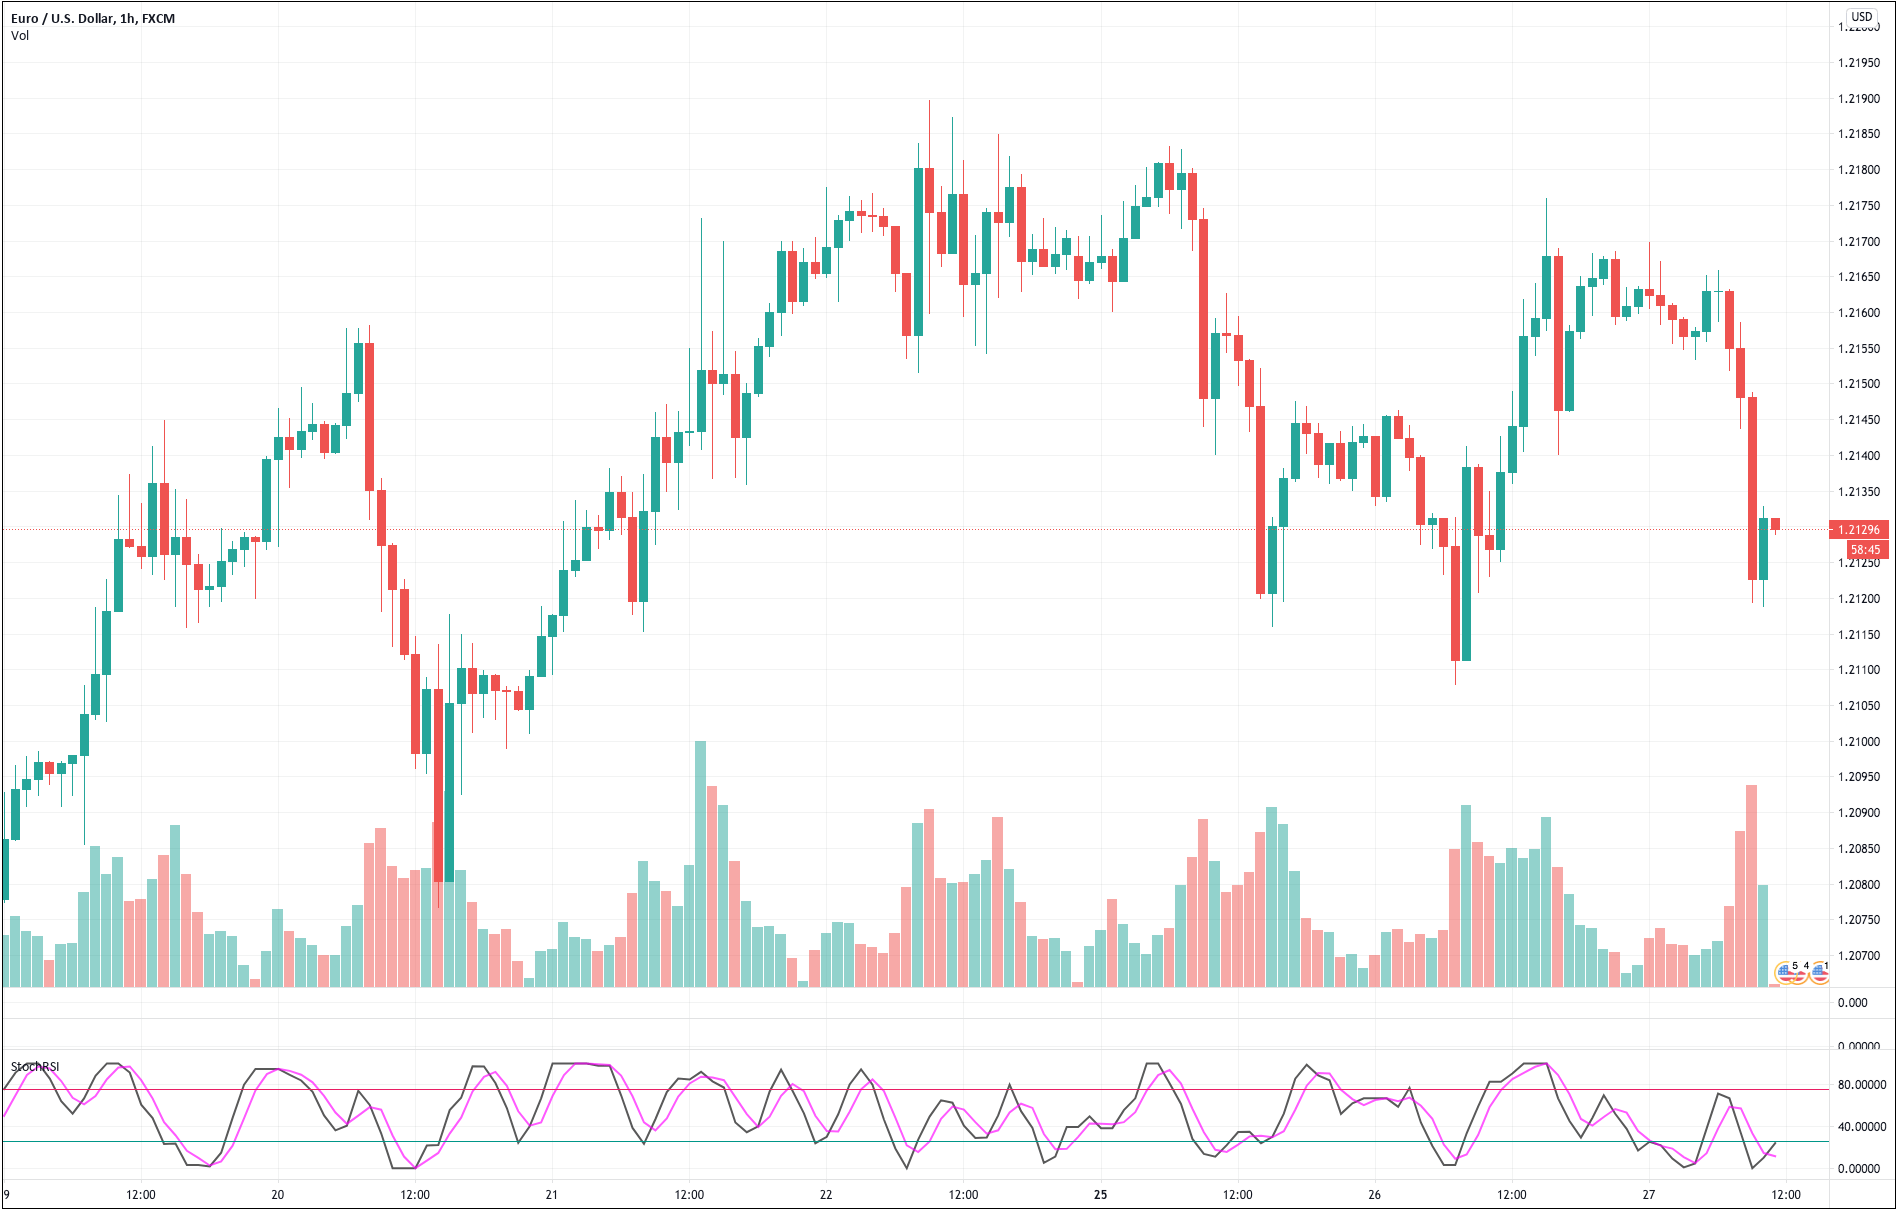 For our example, we will use a simple yet quite exciting indicator called Stochastic RSI, which applies the Stochastic study to the RSI values. This operation smoothes the RSI, and it reveals much better the turning points on mean-reverting markets, such as in Forex. Let’s see how it behaves as a naked strategy.
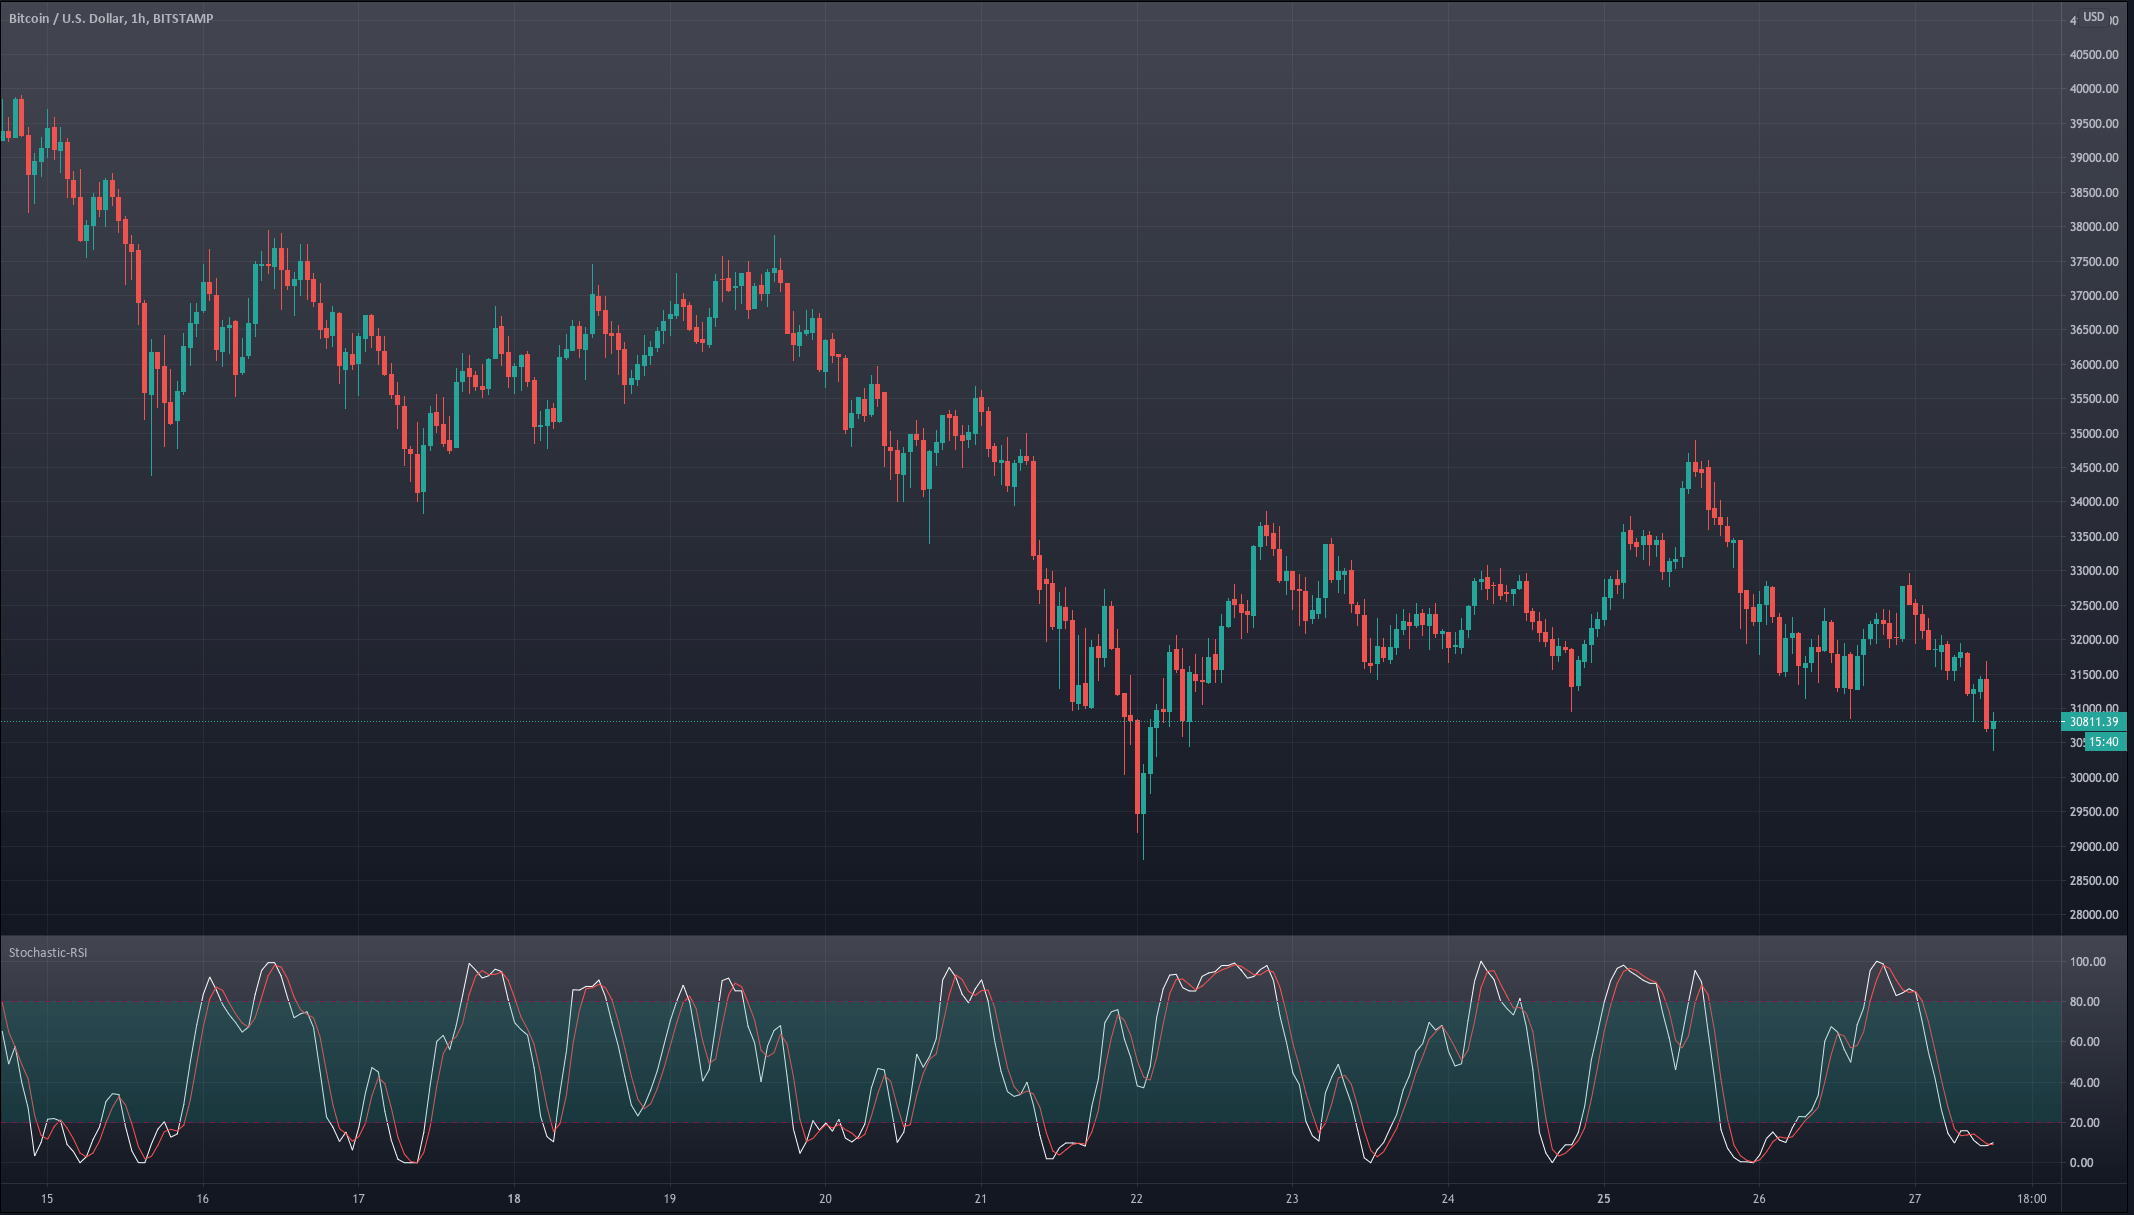


 The first step to see if the idea has merit is to test it in a historical sample under the market conditions it was supposed to operate. Of course, a trading idea is almost always referring to a market entry, as the concept is supposed to time the market. This entry is usually combined with a stop-loss and a
 After 100 backtested trades, the developer has enough information to detect the basic mistakes of the strategy. Maybe the entry has a large lag that hurts profits, or, worse, it is too early, thus triggering the stop-loss too often.

 Traders, especially novice traders, get emotional and lose money because their emotions interfere and stop making rational decisions in the battle’s heat. Thus, the first thing to avoid is
  The rubber band idea describes the price as if it was a rubber band or spring. When it moves far away from equilibrium, we expect the force to pull it to its center to increase and eventually drive it back to equilibrium.
 fferent waves are in sync, and chaotic moves occur when waves desync.


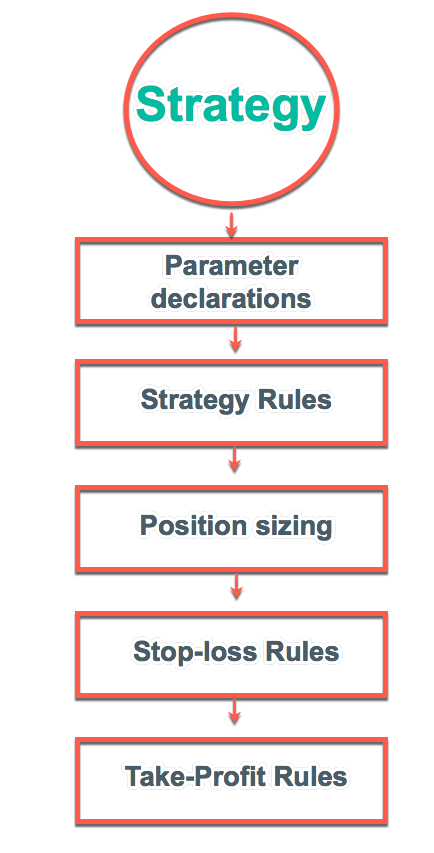
 As said in our previous video, financial markets are unbounded territories where each trader needs to set his own rules; otherwise, they will be influenced by his emotions and fail. A trading system is their set of rules that enable them a long-term success.
 The chosen timeframe should match the availability to trade. A trader with a day job would need to select a daily or a 12-hour timeframe, whereas a full-time trader could use shorter frames, such as 15-min, one, two, or four-hour timeframes.
 A permisioning filter is a way to avoid trading under determined circumstances. It can be a filter that allows only trading in the direction of the primary trend or an overbought/oversold sign that should be on for a determined candlestick or pattern formation to be valid.

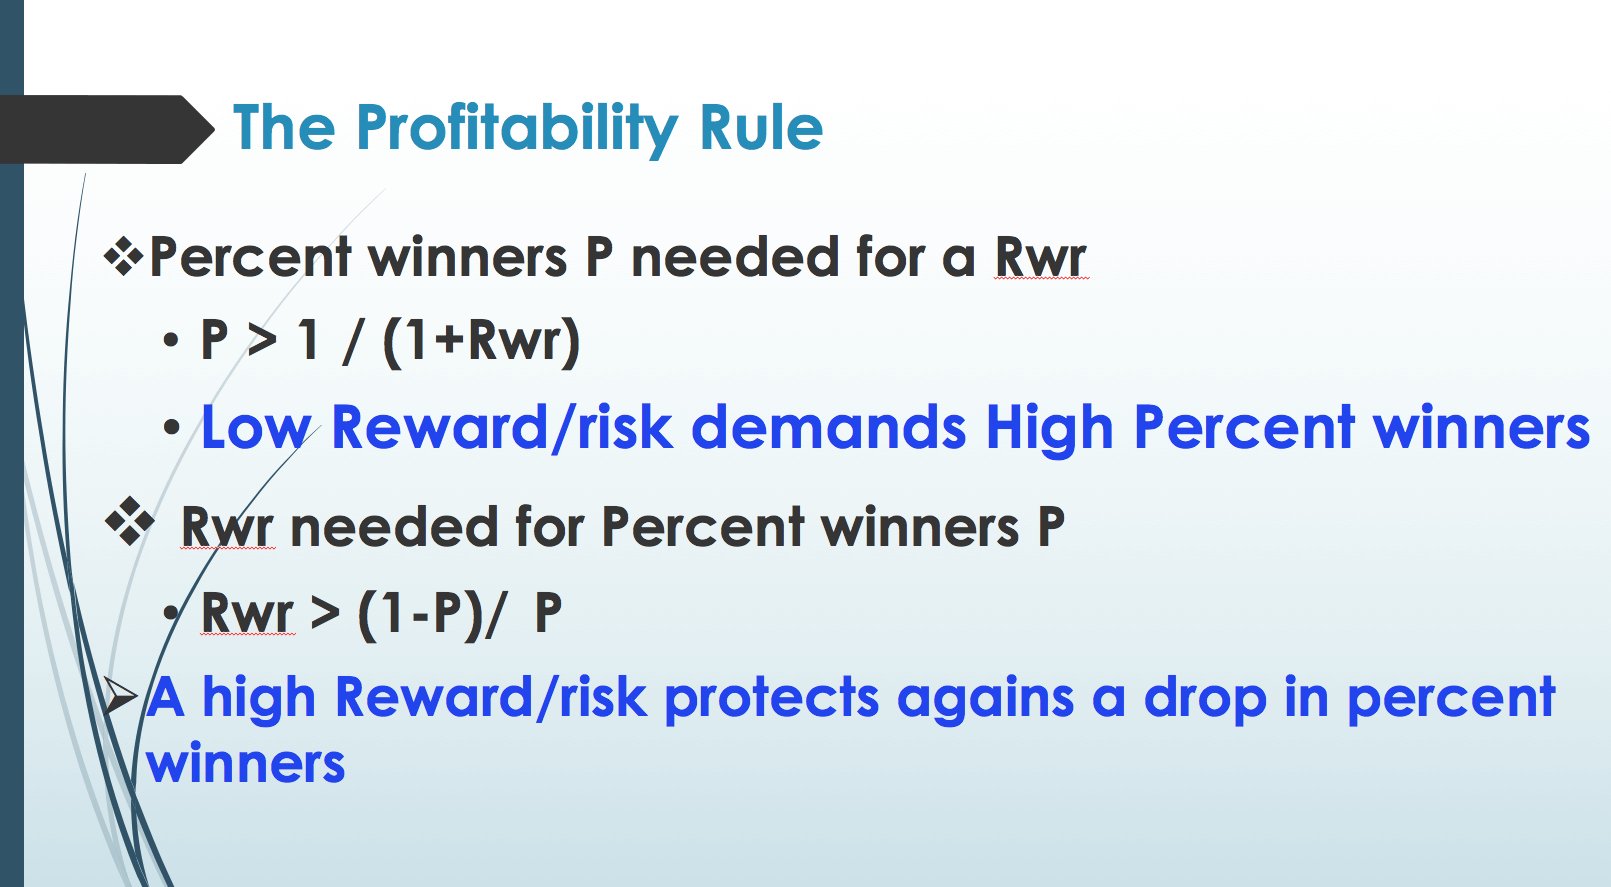
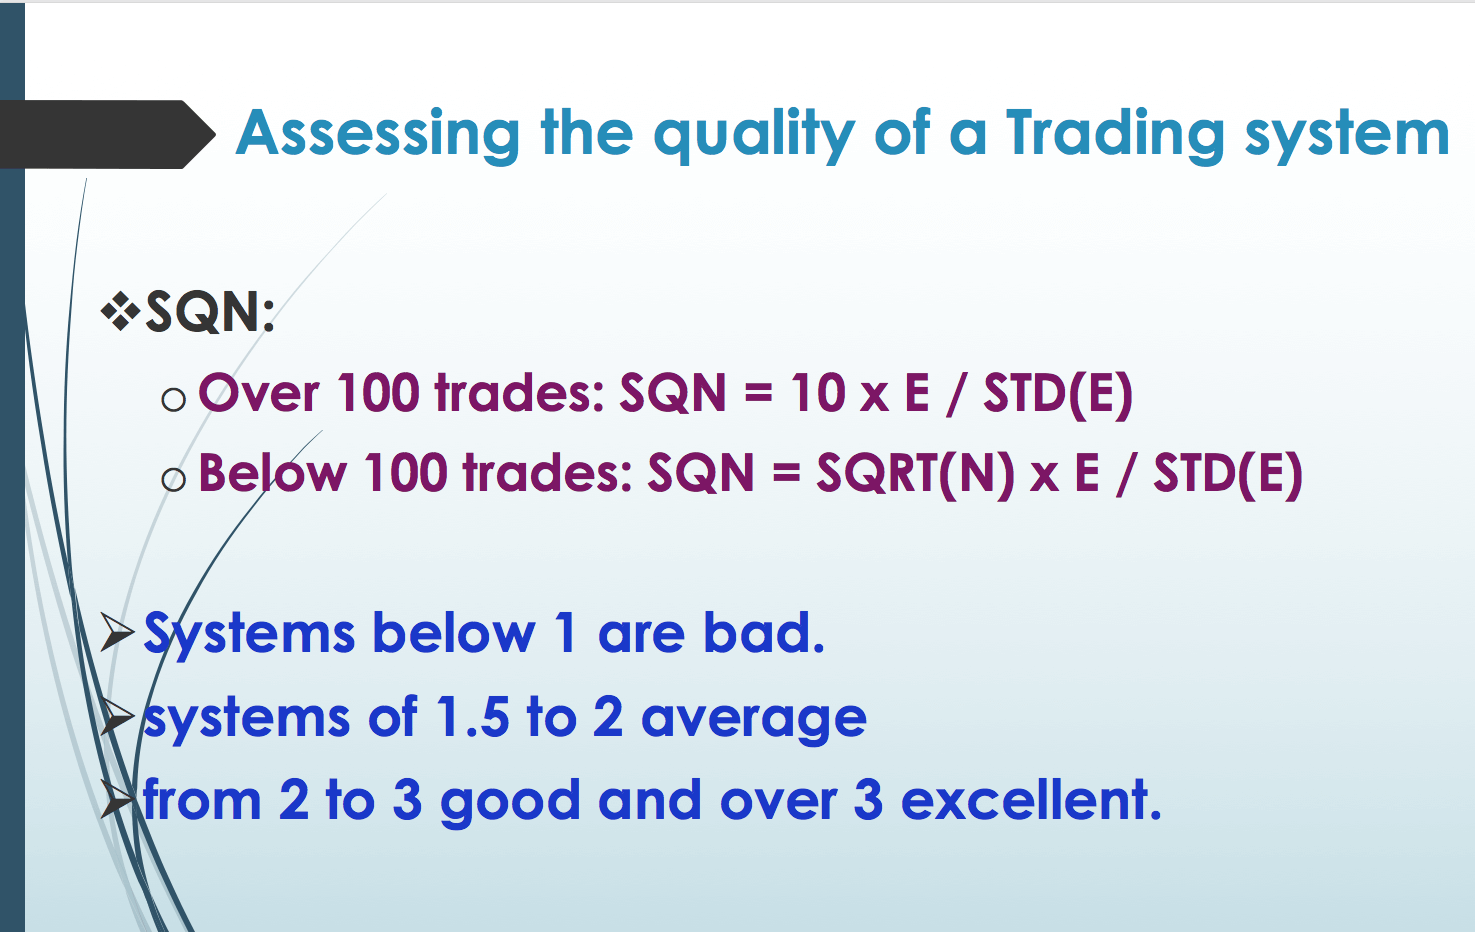
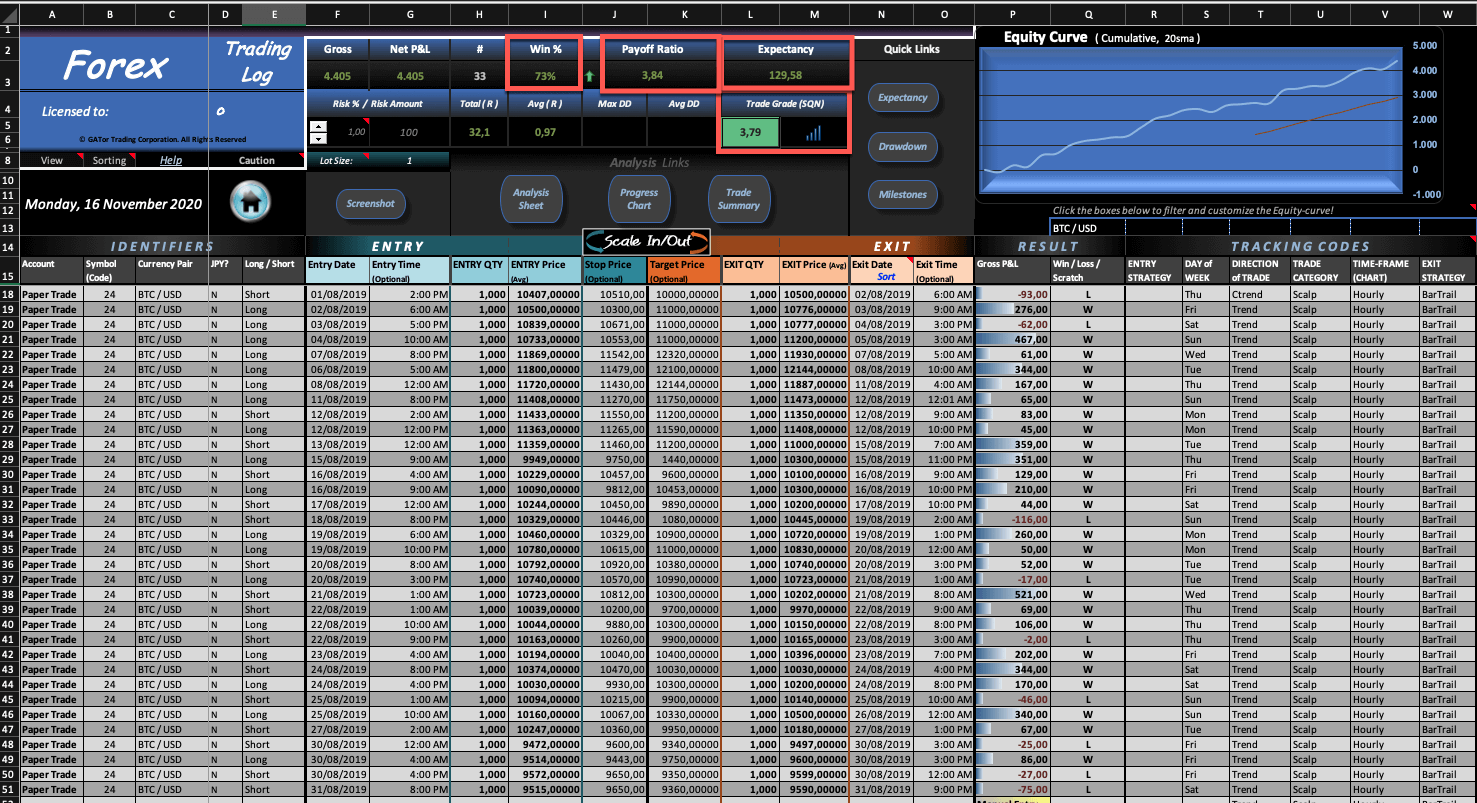
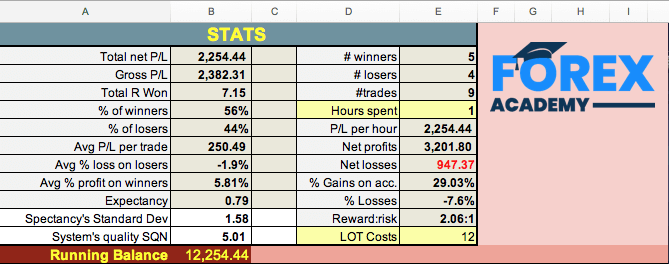
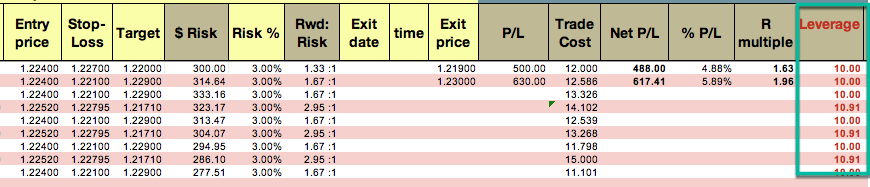
 Position sizing is the part of your plan that tells you how much risk you should take on a trade. We have had a
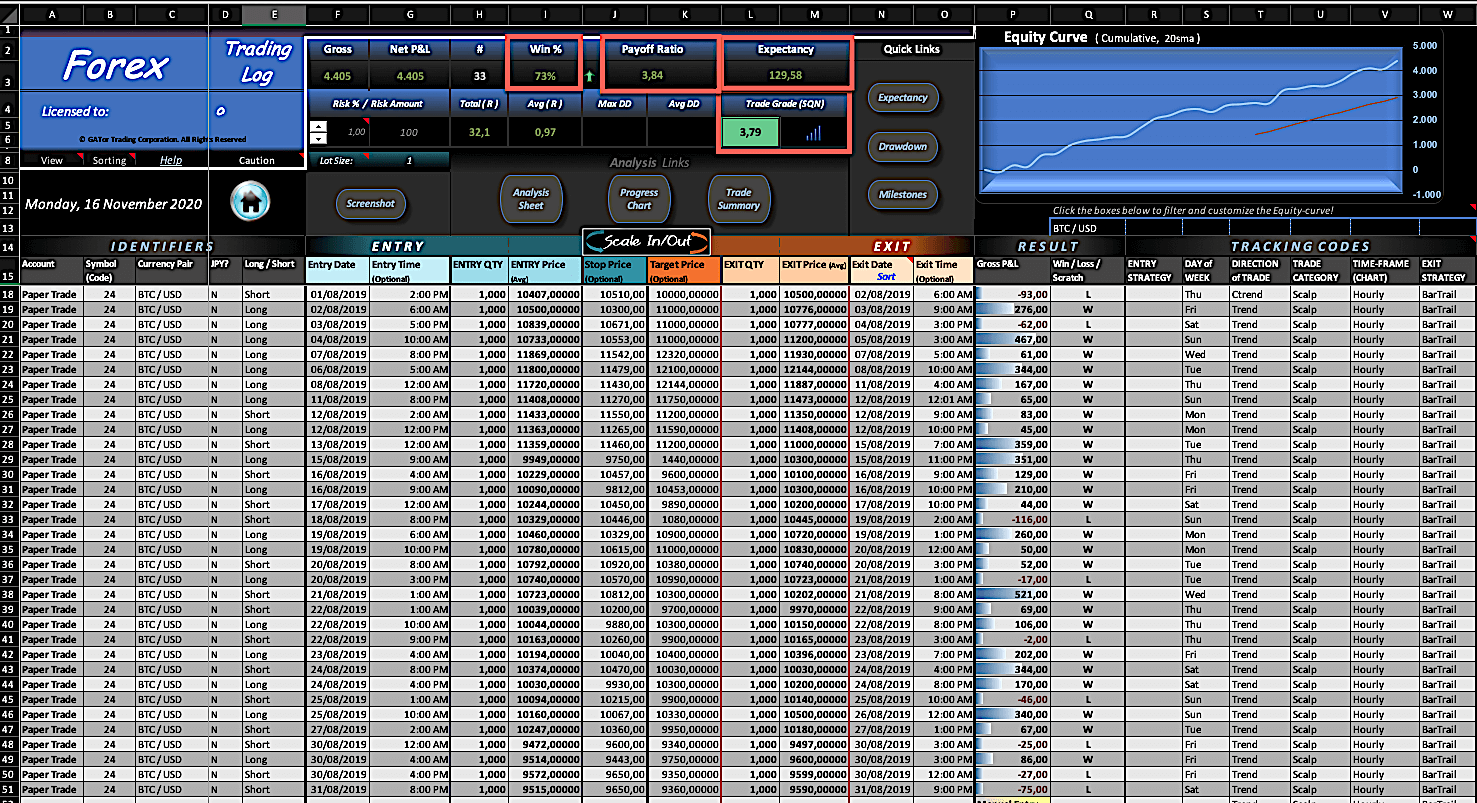


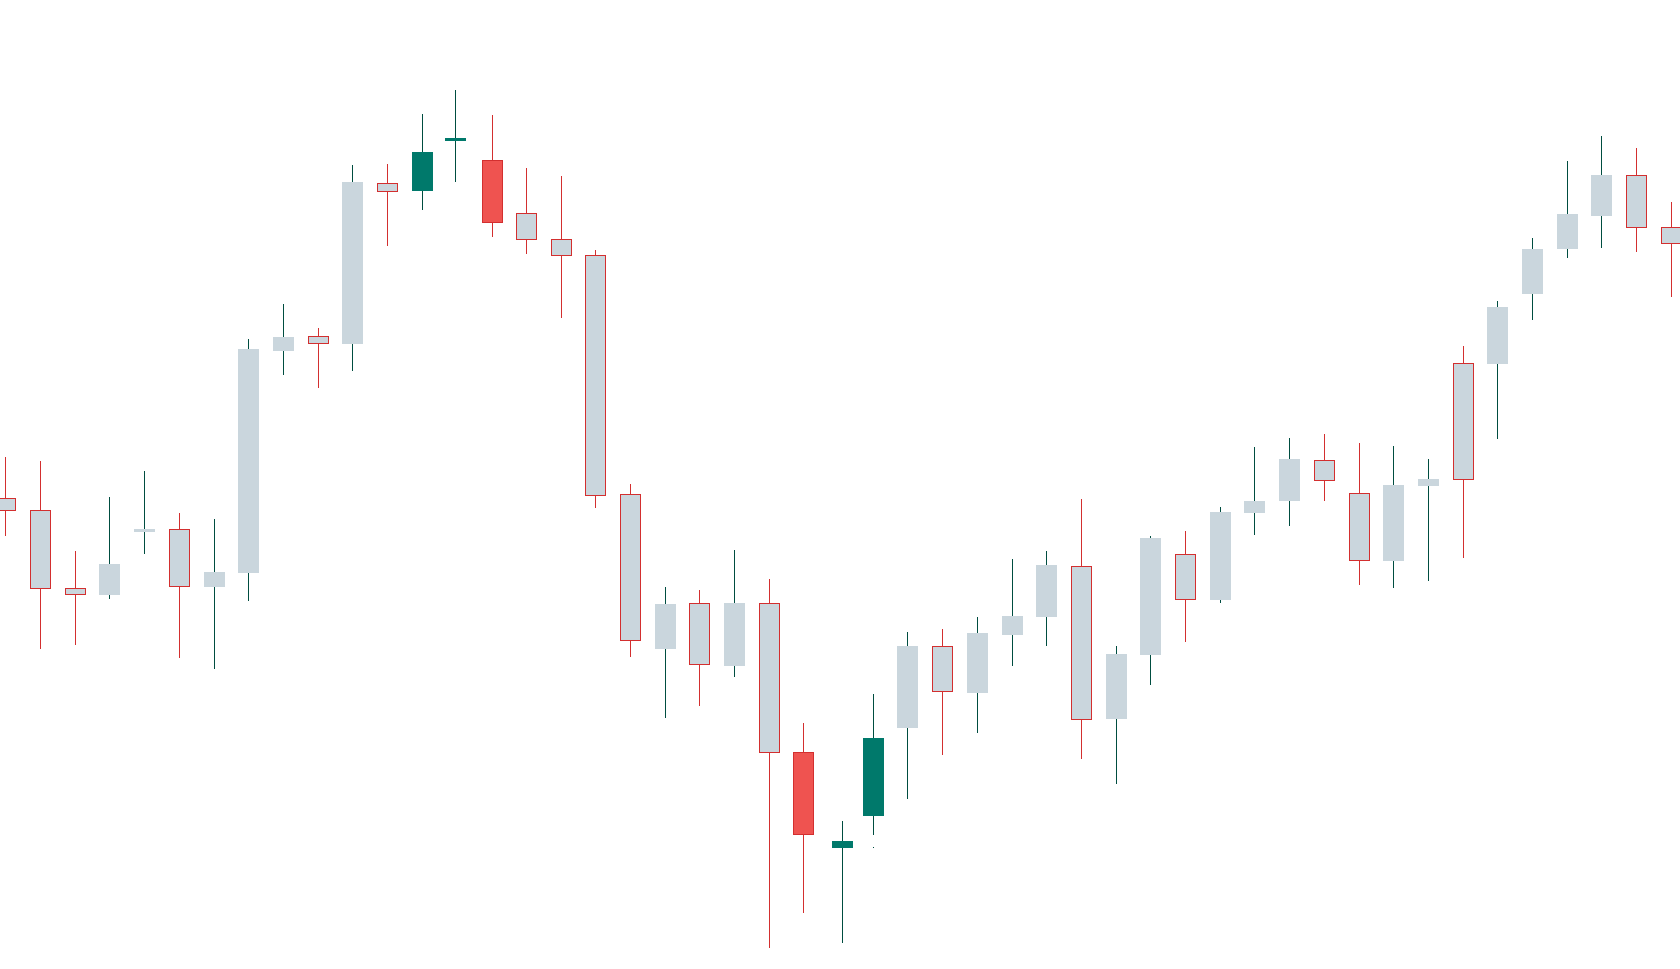
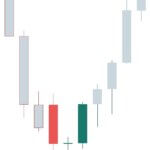
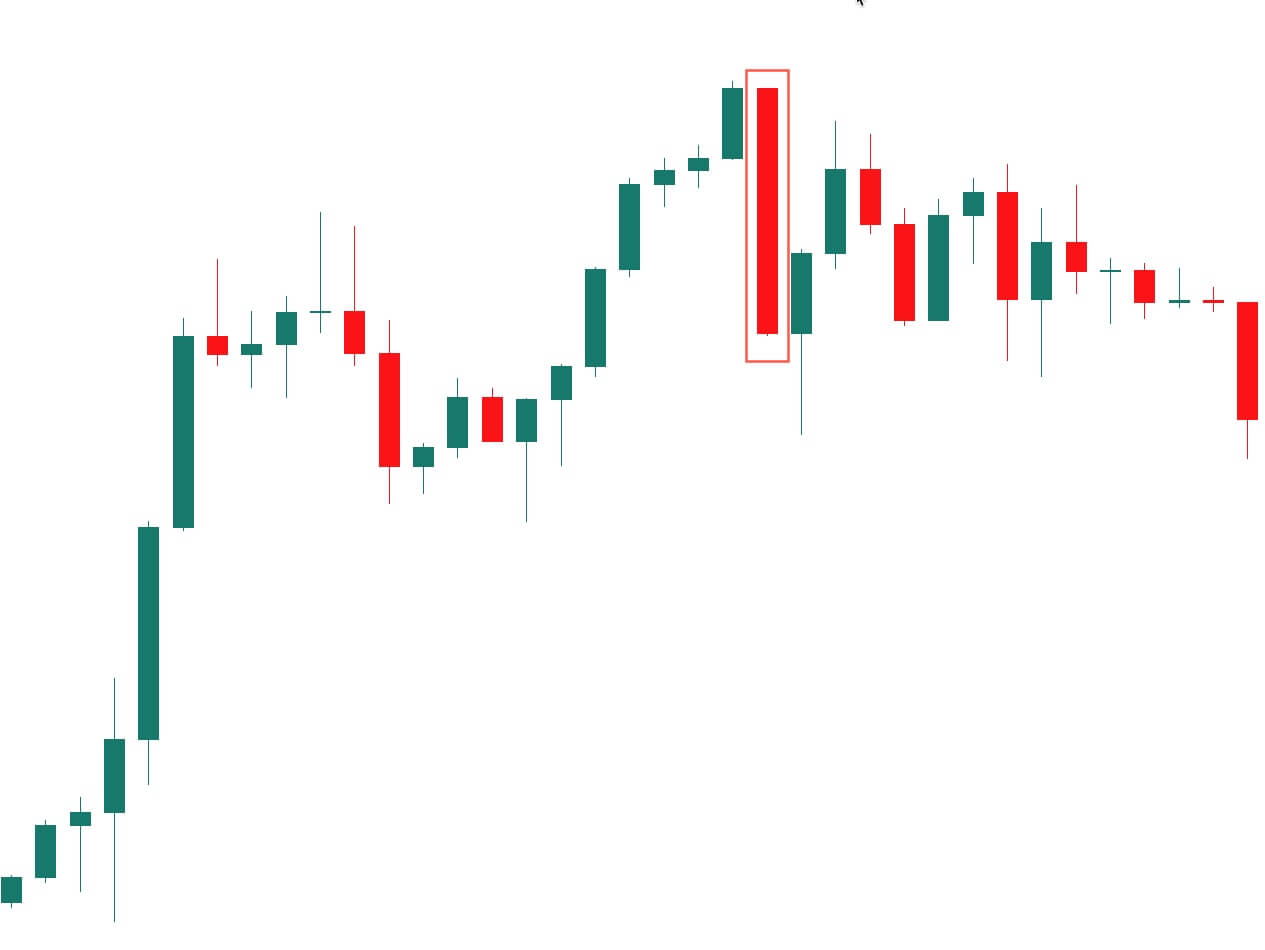
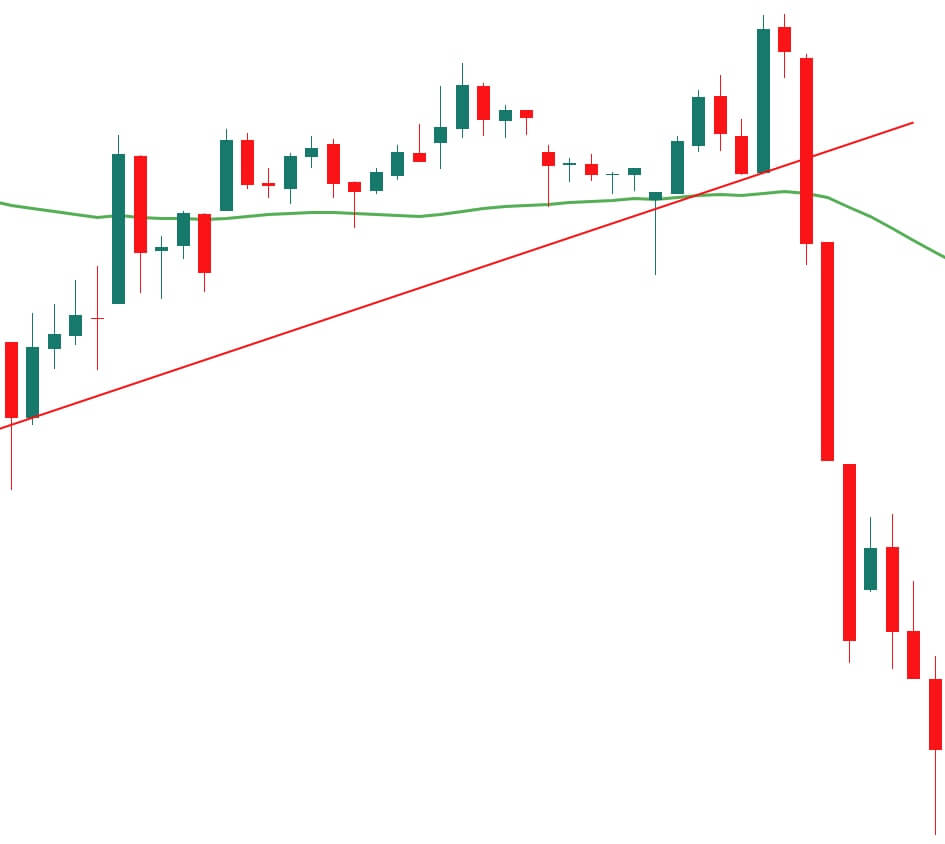
 As the case of the Morning Star, a gap up on the second small-bodied candle followed by a gap down on the third black candle is further confirmation of a reversal, but that seldom happens in the Forex Market. Also, the third candlestick is asked to close below 50 percent of the body of the first white candle.