Categories
Forex Signals

USD/CAD Enters Overbought Zone – Quick Trade Idea! 

The USD/CAD pair was closed at 1.28019 after placing a high of 1.28224 and a low of 1.26851. Since January 11 on Wednesday, amid the US dollar’s broad-based strength and declining crude oil prices, the currency pair rose to its highest. The US Dollar Index measures the greenback’s value against the basket of six major currencies settled above 90.50 level and supported the US dollar. The US dollar gained traction in the market ahead of the US Federal Reserve monetary policy decision and its safe-haven status.

The risk-averse market mood driven by the rising fears about the negative impact of the lockdown restrictions provided support to the safe-haven US dollar. The US dollar strength remained intact even after the Federal Reserve policy announcement on Wednesday and pushed the currency pair USD/CAD higher on board.

The US Federal Reserve kept its interest rates near zero and asset purchase program at the same pace of $120 billion per month. The Bank stated that the US economic recovery remains moderate throughout the month. The economic path was dependent on the progress made in the pandemic and the vaccination program. These comments from the US Central bank and its Chairman gave strength to the local currency greenback that ultimately added gains in the currency pair USD/CAD on Wednesday.

On the data front, at 18:30 GMT, the Core Durable Goods Orders for December increased to 0.7% against the projected 0.5% and supported the US dollar that added further gains in the USD/CAD pair. In December, the Durable Goods Orders weakened to 0.2% against the projected 1.0%, weighed on the US dollar, and capped further upside momentum in the USD/CAD pair.

On the other hand, there was no macroeconomic data from the Canadian side, and on the West Texas Intermediate (WTI) crude oil front, the oil remained under pressure due to rising prices of the US dollar. The crude oil fell to $51.84 on Wednesday and weighed on the commodity-linked currency Loonie, which ultimately pushed the already rising USD/CAD pair. 


Entry Price – Sell 1.2879

Stop Loss – 1.2930

Take Profit – 1.2810

Risk to Reward – 1:1

Profit & Loss Per Standard Lot = -$400/ +$400

Profit & Loss Per Micro Lot = -$40/ +$40

Fellas, now you can check out forex trading signals via Forex Academy mobile app. Follow the links below.

iPhone Users: https://apps.apple.com/es/app/fasignals/id1521281368

Andriod Users: https://play.google.com/store/apps/details?id=academy.forex.thesignal&hl=en_US

Categories
Forex Basic Strategies Forex Indicators Forex Service Review Forex Services Reviews-2

Market Profile Singles Indicator Review

Today we will examine the Market Profile Singles Indicator (we could also call it a single print indicator or gap indicator), which is available on the mql5.com market in metatrader4 and metatrader5 versions.

The developer of this indicator is Tomas Papp, who is located in Slovakia, and currently has 7 products available on the MQL5 market.

It is fair to point out that four of his products are completely FREE and are in a full-working version. These are: Close partially, Close partially MT5, Display Spread meter, Display Spread meter MT5. So it’s definitely worth a try.

Overview of the Market Profile Singles 

This indicator is based on market profile theory. It was designed to show “singles areas.” But, what exactly is a singles area?

Theory of the Market Profile Singles

Singles, or single prints, or gaps of the profile are placed inside a profile structure, not at the upper or lower edge. They are represented with single TPOs printed on the Market profile. Singles draw our attention to places where the price moved very fast (impulse movements). They leave low-volume nodes with liquidity gaps and, therefore, the market imbalance. Thus, Singles show us an area of imbalance. Singles are usually created when the market reacts to unexpected news. These reports can generate extreme imbalances and prepare the spawn for the extreme emotional reactions of buyers and sellers.

The market will usually revisit this area to examine as these price levels are attractive for forex traders, as support or resistance zones. Why should these traders be there? Because the market literally flew through the area, and only a small number of traders got a chance to trade there. For this reason, these areas are likely to be filled in the future.

The author also adds: “These inefficient moves tend to get filled, and we can seek trading opportunities once they get filled, or we can also enter before they get filled and use these single prints as targets.”

The author points out: Used as support/resistance zones, but be careful not always. Usually, it works very well on trendy days. See market profile days: trend day (Strategy 1 – BUY – third picture) and trend day with double distribution (Strategy 1 – SELL- third picture).

Practical use of the Market Profile Singles Indicator

So let’s imagine the strategies that the author himself recommends. Of course, it’s up to you whether you use these strategies or whether you trade other strategies for the singles area. Here we will review the following ones:

  • Strategy 1: The trend is your friend
  • Strategy 2: Test the nearest level
  • Strategy3: Close singles and continuing the trend

The author comments that these three strategies are common and repeated in the market, so it is profitable to trade them all.

The recommended time frame is M30, especially when using Strategy 2.

It is good to start the trend day and increase the profit, but be aware that trendy days happen only 15 – 20% of the time. Therefore, the author recommends mainly strategy 2, which is precise 75-80% of the time.


Strategy 1 – BUY :

  1. A bullish trend has begun.
  2. The singles area has been created.
  3. The prize moves sideways and stays above the singles area.
  4. We buy above the singles area and place the stop loss under the singles area.
  5. We place the profit target either according to the nearest market profile POC or resistance or under the nearest singles area. We try to keep this trade as long as possible because there is a high probability that the trend will continue for more days.

Strategy 1 – SELL :

  1. The bear trend has begun.
  2. The singles area has been created.
  3. The prize goes to the side and stays under the singles area.
  4. We sell below the singles area and place the stop loss above the singles area.
  5. We will place the target profit either according to the nearest market profile POC or support or above the nearest singles area. We try to keep this trade as long as possible because there is a high probability that the trend will continue for more days.


Before we start with Strategy 2, let’s explain the Initial Balance(IB) concept. IB is the price range of (usually) of the first two 30-minute bars of the session of the Market Profile. Therefore, Initial Balance may help define the context for the trading day.

The IBH (Initial Balance High) is also seen as an area of resistance, and the IBL (Initial Balance Low) as an area of support until it is broken.

Strategy 2 – one day – BUY:

This strategy will take place on a given day.

  1. There is a singles area near IB. (a singles area was created on a given day)
  2. The price goes sideways or creates a V-shape
  3. We expect to return to the singles area or IB. We buy low and place the stop loss below the daily low (preferably a little lower) and place the target profit below the IBL (preferably a little lower).


Strategy 2 – one day – SELL:

This strategy will take place on a given day.

  1. There is a singles area near IB. (a singles area was created on a given day)
  2. The price goes sideways or creates a reversed font V
  3. We expect to return to the singles area or IB. We sell high and place the stop loss above the daily high (preferably a little higher) and place the target profit above the IBH (preferably a little higher).


Strategy 2- more days- BUY:

This strategy takes more than one day to complete (Singles were created one or more days ago)

  1. After the trend, the price goes sideways and does not create a new low (or only minimal but with big problems)
  2. Nearby is a singles area (Since the price cannot go to one side, there is a high probability that these singles will close).
  3. We buy at a low, placing a stop-loss order a bit lower. We will place the target profile under the singles area.


Strategy 2- more days- SELL:

This strategy takes longer than one day (Singles were created one or more days ago)

  1. After the trend, the price goes to the side and does not create a new high (or only minimal but with big problems)
  2. Nearby is a singles area ( Since the price cannot go to one side, there is a high probability that these singles will close ).
  3. We sell at a high, and we place a stop-loss a bit higher. We will place the target profile above the singles area.

Strategy 3 – BUY:

  1. The current candle closes singles.
  2. Add a pending order above the singles area and place the stop-loss under the singles area or the candle’s low. (whichever is lower)
  3. Another candle must occur above the singles area. (If this does not happen, we will delete the pending order) .
  4. We will place the profit-target either according to the nearest market profile POC or resistance or under the nearest singles area.


Strategy 3 – SELL:

  1. The current candle closes singles.
  2. Add a pending order under the singles area and place the stop-loss above the singles area or candle’s high (whichever is higher).
  3. Another candle must occur under the singles area. (If this does not happen, we will delete the pending order) .
  4. We will place the profit-target either according to the nearest market profile POC or support or above the nearest singles area.

Discussion

These strategies look really interesting.  As the author himself says:

It’s not just a strategy. There is more to it in profitable trading. For me personally, they are most important when trading: Probability of profit, patience, quality signals with a good risk reward ratio (minimum 3: 1) and my head. I think this is the most important.

In this, we must agree with the author.


Service Cost

The current cost of this indicator is $50. You are also able to rent the indicator. For a one-month rental, it is $30 per month. There is also a demo version available it is always worth testing out the demos before purchasing. Though.

After purchasing the indicator, the author sends two more indicators to his customers as a gift: Market Profile Indicator and Support and Resistance Indicator.

Conclusion: There are only 2 reviews for the indicator so far, but they have 5 stars and are very positive.

For us, this indicator is interesting, and it is a big plus that the author shares his strategies. The price is also acceptable since the indicator costs 50 USD = 5 copies (10-USD / 1 piece), and since the author sends another 2 indicators as a gift, this price is really worthwhile.

The author added:

By studying the market profile and monitoring the market, I came up with an indicator and strategies we would like to present to you. Here you can try it for free :


MT4: https://www.mql5.com/en/market/product/52715

MT5: https://www.mql5.com/en/market/product/53385


And here you can watch the video:


Also, a complete description of the strategies and all the pictures can be seen HERE :

Other completely free of charge tools:

https://www.mql5.com/en/users/tomo007/seller#products


Categories
Forex Service Review

Trend Improvement Indicator Review

We are talking again about another indicator designed for trend trading. The Trend Improvement indicator shows entry points and shows the levels of Takeprofit and Stoploss in the graph, as well as calculates the overall result of our trades. Trend Improvement is a good tool for testing input parameters, and it will also allow you to find the most cost-effective options based upon input parameters quickly.

Overview

It is clear that among thousands of indicators there is no universal indicator that is cost-effective across all currency pairs and long-term time frames. All universal indicators usually generate little profit on a few currency pairs or do not make any profit on other currency pairs in the long run.

Furthermore, it is common that indicators cannot function without long-term changes. Indicators need to be constantly adapted to new market behavior. After some time, all indicators need to be optimized for greater benefits. The concept of the idea is to let the trader find the best parameters for each pair and time frame by themselves. This clearly takes a long time, but the trading community can share the results in a public environment like MQL. In addition, traders do not have to buy an indicator, all this can be done preliminarily in a demo trial version.

Parameter & Proofs

In order to find the optimal parameters, it is best to perform tests. The developer of this indicator has performed various tests of the system parameters obtained during optimization on a sample of historical data other than optimization. The recommendation is to use data from the last two months. In the first month, you can find some of the best parameters. In the second month, you can check if these settings are appropriate or if they are already obsolete.

-When opening the strategy tester, select the start date and last date of last month. Periods of 1H and set the display speed to 1.

-Then you open the indicator property and set the maximum history bars = 528 (approximate number of bars in a month).

-The tests begin, if the results are not satisfactory, you can stop the tests, change the parameters, and start the tests again.

-If the results are good, you will need to adjust the display speed to the maximum and check the result in the last few months.

-If the results of the last month are good, then it can already be considered that these parameters can be used in real trade.

Service Cost

Trend Improvement Pro can be purchased for a single month for the price of $19 USD. This will provide you with a full month for testing. Should you like the indicator and wish to continue using it, three months of service can be purchased for the price of $39, saving you 32% off the price of a single month. For even more savings, consider purchasing a one-year service membership for the cost of $79 USD.

Conclusion

In short, we are talking about a very simple indicator, which we can configure to our liking and according to our trading preferences. There are many trend indicators in the market, so there is a lot of competition between them in the MQL market. With regard to this indicator, we recommend using the free version first and modifying parameters such as those mentioned in this analysis. If you want to rent it later, it can be done for 39 USD per year or 10 USD per month. This indicator is not available for sale.

Categories
Forex Service Review

Unlimited Trade Copier Pro Review

Unlimited Trade Copier Pro is a complete tool to remotely copy trade between multiple MT4 or MT5 accounts and across the Internet. This is the best solution for signal providers, who want to share their trades with other traders globally with their own rules. A supplier can copy transactions to unlimited recipients, and a recipient can get unlimited supplier trading as well. The provider can set the expiration date of the subscription for each receiver so that the receiver may not receive the signals after a predetermined time.

The main features of this tool are:

-Copy of trades between MT4 and MT5 accounts.

-The role of the provider or receiver within the same tool is switchable.

-A provider can copy transactions to unlimited recipients, and a receiver can receive trades from unlimited suppliers.

The Provider or Receiver can manage your list of Receivers or Providers through a database management system without additional tools (add, delete, edit, enable or disable, set expiration, etc). The provider can set the maturity of the subscription for each receiver so that the receiver will not be able to receive the signals after that time.

The list of suppliers or receivers can be edited within MT4 or by a CSV file previously exported. It is switchable between Remote mode (copy over the internet) and Local mode (copy within the same PC/Server). Further, it is switchable between trade protocol (copy operations), and signal protocol (send or receive signal only).

By default, the SL/TP modifications, not only Input and Output, will be copied, so it is safer for the receiver in the event that the connection is lost or the terminal is left without an internet connection. But the provider has the right to hide SL, TP, and set other modifications (it would only copy the input and output) to hide the receiver’s strategy.

  • Protects the receiver from slips and old commands.
  • The receiver account can still operate manually or use other Eas without any conflict.
  • Automatically recognizes and synchronizes the symbol prefix or suffix between brokers.
  • This tool allows up to 5 special symbols (ie: GOLD –> XAUUSD, etc.).
  • It has multiple setting options for various batch sizes for the receiver.
  • Allows filtering the copy either SL or TP or output point.
  • Allows filtering what type of commands will be copied for both the provider and the receiver.
  • It allows the inverted copy for both the supplier and the receiver.
  • Protection of reduction.
  • Auto sends a mobile notification and email to the recipient when the account has new activities.
  • Restore the previous settings and status after switching off the terminal or turning off the power.
  • Control panel in real-time.
  • Easy to use tool and friendly interface.

In short, Unlimited Trade Copier Pro is one of the many tools used to copy a trader’s operations and replicate them in real-time remotely on another trading platform, MT4 or MT5. Despite being an easy to use tool, as we have seen in the features, it is quite powerful and allows multiple tasks, so it can be suitable for professional use.

This tool can be found in the MQL market, and its price is 299 USD, although it can be rented for 99 USD per month. It is also possible to test it for free using a trial demo version.

Categories
Forex Market Analysis

Daily F.X. Analysis, November 27 – Top Trade Setups In Forex – French Events in Focus! 

The economic calendar is a bit muted on the last trading day of the week as investors seem to enjoy the Thanksgiving holiday. However, France is due to report few low impact economic events such as French Consumer Spending with a positive forecast of 3.6% vs. -5.1%, Prelim CPI m/m with a neutral forecast of 0.0%, and Prelim GDP with a neutral growth rate forecast of 18.2% vs. 18.2%. These events are likely to have a muted impact on the market today. 


Economic Events to Watch Today  


EUR/USD – Daily Analysis

The EUR/USD pair was closed at 1.19123 after placing a high of 1.19406 and a low of 1.18850. EUR/USD pair hit a fresh 2-months high on Thursday in the early trading session and started to decline and ended up posting losses for the day after the German Consumer Confidence contracted.

At 12:00GMT, the German GfK Consumer Climate in November missed the market’s expectations and dropped to -6.7 against the expected -4.9 and weighed on Euro. At 14:00 GMT, the M3 Money Supply for the year from Eurozone remained flat at 10.5%. Private Loans for the year also came in line with the expectations of 3.1%.

The Eurozone’s largest economy, Germany, appeared to struggle to shake off the coronavirus crisis as consumers’ confidence declined. The investors became cautious about it. That weighed on the single currency Euro and added in the losses of EUR/USD pair.

Furthermore, the European Central bank (ECB) published its November policy meeting minutes in which the policymakers believe that there was the possibility that pandemic might have long-lasting effects. They were cautious that pandemics might take a toll on the demand side, supply sides and reduce the economy’s growth potential.

Minutes revealed that Inflation would remain negative for longer while employment could contract further. Policymakers believed that flexibility from PEPP was essential to its continued success, and they wanted to wait for a further fiscal response before reacting instead. They were of the review that more bond-buying may not have the same impact now. There were no surprises in the minutes as Central Bank has begun to pave the way towards additional easing next December.

The single currency Euro came under pressure after releasing these minutes from the European Central Bank and weighed on EUR/USD pair on Thursday. The U.S. markets were closed due to the Thanksgiving Holiday, and as Friday is not an official holiday, thin trading is expected to extend into the weekend.

Moreover, the currency pair also followed yesterday’s release of the flash US GDP data for the third quarter that remained low at 33.1% in annualized terms and raised concerns over the world’s largest economy. The coronavirus vaccine and the U.S. stimulus talks are considered as the prevailing risks to the Federal Reserve’s outlook going ahead.

The demand for safe-haven greenback continued to slip with the global economy’s improving outlook after the release of vaccines for a deadly virus. The weak U.S. dollar kept the losses in EUR/USD pair limited on Thursday.

Daily Technical Levels

Support   Resistance

1.1885      1.1934

1.1859      1.1957

1.1836      1.1983

Pivot point: 1.1908

EUR/USD– Trading Tip

On Friday, the direct currency pair EUR/USD is trading with a bullish bias at the 1.1912 level, holding above an immediate resistance becomes a support level of the 1.1905 level. On the higher side, the EUR/USD pair may find resistance at 1.1979, and a bullish breakout of 1.199 level can extend the upward trend until 1.1942. On the 2 hour timeframe, the EUR/USD pair has violated the symmetric triangle pattern that was extending resistance at the 1.19052 level, and now this level is working as a support. Let’s consider taking a buying trade over the 1.1905 level, and above this, the next target stays at 1.1997.


GBP/USD – Daily Analysis

The GBP/USD pair was closed at 1.33550 after a high of 1.33974 and a low of 1.33218. GBP/USD pair struggled to surpass the 1.3400 level and was unable to do so during the early European session, and after that, sellers came in and reversed the pair’s movement to as low as 1.3320 level.

The GBP/USD pair was amongst the worst performers on Thursday out of the G10 currencies, with losses of around 40 pips on the day. After posting gains for four consecutive days, the GBP/USD pair declined on Thursday. Much of the GBP/USD pair’s bullish rally was due to the U.S. dollar’s weakness following the U.S. President-elect Joe Biden’s victory at the start of the month was also escalated by the combination of vaccine optimism and the increasingly dovish tone of the FOMC.

Federal Reserve is expected to squeeze their asset purchase program in December to offer the economy more stimulus because of the rising number of coronavirus cases across the States that has forced the local governments to impose a second lockdown, as the fiscal stimulus from Congress remains indefinable.

Meanwhile, British Pound has also performed significantly better during this month as the hopes surrounding the Brexit deal were higher after the French compromise over the fisheries issue. An agreement over one sticking point also revealed progress made in the Brexit agreement and supported the Sterling that added gains in GBP/USD pair. Furthermore, the vaccine development from Pfizer & BioNtech, Moderna, and AstraZeneca also gave strength to the GBP/USD pair after adding demand for the market’s risk sentiment.

However, on Thursday, the tone behind GBP/USD was changed somewhat after the hopes for a Brexit deal started to fade away. Many reports suggested that the remaining key sticking issues related to Ireland and level playing field were proving to be very hard to reach an agreement. During Thursday’s European session, the Irish Foreign Minister said that Brexit’s outstanding issues were proving to be complicated. E.U. sources also reported that talks between the E.U. and the U.K. were not going well. Simultaneously, the French Foreign Minister put public pressure on the U.K. to adopt a more realistic negotiating stance on Wednesday that faded the optimistic tone around the market and weighed on GBP/USD pair.

During the Thanksgiving Holiday in the U.S. and, in the absence of any macroeconomic data from the U.K., the GBP/USD pair continued following the latest headlines and dropped on Thursday.

Daily Technical Levels

Support   Resistance

1.3318      1.3394

1.3282      1.3434

1.3242      1.3470

Pivot point: 1.3358

GBP/USD– Trading Tip

The GBP/USD traded in line with our previous forecast to hit the support level of 1.333, which is extended by an upward channel. On the higher side, Cable may find resistance at 1.3400 level that’s extended by the double top pattern on the two-hour timeframe. Simultaneously, the bullish crossover of the 1.3400 level is likely to open additional room for buying until the 1.3446 level. On the 4 hour timeframe, the GBP/USD pair has formed a bullish channel that supports the pair at the 1.333 area, and violation of this level on the lower side can drive a sharp selling trend until the 1.3270 mark. The RSI and MACD are suggesting a selling trend in sterling. However, I will prefer to open a buying trade over the 1.3330 area and selling trade below the same level today. 


USD/JPY – Daily Analysis

The USD/JPY pair was closed at 104.233 after placing a high of 104.479 and a low of 104.214. On Thursday, the U.S. dollar was down in early trading session subdued by weak U.S. economic data. The optimism surrounding the coronavirus vaccines prompted investors to seek out riskier assets instead of safe-haven. The U.S. Dollar Index (DXY) was down on Thursday against the basket of six major currencies by 0.3% at 91.97 level, the lowest level in more than two months as the volume was limited due to the holiday in the U.S. for Thanksgiving.

In late Wednesday, the Federal Reserve released the minutes of its last monetary policy meeting, and they showed that Fed members debated on a range of options on bond purchases to support the recovery, including pivoting to purchases of longer-term securities that could put more pressure on the dollar by keeping longer-term yield unattractively low. These comments from the Fed weighed on the U.S. dollar and added pressure on the USD/JPY pair on Thursday.

Meanwhile, the number of global coronavirus cases reached above 60 million on Thursday, out of which 12.7 million were from the U.S., according to Johns Hopkins University. Many states in the U.S. started to impose restrictive measures to curb the increasing numbers of coronavirus cases that led to more job losses, weighed on the U.S. dollar, and kept the USD/JPY pair under pressure.

Positive data from 3 vaccine candidates and their efficacies, along with a smoother transition to Joe Biden administration in the U.S., added pressure on the greenback and forced investors to move towards riskier currencies. Reports also suggested that the Fed’s monetary easing was on its way that continued weighing on the greenback and added pressure on the USD/JPY pair. Apart from this, a mixed performance in the European equity markets provided a modest lift to the safe-haven Japanese yen that ultimately contributed to the USD/JPY pair’s fall on Thursday.

Due to the absence of any macroeconomic data on the day and the thin liquidity conditions due to the Thanksgiving Holiday, the pair USD/JPY continued following the last day’s economic data of Unemployment claims that showed a negative labor market report and added pressure on the pair.

Daily Technical Levels

Support   Resistance

104.27      104.63

104.09      104.79

103.92      104.98

Pivot point: 104.44

USD/JPY – Trading Tips

The USD/JPY pair’s recent price action has violated the choppy trading range of 104.700 – 104.056. On the lower side, the USD/JPY pair can drop further until the next support level of 103.667 level, especially after the breakout of the 104.150 support level. On the higher side, a bullish breakout of 104.700 resistance can extend the buying trend until the next resistance area of 104.700 and 105.063 level. On the lower side, the support continues to hold around the 103.667 level. The MACD suggests selling bias in the USD/JPY pair; thus, we should consider selling trade below 104.150 and buying above the same. Good luck! 

Categories
Forex Indicators

What is the Best Forex Trading Software?

Several software categories could fit into this question, depending on if you are looking for a platform that connects to a broker market feedback, automated trading software, trade analysis software, standalone or web-accessible, or some other utility with a specific role such as the one that copies trading signals. Forex trading software that brings the market to your screen is also called a trading platform or a client. To other people trading software is an automated solution that trades autonomously, commonly known as trading robots. However, we are going to give you some insight into what software might be the best for you if you are starting with forex trading. 

Firstly, you need to know that MetaTrader 4 and 5 from MetaQuotes is the most supported trading platform and probably the only one you will ever need. Metatrader platforms are at the top of the market share in their category. There is no need to tell you about the history of how this came to be, but more about why. 

MetaTrader platforms pushed to the top for several reasons. Their products are easy to use and set up. Metatrader is supported by Microsoft operating systems, Apple OS and it is also developed for Android. Additionally, to completely leave no uncovered space, Metatrader is also available through the web browser. So if you do not have it installed, you only need an internet connection and trading account credentials. Metatrader platform is also free. When you have this combination of availability and no barriers to entry it is very easy to conquer the market. Although that software needs to cope with the traders’ needs and also be supported in various ways.

Metatrader developed great options for analysis such as their Strategy tester module, good customizability of charts, a good overview of the trades, markets, and easy orientation. The platform became popular and the network of supported broker grew to the point almost all brokers have this platform offered. The main advantage of the Metatreder platforms is their ability to have custom indicators and scripts. The MQL language is easy to learn and is a no brainer for established coders. MQL language paved the way to make so many indicators and utilities for the MetaTrader platforms traders can make specialized strategies and chart analysis not possible with any other software.

Modified MT4 or MT5 with these utilities can become unrecognizable from the default looks. Many traders have gathered together to create forums, coders enjoyed the demand to create customized indicators but also customized automated scripts. MetaTrader platforms allowed Expert Advisors or EAs to be plugged in like any other indicator or utility. Everything became big enough to form a completely new marketplace for these products, some are free while some are sold for a couple of thousand dollars. MetaTrader platforms became the mainstream and there is no sign anyone new will come in to replace all this.

The platform locked down and denied the competition with this huge support and network. Metatrader 5 is the newest iteration and it is not very well received. Mostly because it does not deliver a much better experience and the huge support is slow to adopt the MQL5 language. MQL4 made indicators and tools are not compatible with the MT5, they have to be rewritten. This problem created an adaptation gap to the point MetaQuotes stopped issuing new MT4 licenses to brokers to force the shift to the new MT5. MT4 is still the most used platform and most supported yet the MT5 is slowly taking over. 

MT4 and MT5 are not that different, you will barely notice the difference, however, MT5 has better options and follows new developments in the technology, but nothing revolutionary. As a new trader, it is better to start with these platforms right away than to get accustomed to broker proprietary software.

Proprietary trading software is developed with ease of use as the primary goal. When you look at the MetaTrader platform the first impression is that you do not want to mess with its unattractive layout. There are a lot of details, numbers, lines and everything is crammed into a few windows. It will seem you will have to face a steep learning curve to trade with this platform while the proprietary platform is very easy. Brokers will want to get you into trading quickly, before you lose interest, as many do. That is why everything is hidden that seems too complex, sometimes even missing key trading information such as the spreads. Proprietary platforms partially serve as marketing more than as a functional trading platform. Furthermore, even they look better, they may not perform better. 

Not all brokers offer their own platforms, and not all proprietary platforms are inferior to the Metatrader. Two such examples are with the OANDA and Forex.com brokers. OANDA has a very beginner-friendly platform with good utilities and presentations about the position sizes. If you are starting with a demo account and find Metatrader just too much, consider this proprietary platform for practice. You will get a feeling about proper money management as it has more calculation options. Forex.com also has a proprietary platform that has a lot of advanced features not found in Metatrader.

The analysis is more advanced, has more modules and news plugged in, and many more options. Additionally, the Forex.com platform has an incredible array of markets and assets. Simply, Forex. Com is a large broker brand and can afford to develop such platforms. On the other hand, know no proprietary platform allows custom made indicators and utility as the MetaTrader. If you really want to dive into forex charting and analysis tailored to your strategies, Metatrader will probably suffice even when you get advanced. 

When we talk about other, web-accessible trading platforms, TradingView is unavoidable. This is a subscription, web-based portal that offers a great way to charting and advanced technical analysis. It is packed with tools, it is easy on the eyes, and has a good structure. Definitely more attractive than the Metatrader, however, it does not quite match the tools range Metatrader has with its vast community. TradingView also supports indicator making, has some other abilities Metatrader simply lacks but is not quite trading oriented. It is more an analysis platform than trading. In that sense, you can do many useful things such as making your own currency baskets, indexes, advanced chart comparisons, and so on. Most experienced traders use this platform as an additional analysis utility. If you are new to trading, try it as you learn the basics. 

Other trading platforms are also good and in some aspects more advanced than the Metatrader. One such standalone platform is the Nninjatrader. The platform surpasses the analysis potential however it still cannot match Metatrader’s third-party add-ons availability. If you want to trade live with this platform, you will also have to purchase it. 

Now, if you do not want to spend time learning forex trading, you have other investment options, options where you invest your capital into managed portfolios or use copy trading platforms. One such popular platform is ZuluTrade. Copy-trading became popular and is still booming for people who just want to copy what good traders are doing, so they can copy their performance too. Copy-trading also requires some research on how to recognize a good trader.

Typically, you will want to seek out long term consistency, steady growth, and noting extreme like triple-digit percentages in a single month. People get hooked on performance rates, neglecting the long term risk. Drawdown and trading frequency are also parameters you will need to pay attention to with this platform when copying others. Also, consider diversifying and follow different traders or strategies as this platform also supports aggregated subscriptions. 

Categories
Forex Market Analysis

Daily F.X. Analysis, November 20 – Top Trade Setups In Forex – Eyes on Retail Sales!

The broad-based U.S. dollar failed to stop its overnight losses and remain bearish on the day mainly due to the mixed U.S. Stimulus story. Moreover, the doubts over the U.S. economic recovery in the wake of coronavirus resurgence also weigh on the U.S. dollar. On the news front, eyes will remain on U.K.’s and Canada’s core retail sales to determine further market trends. 

Economic Events to Watch Today  


EUR/USD – Daily Analysis

The EUR/USD currency pair managed to stop its previous day losing streak and remain bullish around the 1.1886 level mainly due to the broad-based U.S. dollar selling bias, triggered by the cautious sentiment around the U.S. stimulus story, which ultimately lends support to the currency pair. However, Mnuchin’s call to recollect funds allocated to Federal Reserve, which eventually weighed on the market trading sentiment, failed to provide any support to the greenback as the Republican heavyweight McConnell recently showed readiness to resume the discussions with the Democrats on a new COVID-19 relief package, which ultimately undermined the U.S. dollar. 

That’s very surprising as the U.S. dollar usually draws bids alongside losses in the equities market. On the contrary, the buying interest around the single currency was capped by the intensifying virus fugues in Europe, which eventually becomes the key factor that has been capped further upside in the currency pair. At the moment, the EUR/USD currency pair is currently trading at 1.1888 and consolidating in the range between the 1.1865 – 1.1891.

The equity market has been declining since the day started amid mixed concerns over the U.S. stimulus story. The Mnuchin’s asked the Federal Reserve to return the remaining coronavirus stimulus funds, which could limit the central bank’s capacity to give additional support to businesses at a time when the coronavirus second wave is accelerating. Let me remind you that these funds were meant for global lending to local government, non-profits, businesses. These factors have been weighing on the market trading sentiment, which could be considered as the main factors that cap further downside in the safe-haven U.S. dollar losses.

On the contrary, Republican heavyweight McConnell recently showed a willingness to continue the negotiations with the Democrats on a new COVID-19 relief package. This news is negative for the U.S. dollar, as a stimulus package would have the effect of reducing the U.S. dollar.

As in result, the broad-based U.S. dollar failed to stop its overnight losses and remain bearish on the day mainly due to the mixed U.S. Stimulus story. Moreover, the doubts about the U.S. economic recovery in the wake of coronavirus resurgence also weigh on the U.S. dollar. Thus, the U.S. dollar losses could also be a key factor that kept the currency pair higher. Meantime, the dollar index unchanged at 92.306 (=USD), off Thursday’s low of 92.236, though it is still down 0.3% on the week.

On the bearish side, the intensifying market worries regarding the continuous hike in new coronavirus cases in Europe and the United States keep fueling the doubts over the global economic recovery through imposing back to back lockdown restrictions on economic and social activity, which eventually weighed on the shared currency and becomes the key factor that kept the lid on any additional gains in the currency pair. 

In the absence of significant data/events on the day, the market traders will keep their eyes on the ongoing drama surrounding the U.S. stimulus package. In the meantime, the risk catalyst like geopolitics and the virus woes, not to forget the Brexit, will also be key to watch for a fresh direction. 

Daily Technical Levels

Support   Resistance

1.1836       1.1880

1.1820       1.1908

1.1791       1.1924

Pivot point: 1.1864

EUR/USD– Trading Tip

On Friday, the EUR/USD is trading with a bearish bias at the 1.1844 level, having violated an upward trendline on the hourly chart. On the lower side, the support stays at 1.1832, and below this, the EUR/USD may find next support at 1.1814. On the higher side, the resistance can be found at the 1.1867 level. The bullish bias remains dominants today as the MACD and 50 periods EMA support a bullish trend. We are already holding a buying trade from yesterday; therefore, you are advised to follow our forex signals page for more updates on the EUR/USD pair. 


GBP/USD – Daily Analysis

During Friday’s European trading session, the GBP/USD currency pair managed to gain positive traction for the second straight session and refresh the intra-day high around closer to 1.3300 level mainly due to the broad-based U.S. dollar fresh weakness, backed by the doubts over the next round of the U.S. fiscal stimulus measures, which eventually undermined the U.S. dollar and contributed to the currency pair gains. 

On the contrary, the worsening coronavirus (COVID-19) conditions in the U.S. and Europe raised the fears of global economic recovery, which could be considered one of the key factors that kept the lid on any additional gains in the currency pair. In the meantime, the gains in the currency pair were also capped by negative Brexit news. At a particular time, the GBP/USD currency pair is currently trading at 1.3275 and consolidating in the range between 1.3247 – 1.3288.

According to the latest report, the European Union (E.U.) prepares for no-deal Brexit plans after the discussions’ dragging. The fears of no-deal Brexit were further bolstered after E.U.’s Chief Negotiator Michel Barnier self-isolated after a member of his team contracted the infection.

Despite the fears of no-deal Brexit and the Sino-American skirmish, not to forget the record single-day increase in COVID-19 cases, the currency pair managed to gain positive traction amid a weaker U.S. dollar. At the USD front, the broad-based U.S. dollar failed to gain any positive traction and edged lower on the day as doubts over the U.S. economic recovery remain amid the coronavirus crisis. The losses in the U.S. dollar kept the currency pair higher. Meantime, the dollar index unchanged at 92.306 (=USD), off Thursday’s low of 92.236, though it is still down 0.3% on the week.

In the absence of significant data/events on the day, the market traders will keep their eyes on the ongoing drama surrounding the U.S. stimulus package. In the meantime, the risk catalyst like geopolitics and the virus woes, not to forget the Brexit, will also be key to watch for a fresh direction. 

Daily Technical Levels

Support    Resistance

1.3155       1.3236

1.3118       1.3280

1.3073       1.3317

Pivot point: 1.3199

GBP/USD– Trading Tip

Most technical levels are the same as Sterling didn’t make any significant change in the market. The GBP/USD pair is trading bullish at the 1.3279 level, holding over the 1.3227 support level, which is extended by an upward trendline on a 2-hour timeframe. The Cable is likely to face immediate resistance at the 1.3297 area, which will be confirmed if the candle starts closing below this level. However, the bullish breakout of the 1.3297 level can drive further upside movement until the 1.3370 level today. 


USD/JPY – Daily Analysis

A day before, the USD/JPY pair was closed at 103.795 after placing a high of 104.207 and a low of 103.650. The currency pair USD/JPY remained bearish for the 5th consecutive session on Wednesday and dragged its prices below the 103.700 level. The USD/JPY pair was extending its losses due to the U.S. dollar weakness on Wednesday despite the latest optimism regarding the coronavirus vaccine. On Wednesday, Pfizer announced that its vaccine was 95% effective in its study and planning to seek authorization within days.

This news added to the market’s risk sentiment and supported the equity market by providing a 0.45% gain to Dow Jones and 0.04% to NASDAQ. The latest news from Pfizer and BioNtech failed to impress the market, and the pair USD/JPY continued following the U.S. dollar’s weakness on Wednesday. The currency pair was under pressure as the coronavirus situation was getting worse day by day in the U.S. as the death toll surpassed 250,000 level in the major economy. According to Johns Hopkins University, the coronavirus has cost almost 250,180 American lives so far, and the count was increasing day by day. This raised fears that more restrictions could be imposed in many states, which would slow down the economic recovery. These fears weighed in the local currency U.S. dollar, and hence, USD/JPY remained under pressure for the 5th consecutive session on Wednesday.

Given the rising number of infections in the country, the States like California and Illinois stretched their restrictions to battle the rising number of cases as any financial aid package was not close to being delivered by Congress. The rising number of coronavirus cases in the U.S. has forced U.S. officials to announce that public schools in New York City will close again on Thursday as the city has reached a 3% coronavirus test positivity rate. These fears also kept the U.S. dollar under pressure on Wednesday.

The House Speaker Nancy Pelosi and Senate Minority Leader Chuck Schumer urged the Senate Majority Leader Mitch McConnell to resume talks related to the coronavirus relief package. However, McConnell was insisting on a targeted package. The U.S. dollar came under further pressure after the hopes for the talks for further stimulus package increased and weighed on the USD/JPY pair.

On the data front, at 02:00 GMT, the TC Long Term Purchases surged to 108.9B from the expected 41.5B and supported the U.S. dollar. At 18:30 GMT, the Building Permits for October came in line with the projections of 1.55M. The Housing Starts rose to 1.53M from the expected 1.45M and supported the U.S. dollar that ultimately capped further losses in the USD/JPY on Wednesday. On the Japanese side, the Trade Balance for October raised to 0.31T against the 0.11T and supported the Japanese Yen that added further pressure on the USD/JPY pair on Wednesday.

Daily Technical Levels

Support    Resistance

103.58       104.16

103.32       104.48

102.99       104.74

Pivot point: 103.90

USD/JPY – Trading Tips

The USD/JPY extends its bearish trend below the 104.430 level, falling from the 104.850 support area. On the lower side, the USD/JPY pair is likely to find support at the 103.800 level, and violation of this level can also extend further selling bias until 103.227. On the higher side, the USD/JPY safe-haven pair may find resistance at 104.400 and may help us capture a selling trades below this level as the MACD and RSI support the selling trend today. Good luck! 

Categories
Forex Market Analysis

Daily F.X. Analysis, November 19 – Top Trade Setups In Forex – U.S. Jobless Claims in Focus! 

The economic calendar is filled with medium impact economic events such as Unemployment Claims, C.B. Leading Index m/m, and Existing Home Sales from the United States on the news front. Besides, the Current Account from the Eurozone will also remain in the highlights today. The market may show some price action during the U.S. session on the release of U.S. Jobless Claims.

Economic Events to Watch Today  


EUR/USD – Daily Analysis

The EUR/USD pair was closed at 1.18539 after placing a high of 1.18908 and a low of 1.18491. The EUR/USD pair dropped on Wednesday after placing gains for four consecutive days. The EUR/USD pair remained on an upbeat track last days amid the market sentiment’s risk-on market sentiment due to the vaccine optimism. The riskier currencies gathered strength against the safe-havens like the USD and posted gains over the last week. However, on Wednesday, the EUR/USD pair started to decline as Europe’s lockdown situation started to raise fears for economic recovery.

However, the second wave of the coronavirus in Europe started to show signs of slowing. The latest numbers showed a stabilization in new cases in Germany, Spain, Italy and a decline in Belgium, France, and the Netherlands. Despite this, the experts have warned that it was too early to get complacent. The lockdowns and tough social restrictions were reintroduced across numerous European countries in October due to the increased spread of the second wave of coronavirus. These restrictions have been placing a threat on European nations’ economic recovery and weighed on Euro currency that has dragged the EUR/USD pair down on Wednesday.

On the data front, at 02:00 GMT, the TC Long Term Purchases from the U.S. raised to 108.9B against the forecasted 41.5B and supported the U.S. dollar that ultimately added losses in the EUR/USD pair. At 18:30 GMT, the Building Permits from October remained flat with the anticipations of 1.55M. The Housing Starts were raised to 1.53M from the projected 1.45M and supported the U.S. dollar that weighed on EUR/USD pair on Wednesday.

From the European side, at 15:00 GMT, the Final CPI for the year came in line with the expectations of -0.3%. The Final CPI for the year also remained flat as expected, 0.2%. European data failed to impact the EUR/USD pair on Wednesday, and the pair continued following the U.S. dollar’s movement.

The losses in the EUR/USD pair were limited after the risk sentiment was improved in the market due to the latest optimism regarding the coronavirus vaccine. Pfizer and BioNtech announced that they would be filing for emergency authorization of their vaccine in the coming days from the U.S. This raised the optimism that vaccines will soon be available in the market, and the chaos will be lifted from the economy, and it will start to recover. The riskier currency Euro gained traction and capped further losses in the EUR/USD pair on Wednesday.

Daily   Technical Levels

Support Resistance

1.1836      1.1880

1.1820      1.1908

1.1791      1.1924

Pivot point: 1.1864

EUR/USD– Trading Tip

The EUR/USD is trading with a bearish bias at the 1.1844 level, having violated an upward trendline on the hourly chart. On the lower side, the support stays at 1.1832, and below this, the EUR/USD may find next support at 1.1814. On the higher side, the resistance can be found at the 1.1867 level. The bullish bias remains dominants today as the MACD and 50 periods EMA support a bullish trend. We are already holding a buying trade from yesterday; therefore, you are advised to follow our forex signals page for more updates on the EUR/USD pair. 


GBP/USD – Daily Analysis

The GBP/USD closed at 1.32670 after placing a high of 1.33120 and a low of 1.32410. The pair GBP/USD continued its bullish momentum for the 4th consecutive day on Wednesday and reached near 1.33200 level. The latest rise in the GBP/USD pair was driven by the growing hopes that a Brexit deal could be within reach after the French President Emmanuel Macron was ready to cave in on demands from the U.K. for full sovereignty waters that will likely rein in access for French fishermen.

This news raised hopes for a Brexit deal before the end of the transition period and supported the British Pound that ultimately lifted the GBP/USD pair higher on board. The Irish Minister Micheal Martin also said that a landing zone for an agreement was within sight just a day ahead of the European Union Summit when the E.U. Brexit negotiator Michel Barnier will brief E.U. leaders about the two weeks of talks held with the U.K.

Chances are increased that an agreement will be made as soon as Monday and will be approved within a week, most likely at the next E.U. Summit on December 10. After that, the European Parliament would have to rubberstamp the agreement to ensure a deal was placed before the end of the transition period on Dec.31st.

All these hopes lifted the British Pound as the chances of a deal were clear for the first time, and things were going in favor of the U.K. However, analysts were concerned that inflation was likely to slow in the months ahead. The GBP/USD pair picked up its pace towards an upward direction due to renewed Brexit optimism and reached near 1.3200 level on Wednesday. On the data front, At 12:00 GMT, the Consumer Price Index for the year raised to 0.7% from the expected 0.5% and supported the Sterling. The year’s Core CPI also raised to 1.5% against the anticipated 1.3% and supported British Pound. The RPI from the U.K. also rose to 1.3% from the expected 1.2% and supported British Pound that ultimately added further gains in GBP/USD pair. At 12:02 GMT, the PPI Input for October surged to 0.2% against the expected 0.0% and supported the British Pound. At the same time, the PPI Output in October remained flat with the expectations of 0.0%. The Housing Price Index from the U.K. also surged to 4.7% against the forecasted 2.9% and supported the British Pound.

The U.K.’s positive macroeconomic data supported the British Pound against the U.S. dollar and raised the GBP/USD pair on Wednesday.

While from the U.S. side, at 02:00 GMT, the TC Long Term Purchases rose to 108.9B against the anticipated 41.5B and supported the U.S. dollar. At 18:30 GMT, the Building Permits for October remained flat with the projections of 1.55M. The Housing Starts surged to 1.53M from the anticipated 1.45M and supported the U.S. dollar that ultimately capped further gains in GBP/USD pair on Wednesday.

Meanwhile, the Bank of England’s Chief Economist Andy Haldane said that the economic outlook for 2021 was materially brighter than he had expected just a few weeks ago despite the short-term uncertainty from a renewed coronavirus lockdown in England. He said that Britain’s economy shrank by almost 20% in the second quarter of 2020, more than any other peer economy, and at the end of September, it was still 8.4% smaller than a year before. He struck a somewhat positive note in line with his previous assessments of Britain’s recovery on Wednesday that raised the British Pound on board against the U.S. dollar. This also benefited the GBP/USD pair on Wednesday, and hence, the pair ended its day with a bullish candle.

Daily Technical Levels

Support   Resistance

1.3155      1.3236

1.3118      1.3280

1.3073      1.3317

Pivot point: 1.3199

GBP/USD– Trading Tip

The GBP/USD pair is trading bullish at the 1.3279 level, holding over the 1.3227 support level, which is extended by an upward trendline on a 2-hour timeframe. The Cable is likely to face immediate resistance at the 1.3297 area, which will be confirmed if the candle starts closing below this level. However, the bullish breakout of the 1.3297 level can drive further upside movement until the 1.3370 level today. 


USD/JPY – Daily Analysis

The USD/JPY pair was closed at 103.795 after placing a high of 104.207 and a low of 103.650. The currency pair USD/JPY remained bearish for the 5th consecutive session on Wednesday and dragged its prices below the 103.700 level. The USD/JPY pair was extending its losses due to the U.S. dollar weakness on Wednesday despite the latest optimism regarding the coronavirus vaccine. On Wednesday, Pfizer announced that its vaccine was 95% effective in its study and planning to seek authorization within days.

This news added to the market’s risk sentiment and supported the equity market by providing a 0.45% gain to Dow Jones and 0.04% to NASDAQ. The latest news from Pfizer and BioNtech failed to impress the market, and the pair USD/JPY continued following the U.S. dollar’s weakness on Wednesday.

The currency pair was under pressure as the coronavirus situation was getting worse day by day in the U.S. as the death toll surpassed 250,000 level in the major economy. According to Johns Hopkins University, the coronavirus has cost almost 250,180 American lives so far, and the count was increasing day by day. This raised fears that more restrictions could be imposed in many states, which would slow down the economic recovery. These fears weighed in the local currency U.S. dollar, and hence, USD/JPY remained under pressure for the 5th consecutive session on Wednesday.

Given the rising number of infections in the country, the States like California and Illinois stretched their restrictions to battle the rising number of cases as any financial aid package was not close to being delivered by Congress. The rising number of coronavirus cases in the U.S. has forced U.S. officials to announce that public schools in New York City will close again on Thursday as the city has reached a 3% coronavirus test positivity rate. These fears also kept the U.S. dollar under pressure on Wednesday.

The House Speaker Nancy Pelosi and Senate Minority Leader Chuck Schumer urged the Senate Majority Leader Mitch McConnell to resume talks related to the coronavirus relief package. However, McConnell was insisting on a targeted package. The U.S. dollar came under further pressure after the hopes for the talks for further stimulus package increased and weighed on the USD/JPY pair.

On the data front, at 02:00 GMT, the TC Long Term Purchases surged to 108.9B from the expected 41.5B and supported the U.S. dollar. At 18:30 GMT, the Building Permits for October came in line with the projections of 1.55M. The Housing Starts rose to 1.53M from the expected 1.45M and supported the U.S. dollar that ultimately capped further losses in the USD/JPY on Wednesday. On the Japanese side, the Trade Balance for October raised to 0.31T against the 0.11T and supported the Japanese Yen that added further pressure on the USD/JPY pair on Wednesday.

Daily Technical Levels

Support   Resistance

103.58      104.16

103.32      104.48

102.99      104.74

Pivot point: 103.90

USD/JPY – Trading Tips

The USD/JPY extends its bearish trend below the 104.430 level, falling from the 104.850 support area. On the lower side, the USD/JPY pair is likely to find support at the 103.800 level, and violation of this level can also extend further selling bias until 103.227. On the higher side, the USD/JPY safe-haven pair may find resistance at 104.400 and may help us capture a selling trades below this level as the MACD and RSI support the selling trend today. Good luck! 

Categories
Forex Signals

Forex Robots: Do You Really Need Them? This Will Help You Decide!

A Forex robot is an automated software that executes trades on the trader’s behalf, running as an Expert Advisor (EA) on their trading platform. Do you really need these services? Is there any real advantage to using them? Read this before making a decision.

Most of this software is built around the most popular trading platform, MetaTrader 4. The software usually allows traders to tweak certain settings to their liking in order to change things like stop-loss limits, the times when the bot can trade, etc. Some traders see automated trading software as a great tool because it reduces the need to constantly monitor trades, or it can help beginners to turn a profit without much knowledge about the Forex markets. On the other hand, some traders would tell you to avoid automated trading software because of the associated risks. Below, we will highlight some of the pros and cons of using this software so that our readers can decide for themselves. 

Pros

  • Forex robots help to ensure that traders never miss an opportunity since they can trade 24/7 with no breaks. Any human will need to eat, sleep, and so on, but traders won’t have to be afraid to leave their PC with automated software running. 
  • Automated trading robots do not fall victim to psychology-related downsides as humans do. The robot will not feel greed, excitement, anxiety, or any other emotions, which helps to avoid emotion-based trading mistakes. 
  • Robots can find opportunities and carry out trades in a matter of seconds, thanks to pre-determined parameters. Humans are slower at inputting manual trades and making decisions, which can cause missed opportunities. 
  • Robots can keep up with more complicated trading strategies and are superior at multi-tasking. The bot can monitor several currency pairs at once while keeping up with multiple conditions related to stop-loss orders, entries, and exits, profit targets, etc. Once again, humans are not as capable of doing this and may become overwhelmed with information.
  • Trading robots can be used by beginners without the need for extensive knowledge. Since the robot does most of the work, entry-level traders can spend more time learning, while making a profit in the meantime thanks to the trading robot. 

Cons

  • Many trading robots that are made to be purchased aren’t profitable. A company may promise their product will make you rich before disappearing a short while later. Always research any company or person that is selling a bot before buying to try to avoid this. 
  • Many bot providers advertise the absolute best results they have achieved to make the product look more successful or reliable than it is. They might advertise one successful backtest out of hundreds to fool their potential customers.
  • You’ll need a strong internet connection for trading robots to run effectively, otherwise, the robot may glitch and experience trading errors. 
  • Robots are at a disadvantage to humans because they will only ever work the way they are programmed to. A robot will never be able to learn new things or apply their imagination when trading the way that a human could. 
  • While robots are great at analyzing technical data, like charts and statistics, they can’t take economic circumstances, political events, or other important events into consideration. Traders should manually turn off their trading robot before any such event or else fall victim to errors. 
  • Robots work best when there are positive trends and signals in the market. If the market is trending, then there is no problem. However, a sideways or choppy market can throw the robot off track. 
  • Many robots use a scalping-based strategy, which might not be allowed by every Forex broker
  • The best trading robots aren’t going to be available for free, although some can be rented for a low price for a month or so. If the bot can’t be rented or tested, then you’re basically taking a gamble with hopes that the product works.

Conclusion

Forex robots can trade 24/7 with a strong internet connection and are much better at multi-tasking than humans. Emotion doesn’t get in their way and they can perform much more complex trading strategies with less missed opportunities, but they aren’t without their faults. Many of these options are scams, so thorough research is a must before purchasing. Robots also don’t have the capabilities to learn or take things like economic events into consideration the way humans do. If the market doesn’t have positive trends and signals, then the robot’s efficiency will likely decrease. Still, with monitoring and risk-management, automated trading software can prove to be a convenient and profitable option for most Forex traders.  

Categories
Forex Market Analysis

Daily F.X. Analysis, November 13 – Top Trade Setups In Forex – CPI, Employment in Focus! 

The eyes will remain on the U.S. Core PPI m/m and the Prelim UoM Consumer Sentiment from the United States on the news side. Both of the events are expected to drive some movement in the U.S. dollar and related currency pairs. During the European session, the French Final CPI m/m, Flash Employment Change q/q, and Flash GDP q/q will remain in highlights as these are coming from European counties; therefore, we can expect support to the Euro pairs.

Economic Events to Watch Today  


EUR/USD – Daily Analysis

The EUR/USD pair was closed at 1.18054 after placing a high of 1.18230 and a low of 1.17584. The currency pair EUR/USD reversed its Wednesday’s movement and raised on Thursday despite coronavirus worsened Europe’s situation. Italy was now expecting to enter a nationwide lockdown due to the increased number of coronavirus cases and curb the virus’s spread that should have caused the EUR/USD pair to continue movement in the downward direction. Still, the pair surged on the back of the weak U.S. dollar.

The U.S. dollar has suffered from risk-on markets sentiment, with investors becoming more optimistic after Pfizer’s 90% effective coronavirus vaccine. The greenback was also weak due to the declining CPI data from the U.S. At 12:00 GMT, the German Final CPI for October came in line with the expectations of 0.1%. At 15:00 GMT, the Industrial Production in September from Eurozone declined to -0.4% against the forecasted 0.6% and weighed on Euro and capped further gains in EUR/USD pair.

At 18:30 GMT, the Consumer Price Index for October fell to 0.0% against the projected 0.1% and weighed on the U.S. dollar and supported the EUR/USD pair’s upward direction. The Core CPI for October also declined to 0.0% from the projected 0.2% and weighed on the U.S. dollar and added further in gains of EUR/USD pair. However, the Unemployment Claims from last week fell to 709K against the projected 730K and supported the U.S. dollar and capped further gains in currency pair EUR/USD pair.

Moreover, the U.S. political uncertainties also continued weighing on the U.S. dollar after the victory of Joe Biden and becoming 46th U.S. President. Donald Trump has failed to concede Biden’s victory and has left the markets uncertain about what could happen next as Trump attempts to challenge the vote. 

Meanwhile, the U.S. dollar was also under pressure because of the rising number of coronavirus infections on Wednesday. The cases increased to 142,000 new cases in a single day, and the hospitalization rate also increased and reached 65,000, the highest during the pandemic. These virus conditions in the U.S. also weighed on the U.S. dollar and supported the upward movement of the EUR/USD pair.

On the other hand, the ECB President Christine Lagarde said that she believes that the region’s monetary authority will move to launch a digital version of the Euro in the next two to four years. Previously, ECB officials disclosed that they were researching a central bank digital currency.

On the virus front, the ECB President, Christine Lagarde, said that the coronavirus vaccine had reduced the uncertainty and complete lockdown was not the best way to deal with the second wave. These comments from Lagarde also supported the upward movement of the EUR/USD pair on Thursday.

Daily Technical Levels

Support   Resistance

1.1738      1.1827

1.1697      1.1875

1.1648      1.1917

Pivot point: 1.1786

EUR/USD– Trading Tip

The EUR/USD continues to trade sideways at the 1.1804 area, facing immediate support at the 1.1749 level along with resistance at the 1.1835 level. On the further higher side, the violation of the 1.1835 level can extend the buying trend until 1.1907. On the lower side, the support level prevails at 1.1749 and 1.1680 level. The MACD and EMA are also neutral; therefore, we may see selling below the 1.1835 and bullish above the same level today.


GBP/USD – Daily Analysis

The GBP/USD pair was closed at 1.31222 after a high of 1.32281 and a low of 1.31062. The pair GBP/USD continued following its previous day movement and extended its losses on Thursday. On Thursday, the Bank of England Governor said that he hoped a goodwill spirit would prevail between Britain and the European Union countries to smooth over unavoidable trade disruptions after the end of the Brexit transition period on Jan-1st.

Bailey also told a panel discussion with the U.S. Federal Reserve Chair Jerome Powell and European Central bank President Christine Lagarde that he felt very uncomfortable at the huge amount of economic uncertainty created by a coronavirus. On Thursday, Bailey said that he was encouraged by the latest coronavirus vaccine developments, which reduce economic uncertainty.

He also said that the trade talks were continuing between Britain and the European Union, but he could not judge the outcome. He said that he hoped that if there will be a trade agreement, there will be a goodwill spirit. However, he also told the panel Britain’sain’s financial sector was ready for the end of transition periods irrespective of a deal and was better prepared than the rest of the economic sectors. Bailey’s comments raised concerns in the market sentiment and kept the British Pound under pressure that left the GBP/USD pair on the downside.

On the data front, at 05:01 GMT, the RICS House Price Balance from the U.K. for October raised to 68% from the forecasted 54% and supported GBP. At 12:00 GMT, the Prelim GDP for the 3rd Quarter declined to 15.5% against the expected 15.8% and weighed on British Pound and added in the losses of GBP/USD pair. For September, the U.K.’s Construction Output raised to 2.9% against the forecasted 2.1% and supported British Pound. The GDP for September from the U.K. also declined to 1.1% against the estimated 1.5% and weighed on British Pound and further supported the GBP/USD pair’s losses.

The Goods Trade Balance came in as expected -9.3B. The Index of Services for the Quarter also declined to 14.2% from the forecasted 14.6% and weighed on British Pound and added losses in currency pair. The Industrial Production for September again fell to 0.5% from the estimated 0.9% and weighed on GBP. The Manufacturing Production in September from the U.K. dropped to 0.2% against the projected 0.7% and weighed on GBP. The Prelim Business Investment dropped to 8.8% in September from the projected 14.4% and weighed on local currency Sterling and further pushed the pair on the downside.

From the U.S. side, at 18:30 GMT, the Consumer Price Index for October was dropped to 0.0% against the expected 0.1% and weighed on the U.S. dollar and capped further losses in GBP/USD pair. The Core CPI for October also dropped to 0.0% from the expected 0.2% and weighed on the U.S. dollar. However, the Unemployment Claims from last week fell to 709K against the estimated 730K and supported the U.S. dollar and added losses in GBP/USD pair on Thursday.

Daily Technical Levels

Support   Resistance

1.3170      1.3291

1.3119      1.3361

1.3050      1.3412

Pivot point; 1.3240

GBP/USD– Trading Tip

The GBP/USD pair is trading at 1.3116 level, holding over 1.3110 level, which is extended by an upward trendline on a 2-hour timeframe. The Cable has recently completed 38.2% Fibonacci retracement, and now it’s holding above the double bottom support level of 1.3110 level. On the higher side, the pair may surge until the resistance level of 1.3190 level. The MACD and RSI support selling trend, but considering the trendline support and oversold indicators, it is worth giving a buy shot to GBP/USD pair. Let’s consider buying over 1.3110 level today. 


USD/JPY – Daily Analysis

The USD/JPY pair was closed at 105.121 after placing a high of 105.476 and a low of 105.068. The pair USD/JPY reversed its direction and started falling on Thursday amid the broad-based US dollar weakness. The decreased risk sentiment due to the escalated second wave of the coronavirus in the United States weighed on the USD/JPY pair on Thursday. The investors started to fear that governments might respond by imposing the lockdown restrictions that will slow down the economic recovery.

The United States reported about 140,453 cases on a single day on Wednesday, and it was the ninth straight day of above 100,000 cases. According to Johns Hopkins University, about 10.4 million Americans have been infected by the coronavirus so far, and nearly 242,000 have died from it. These concerns raised the safe-haven appeal and supported the Japanese Yen that ultimately weighed on the USD/JPY pair on Thursday.

On the data front, at 04:50 GMT, the Core Machinery Orders from Japan for September came in as -4.4% against the expected -1.1% and weighed on the Japanese Yen. The Purchasing Price Index (PPI) from Japan remained flat with the expectations of -2.1% for the year. At 09:30 GMT, the Tertiary Industry Activity for September raised to 1.8% against the anticipated 1.3% and supported the Japanese Yen and weighed on the USD/JPY pair.

From the US side, at 18:30 GMT, the Consumer Price Index for October was dropped to 0.0% against the anticipated 0.1% and weighed on the US dollar and dragged the pair USD/JPY on the downside. The Core CPI for October also dropped to 0.0% from the anticipated 0.2% and weighed on the US dollar and added further in the USD/JPY pair’s losses. However, the Unemployment Claims from last week were declined to 709K against the anticipated 730K and supported the US dollar that capped further losses in the USD/JPY pair.

Meanwhile, on Thursday, the Federal Reserve Chairman Jerome Powell cautioned that the US economy would further need support from Congress and the central bank even if a coronavirus vaccine becomes available by the end of the year. He said that despite the vaccine’s availability, there still will be millions of people left who have lost their job to the pandemic, and they will still struggle to find work as the economy will attempt to recover from the economic downturn.

He added that in the Federal Reserve’s eyes, the terrible rise in COVID-19 cases across the country was the “main risk” for the US economy. He added that the coronavirus’s third wave had forced several states to re-impose lockdown restrictions and caused people to lose confidence. He stressed that the economy would not fully recover until people are confident that it was safe to resume activities involving the crowd. These comments from Powell also weighed on the US dollar and added in the losses of the USD/JPY pair on Thursday.


Daily Technical Levels

Support   Resistance

103.82      106.29

102.27      107.21

101.35      108.75

Pivot point: 104.74

USD/JPY – Trading Tips

The USD/JPY is trading sideways between 105.650 – 104.900 level, and violation of this level can extend the selling trend until the next support level of 104.430 mark. Simultaneously, the bullish breakout of the 105.650 level may open further room for buying until the 106.142 level. Overall, the eyes will remain at 104.835 level to trade bearish below this level until 104.435 and 104.175 level today. Good luck! 

Categories
Forex Signals

USD/CAD Heading North – Is It a Good time to go long?

Today in the early Asian trading session, the USD/CAD currency pair successfully extended its previous day recovery streak and remained bullish around above the mid-1.3000 level. However, the bullish sentiment around the currency pair could be attributed to the modest downticks in the crude oil prices, which ultimately undermined the demand for the commodity-linked currency the loonie, and contributed to the currency pair gains. On the contrary, the broad-based U.S. dollar weakness, triggered by the multiple factors, has become one of the major factors that kept the lid on any further gains in the currency pair. Currently, the USD/CAD currency pair is currently trading at 1.3067 and consolidating in the range between 1.3054 – 1.3073.

Despite the renewed optimism about a potential treatment/vaccine for the highly infectious virus, the market trading sentiment has ben flashing mixed signals as the coronavirus woes overshadowed vaccine hopes. However, the increasing market worries over the potential economic fallout from the constant rise in new COVID-19 cases keep weighing on the market trading sentiment. As per the latest report, the country keeps reporting record cases daily, more than 100K per day. Essentially all American states are getting a worse status report of the COVID-19, strengthened by record hospitalizations and daily cases rising past-100,000 in the last few days. As in result, New York has declared a 10 p.m. curfew on bars, gyms, and restaurants to curb the spread. It is also worth mentioning that the COVID-19 hospitalizations in the U.S. exceeded 60,000.

On the bullish side of the story, the prevalent optimism over the potential vaccine for the highly infectious coronavirus disease helps the market trading sentiment limit its deeper losses. The leading vaccine producers like Pfizer and Moderna still show progress over the vaccine for the deadly virus. This was witnessed after the U.S. infectious disease expert Dr. Anthony Fauci said that Moderna could begin analyzing vaccine data within days. However, the market trading mood mostly ignored the U.S. official’s another push to keep vaccine optimism high amid surging virus cases and hospitalizations in the U.S.

Despite the risk-off market sentiment, the broad-based U.S. dollar failed to extend its overnight gains. It edged lower on the day, mainly due to the heavy optimism over the potential vaccine for the highly infectious coronavirus disease. Apart from this, coronavirus’s resurgence keeps fueling the fears that the U.S. economic recovery could be halt, which also keeps the greenback under pressure. However, the U.S. dollar losses could be considered the major factor that pushes the currency pair down. Meanwhile, the U.S. Dollar Index that tracks the greenback against a bucket of other currencies dropped to 92.922.

At the crude oil front, the WTI crude oil prices failed to extend its overnight winning streak and remained under some selling pressure on the day. However, the fresh declines in crude oil could be attributed to reports suggesting the next wave of lockdowns throughout the world, which is threatening the crude oil demand once again. Apart from this, the reason for the modest losses in crude oil prices could also be associated with the latest reports suggesting that OPEC’s oil output in October rose by 320,000 BPD in the wake of recovery in Libya’s production. Thus, the pullback in oil prices undermined demand for the commodity-linked currency – the loonie and remained supportive of the USD/CAD pair’s ongoing recovery momentum.

Moving ahead, the market traders will keep their eyes on the U.S. economic calendar, which highlights the latest data concerning U.S. inflation and jobless claims. In the meantime, the Brexit trade talks’ updates could not lose their importance on the day.


Daily Support and Resistance
S1 1.2951
S2 1.3003
S3 1.3032
Pivot Point 1.3055
R1 1.3084
R2 1.3107
R3 1.3158

The USD/CAD is trading with bullish sentiment at 1.3094, facing immediate resistance at 1.3100. Crossing above this level may drive further upward movement until 1.3177 level. On the downside, the USD/CAD may find support at 1.3025, and below this, the next support level stays at 1.2975 level. The MACD is in support of buying; thus, we may look for a buying trade over the 1.3105 level today. Good luck!

Categories
Forex Signals

Choppy Session in USD/CAD Continues – Traders Braces for a Breakout Setup!

During Wednesday’s early Asian trading session, the USD/CAD currency pair failed to stop its overnight losses and remain depressed around the 1.3030 level, mainly due to the broad-based U.S. dollar weakness. The prevalent downtrend in the U.S. dollar was mainly tied to the confidence over a potential vaccine for the extremely contagious coronavirus disease, which struggling to keep market trading sentiment positive. Moreover, President-elect Joe Biden faces difficulties from Donald Trump, which also weighs on the already weaker U.S. dollar. The reason for the declines in the currency pair could also be attributed to the fresh upward movement in the crude oil prices, which tend to underpin the commodity-linked currency the Loonie and contributes to the currency pair’s losses. However, the crude oil prices were being supported by fresh released upbeat American Petroleum Institute (API) data. As of writing, the USD/CAD currency pair is currently trading at 1.3028 and consolidating in the range between 1.3024 – 1.3037.

As we already mentioned, the market trading sentiment represented negative performance on the day as the sluggish appearance of Asia-Pacific stocks and declines of the U.S. 10-year Treasury yields tend to highlight the risk-off mood. However, the reason behind the risk-off market bias could be attributed to a combination of factors. Be it the worrisome headlines concerning the Sino-US tussle or the resurgence of the coronavirus. The market trading sentiment has been flashing red since the day started, which ultimately keeps the safe-haven assets supportive on the day. 

At the US-China front, the tensions between the United States and China still do not show any sign of slowing down as the U.S. imposed fresh sanctions on 4-Chinese diplomats over the Hong Kong Security Bill crackdown initially overshadowed the optimism over a potential vaccine and weighed on the market sentiment. Elsewhere, the declines in the equity market were further bolstered after U.S. President Donald Trump’s push to block election results to confuse optimists. 

Despite the risk-off mood, the broad-based U.S. dollar remained depressed. The investors continue to sell U.S. dollars on the back of optimism over a potential vaccine for the highly contagious coronavirus disease. Moreover, the losses in the U.S. dollar could also be associated with political uncertainty in the U.S. Thus, the losses in the U.S. dollar kept the currency pair lower. Meantime, the U.S. Dollar Index, which tracks the greenback against a bucket of other currencies, was down at 92.707.

At the crude oil front, WTI crude oil prices remained well bid around above $41 on the day, backed by the COVID vaccine hopes and the victory of Joe Biden, which boosted the market trading sentiment and demand sentiment the crude oil. Apart from this, China has played a significant role in underpinning global oil demand recovery. They showed that the inventories had declined considerably in recent weeks, indicating the domestic economic recovery. Moreover, the crude oil prices upticks were further boosted after the American Petroleum Institute (API) reported the major draw in crude oil inventories of 5.147 million barrels for the week ending November 6. Thus, the crude oil prices’ upticks underpinned the commodity-linked currency the Loonie and exerted some downside pressure on the currency pair. 


Daily Support and Resistance

S1 1.289

S2 1.2957

S3 1.2995

Pivot Point 1.3023

R1 1.3061

R2 1.3089

R3 1.3156

The USD/CAD pair is consolidating around the 1.3020 area, testing the resistance level of the 1.3033 mark. On the higher side, the bullish breakout of the 1.3033 level can stretch the buying trend until the next resistance level of 1.3098. While on the lower side, the immediate support stays at 1.3000, and below this, the next support is likely to be found around 1.2935 level. Overall, the USD/CAD isn’t moving a lot as traders are enjoying bank holidays in Canada and the U.S. amid Remembrance and Veterans Day. We may have a thin trading volume and volatility in the market today. Good luck!

Categories
Forex Signals

AUD/USD Succeeded to Stop Its Overnight Losses – Combination Of Factors in Play! 

During Monday’s early Asian trading session, the AUD/USD currency pair succeeded to stop its overnight losing streak and caught some sharp bids around above mid-0.7200 level mainly due to the risk-on market sentiment, which tend to support the observed risk currency Australian dollar and offers to the currency pair gains. Therefore, Democratic candidate Joe Biden’s victory in the U.S. presidential elections was supported by the market trading bias. Aside from this, the market trading sentiment was further supported by Brexit’s confidence, which boosted the currency pair. Across the pond, the broad-based U.S. dollar selling bias, triggered by the marker risk-on sentiment, also played its major role in supporting the currency pair. 

Moreover, the U.S. dollar losses were further bolstered by the intensifying doubts over the U.S. economic recovery as U.S. total coronavirus cases surpass 10 million. On the contrary, the long-lasting coronavirus woes in the U.S. and Europe and Trump’s challenges to the election results keep challenging the upbeat market sentiment, which becomes the key factor that kept the lid on any additional gains in the currency pair. The AUD/USD is trading at 0.7269 and consolidating in the range between 0.7268 – 0.7290.

Despite the doubts over the global economic recovery from intensifying coronavirus (COVID-19) woes in the U.S. and Europe, the market trading sentiment ticked up to the 4-week high at the start of the week’s trading and remained supportive by the Democratic candidate Joe Biden’s victory in the U.S. presidential elections. Despite many lawsuits filed by the Trump administration against the result of the presidential election, the market traders still believe that the Republican member will not keep the White House leadership. Although, the optimism surrounding the Bidden victory was further bolstered after the JPMorgan Chief Executive Jamie Dimon said that “We must respect the results of the U.S. presidential election and, as we have with every election, honor the decision of the voters and support a peaceful transition of power.” However, this helped the market’s risk sentiment and undermined the U.S. dollar’s safe-haven demand.

Across the ocean, bullish sentiment around the equity market was further bolstered by the optimism concerning Brexit, which was recently triggered after the European Union’s (E.U.) Brexit negotiator Michel Barnier recently said that he is pleased to be back in London for Brexit talks.

On the contrary, the intensifying coronavirus woes in the U.S. and Europe and intensifying lockdowns restrictions in Europe keep challenging the upbeat market sentiment and become the key factor that kept the lid on any additional gains in the currency pair. As per the latest report, the coronavirus cases (COVID-19) have exceeded 50 million globally over the weekend. At the same time, the number of infections in Europe was registered approximately 300K in one day. At the U.S. front, the U.S. reported a record rise in coronavirus cases for a 4th-consecutive day with at least 131,420 new infections, bringing the country’s total count to around 9.91 million. Simultaneously, the number of deaths in the U.S. was more than 1,000 for a 5th-consecutive day. It is also worth mentioning that 242,230 people have died from the infection in the U.S., and 6,391,208 have recovered so far. Considering the current coronavirus condition in Europe, the major Europeans like Germany and France have imposed severe restrictions to try controlling the spread. 


Moving ahead, the market traders will keep their eyes on the U.S. economic calendar, which highlights updates on inflation and consumer confidence along with Thursday’s report on initial jobless claims. In the meantime, the Brexit trade talks’ updates could not lose their importance on the day.

The AUD/USD consolidates with bullish sentiment at the 0.7294 area, facing a solid resistance at the 0.7294 level extended by a triple top pattern. On the higher side, the upward breakout can drive the buying drift to the 0.7346 mark. Alongside this, the support extends to operate at the 0.7220 mark today. The MACD trades with a mixed bias; nevertheless, it can adapt bullish if AUD/USD runs to crossover 0.7295 mark. Good luck!

Categories
Forex Signals

USD/JPY Takes Dip Amid Downward Channel – Brace for Selling! 

During the Europen session, the USD/JPY continues trading lower amid a downward channel at 102.298 level. The USD/JPY pair moved in a bearish direction and posted big losses on Tuesday. The USD/JPY pair was down on Tuesday amid the broad-based U.S. dollar weakness along with the rising risk-averse market sentiment on the back of fresh tensions between the U.S. and China. The safe-haven appeal was also supported by the rising number of coronavirus cases and lockdowns that drove the stock market on the downside and weighed on the USD/JPY pair as well.

The U.S. Dollar Index that measures the value of the greenback against the basket of six currencies dropped by 0.3% to 92.8 level on Tuesday that weighed on the U.S. dollar and dragged the USD/JPY pair prices.

On the coronavirus front, the United States, Russia, France, Italy, Netherland, Spain, and many other nations across the globe set a new record for the number of daily coronavirus cases. The U.S. reported more than 74,300 new cases in a single day, France reported more than 52,000 daily cases over the weekend. The global record for the infections was recorded as 43.4 million on Tuesday by the Johns Hopkins University.

The rising number of coronavirus cases urged governments to re-impose lockdown measures to curb the virus’s spread. These lockdowns in a situation where economies were still under recovery phase from the previous lockdown effects raised a high appeal for the safe-haven market sentiment in the market. The risk-averse sentiment supported the safe-haven Japanese Yen that ultimately weighed on the USD/JPY pair on Tuesday.

Meanwhile, on the data front, at 09:59 GMT, the BOJ Core CPI for the year dropped to -0.1% from the forecasted 0.0% and weighed on the Japanese Yen that failed to reverse the negative movement of the USD/JPY pair. At 18:00 GMT, August’s Housing Price Index rose to 1.5% from the anticipated 0.7% and supported the U.S. dollar. The S&P/CS Composite-20 HPI for the year also advanced to 5.2% from the projected 4.2% and supported the U.S. dollar. At 18:59 GMT, the Richmond Manufacturing Index for October raised to 29 against the expected 18 and supported the U.S. dollar but failed to impress investors; thus, the USD/JPY pair continued moving in the downward momentum on Tuesday.

However, at 19:00 GMT, the C.B. Consumer Confidence for October was dropped to 100.9 from the anticipated 102.1 and weighed on the U.S. dollar that added further pressure on the USD/JPY pair. The U.S. dollar failed to cheer the positive macroeconomic data on Tuesday because of the stalled talks for the next round of the U.S. stimulus package. The stalemate between the White House and the House of Representative Speaker Nancy Pelosi over the U.S. stimulus aid package’s size led to delayed talks till November 3rd election results and weighed on the U.S. dollar.

The USD/JPY continues to extend its bearish momentum as the pair trades at the 104.298 level. On the 4 hour timeframe, the USD/JPY has formed a downward channel that’s driving bearish movement in the market, and it may support the pair around 104.300 and 104.007 area. Conversely, the continuation of an upward movement is likely to drive the buying trend until the 104.778 level. Check out the sell setup below…


Categories
Forex Signals

AUD/USD Breaks Below Upward Channel – Braceof Sell Upon Retracement! 

During Thursday’s early European trading hours, the AUD/USD currency pair failed to stop its previous session bearish moves and took further offers near well below 0.7100 level, mainly due to the disappointing release of employment details, which showed that Australia’s economy lost 29.5K jobs in September. This, in turn, undermined the Asutliann dollar and contributed to the currency pair declines. Apart from this, the increasing probabilities of an interest rate cut by the Reserve Bank of Australia in November also played its major role in undermining the Australian dollar. Across the pond, the prevalent risk-off market sentiment, triggered by the worsening coronavirus (COVID-19) conditions in Europe and the U.K., exerted some additional pressure on the perceived riskier Aussie and dragged the currency pair below 0.7100 mars.

However, the global risk sentiment was further pressured by the fading hopes of additional U.S. fiscal stimulus. On the data front, the economy has lost 29.5K jobs in September against expectations for 35K losses and down from August’s 111K additions. The seasonally adjusted Unemployment Rate surged to 6.9% against expectations for a rise to 7.1% from 6.8%. In the meantime, the part-time jobs dropped by 9.4K in September against 74.8K additions in August. At the same time, the full-time employment sank by 20.1K against 36.2K additions in August. 

Considering the recent condition of the economy, the RBA’s Governor Lowe said that the benchmark interest rate could be cut down to 0.10% from the current record low of 0.25%, which undermined the Australian dollar exerted some additional pressure on the currency pair. The market trading sentiment remains depressed during the early European session as the condition of the second wave of coronavirus infections in Europe and the U.K. getting worse time by time, which suggests that the local lockdowns cannot tame the pandemic, which in turn suggests fresh national activity restrictions. 

In the meantime, the fears of a no-deal Brexit and the dovish tone of major central bankers pushing for further fiscal help also exert downside pressure on the market trading sentiment, which in turn undermined perceived riskier Aussie and dragged the currency pair below 0.7100 marks.

Additionally, the long-lasting inability to pass the U.S. fiscal package also weighed on the risk sentiment, which eventually undermined the perceived riskier Australian dollar and contributed to the currency pair gains. Despite U.S. President Donald Trump’s recent push to break the coronavirus stimulus deadlock, the opposition Democratic Party remains up in its demands. As per the latest report, the U.S. Treasury Secretary Mnuchin recently blamed the opposition to put obstacles for the much-awaited aid package before the presidential election to keep President Donald Trump lagging the election polls. 

At the US-China front, the renewed concerns over worsening diplomatic tensions between the world’s two largest economies also exerted downside pressure on the market trading, which keeps the AUD/USD currency pair under pressure. Other than the US-China tussle, Australia and China are also loggerheads with each other.

As a result, the broad-based U.S. dollar succeeded in extending its Asian session loss gains es and took some further bid during the early European session as investors still prefer the safe-haven assets in the wake of the risk-off market sentiment. However, the U.S. dollar gains seem rather unaffected by the intensifying political uncertainty ahead of the upcoming U.S. presidential election on November 3. However, the incoming polls tend to recommend a clear-cut presidential success for the Democrat nominee Joe Biden, which might cap additional upside momentum for the U.S. dollar. However, the U.S. dollar gains become the key factor that kept the currency pair under pressure. At the same time, the U.S. Dollar Index that tracks the greenback against a bucket of other currencies inched up 0.02% to 93.398 by 9:58 PM ET (1:58 AM GMT).

Looking forward, the traders will keep their eyes on the weekly U.S. Initial Jobless Claims, which is expected 825K versus 840K prior. Apart from this, the continuous drama surrounding the US-China relations and updates about the U.S. stimulus package will not lose their importance. 


Daily Support and Resistance

S1 0.7095

S2 0.7133

S3 0.715

Pivot Point 0.717

R1 0.7187

R2 0.7208

R3 0.7245

The AUD/USD pair has violated the double bottom support level of 0.7150 level, and below this, the pair may drop further until the next support area of 0.7098 level. On the higher side, the pair may find resistance at 0.7150 and 0.7190 level. The bearish bias remains solid today, especially below 0.7150.

Entry Price – Buy 105.245

Stop Loss – 105.645

Take Profit – 104.845

Risk to Reward – 1:1

Profit & Loss Per Standard Lot = -$400/ +$400

Profit & Loss Per Micro Lot = -$40/ +$40

Fellas, now you can check out forex trading signals via Forex Academy mobile app. Follow the links below.

iPhone Users: https://apps.apple.com/es/app/fasignals/id1521281368

Andriod Users: https://play.google.com/store/apps/details?id=academy.forex.thesignal&hl=en_US

Categories
Forex Service Review

Real-Time Currency Valuation Indicator Review

Igor Korepin is the creator of this indicator, created in June 2015, although with several later updates. The developer presents this indicator thought in monetary indices, and it can also analyze and control the market situation widely.

The indicator displays indices of eight major currencies and can also calculate indices of any other currency, metal, CFD, etc. You won’t need to study dozens of charts to determine strong and weak currencies, as well as their current dynamics. The picture of the entire currency market during any period can be seen in a single indicator window.

Main Features

It forms indices of eight major currencies, automatically determining the indices of the current instrument, as well as the best indices available at the moment. You can display only the required indexes in option and one of the indexes not included in the main group.

It allows you to quickly switch to any currency pair or open a chart of the desired instrument directly from the control panel. The indicator works both in standard mode with historical data and in real-time mode with tick data.

The reference point and the drawing depth are established using a vertical line available for movement. It has an integrated set of classic technical indicators – MA, MACD, CCI, RSI, Stochastic. The market situation is monitored through an integrated system of notifications.

The prefixes and postfixes of a symbol are determined automatically. It is possible to select a currency, whose index will be used as primary in the calculations. Graph of the correlation dependence between currencies in one click.

Advantages

-It is very easy to use – you do not need to prepare for the first use.

-Quick navigation – choosing the required currency pair or opening a new chart is easy.

-Exotic instruments – analyze the movements of metals, oil, and other raw materials.

-Real-Time Mode – The tick chart of all coins shows the best times to enter.

-The situation is under control – allow the notification system and never miss a strong movement in the market.

-Only seven currency pairs for calculations – the indicator is useful and easy to use.

In summary, we are looking at a handy indicator and suitable for every beginner trader. Please, ease of use and a very friendly interface. Users who have tried this indicator have been, for the most part, very satisfied with it, so we think it is an indicator to consider in our list of favorite indicators.

We have only found one thing against, it is not for sale, it is only available for rent at a price of 35 USD for a period of 3 months. You also have a demo version for your free trial.

Categories
Forex Service Review

Double Top Bottom Scanner with RSI Filter Review

This indicator was created in March 2018 by Jan Flodin. We speak of an indicator that identifies superior/ inferior double or triple formations or a next neckline (confirmed top/ bottom). It has RSI, pin bar, and MACD or RSI divergence filter options that allow filtering only the most robust configurations.

The prompt writes the signals to a text file that can also be used by an Expert Advisor (EA) for automatic trading. For example, Information in the text file: [symbol], [term], [price of first top], [price of neckline], [purchase or sale (0=purchase, 1=sale)], [time of first end], [time of neckline], [time of second end] + 3 additional parameters that are used only by this EA.

Double Top Bottom Scanner Features

This indicator can monitor all the symbols visible in your Market Watch window at the same time. You can apply the indicator in a single graph and instantly monitor the entire market.

You can monitor each time frame, from M1 to MN, and it will send you a real-time alert when identifying the top or bottom or neckline break.

You can use RSI as a trend and/or divergence filter to properly identify potential investments.

The indicator includes an interactive panel. Clicking on an element will open a new chart with the symbol and time frame in question.

Simply place the indicator on a chart, and you will receive an alert of any symbol and any time frame of your choice.

Input Parameters & General Settings

Panel Width: For example, if you are using a non-standard font size in windows, you can set a higher value for all text to be visible.

Template Name: The template selected here will be attached to the chart that will open when you click on one of the signals in the panel. The name has to include the file extension .tpl. The goal of this parameter is to make it easier for the quick decision to make a trade or not. Or if you wait for confirmation of the actual investment. Normally you would use your own template which, for example, could contain a support/resistance indicator.

Wait for the candle to close for warning (neckline only): If set to ‘false’ then the warning will come as soon as the conditions are met, without waiting for the candle to close. When set to False, this option is only used for cleavage breaks.

Note that because of the multifunctionality neither buy and sell tips nor lines and arrows are drawn on the indicator chart. A line between the ends as well as the neckline is drawn on the chart that can be opened from the panel.

The developer’s recommendation is to put the indicator on an M5 chart and on the EURUSD, preferably a clean chart without any other indicators or Expert Advisor on it.

A priori it seems that we are dealing with a rather useful indicator, as demonstrated by the positive criticisms of its users. Another point in favor is the service that the developer gives to the buyers of the indicator, he is always willing to answer your questions. This indicator is available on the MQL market at a price of 39 USD, or for rent at 12 USD per month. Additionally has a demo version to test it out for free.

Categories
Forex Service Review

Triplex Expert Advisor Review

Triplex is an auxiliary tool for manual Forex trading. This Expert Advisor has two operating modes with separate settings, the Community mode, and the Scalping mode. Read on to learn more about how this EA performs, what it costs, and what we truly feel about this service. 

The COMMUNITY Mode

When EA is in this mode, EA monitors purchase order lots and sales orders. If several orders are present, the balancing level is calculated automatically, taking into account all possible commissions. This level is identified with a dotted line in the graph (green to buy, red to sell). If there are purchase and sale orders with different lots on the market, then there will be an additional line for the break-even point, common to all orders, drawn (white by default). In this case, the values of Take Profit and Stop Loss are calculated on the basis of the sum of the equilibrium values of purchases and sales.

This mode is perfect for automation of strategies with an average, and also for pyramid and partial position blocking strategies.

The SCALPING Mode

Being in this mode, when a position is opened manually, a stop command is placed in the opposite direction at a certain distance, with the batch increase specified in the settings. During movement to the open position, the stop order is dragged with the step, specified in the settings. Once the final stop level has been reached, the order is withdrawn. Take the gain levels and stop-loss are placed for the open order at the distance of the final stop. During an unfavorable movement and the opening of a placed stop command, the next stop order is placed in the opposite direction.

The maximum allowed number of position commands is also specified in the settings. In case the order limit is reached, or in case of insufficient free margin to open the next order, a stop command is placed, accompanied by a final stop and a profit take, for the net open position. It should be noted that during the manual closing of one of the series commands, the entire position will be forcibly closed.

The TEST Mode

In test mode with the “Test mode enabled” function, the EA opens commands by a signal of the intersection of two moving averages, whose periods can be changed in the settings. This function does not work in a real market and is intended solely for familiarization with different modes of operation.

We have not found any comments or criticism of this robot, so we can not convey the opinions of the users. Although this tool was created in 2015, after 5 years, it seems that there have been hardly any activations of the robot, so it has gone very unnoticed among the MQL user community. We would not risk acquiring a robot with so much ignorance of the same, existing hundreds of alternatives much more contrasted in the market.

If you still want to purchase this tool, its price is 19 USD in the market MQL, having a free demo version.

Categories
Forex Service Review

Royal Wave Pro MT4 Review

Royal Wave is a Trend-Power tool based on a price adjustment algorithm that performs statistical analysis of price movement to predict and locate low-risk entry and exit areas. This alert system generates well-timed trading signals that give the trader enough time to make the most appropriate trading decisions.

Features of the Royal Wave Pro:
  • Algorithm of trend power.
  • Low-Risk Entry and Exit Zones.
  • Predictions for areas where the asset is overused and oversold.
  • Rich Alerting System (these are sound alerts, SMS notifications, Zone Flasher, etc.)
  • The oscillation range from 0 to 100 facilitates the understanding of the signal.
  • Analysis of various terms and currencies.
Areas of Entry:

Once the value of the oscillator is almost zero it means that there will be a significant movement in the price shortly because traders in most installments agree on the current price and have come together to move the price of a big step in one direction. Therefore, this indicator predicts entry areas with a low risk where the price only seems to move in one direction until the moment the oscillator reaches the exit zone. The entry zones are always going to be the beginning close enough to a big move in price.

Zones de Salida (Exit Zones):

When the oscillator reaches the output area in the 100 environments, it is predicting an overbuy when the color is yellow, or an excess when the color is blue. This zone can be used to exit an operation or update a stop loss level due to the high probability of reversals in these areas.

The exit points of the zones are potential candidates to be points of reversal in a trend. By using the real-wave signal array, some of these areas can be identified as low-risk to enter a reversal trade.

Trend and power supply:

The oscillator value represents the current power of the trend ranging from 0 to 100. When energy is rising, a yellow color indicates a steady upward trend, and blue color indicates a strong downward trend. A decreasing power shows consolidation, which means that there is no trend in price, and the trader must wait for the entry zone.

Signal Matrix:

Gives an informative view of various symbols against all time frames in a matrix. Each cell in this matrix is a brief representation of the price behavior of a symbol from a single time frame.

Transversal Window:

View and compare data from an arbitrary symbol and time frame within a graph with a different symbol and time frame. This tool can be used to develop multiplayer and multi-timeframe strategies.

In short, we are talking about a reasonably comprehensive indicator. Created in May 2019, it has already had some updates from its developer Ehsan Tarakemeh. At the moment, you don’t have any comments from users, but personally, we think it is an indicator that can be very useful in our trade, and we would put this indicator on the waiting list so that it can be added over time.

It would be advisable to use the free trial version to get to know it better. Its selling price on the MQL market is 129 USD, or 69 USD if you prefer to rent it for 3 months.

Categories
Forex Signals

EUR/JPY Violates Descending Triangle Pattern – Who’s Up for Buying?

Today in the early European trading session, the EUR/JPY stretched its previous session bullish trend and took further bids around an intraday top closer to 123.240, mainly due to the risk-on market sentiment. The faded safe-haven appeal was backed by the on-going optimism over treatment for the highly infectious coronavirus. Therefore, the demand for Japanese yen fell compared to the single currency Euro and we noticed an upward movement in the EUR/JPY currency pair.

A day before, the EUR/USD pair’s gains were limited after the speech of European Central Bank’s President, Christine Lagarde. She made fresh comments on the coronavirus pandemic threat and said that despite the rebounded economic activity in Eurozone, the recovery remains incomplete, uncertain, and uneven. She added that consumer spending has resumed, but they are still cautious about their jobs and income prospects, so the spending is behind its margin. Similarly, the business investment has picked up, but the weak demand and pertaining uncertainty have weighed on the investment plans.

The market trading sentiment recently got the lift from the hints of further money flow from the US and Europe. These developments were supported by the US House Speaker Nancy Pelosi’s optimism towards the COVID-19 aid package discussion. Apart from this, the European Central Bank (ECB) President Christine Lagarde repeated that the Governing Council, “continues to stand ready to adjust all of its instruments, as appropriate” Thi, in turn, boosted the market trading sentiment.

The US-China picked up further pace after the headline from the South China Morning Post (SCMP), published Tuesday’s early Asian session, suggests further hardships for the Sino-American trade deal. However, the news relies on China’s imports of the US goods under the trade agreement between Washington and China, which keeps challenging the upbeat market tone and cap further upside momentum for the currency pair.


The EUR/JPY pair is trading with a bullish bias at 123.400 level, having violated a descending triangle pattern on the four hourly charts. The triangle pattern was extending resistance at 122.850 level, and bullish crossover and formation of a bullish engulfing pattern may drive further buying until the next resistance area of 124.088 level. The leading technical indicators such as RSI and MACD also show bullish crossover, supporting bullish bias in the market. At the same time, the 50 EMA is also in support of the buying trend. Checkout a trading plan below…

Entry Price – Buy 123.288
Stop Loss – 123.292
Take Profit – 123.688
Risk to Reward – 1:1
Profit & Loss Per Standard Lot = -$400/ +$400
Profit & Loss Per Micro Lot = -$40/ +$40
Fellas, now you can check out forex trading signals via Forex Academy mobile app. Follow the links below.
iPhone Users: https://apps.apple.com/es/app/fasignals/id1521281368
Andriod Users: https://play.google.com/store/apps/details?id=academy.forex.thesignal&hl=en_US

Categories
Forex Market Analysis

Daily F.X. Analysis, August 31 – Top Trade Setups In Forex – Trading Choppy Sessions!   

On the news side, the eyes will be on European Spanish and German CPI data, which are expected to report a mixed figure. Later the Italian Prelim CPI is expected to report slightly positive data that may support EUR. Let’s take a look at the trade setups.

Economic Events to Watch Today  


EUR/USD – Daily Analysis

The EUR/USD pair was closed at 1.19054 after placing a high of 1.19196 and a low of 1.18108. Overall the movement of the EUR/USD pair remained bullish throughout the day. After moving sidelines and under pressure for two days, EUR/USD pair surged on Friday and posted gains on the back of broad-based U.S. dollar weakness from the dovish comments from the highly awaited Jerome Powell’s speech. However, the gains remain limited due to rising coronavirus cases and fears of the second wave in Europe.

The Government of Europe has re-imposed restrictions on citizens and renewed quarantine measures for some travelers. In response to these renewed restrictions, thousands of people took to the streets of Berlin against it. Police in Berlin arrested 300 demonstrators during the protests against Germany’s coronavirus restrictions.

On Friday, France made a larges jump since May 16 and reported 7462 new coronavirus cases. Germany reported around 1737 cases and three deaths. Italy reported 146 cases on Friday, the largest since April 1, and Spain announced 9779 cases on August 28. The resurgence of coronavirus in Europe came near when every European country was planning to start schooling from next week. Now, fears for a renewed spike in cases exacerbate as the schools’ time has come near. These lingering fears have kept the market sentiment under pressure and gains in EUR/USD limited on Friday.

Meanwhile, on the data front, at 11:00 GMT, the German GfK Consumer Climate in August declined to -1.8 from the projected 1.0 and weighed on single currency Euro. At 11:03 GMT, the German Import Prices for July rose to 0.3% from the expected 0.2% and supported Euro added in the currency pair’s gains.

At 11:45 GMT, the French Consumer Spending in July fell to 0.5% from the anticipated 1.2% and weighed on Euro. For August, the French Prelim CPI came in as -0.1% against the expected -0.2% and supported Euro and added in the gains of EUR/USD. The French Prelim GDP for the second quarter came in line with the expectations of -13.8%.

Daily Technical Levels

Support Pivot Resistance
1.1902 1.1904 1.1908
1.1898 1.1910
1.1895 1.1914

 EUR/USD– Trading Tip

The EUR/USD is trading slightly bullish at 1.1900 level, having an immediate resistance at 1.1918 level and support at 1.1896 level. On the higher side, a bullish breakout of the 1.1920 level can trigger buying until 1.1955 level. Conversely, a bearish breakout of 1.1896 level can drive selling until 1.1835 support. 

GBP/USD – Daily Analysis

The GBP/USD pair was closed at 1.33505 after placing a high of 1.33564 and a low of 1.31861. Overall the movement of GBP/USD pair remained bullish throughout the day. After moving sideways on Thursday, GBP/USD pair posted strong gains on the back of supportive comments from Governor of Bank of England at Jackson Hole Symposium and broad-based U.S. dollar weakness.

On Friday, the GovernorBank of England Governor said that the central bank was not out of power to support the economy. This statement was followed by the dramatic shock caused by the coronavirus pandemic.

In a speech to Jackson Hole symposium, Andrew Bailey told that the bank has more ammunition left to support the economy. He also said that the major bond-buying drives had been proved more effective in the major economic crisis caused by the pandemic.

He informed that the central bank appreciated the need to keep enough headroom to deal with future shocks. He said that the bank still has a range of fiscal tools, including the negative interest rates, and there was no need to tighten monetary policy.

In March, the Governor took over the bank and almost immediately oversaw a 300 billion pounds bond-buying program and a cut in interest rate to a record low of 0.1%. After these comments from the Governor of Bank of England, the GBP/USD pair surged to the highest level since December 15, 2019.

The gains in GBP/USD pair were also supported by the weakness in the U.S. dollar that was derived from the dovish comments from the Chairman of Federal Reserve Jerome Powell on Thursday. According to Powell, the inflation will remain at 2% average for some time that increased hopes for a entended period of loose monetary policy by the central bank and weighed on local currency.

The U.S. dollar weakness helped GBP/USD pair to post extra gains, and hence, the pair reached the highest of more than eight months. There was no macroeconomic release from the U.K. side on the data front, but from the U.S. side, at 17:30 GMT, the Core PCE Price Index fell to 0.3% in July from the anticipated 0.5% and weighed on U.S. dollar. The Personal Spending rose to 1.9% in July from the projected 1.5% and supported the U.S. dollar. At 18:05 GMT, the Chicago PMI came in line with the anticipations of 51.0 in August. At 19:00 GMT, the Revised UoM Consumer Sentiment rose to 74.1 from the projected 72.8 and supported the U.S. dollar.

 Daily Technical Levels

Support Pivot Resistance
105.3400 105.5700 105.7800
105.1300 106.0100
104.8900 106.2300

 GBP/USD– Trading Tip

The AUD/USD pair is trading with a neutral bias below an immediate resistance level of 1.3365 level. Closing of candles below 1.3365 level is likely to drive selling until 38.2% Fibonacci support level of 1.3280 and 61.8% Fibonacci support level of 1.3250 level. The MACD has also crossed below 0, supporting selling bias in the GBP/USD pair. Let’s consider taking selling trades below 1.3365 level today.  

USD/JPY – Daily Analysis

The USD/JPY pair was closed at 105.351 after placing a high of 106.945 and a low of 105.200. Overall the movement of the USD/JPY pair remained bearish throughout the day. The USD/JPY pair rose to near ten days the highest level on Friday near 107.00 level but failed to cross the resistance level and dropped on the back of broad-based U.S. dollar weakness and posted strong losses day. The pair posted the biggest daily decline on Friday and dropped to 105.2 level at the week’s ending day.

In the early trading session, the USD/JPY pair faced rejection near the 107.00 level and witnessed a dramatic turnaround on the latest news that Japan’s Prime Minister Shinzo Abe was stepping down due to ill health.

The 65-year-old Japan’s PM Shinzo Abe said that he did not want his illness to get in the decision-making way. He apologized to the Japanese people for failing to complete his term in office. He has had ulcerative colitis, inflammatory bowel disease, and he said that his condition had worsened recently.

Abe’s current period began in 2012, and last year he became Japan’s longest-serving prime minister. Until a successor is chosen, he will remain in his post and continue his duty. This political development gave strength to Japanese Yen that dragged the pair back closer to the 106 level on Friday.

Meanwhile, in later sessions, the pair was further dragged down due to the U.S. dollar’s broad-based weakness. The greenback was under pressure due to the dovish comments from the Fed Chair Jerome Powell at the Jackson Hole Symposium on the previous day.

On Thursday, Powell announced a significant policy shift and said that Fed was willing to run the inflation hotter than usual and support the labor market, also suggested keeping interest rates lower for longer. This also weighed on market sentiment and added further in the USD/JPY pair losses that dragged the pair towards 105.00 level.

On the data front, at 04:30 GMT, the Tokyo Core CPI for the year in August was declined to -0.3% from the anticipated 0.3% and weighed on Japanese Yen. From the U.S. side, at 17:30 GMT, the Core PCE Price Index was dropped to 0.3% from the anticipated 0.5% in July and weighed on the U.S. dollar and added in the losses of currency pair. The Personal Spending rose to 1.9% against the expected 1.5% in July and supported the U.S. dollar.

Daily Technical Levels

Support Pivot Resistance
1.3339 1.3349 1.3364
1.3325 1.3373
1.3315 1.3388

USD/JPY – Trading Tips

The USD/JPY is trading within a sideways range of 105.866 to 105.200 range. The pair entered into the oversold zone previously, but now it has completed 23.6% Fibonacci retracement, and above this, the next target is likely to be found around 105.870. The MACD has crossed over 0 and has entered into the buying zone. Bullish bias seems dominant in the market today. Therefore, we may see USD/JPY prices soaring towards 38.2% Fibo levels of 105.870. Buying can be seen at over 105.200 level today. Good luck! 

Categories
Forex Market Analysis

Daily F.X. Analysis, August 28 – Top Trade Setups In Forex – U.S. Fed Chair Powell Speaks! 

On the news front, the economic calendar is due to a report series of CPI and GDP figures from the European economy. These events are expected to be overshadowed by the U.S. Personal Pending, Chicago PMI, and Revised UoM Consumer Sentiment, which are expected to slightly worse than beforehand. This may add further bearish bias for the U.S. dollar today.

Economic Events to Watch Today  


EUR/USD – Daily Analysis

During the Thursday’s Asian trading hours, the EUR/USD currency pair managed to extend its previous session gaining streak and still flashing green while taking round near 1.1830/40 level mainly due to the broad-based U.S. dollar selling bias, in the wake of cautious sentiment around the market ahead of the U.S. Federal Reserve (Fed) Chair Jerome Powell’s speech. On the contrary, the buying interest around the shared currency is declining on the day amid the intensifying virus fugues in Europe, which eventually becomes the key factor that has been capped further upside in the currency pair. 

At the moment, the EUR/USD currency pair is currently trading at 1.1835 and consolidating in the range between the 1.1817 – 1.1850. However, the traders are cautious about placing any strong position ahead of week’s Jackson Hole conferences where Federal Reserve’s (Fed) President Jerome Powell will speak about the central bank’s long-awaited monetary policy framework review, which will focus on inflation. 

Despite the upbeat U.S. and China data, the equity market has been declining since the day started amid the renewed concerns over the US-China relation. At the US-China front, the Trump administration sanctioned those companies who are helping China to mark its existence in the South China Sea. In contrast, China fired missiles in a military drill near the South China Sea. 

At the USD front, the broad-based U.S. dollar failed to gain any positive traction on the day. However, the losses could be associated with the doubts about the U.S. economic recovery ahead of Fed Chairman Jerome Powell’s speech at Thursday’s Jackson Hole symposium themed. However, the losses in the U.S. dollar became the key factor that kept the currency pair’s higher. Whereas, the U.S. Dollar Index that tracks the greenback against a basket of other currencies dropped by 0.12% to 92.882 by 11:59 PM ET (4:59 AM GMT).

At the coronavirus front, the coronavirus cases grew to 236,429, with a total of 9,280 deaths toll, according to the German disease and epidemic control center, Robert Koch Institute (RKI) report. In the meantime, the cases rose by 1,576 in Germany yesterday against Monday’s +1278. Whereas the death toll also grew by 3. It is worth mentioning that Germany recorded its highest number of new COVID-19 cases during the weekend in almost 4-months. As a result, they undermined the bullish sentiment around shared currency and held the currency pair between the thin range.

Daily Technical Levels

Support Pivot Resistance
1.1754 1.1828 1.1894
1.1689 1.1967
1.1615 1.2033

 EUR/USD– Trading Tip

The EUR/USD is trading slightly bullish at 1.1851, crossing over the resistance level of 1.1849 level. On the lower side, the EUR/USD may find support at 1.1830, while a bearish breakout of 1.1830 level can trigger selling until 1.1800 level. In case of a bullish breakout, the EUR/USD pair may begin further buying trends until 1.1880 and 1.1945 levels.


GBP/USD – Daily Analysis

The GBP/USD stimulates the daily high to 1.3242, up 0.29%, while directing into the European session open. Like major pairs, the Cable restored the yearly high on Thursday ere dipping to 1.3161, which caught the two-day winning streak. After remarks from Fed Chair, the broad U.S. dollar rally pulled the quote descending the prior day. 

The greenback’s latest drops support the pair bulls before BOE Governor Andrew Bailey’s address at the Jackson Hole Symposium. While running the third bullish day in the previous four, the GBP/USD prices also spend tiny heed to the Brexit distress indicated by The Times.

The final scheduled round of post-Brexit trade negotiations between the E.U. and the U.K. have already been abandoned, but ministers are expected to appear next week. Additionally, Germany’s expulsion of Brexit discussions as agenda from next week’s critical talks amongst the E.U. representatives.

Subsequently, the uproar girdling insect repellent ingredient defending against the coronavirus (COVID-19) and 21-day immunity plan represented a mild enthusiasm at home. The sentiment overlooks the biggest daily COVID-19 problems while producing 1,522 numbers for Thursday.

On the other hand, U.S. President Donald Trump addressed to end dependence on China “once and for all.” Besides, the mystic concepts of Fed Chair Powell, involving Average Inflation Targeting (AIT), appear to decrease the allure as markets start reading between the words and spot economic worries.

 Daily Technical Levels

Support Pivot Resistance
1.3145 1.3215 1.3268
1.3092 1.3338
1.3022 1.3391

 GBP/USD– Trading Tip

The GBP/USD has distributed the trading range of 1.3240 – 1.3180, and a bullish breakout of Cable is anticipated to lead it higher unto 1.3275 mark. On the higher side, the GBP/USD faces the next resistance at 1.3275 mark and over this level, the pair may find 1.3323 resistance. Speaking about the technical side of the market, 50 periods of EMA, RSI, and MACD suggest bullish bias in the GBP/USD pair. Today, let’s look for buying trades above 1.3275 level.


USD/JPY – Daily Analysis

During Thursday’s early European trading session, the USD/JPY currency pair managed to stop its early-day losing streak and took modest bids near above 106.00 level mainly after the (BOJ) board member Hitoshi Suzuki expressing his take on the monetary policy outlook, which eventually undermined the Japanese yen and extended some support to the currency pair. 

 Meanwhile, the risk-off market sentiment, driven by the renewed US-China tussle and intensifying virus cases in Europe and Asia, tends to underpin the safe-haven Japanese yen and kept the currency pair sidelined. At this moment, the USD/JPY currency pair is currently trading at 106.02 and consolidating in the range between 105.81 – 106.08.

It is worth reporting that the Bank of Japan (BOJ) board member Hitoshi Suzuki expressed his part on the monetary policy outlook while saying that “Will ease monetary policy further without hesitation with an eye on the pandemic impact on the economy. “He also added that “If BOJ were to ease more, it could use a special program for combating pandemic, cut short-, long-term interest rates or ramp up risky asset buying.” However, these statements recently weakened the Japanese yen and provided little support to the currency pair. 

Apart from this, the Takatoshi Ito, a famous economist who was once a preferred nominee to become Bank of Japan (BOJ) governor, stated that the Japanese economy could see a quicker recovery by 2022 if a vaccine becomes available. However, the currency pair failed to give any major attention to the above headlines, as it remains flat around 106.00 due to the cautious risk tone and weaker greenback ahead of the Fed Chair Powell’s Jackson Hole speech.

Across the pond, the failure of the American lawmakers to offer any hint on the big coronavirus (COVID-19) relief package or the highest COVID-19 new cases in Italy since May, not to forget the fresh US-China tussle over the South China Sea, all factors are weighing on the market trading sentiment, which could be considered as the main factors for the currency pair limited moves. 

At the US-China front, the Trump administration plans sanctions on those companies who are helping China to mark its existence in the South China Sea. At the same time, China fired missiles in a military drill near the South China Sea. The U.S. Secretary of State Michael Pompeo criticized China for “coercive bullying tactics against our friends in the United Kingdom.” This also exerted a burden on the market trading sentiment. This, in turn, underpinned the safe-haven Japanese yen demand and capped upside momentum in the pair.

Despite the risk-off market sentiment, the broad-based U.S. dollar failed to gain any positive traction on the day, as well as the losses could be associated with the doubts about the U.S. economic recovery ahead of Fed Chairman Jerome Powell’s speech at Thursday’s Jackson Hole symposium themed. However, the losses in the U.S. dollar became the key factor that kept the currency pair’s gain limited. Whereas, the U.S. Dollar Index that tracks the greenback against a basket of other currencies dropped by 0.12% to 92.882 by 11:59 PM ET (4:59 AM GMT).

Looking forward, the market traders await the Federal Reserve Chairman Jerome Powell’s speech in the Jackson Hole Symposium. As well as, America’s preliminary readings of the second quarter (Q2) GDP, which is expected -32.5% versus -32.9% will be key to watch. In the meantime, the updates surrounding the fresh Sino-US tussle, this time over the South China Sea, as well as the coronavirus (COVID-19) updates, could not lose their significance.


Daily Technical Levels

Support Pivot Resistance
105.8700 106.2900 106.9700
105.1800 107.4000
104.7600 108.0800

USD/JPY – Trading Tips

The USD/JPY is trading bearish at 106.082 level, holding above a support level of 106, which is extended by upward channel. On the higher side, the USD/JPY expected to gain an immediate resistance around 106.566 and 107.078. Looking at the 2-hour timeframe, the 50 periods EMA is extending resistance at 106.350. Likewise, the MACD and RSI are staying in a bearish zone, beneath 50 and 0, sequentially. The USD/JPY may trade bearish below 106.350 to target 106 and 105.800. Good luck! 


Categories
Forex Market Analysis

Daily F.X. Analysis, August 13 – Top Trade Setups In Forex – Eyes on U.S. Jobless Claims!  

On the news front, the eyes will remain on the U.S. Unemployment Claims figures, which are expected to perform slightly better. With this, the U.S. dollar can exhibit more buying, driving gold lower and the dollar higher.

Economic Events to Watch Today   


EUR/USD – Daily Analysis

The EUR/USD was closed at 1.17393 after placing a high of 1.18078 and a low of 1.17217. Overall the movement of the EUR/USD pair remained flat throughout the day. The EUR/USD pair took bids and surged above 1.18050 level, but after the release of U.S. economic data, the EUR/USD pair started to decline and posted losses. The pair ended its day on the same level it started its day with and hence, gave a smooth movement throughout the day.

The fresh risk appetite droved the rise in the EUR/USD pair amid the registration of the first coronavirus vaccine from Russia. Russia became the first country to register its vaccine for coronavirus, and this news gave a push to heavy risk appetite in the market.

The stock markets rushed to their higher level on this news, and the riskier currency Euro also gained from it in the early trading session. The gains continued after the release of macroeconomic data from the European side.

At 14:00 GMT, the ZEW Economic Sentiment for Eurozone in August surged to 64.0 against the expected 55.3 and supported the single currency. The ZEW Economic Sentiment for Germany surged to 71.5 from the anticipated 57.0 and supported Euro. The better than expected economic sentiment for the month gave strength to a single currency and pushed EUR/USD pair above 1.18050 level.

However, the gains could not last for long as the U.S. President Donald Trump announced that he was very seriously considering a capital gains tax cut to help job creation. If Trump gave another executive order on capital taxation, it would likely face legal challenges as it would push the boundaries of the President’s executive orders.

Daily Technical Levels

Support Pivot Resistance
1.1722 1.1769 1.1828
1.1664 1.1874
1.1617 1.1933

EUR/USD– Trading Tip

The EUR/USD has traded with bullish sentiment at 1.1805 level, holding right below an immediate resistance level of 1.1815. Below this, the pair is likely to trade bearish until 1.1783 and 1.1745 level. Conversely, the bullish breakout of the 1.1815 level can lead the pair further higher until the 1.1890 level. Let’s keep an eye on 1.1815.

GBP/USD – Daily Analysis

The GBP/USD closed at 1.30470 after placing a high of 1.31318 and a low of 1.30413. Overall the movement of GBP/USD pair remained bearish throughout the day. The GBP/USD pair dropped on Wednesday and posted losses as the unemployment benefits claims surged in the local country and also because of the strength of the U.S. dollar onboard.

At 04: 01 GMT, the BRC Retail Sales Monitor from Great Britain surged to 4.3% from the expected 2.5% and supported British Pound. At 11:00 GMT, the Claimant Count Change for July rose to 94.4K from the expected 9.7K and weighed heavily on British Pound. The Unemployment Rate from the U.K. came in as 3.9% in June and fell short of expectations of 4.2% and supported GBP.

The clamant count change from the U.K. that showed that more people claimed for unemployment benefits in July. According to the Office of National Statistics, around 730,000 people have become unemployed since March this year, and since June, further 114,000 people have lost their jobs.

However, the jobless rate remained flat at 3.9% in June; this reflected that the number of people who had given up looking for work increased.

The ONS Deputy national statistician, Jonathan Athow, said that the labor market had continued its recent fall in employment and significantly reduced work hours because many people were furloughed.

The people without a job and those who were not even looking for a job but wanted to work increased as the demand for workers was depressed.

It is also believed that the full extent of Britain’s’s job problems has been hidden under the Government’s furlough scheme, which promised to cover 80% of the salaries of workers who could not work due to lockdown.

Daily Technical Levels

Support Pivot Resistance
1.3002 1.3035 1.3066
1.2971 1.3099
1.2938 1.3130

GBP/USD– Trading Tip

The GBP/USD consolidates at 1.3070 level, holding right above the 50 periods EMA support area of 1.3040 level while the bearish breakout of 1.3040 level can extend selling unto 1.2918 level. Recently as we can see in the chart above that the GBPUSD pair has violated its upward trendline that supported the pair around 1.3130 level, and now below this, we can expect GBP/USD to continue trading bearish. The GBP/USD should show a bearish crossover to confirm a strong selling bias in the Cable. On the higher side, Sterling may find resistance at 1.3105 and 1.3175. Let’s consider selling below 1.3045 level today. 

USD/JPY – Daily Analysis

The USD/JPY pair was closed at 106.491 after placing a high of 106.682 and a low of 105.870. Overall the movement of the USD/JPY pair remained bullish throughout the day. The USD/JPY pair extended its previous day gains and rose for the 3rd consecutive day amid increased risk appetite in the market. The Russian vaccine, U.S. Stimulus package, Trump’s executive orders, and the rise of the equity market drove Wednesday’s move of USD/JPY pair.

The President of Russia, Vladimir V. Putin, announced that the Russian government had approved the world’s first coronavirus vaccine. Putin said that his daughter had taken the vaccine in a cabinet meeting, and it has worked adequately enough to declare it safe.

However, global health authorities have said that the vaccine has to complete the last stage of clinical trials to be approved. Despite this, Mr. Putin thanked the scientists in a congratulatory note to the nation who developed the vaccine. He also said that it was “the first” very important step for Russia and generally for the whole world.

Scientists in Russia and other countries said that rushing to offer the vaccine before final-stage testing could backfire. Tens of thousands of people are included in the final stage of trials, and it could take months to prove its effectiveness.

However, investors cheered the news of the vaccine as it was long-awaited, and as in result, the risk appetite of the market rose. The equity markets surged that weighed on the safe-haven Japanese Yen, which ultimately pushed the USD/JPY pair higher, which keeps challenges the upbeat market tone. In the meantime, the White House National Security Adviser Robert O’Brien blamed China while saying that the “Chinese hackers have been targeting U.S. election infrastructure ahead of the 2020 presidential election.” These gloomy updates capped further upside in the currency pair by giving support to the safe-haven Japanese yen.

Later today, the eyes will remain on the U.S. Jobless claims data to determine further trends in the USD/JPY pair. 

Daily Technical Levels

Support Pivot Resistance
106.5500 106.7900 107.1400
106.2100 107.3700
105.9700 107.7200

USD/JPY – Trading Tips

The USD/JPY trades sideways over resistance become support level of 106.628 level. Above this, the USD/JPY pair is opening further room for buying until 107.450 level. The RSI and MACD are also supporting bullish bias in the pair. A recent bullish breakout of 106.450 level can extend the buying trend until 107.390. The current market price of USDJPY is staying over 50 EMA, which extends support at 105.950 and may push the pair higher. Let’s consider buying above 106.480 level today. Good luck! 

Categories
Forex Market Analysis

Daily F.X. Analysis, August 11 – Top Trade Setups In Forex – Stronger Dollar In Play! 

On the news front, the economic calendar is a bit light and may not be offering any major economic release. Therefore, we need to trade based upon stronger dollar sentiment, as traders are likely to price better than expected NFP data from last week.

Economic Events to Watch Today  


EUR/USD – Daily Analysis

The EUR/USD pair was closed at 1.17363after placing a high of 1.18005 and a low of 1.17358. Overall the movement of the EUR/USD pair remained bearish throughout the day. The EUR/USD pair extended its previous day’s losses on Monday amid the strong U.S. dollar and increasing US-China tensions. The main driver of the EUR/USD pair on Monday was the U.S. dollar.

The U.S. Dollar was strong across the board with the U.S. Dollar Index at 93.5 level, with investors taking comfort from President Donald Trump’s move to boost the economy in the wake of coronavirus pandemic.

Over the weekend, U.S. President Trump signed a series of executive orders aimed at enhancing the economic condition. The orders included an extension of expanded jobless benefits at a lower rate of $400 a week. It was down from the previous $600 a week. The State government will pay 1/4th of the bill, which was also included in Trump’s order.

However, it is not clear that the executive orders can withstand court scrutiny as the power relies on Congress. Nevertheless, the President’s orders were an attempt to play his part in breaking the impasse. Though the talks between Republicans & Democrats on August 7 broke some of the differences, they still did not show any consensus. The new round of talk is expected to resume at some point, but the date is not yet confirmed.

The chances for a $3 trillion stimulus package have been compromised to $2 trillion by Democrats, but that is still a trillion more than the framework that the ruling party aimed for. Additionally, the JOLTS Job Openings data from the U.S. on Monday came in as 5.89 M in June in comparison to 5.30M of forecasts and supported the U.S. dollar that weighed on EUR/USD pair.

From the Europe side, the Sentix Investor Confidence for August dropped to -13.4 from the anticipated -16.0 and the previous -18.2 and supported Euro that kept the losses of EUR/USD pair limited on Monday.

Meanwhile, early on Monday, the Defence Ministry of Taiwan said that a Chinese jet fighter crossed the median of the Taiwan Strait line, possibly in response to the U.S. Health Secretary Alex Azar’s visit to Taipei.

Any form of American recognition of the island nation Taiwan that China claimed its own make Beijing angry, and hence, it responded. The tensions in Taiwan have grown since the Hong Kong clash between the U.S. & China.

Besides this, the world’s biggest nations are also clashing over the technological front; recently, the U.S. banned American firms from dealing with TikTok and WeChat app. However, the most important matter between both countries lies with the fulfillment of the phase-one trade deal. Negotiators from both sides are scheduled to meet this week to analyze the achievements of the deal. The risk-off market sentiment was picking its pace after the escalation of US-China tensions, and it has weighed on the riskier pair EUR/USD.

Daily Technical Levels

Support Pivot Resistance
1.1713 1.1758 1.1780
1.1691 1.1825
1.1646 1.1848

EUR/USD– Trading Tip

The single currency Euro slipped against the U.S. dollar amid increased USD demand as traders started to price in stronger than expected NFP data released on Friday. The EUR/USD is now bouncing off the support level of the 1.1728 level. It may head higher towards 23.6% Fibonacci retracement level of 1.1768, and above this, the next resistance can stay at 1.1765 level, which marks 38.2% Fibonacci retracement level.


GBP/USD – Daily Analysis

The GBP/USD pair was closed at 1.30730 after placing a high of 1.31032 and a low of 1.30188. Overall the movement of GBP/USD pair remained bullish throughout the day. The GBP/USD pair rose on Monday ahead of key data due later this week, despite the U.S. dollar’s strength. The risk sentiment favored some of the factors, and investors believe that further upside could be on the horizon.

The latest higher move in the Pound was because of the key economic data, including the update of the labor market and second-quarter GDP scheduled to be released later this week. Moreover, the GBP/USD pair was also supported by the improving risk sentiment in the market after the hopes about the US-China phase-one trade deal became optimistic.

The U.S. trade representative and U.S. Treasury Secretary will meet the Chinese Vice Premier later this week to evaluate the implementation of the phase-one trade deal by China. China has assured that it will fulfill its promises made under the agreement that include the increased U.S. farm purchases and the better protection of Intellectual property rights.

This faded some of the risk-off market sentiment and caused GBP/USD to surge.

The risk sentiment was backed by the comments of WHO Chief Scientist Dr. Soumya Swaminathan, who praised the global efforts in the development of the COVID-19 vaccine. She reported that almost 200 vaccines were being developed globally and were in the stage of clinical or pre-clinical trials. According to her, 24 vaccines had entered the clinical trials in human beings.

The unprecedented global efforts to develop the coronavirus vaccine triggered the risk-on market sentiment as various potential paths to the end of coronavirus gave hope to the investors. The improved risk appetite gave a push to GBP/USD pair on Monday.

On Brexit front, the U.K. media has suggested that David Frost remain the U.K.’s chief Brexit negotiator and will stay on committed to securing an agreement with the European Union even if a deal is not secured by the end of September.

The U.K. formally left the E.U. in January after voting to leave in 2016, and negotiations to reach post-Brexit trade deal are currently deadlocked because both sides have failed to reach a consensus on various matters.

As the end of the transition periods is getting closer day by day, Prime Minister Boris Johnson has vowed to end the year with or without a deal, outside Europe. David Frost is set to take up a new position as National Security Advisor (NSA) in September. However, his position as Chief Brexit Negotiator will remain in place.

Meanwhile, the U.K. government pledged a further 20 Million Pounds in aid to Lebanon following Tuesday’s deadly explosion in Beirut. The U.K.’s support will directly go to the injured and people displaced by the explosion. It will also provide food, medicine, and urgent supplies to the needy in Lebanon affected by the explosion.

The U.K. government has already given 5 Million Pound to the emergency relief effort and said that it would stand by the Lebanese people in the hour of need. This also helped GBP in recovering its position and pushed GBP/USD pair higher on Monday.

Daily Technical Levels

Support Pivot Resistance
1.3024 1.3064 1.3110
1.2978 1.3150
1.2938 1.3196

GBP/USD– Trading Tip

On Tuesday, the GBP/USD consolidates at 1.3067 level, holding right above the 50 periods EMA support area of 1.3040 level while the bearish breakout of 1.3040 level can extend selling unto 1.2918 level. Recently as we can see in the chart above that the GBPUSD pair has violated its upward trendline that supported the pair around 1.3130 level, and now below this, we can expect GBP/USD to continue trading bearish. The GBP/USD should show a bearish crossover to confirm a strong selling bias in the Cable. On the higher side, Sterling may find resistance at 1.3105 and 1.3175. Let’s consider selling below 1.3045 level today. 


USD/JPY – Daily Analysis

The USD/JPY currency pair succeeded to break its previous session thin trading range and rose above 106.00 marks mainly due to the broad-based U.S. dollar fresh strength, buoyed by the Friday’s better-than-expected employment report, which eventually helped the U.S. dollar to put the bids. 

On the other hand, the upbeat market sentiment, backed by the optimism that the U.S. policymakers are showing signs to resume talks about the stimulus package, undermined the safe-haven Japanese yen and contributed to the pair’s gains. In the meantime, the risk-on market sentiment was further bolstered by the upbeat key U.S. and China data, which tends to urge buyers to invest in riskier assets instead of safe-have assets. Currently, the USD/JPY currency pair is currently trading at 106.00 and consolidating in the range between 105.72 – 106.06.

Despite concerns about the ever-increasing coronavirus cases across the world and worsening US-China relations, the investors continued to cheer the hopes of the U.S. fiscal stimulus package triggered by the signs that White House officials and congressional Democrats showed a willingness to compromise on another stimulus package to bolster the stalled economy. 

On the other hand, U.S. President Donald Trump fulfilled his promise to take executive action as the U.S. Congress failed to offer any outcome over the country’s latest stimulus measures. As a result, U.S. President Trump’s signed four executive orders to release unemployment claim benefits, help with student loans, and aid those living in a rented house, which also exerted a positive impact on the market trading sentiment and contributed to the currency pair losses.

Moreover, the upbeat market sentiment was being supported by Friday’s better-than-expected employment report. Details suggested Non-farm payrolls increased by 1.763 million in July month, vs. the estimated 1.6 million increase. The unemployment rate also declined to 10.2% in July, compared to June’s reading of 10.5%.

Despite the positive data, the doubts remain about the U.S. economic recovery amid the on-going surge in the coronavirus cases. As per the latest report, the U.S. crossed the five million COVID-19 cases as of August 10, according to Johns Hopkins University. Whereas Australia’s 2nd-most populous state, the epicenter of the pandemic, Victoria, reported the biggest single-day rise in deaths. As per the latest figures, Australia’s coronavirus death losses crossed 314 as Victoria announces a daily record of 19 deaths and 322 new cases in the past 24 hours. 

Apart from the virus woes, the long-lasting struggle between the world’s two largest economies remained on the cards as U.S. President Donald Trump turned off the business tap for China’s TikTok and WeChat. As well as, the U.S. imposed sanctions on the Hong Kong Leader Carry Liam, which keeps challenges the upbeat market tone. In the meantime, the White House National Security Adviser Robert O’Brien blamed China while saying that the “Chinese hackers have been targeting U.S. election infrastructure ahead of the 2020 presidential election.” These gloomy updates capped further upside in the currency pair by giving support to the safe-haven Japanese yen.

As a result of the upbeat U.S. data, the broad-based U.S. dollar succeeded in gaining some positive traction on the day. Still, the bullish bias in the U.S. dollar is expected to be short-lived as doubts remain about the U.S. economic recovery amid on-going coronavirus cases. However, the gains in the U.S. dollar became the key factor that kept the currency pair higher.

Daily Technical Levels

Support Pivot Resistance
105.6900 105.9500 106.1900
105.4500 106.4500
105.1900 106.7000

USD/JPY – Trading Tips

The USD/JPY has made a slight bullish recovery from 105.780 to 106.150 area, especially after examining the 38.2% Fibonacci support level of 105.650. A bullish breakout of 106.467 resistance level can drive more buying until the next resistance area f 107.198. On the lower side, the USD/JPY may find support at 105.600 and 105.078, extended by the 38.2% and 61.8% Fibonacci retracement level. The current market price of USDJPY is staying over 50 EMA, which extends support and may push the pair higher. Let’s consider buying above 105.750 level today. Good luck! 

Categories
Forex Market Analysis

Daily F.X. Analysis, August 10 – Top Trade Setups In Forex – Market Prices In NFP Outcome! 

On the news front, eyes will be on the low impact events such as Sentix Investor Confidence from Eurozone and JOLTS Job Openings from the U.S. Besides, the stronger NFP data may keep dollar bullish.

Economic Events to Watch Today  


EUR/USD – Daily Analysis

The EUR/USD prices were closed at 1.17849 after placing a high of 1.18829 and a low of 1.17550. Overall the movement of the EUR/USD pair remained bearish throughout the day. The EUR/USD pair broke under the 1.1800 level and reached 1.175 the lowest in 3 days after the U.S. dollar took its pace and outperformed in the market. The greenback rebounded from its two years low and trimmed its weekly losses on Friday that weighed on EUR/USD pair.

The rising tensions between the U.S. & China have already driven the U.S. dollar higher, and the U.S. jobs data on Friday added further strength to it. The latest development in the US-China conflict was the U.S. imposed sanctions on officials in Hong Kong and China, including Hong Kong leader Carrie Lam, over the suspension of protests in the territory.

On the data front, at 11:00 GMT, the German Industrial Production for June increased to 8.9% from the forecasted 8.3% and supported Euro. The German Trade Balance also came in positive as 14.5 B against the expected 10.3 B. At 11:45 GMT, the French Industrial Production for June increased to 12.7% against the forecasted 8.6% and supported Euro. The French Prelim Private Payrolls for the quarter came in as -0.6% against the anticipated -1.0%.

The French Trade Balance for June came in negative as 8.0B against the projected -7.1B and weighed on Euro. The Italian trade Balance at 13:00 GMT came in line with the expectations of 6.23 B.

Investors failed to cheer the positive data from Europe as the U.S. dollar was stronger on Friday, and the sharp decline in Turkish Lira over the past week exerted downside pressure on Euro.

A sharp selloff triggered the Euro’s correction in Turkish Lira that dropped it to the lowest of 2 years, the historic currency crisis of August 2018. The reserves of Central Banks of Turkey (CBRT) went negative for a couple of weeks, which caused a surge in the Turkish Lira’s selloff. However, last month, CBRT made a massive purchase of gold and overtook Russia as the world’s largest gold purchaser. In the lira currency crisis of 2018, Euro underperformed during that time period, and this has raised fears that if the history repeated, then downside risks for Euro can be seen.

However, on the U.S. front, at 17:30 GMT, the Average Hourly Earnings for June increased to 0.2% from the forecasted -0.5% and supported the U.S. dollar. The Non-Farm Employment Change suggested that 1.8M jobs were created in June against the expectations of 1.6B and supported the U.S. dollar. In the month of June, the Unemployment Rate also fell to 10.2% from the expected 10.5% and weighed on the U.S. dollar. The strong U.S. dollar weighed heavily on EUR/USD pair and dragged its prices to the level below 1.8000 on Friday.


Daily Technical Levels

Support Pivot Resistance
1.1773 1.1783 1.1792
1.1764 1.1802
1.1754 1.1812

EUR/USD– Trading Tip

The EUR/USD pair retraced lower to trade at 1.1793 level. On the upside, the EUR/USD may encounter resistance at 1.1865 and 1.1909 mark. A bullish breakout at this level can extend the buying trend to 1.2050. Today, the EUR/USD is likely to find support at 1.17650 level, and below this, further selling can be seen until the 1.1713 level. Let’s keep a focus on 1.1805 level to stay bearish below this in the EUR/USD pair.


GBP/USD – Daily Analysis

The GBP/USD pair was closed at 1.30521 after placing a high of 1.31492 and a low of 1.30092. Overall the movement of GBP/USD pair remained Bearish throughout the day.

The Pound to U.S. dollar exchange rate fell by -0.3% on Friday to a low of 1.3000. The Sterling fell against the U.S. dollar after the concerning comments from the UK Chancellor Rishi Sunak, who warned that the extended furlough scheme would only give false hopes to the people. Mr. Sunak said that it was wrong to trap the people in a situation and pretended that there was always a job that they can go back to.

However, apart from this downbeat comment, Mr. Sunak also raised hopes for a possible Brexit deal and said that he was confident that there was a possibility to get an agreement with the E.U. by September. As in result, GBP investors became hopeful that there was possible progress in the EU-UK trade talks.

On the data front, the Halifax House Price Index for July rose from 0% to 1.6% and beat the expectations of 0.2%. However, the GBP investors failed to cheer the U.K.’s positive data as the U.S. dollar was strong across the board on Friday.

The U.S. dollar gained traction on the board on Friday after the release of better than expected U.S. jobs data. The latest US Non-Farm Employment Change suggested an increase in the number of jobs created in June by the U.S. Department of Labor & Statistics to 1.8M from the expected 1.5M and helped the U.S. dollar gain traction.

The Average Hourly Earnings from the U.S. also rose to 0.2% from the previous -1.3% and the expected -0.5% and supported the U.S. dollar. The Unemployment Rate for June dropped to 10.2% against the expected 10.5% and May’s 11.1%. The less unemployment rate from the U.S. showed that the U.S. economy was moving on the recovery side even after the widespread coronavirus cases across the country.

The better than expected U.S. jobs data weighed heavily on GBP/USD pair and dragged it to 1.3000 level on Friday. The Sterling traders will be looking ahead to Monday’s release of the latest Retail Sales figures from the U.K. Any improvement in the U.K.’s retail sector would provide strength to Sterling.

The U.S. Dollar Investors will be looking at the publication of the US NFIB business optimism index for July. The demand for safe-have greenback can be lifted after any improvement in the outlook for the American economy. On Tuesday, the release of the U.K.’s ILO unemployment rate report for June. If the figures came in equal to 3.9% or less, we could see the GBP/USD pair go on the upward as fears of high unemployment will be diminished.

Daily Technical Levels


Support Pivot Resistance
1.3037 1.3052 1.3065
1.3024 1.3080
1.3010 1.3093

GBP/USD– Trading Tip

The GBP/USD consolidates at 1.3067 level, holding right above the 50 periods EMA support area of 1.3040 level while the bearish breakout of 1.3040 level can extend selling unto 1.2918 level. Recently as we can see in the chart above that the GBPUSD pair has violated its upward trendline that supported the pair around 1.3130 level, and now below this, we can expect GBP/USD to continue trading bearish. The GBP/USD should show

a bearish crossover in order to confirm a strong selling bias in the Cable. On the higher side, Sterling may find resistance at 1.3105 and 1.3175. Let’s consider selling below 1.3045 level today. 


USD/JPY – Daily Analysis

The USD/JPY pair was closed at 105.912 after placing a high of 106.055 and a low of 105.478. Overall the movement of the USD/JPY pair remained bullish throughout the day. After falling for two consecutive days and staying flat for a day, USD/JPY pair rose and posted gains on Friday amid strong U.S. dollar comeback.

Since two years after U.S. President Donald Trump decided to ban U.S. transactions with two popular Chinese apps, the U.S. dollar rebounded from the lowest level. During the occasions of massive conflicts between the U.S. & China, the U.S. dollar has often preferred as a refuge, and on Friday, the U.S. dollar again used this status.

The U.S. President Donald Trump officially banned American companies from working with TikTok, the video streaming app, and WeChat, the social messaging app. the action to ban these companies was taken in response to the widespread fears of data privacy. However, the chances that the US-China conflict will rise further increased after this move, and hence, the U.S. dollar gained.

Meanwhile, the U.S. Treasury imposed sanctions on 10 top officials from Hong Kong and China, including the Hong Kong Leader Carrie Lam, as the protests arose in the territory against the new security law in Hong Kong.

Furthermore, the U.S.’s macroeconomic data also remained supportive of the U.S. dollar when it came to better than expectations on Friday. 

At 17:30 GMT, the highlighted Average Hourly Earnings rose to 0.2% in June from the negative expectations of -0.5% and supported the U.S. dollar. The Non-Farm Employment Change rose to 1763K from the forecasted 1530K and came in favor of the U.S. dollar. The greenback was also supported after the Unemployment rate for June also dropped to 10.2% from the expected 10.5%. In June, the better-than-expected U.S. jobs data gave a push to the U.S. dollar that added further strength to USD/JPY pair on Friday.

However, the gains remained limited as the data from Japan was also supportive of its local currency. At 04:30 GMT< the Average Cash Earnings for the year from Japan came in as -1.7% against the forecasted -3.0% and supported the Japanese Yen. The Household Spending for the year from Japan also came in as -1.2% against the expectations of -7.8% and supported the Japanese Yen. However, the Leading Indicators from Japan were released at 10:00 GMT, came in line with the expectations of 85.0%.

The positive data from Japan supported Japanese Yen on Friday that kept a check on USD/JPY pair gains. On the vaccine front, the risk sentiment was supported by the news that Russia was all set to register the world’s first COVID-19 vaccine next week. The Russian vaccine third phase trials were currently in progress, and Russia announced to disclose them on August 12. This vaccine was developed by the collaboration of the Russian Defence Ministry and the Gamaleya Research Institute.

The improvement in risk sentiment weighed on safe-haven Japanese Yen and contributed to the USD/JPY pair’s gains.

Daily Technical Levels

Support Pivot Resistance
105.8200 105.8900 105.9300
105.7800 106.0000
105.7200 106.0400

USD/JPY – Trading Tips

The USD/JPY continues to trade at 105.780 area with the bullish sentiment, especially after testing the 38.2% Fibonacci support level of 105.650. On the lower side, the USD/JPY may find support at 105.600 and 105.078 level, which is extended by the 38.2% and 61.8% Fibonacci retracement level. A bullish breakout of 106.467 resistance level can drive more buying until the next resistance area f 107.198. The current market price of USDJPY is staying over 50 EMA, which extends support and may push the pair higher. Let’s consider buying above 105.600 level today. Good luck! 

Categories
Forex Service Review

Customizable Support and Resistance Indicator Review

Customizable Support and Resistance is an indicator that was published in the mql5 marketplace at the end of April 2017. The indicator was created by Emir Revolledo, a developer with 7 products in total who is a self-described trader and programmer. The indicator was last updated to version 1.2 in August of 2017.

Overview

This indicator was designed to work either by itself or in combination with other indicators to provide better trading accuracy. The indicator works on the most popular trading platform MT4 and offers a special level of customization. Traders can choose support and resistance levels from Period 1 to Period infinity with any timeframe that is available. Traders can also manage the alert settings by turning the alarm on or off, or placing time limitations between alerts and setting a number of pips to be alerted at when the price is near the Support or Resistance line.

Service Cost

The indicator is priced on the lower side and the developer offers three pricing options. Traders can buy the indicator with 20 activations for $30 USD, or rent it at a rate of $14.99 for 3 months or $24.99 for one year. Many other indicators are priced around $100, but the developer has managed to keep this one in an affordable range for buying or renting. A free demo is available for testing and it has been downloaded more than 300 times since 2017.

Conclusion

This indicator was designed by an experienced developer with the goal of making trades more accurate. This is especially true when the indicator is combined with other indicators or EAs. We see a good level of customization options but it hasn’t received much feedback from users that have tested it so far. The fact that this indicator has only received six comments (some of which are from the developer) and has been around since 2017 shows us that it buying it may be a bit of a gamble, but overall it seems to be a simple indicator that could work well.

Categories
Forex Service Review

Mr Top Bottom Non-Repainting Indicator Review

Mr Top Bottom is an indicator that was created in March 2019 by developer Mostafa Fouladi. Mr Top Bottom is a powerful no-paint indicator that draws arrows on Tops and Bottoms. It has too complicated calculations but is very simple to use. Each arrow has a specific impact value of 1 to 10. If the impact is greater it means that the signal is probably more reliable, because it is calculated on the basis of a larger oscillation.

Overview

Main features of Mr Top Bottom:

  • He doesn’t paint again.
  • Identify the best tops and bottoms.
  • Useful for Trend Trading and Swing Trading.
  • Works well in Up Trend Market, Down Trend and Non Trend Market.
  • It works on any symbol and in any time frame.
  • Gives tickets with the lowest risk.
  • Very simple and easy to use.
  • Send alerts, emails and Push notifications.

The indicator has a sensitivity parameter that helps the operator to make it compatible with its own type of trading. It also provides access to an ATR and power panel of currency.

Parameters of Mr Top Bottom:

-Maximum bars: Maximum candles for drawing arrows. This parameter will not change the results of the calculations. Simply reduce the calculation time.
Sensitivity: You can set the Sensitivity from A to F. A means the lowest Sensitivity and F means the highest. The best sensitivity will be represented by E.

-Signal type: If you put it in “Current bar”, it shows you the current signs of the candle and if you put it in “Confirmed bar” it shows the arrows after the candle closes.

Information panel and configuration:

-Show candle time: If true, the candle clock countdown timer will be displayed.

-Candle Time Color: To set the candle time text color.

-Display panel: If true, the panel will be displayed. Including the ATR panel and Currency Power.

-Display panel in Tester: If you want to test the indicator in Strategy Tester, set this parameter to false to increase the test speed.

-Moving panel on X-axis: Moving panel on X-axis of graph.

-Move the panel on the y-axis: Move the panel on the y-axis of the chart.

-Unique identification for drawing objects: If you want to attach the indicator more than once in a chart, you must change this parameter to a new character symbol such as $, $!, %, etc.

Service Cost

This robot cannot be bought, it is only available for rent on the MQL market, at a price of 40 USD for a month, or 160 USD for a year. The free demo version is also available, so you can test it and check if this tool can be useful in your trading.

Conclusion

In short, we are talking about a robot that tries to take advantage of trends, locating tops and bottoms. Apparently the EA gets good results, since there are several users who have highly valued this robot, there are no negative criticisms. Mr Top Bottom is a robot suitable for all types of traders, its operation is very simple and its fundamentals are easy to understand.

This Forex service can be found at the following web address: https://www.mql5.com/en/market/product/36398

Categories
Forex Service Review

New Stable Profit EA Review

New Stable Profit is a robot that works in real accounts since August 2017. 100% of the trades in this system are based on algorithmic trading. The negotiation is based on trend correction movements, positions are opened depending on the strength of the trend and the volumes of negotiation according to a formula that the developer has not revealed.

Overview

The sets of positions have a common benefit, which is based on the corrective movement statistics of this trading instrument. The developer comments that when important economic news is published, it is recommended to disconnect the advisor, provided that there are no open transactions so that the performance is higher. Commercial recommendations set forth that for every $500 deposit, the user opens a 0.01 lot position.

This version of the New Stable Profit robot is adapted for EURUSD trading and is traded within a time frame of 1H. It is in this time frame that the EA gets its best results. Two things we like about this robot are, it doesn’t use Martingale, and it doesn’t use coverings in its operation either. Leverage of 1:100 is recommended for optimal operation. This robot is one of the best we have analyzed, as we have mentioned, it works continuously since August 2017. It has real statistics that can be consulted in MQL5, and the returns are staggering.

The yield of this EA is of 607% since its beginning, having obtained the following annual returns:

  • 2017 (August. December): 78.32%.
  • 2018: 128.39%
  • 2019: 55.82%
  • 2020: (January – March): 11.69%

It is fantastic that since its inception, every year it has achieved positive returns, but the most fantastic thing is that no month has ended with negative returns. (The month that has won the least has been November 2019 with 1.38%).

Service Cost

Obviously, it is an excellent robot, and as such its price is not cheap. In the MQL marketplace, you find it for $1,250 USD, although we have found third-party pages that offer it for just under $1,000 USD.

Conclusion

There are several user reviews of this robot and all are positive, so we are looking at a highly recommended robot whenever you are willing to make the initial investment of its cost. It also has a free trial version to test it before possible purchase.

This Forex service can be found at the following web address: https://www.mql5.com/en/market/product/40388

Categories
Forex Service Review

MultyTrend PA Indicator Review

Multytrend PA is an indicator that was created in April 2019 by developer Mikhail Nazarenko. This indicator combines the principles of Price Action and a unique filtering algorithm with feedback for three moving averages. This allows you to know what are the pivot points and current trends in any time frame with a high probability of success in the trades you are pointing out. Multytrend PA is an update of the classic Trend PA indicator and can be used with the principle of the three Elder screens, but everything that is needed is shown in the same chart, which is easier for the user.

Overview

Line 1 is in fast motion, while line 2 is in the main action, and line 3 is a slow movement to determine the direction in opening orders. The coincidence of the trend in the three movements is indicated by the arrows of the indicator and reports an incipient trend in the indicated direction.

Characteristics of this indicator:

  • It has no delay and gives a notable advantage over the Moving Average standard.
  • Simple and intuitive graphical interface, the configuration is minimal.
  • Configuration for each customizable MA for your trading style.
  • Alerts are activated when trends coincide on all three lines.
  • Optimized code and minimal load on your computer processor.

Settings:

  • Line 1 filtering bars (0 – line 1) – the period to calculate line 1 in bars.
  • Line 2 filtering bars (0 – line 2) – the period to calculate line 2 in bars.
  • Line 3 filtering bars (0 – line 3) – the calculation period of line 3 in bars.
  • Filtering mode (false – high/low, true – close)

Pantalla:

  • Line 1 width – line thickness 1
  • Line 2 width – line thickness 2
  • Line 3 width – line thickness 3
  • Draw in history bars – draw the indicator in the specified number of bars in the chart

Trend alert options include:

-Alert – activate alert when trends coincide in 3 Movings Averages.

-Send mail – send an email if trends in 3 lines are the same.

-Send push notification – send a push message to your mobile when trends in 3 moving averages are the same

Conclusion

In summary, we are talking about an indicator that combines the action of price with a trend prediction based on the crosses of 3 moving averages. It seems to be a reasonably comprehensive indicator and may be engaging in its concept. Due to the fact that it has not been on the market for a long time, there are not many comments from users to verify the usefulness of this indicator, but the few comments that exist are positive.
If you want to buy this indicator, it is available on the MQL market at a price of 55 USD. You can also rent it annually for 34 USD, and try out its demo version to make a purchase decision once you have analyzed it and understood its operation well.

This Forex service can be found at the following web address: https://www.mql5.com/en/market/product/37831

Categories
Forex Service Review

Renaissance Android EA Review

Renaissance Android EA is a robot created in March 2020 by German developer Jaye Ricci Ademola Puncha. The author says that this sophisticated EA is based on his years of experience with statistical, technical, and quantitative analysis and is awarded with modular tools and options that will be well appreciated by any real professional trader. It specializes in EURUSD 4H, but in principle works on most high volume FX pairs.

Overview

This intelligent algorithm monitors the movement of prices, timing, open and close sail ratios, as well as other indicators that will be hidden within the secure confines of a database. Compare this information with historical data in order to determine the probabilities of future events. Based on these probabilities, it dynamically modifies the trend direction and trade volume always within the modular parameters.

What makes this EA better than others is the fusion of total automation and the simultaneous possibility of absolute human control. So, it looks more like an android, hence the name. With financial markets constantly changing, the interface provides the opportunity to derive benefits from anomalies by modifying selected parameters continuously. This is possible because the principles applied have been universal for decades, yes decades. The results of the tests coincide with the live results and this strategy has been very good for the author over many years.

Key advantages of Renaissance Android EA:

  • No martingale or grid.
  • Stop loss will always be used for capital protection.
  • Protection of intelligent reduction.
  • It’s easy to use.
  • It is highly adaptable due to variable settings.
  • Integrated mechanisms inspired by real trade.
  • Very good risk/reward ratio.
  • It works on most brokers.

Renaissance Android EA Requirements:

-Brokers with commissions and spreads as low as possible, as well as a good server ping, low latency so that orders are executed as fast as possible.

-Brokers with a GMT+2/ GMT+3 server time (saving days). This prevents inaccuracies and trading errors.

-For EA I always recommend VPS hosting services. This allows for 24/7 trading.

-Diversification of instruments, markets, and strategies.

Adjust risk accordingly when trading during:

– Major events (FOM, NFP, etc.)
– Extraordinary crises (COVID-19, natural disasters, wars, etc.)
– Weekend

The author will only sell 5 licenses. Once sold, this EA will disappear forever. This helps to stop the alpha decomposition of this strategy. Obviously, this EA license comes with email support, free periodic updates, and other materials, such as a brochure and configuration files for additional FX pairs and time frames on request.

Conclusion

We are talking about a very professional EA and within the reach of very few. It is a tool designed for professional traders or capital managers. The few comments there are from users who have tried the demo version are very good, but the price of the robot makes it only accessible to very few. The sale price of this EA on the MQL market is 30,000 euros, and it is not available for rent, only the demo version and the contact of the author is available for any doubts or questions you want to ask before purchasing it.

This Forex service can be found at the following web address: https://www.mql5.com/en/market/product/47307

Categories
Forex Service Review

PZ Wedges Forex Indicator Review

PZ Wedges is an indicator created in September 2017 by Arturo López Pérez. Arturo López Pérez is a private investor and speculator, software engineer, and founder of Point Zero Trading Solutions.

Overview

The basis of this indicator is that it finds wedges, which are continuation patterns identified by converging trends around a period of price consolidation. It signals the trades using a donchian break along with the break-up of the wedge formation. This is a very user-friendly indicator. With customizable colors and sizes. It implements breakout signals and implements alerts of all kinds. For optimal use and to be able to see wedges of all sizes, which can even overlap, you will have to load the indicator several times in the table with different sizes, for example, 6, 12, 18, and 24.

Input parameters of this indicator:

  • Size: Refers to the size of the wedge patterns that are found.
  • Break up period: Donchian period to mark trade.
  • Max. History bars: Amount of bars passed to examine in the chart.
  • Color of bullish patterns: This parameter is self-explanatory.
  • Color of the bearish patterns: This parameter is self-explanatory.
  • Uninterrupted pattern color: This parameter is self-explanatory.
  • Line width: Size of pattern lines.
  • Color of bullish shoots: This is the color of the arrows to buy.
  • Color of bearish shoots: This is the color of the arrows to sell.
  • Arrow Size: This is the size of the arrows shown in the chart.
  • Custom Alert Name: Custom title for alerts raised in this chart.
  • Show alerts: Enable or disable screen alerts.
  • Email alerts: Enable or disable email alerts.
  • Push Alerts: Activate or disable push alerts.
  • Sound alerts: Enable or disable sound alerts.
  • Sound file: Sound file to play when a screen alert is activated.

Service Cost

If you want to try this indicator to get to know it better, a demo version is available in the MQL market indicators section. If you finally want to buy it, its selling price is 49 USD.

Conclusion

In summary, we talk about an indicator that is based on the search for a specific trend continuation pattern (wedges), and that warns us of its formation and alerts us for the decision to buy or sell a certain financial asset. We think it may be an interesting indicator to have as a complement to other indicators, for example, a trend indicator. Suitable for all types of traders, be it a beginner or someone who is more advanced. We haven’t found many comments from users who have already tried this indicator, and the few criticisms that exist are disparate, with both positive and negative feedback.

This Forex service can be found at the following web address: https://www.mql5.com/en/market/product/25264

Categories
Forex Service Review

Renko Trade Alarm Indicator Review

Renko Trade Alarm is an indicator that is designed to work on the graph with Renko and Mean Renko candles. This tool generates buying and selling signals on the chart and sends notifications to the user.

Overview

For proper operation, an offline table is required in which Renko Media candles are generated. In order to receive the “Scalp” signal, it is feasible to include more filters in the form of oscillators “Stochastic” and “MACD”.

Display of the signals:

-Swing – 123 Formations.

-Pattern – Double Bottom, Triple Bottom, Double Top, Triple Top, Formations 123 Reverse.

-Scalping – Periodic change in price direction, plus additional filters in the form of stochastic oscillators and MACD.

-Ichi – Signals that have passed the Ichimoku indicator filter.

One of the most common problems we have when having multiple Renko charts with different box sizes is that a trader could end up getting confused in the size of the Renko card box they are looking at. There are not many indicators that seem to want to consider this issue, which is where the Renko Business Assistant Indicator can be of great help. By adding this Renko Trading Assistant indicator to your Renko offline or Renko Median tables, you can show in real-time the size of the Renko card box as well as key investment points.

The Renko Trade Alarm indicator helps you especially if you have multiple Renko or Renko charts open. It might seem a little tedious to navigate between Renko’s different charts, as you will need to look at the Open/Close prices of the previous boxes to determine the size of the box you are using. With the Renko Trade Alarm indicator, with a quick look, the indicator will show you what Renko graphic is seeing.

Service Cost

The selling price of this tool is 30 USD, or you can also rent it for 10 USD per month.

Conclusion

In short, we are talking about a Renko indicator that can be confusing for beginner traders. For this reason, we recommend studying first what constitutes a universal Renko indicator to understand this tool better. There is a free trial version that we must try to know this indicator and the possibilities it has to enrich our trading or not. You can find it in the MQL market in the indicators section.

This Forex service can be found at the following web address: https://www.mql5.com/en/market/product/37572

Categories
Forex Service Review

Supertrend EA (Trend Trading EA) Review

Supertrend EA, a fully MT4 compatible robot, is an expert consultant developed for automated trading. Expert advisers are also called trade robots because they are responsible for managing operations on a fully automatic basis. If you’re using the trading robot, no human supervision will be required. However, the Expert Advisor you are going to use must be well tested in the market, in real-time, and the indicators must be optimized.

Overview

Supertrend EA is a trend robot that executes a trade when the trend changes, when a break occurs, when a correction occurs, and when pullback occurs.
The expert consultant alone won’t show anything on your chart. If you want the visual shape of your robot, you must attach an indicator that facilitates the company in a download file.

The parameters in which this expert advisor executes trades operations are basically two and are as follows:

-Change in the trend: If positions are opened, they will all be closed when the market trend changes.

-Stop Loss: This expert consultant uses the Supertrend indicator as a stop loss level.

Before you start trading in the live account with this expert advisor, it is advisable to use a demo account first. At first, it is advisable to learn to operate manually. When you feel confident about your trading strategy then only you should code that trading strategy in order to turn it into a robot. Generally, not all traders have the advantage of knowing how to code a system, and for that, there are robots like Supertrend EA. This expert advisor can be used in any period to trade any currency pair. It is not advisable to use this robot to trade other assets such as commodities, indices, or precious metals, as the EA is designed to be used in Forex.

The following features are included in the Basic version:

  • Reverse strategy
  • Max Open Operations
  • Directorate of Commerce
  • Order Comment
  • Filter of propagation
  • Administration of Money
  • Closing in the trend change
  • The pending order expires
  • Supertrend used as Stop loss

The following functions will only be available in the Pro version:

  • Trailing Stop
  • Break-Even
  • Candle Trail
  • ATR Trail
  • Time/day filter
  • Conclusion

Service Cost

This is one of the many tendential robots that exist. It can come to work well, and best of all, it has a basic free version. The Pro version that has the functions mentioned above has a price of 39.90 Swiss francs, which we consider a reasonable price.

Conclusion

We’ve checked third-party websites and found no negative reviews about this robot. So if you want to start in automated trading systems with a simple robot, this can be an excellent option.

This Forex service can be found at the following web address: https://quivofx.com/expert-advisor/supertrend-ea

Categories
Forex Service Review

Stable EX EUR/USD Expert Advisor Review

Stable Ex EA is a Forex trading robot that was created in March 2020 by German developer Vitalii Zakharuk. Vitalii Zakharuk is a prolific creator of automated trading tools and has many of them available on the MQL market.

Overview

Once the Stable Ex expert system is introduced, it works with the EURUSD currency pair and only with it. This system implemented the principle of five commands – that is, a maximum of five commands can be placed in one direction, after which the total position of the series must be closed by stops, either real or virtual. The trading system is designed to work separately with a series of purchase orders and separately with a series of sales orders, which makes the trading system sufficiently versatile. The expert passes all types of tests throughout history for the specified currency pair. In addition, the expert system is tested with several delay values and operates in a fully automatic mode. No adjustments are needed, use only the default settings.

The equilibrium point concept is used for a series of orders (total position), two independent systems to buy and sell. Including a built-in scalper technique with quick sails, it works like a scalper with sharp price movements. The integrated module for processing self-tuning indicators is trained specifically for EURUSD.

To test the trading system, first set all tester parameters as shown below. The test model can be either opening prices, and checkpoints or all ticks, or using real ticks. The trial period in the EURUSD pair and the H1 time frame is not limited, and you can test in the entire history of this pair.

Primary Benefits of Stable EX:

-Maximum 5 orders in one direction.

-Optimal indicators are selected.

-Adaptive risk management system and deposit protection system.

-The stops and also the final stops I work for a common position and not for a separate order, regardless of buying and selling.

Tips for Usage:

-Advisor Settings: Use the default settings.

-Symbol: EUR/USD.

-Term: H1.

-Brokers: Any brokers, spread and commission of up to 20 pips, leverage 1: 100, to be of low latency so that the transactions are executed as quickly as possible.

-Minimum deposit: 1000 USD nominal, the closer the nominal deposit the more the withdrawal will be declared.

The main parameters of the expert system:

  • Volume – the size of the initial batch, if we work safely.
  • At-risk – used to allow automatic batch determination depending on the tank.
  • Risk Percentage – the percentage of risk, relative to which the initial deposit.
  • MM risk – money management options.
  • Stop Loss – point loss (in points).
  • Take Profit – Take Profit (in points).
  • Grid passage – minimum grid passage (in points).
  • Additional parameters of the expert system:
  • Type of filling – the type of execution of the order by balance.
  • Lot decimal – batch accuracy (rounding to how many digits).
  • Parameters of the expert system constraints:
  • Min Stops Level – mandatory minimum distance level for stops (points).
  • Max Spread – the maximum extension to which a command can be opened.
  • Commission – The committee is listed in points (points).

Service Cost

Stable Ex EA is for sale on the MQL market at a price of 99 USD, and there is no option for rental versions.

Conclusion

In short, we find a robot of which the author speaks very well of him, but gives no information about the basis of his operation. So we recommend downloading the free demo version to try to figure out how it works and whether it is cost-effective or not. It is highly recommended to use a dedicated virtual server to avoid losing transactions that the robot does, otherwise, we should have the computer turned on 24/7. Because this tool has been on the market for a concise time, there are no opinions or criticisms from users who have been able to test the product and share their experience in the MQL community.

This Forex service can be found at the following web address: https://www.mql5.com/en/market/product/47022

Categories
Forex Service Review

Stochastic Ichimoku Cloud Indicator Review

This indicator indicates the stochastic crossing in the direction of the trend that is determined by the relative price position in the characteristic Ichimoku cloud.

Overview

The main features of Stochastic Ichimoku are as follows: 

-Flexible adjustments. Signals are filtered by bullish or bassist bars (parameter “BUY – only on bullish bar; parameter SELL – only on bear bar”).

-Stochastic crossing configuration levels (parameters “BUY-signal if Stochastic under this level” and “BUY-signal if Stochastic under this level”).

-Ability to use the Ichimoku cloud for higher time frames (parameter “Time frame of Ichimoku Cloud”).

Label in the top right corner will show you the direction of the trend:

-Up arrow indicates that the price is above the Ichimoku cloud;

-Down arrow indicates that the price is below the Ichimoku cloud;

-The price is in the cloud (plane: in this circumstance, the signal will not be generated).

The signal is activated not only when the bar is closed (signal formed), but also in the current bar that is not closed yet (signal likely). It has enough time to analyze the reality of the market and allows you to take time to make a decision and calculate trading parameters.

The indicator can generate an early exit signal from trade when the stochastic lines intersect inversely (against the trend). You can activate (ON) and deactivate (OFF) this option using a button in the bottom right corner of the chart (adjustable parameter). Activate this button only if you are in the market and want to close a trade according to the inverse crossing of stochastic. You can disable this chart button if this option is not required (“ON-OFF – Reverse signal button”=false).

In general, good results are obtained with the default parameters if an Ichimoku cloud time frame is set a level higher than the current one. For example, attach the indicator to a graph with М1, and set the cloud time frame (parameter “Timeframe of Ichimoku Cloud”) to М5. If a graph has a М30 time frame, set H1 as the cloud time frame, etc.

Parameters:

  • Period K – period to calculate the Stochastic %K line.
  • D Period – average period for calculating line %D.
  • Deceleration – value of slowdown.
  • BUY – Buy signal appears if Stochastic is below this level.
  • SELL – Sell signal appears if Stochastic is above this level.
  • BUY – A bullish bar only.
  • SELL – The bearish bar only.

Conclusion

In short, we are talking about a well-known indicator (Ichimoku) that generally gives good results. If you want one of the multiple indicators of Ichimoku that exist in the market, this can be an option to consider, since its price ($30 USD) is affordable, and the indicator accumulates good comments from its users. The indicator can be found in the MQL market, and you also have a free demo version.

This Forex service can be found at the following web address: https://www.mql5.com/en/market/product/9925

Categories
Forex Service Review

Stochastic Oscillator EA Review

The Stochastic Oscillator Indicator was created in the late 1950s by Dr. George Lane. The term stochastic means the point at which a current price is related to its price range over a period of time. The stochastic oscillator shows two lines (Main and Signal Line) and its support and resistance level. This indicator is included in Metatrader 4 and 5, and the default settings are K% 5, D% 3 Slow 3.

The stochastic indicator is a great tool to identify overbought and oversold conditions over a specific period. The stochastic oscillator is the preferred indicator for many traders when the price is trading in a range because the price itself is oscillating, leading to more reliable signals from the stochastic indicator.

Overview

The stochastic oscillator is a handy indicator when it comes to evaluating the moment or the trend force. The stochastic oscillator, and oscillators in general, are presented in an easy-to-understand manner with transparent buying and selling signals. However, it is likely that excess in these signals, without a deeper understanding of stochastic oscillators, will end in many doubts and frustration for the trader.

To avoid such frustration, new traders will need to have a solid understanding of the underlying mechanics of the stochastic oscillator seen concerning current market conditions.

A stochastic oscillator EA is a timing system that automatically calculates whether the price of a security is over-bought or over-priced over a specified period of time. The EA weighs the most recent price level substantially as a percentage of the (higher, lower) range over a defined period.

The stochastic oscillator EA has two moving lines that oscillate between two horizontal lines. The black line called %K and determined by a specific formula, at the same time as another red dotted line is also a three-period moving average of the %K line..It is concluded that the price is overbought when the two moving lines break above the upper horizontal line and are exceeded when broken below the lower horizontal line.

The oversold line represents price levels that fit the top 80% of the recent price range, over a defined period. Also, the oversold line represents price levels that fall within the bottom 20% of the current price range.

Also, the stochastic EA indicator provides excellent insight when programming inputs. When both lines are above the oversupply line ‘D’ (80), and the %K line crosses below the dotted line %D, a possible short input signal is considered and vice versa when the %K line crosses above the %D line (20).

Traders should not trade blindly based solely on over-purchase/oversold conditions. Traders should understand well the operation of this indicated then to know how the dynamics of the EA is.

FORMULA FOR THE STOCHASTIC OSCILLATOR 

The following calculation is presented for a stochastic indicator of 14 periods, but ultimately can be adapted to any desired time frame.

Calculation of %K:

%K = [(C = L14) / H14 -L14)] x 100

Where:

C = last closing price

L14 = Low minimum during period

H14 = Highest during the period

Calculation of %D:

%D = simple moving average of %K (the simple moving average of 3 periods is the most common)

Conclusion

Traders should understand where the stochastic oscillator stands out and where its defects lie to get the most out of the advisor. This is an ideal EA to combine with another trend EA. Like all Eas sold by Quivofx, these have reasonable prices in addition to a free basic version. The Advanced and Pro versions are priced at 29.90 and 39.90 Swiss francs, respectively.

PROS:

Clear input/output signals

Signals appear frequently (depending on time settings selected)

If trading against the trend, prices may remain over-bought/oversold for long periods

Available in most graphics packages

Conceptually easy to understand

CONS:

May cause false signals when used incorrectly

If trading against the trend, prices may remain over-bought/oversold for long periods

This Forex service can be found at the following web address: https://quivofx.com/expert-advisor/stochastic-oscillator-ea

Categories
Forex Basics

Trader’s Guide to Proprietary Forex Firms

What’s the hottest trend in Forex today? Did you know that somebody else is willing to risk their own money instead of yours, and be paid for it? Forex prop trading – no risk of losing your own money, firms battling to give you large figures to trade, you get a nice piece of that trade, and the cherry on the top, they will always want more if you do well, a never-ending circle. Going forward know this is just an opinion and advice from certain prop traders. So, everybody is already doing it, and that means there are a lot of shady companies out there. Companies that you don’t want to do any business with. Let’s see what you need to know about prop firms, what to look for, sort of general rules for everyone.

What are proprietary trading firms? What they do is, they give you their own money to trade, and, at first, you give them payments, every month or some other kind of fees. It’s always some kind of exchange, helps them insure themselves because they are not familiar with you and they are taking the risks. Of course, you have to assess, what kind of a deal they are offering to you, does that fill your criteria. You can also bring your money to trade and earn more. There are no restrictions, this way you can snowball it up.

Which firms are worth your attention? The ones that don’t take people from the streets to do their business. They will take anybody and that’s a recipe for failure. These companies are first to filter out. Most firms will provide trade training, that correlates with their business style, but good firms will give you options on how you trade, enabling you to trade in a successful, proven way with good exit strategies. Depending on the firm, money fees are going to scale, and it is going to be upfront because firms have training fees, they take all the risk. So be prepared to invest some money first. Successes come gradually, so expect that you will not be making sustainable money for some time.

Explosive income is not real. Training is thorough, nobody’s going to give much money to novice and it’s going to take time to earn credit. And that’s the moment of showing character, going through the grinder. This is the display of trading in the long term, it will show you if you are up to it. Building a system and going again through it, repeatedly, is what trading is – it’s a long game. Today’s novice doesn’t have to have a good resume, it used to be required to show good results for at least a year of trading, to be at least remotely interesting to a firm.

Although it doesn’t hurt to have good trading results, today’s firms will not even ask for it, since many people can produce fake good resumes, you just have to be a good trader. But, if you do have the experience, all that learning and testing won’t go to waste, as firms today tend to release you into the wild, they will test you through their platform and trading. If you produce good results under pressure they will hire you for a long time. Everyone’s experience is different. These lines are just recommendations, showing you options, providing you with more chances for success.

A Few Things to consider…

Prop firms are not a new thing, they ‘we been around since circa 1970, and most of them got modernized in their way of doing business. Those that didn’t should be avoided. Most of them will have desk fees, and you should watch for your expenses on these, as they can get wild. Follow your criteria and financial capability. Be careful with your expectations, set realistic criteria, don’t let scammers take advantage of you with promises of quick and high turnarounds. Firms insisting on using their trading systems are to be avoided, as there is no perfect system and your developed systems go to waste. Also, avoid multi-level marketing structure firms. More on MLMs later.

Structure of the old prop firms formed in the ’90s is still in use today, but they were infamous for a poor working environment. Firms that still work in those conditions are easily spotted and should be avoided, although, some people may thrive in that. Besides that disadvantage, you were required to be present in the office, sacrifice comfort of life, time, even when it wasn’t needed. Simply put, nobody stays with those firms for long as conditions are horrible and it’s hard to make any money because of high desk fees. These fees as horrible as they sound they have a purpose, other than to annoy you. Desk fees allow the firm to operate normally, without affecting the prop trader’s success. Not to trade with your money – something that early prop firms did practice.

Early prop firms would account for traders’ high desk fees as profit, instead of investing in support. These fees are usually higher the more expenses the firm has, for example, a rented office. The Desk fees are usually paid monthly, enabling firms to support employees and pay bills. Most importantly, after all, negative things on desk fees, by paying them you are granted the ability to trade with that firm. Desk fees are a common business practice, and there are many variations to them, but it is best to avoid the “old” firms and those that are not disclosing the fees.

If something sounds too good to be true, it’s probably a scam. Promises of fast unrealistic gains are signs of a scam firm. Scam firms charge upfront and set you up for a test you can’t pass. Why would they do that? It’s not to see into your character, to see how you handle pressure, it’s because they are not there to make a selection, they just want your upfront money. They will promise large trading capital, just to bait you in and once they get your money you are of no interest to them, and they disappear. Those kinds of firms are all over the internet. Do your research first. Avoid firms that impose time limits for targets, another unrealistic expectation, because the market can go up and down and sometimes be completely dead, giving you no chance to make reasonable trades and therefore reach their targets. Giving you monthly targets means that such a firm simply doesn’t understand how Forex market works or they want you to miss trades.

Why? They are just after your money, luring you in with promises of large funding and insisting on high desk fees. They are Incompetent or simply scammers. In both cases, not a healthy environment. Some firms might understand that more time is needed for reaching the targets, for example, 3 or 6 months. So when you see firm with unrealistic expectations, stay away. Ask yourself, do you have a chance to prosper when you are in such a firm. The worst thing that you can do, is set yourself in a position you lose time and don’t get paid.

Firms that won’t let you trade outside their way, is an uncommon practice. Almost all these firms use the popular and ineffective indicators like the RSI (some variations of the RSI are much better and applicable for current Forex conditions), and different risk structures that you should avoid. A lot of prop firms may think they have a method that works and will force this. They teach people their way, fund themselves with your desk fees, and this way the prop firm gets a big tax write off. But in the end, that doesn’t benefit you, the trader.

MLM’s, multi-level marketing, widely known as pyramid schemes. It can be a legitimate business but mostly it’s a form of scam. It is a structure without good traders, sometimes they even don’t care about trading at all, just to grab your money. It never ends well for people at the bottom of the pyramid, while those on the top make large sums of money. There can be some exceptions when people at the bottom actually make money, and they will get praised for it, but it’s just so that scammers can show some legitimacy. MLM structure created their bad reputation, there are so many options other than MLM-s, you can choose whoever you like for trade.

All prop firms take a skim of the trade, it varies in percentage, that is how they make their money. Takes vary from firm to firm, you may expect 30-60% on initial stages, and as you get to higher tier takes will drop. There are a lot of firms with different options. Some give attractive prices, up from a few hundred dollars, with a one-time fee. Others give full experience, with direct support but will take you back for several thousand dollars US upfront. Cheaper doesn’t mean bad, they just may be more reserved to allow you to potentially earn more. They might have several divisions, for stocks, options, and Forex.

All firms that take trading seriously, will make some kind of candidate elimination process. You will be interviewed and tested several times and that will result in high-quality traders. Of all tested, maybe 5% will be funded, and they will be trained on technical analysis, strategies, etc. It will take up to 6 months before you get any funding. After about 6 months your gains should be in a range of 6-9%, anything less and you are done. Other prop firms do not have a “failure” possibility but they keep your initial deposit until you prove yourself. These numbers will make you advance to the next step.

Make preparations before you make any decisions. Calculate fees, see how it works for you. There is a bunch of prop firms out there, probably one for everybody’s taste. Make sure to avoid things like MLM-s or “old” firms. You can call yourself a professional trader when you get funded, and then understand that trading is a long game, full of emotional challenges.

Categories
Forex Signals

The Trader’s Guide to Buying Forex Signals

There are many reasons one could start looking for these, even though you are also learning or are already an experienced forex trader. You might want other income options, diversify your trades with some other trading type, have signals when you are not in your trading time, and so on. This option is more appealing to people looking for a quick fix. They have tried, they have burnt in forex trading. Now they can just skip the learning process and jump in the boat somebody else is driving. Sounds great, nothing to object with a reasonable plan for bonus income.

Unfortunately, this is a very good base for dishonest people, or scammers, to take advantage of that enthusiasm. Again, it seems that there is no easy path to get rich quick. This article will deal with possible scams you can get into if you are not informed and also give you a hint of what to expect when you find a legit service. There are many ways of how a signal service might be an actual scam, we have categorized red flags and scam patterns so you can filter those scammers out in your search.

The task of finding a legit forex signal service is difficult, especially now when the internet is flooded with dishonest ones. Approach this task with a healthy dose of skepticism, it will help you to find inconsistencies. The notion of an income generated just by copying someone else makes a very low barrier to entry, attracting all the people looking for a quick fix, people who are easer to scam. If you question everything the service is promoting, you will have an inherent edge.

Let’s start with the first warning sign. The “service” is available on channels only. Social media channels like WhatsApp, Viber, Telegram, or Instagram. If you find out they require you to pay some fees to enter the channel without any other page or reference, you can with almost complete certainty say they are a scam. This is also a warning for anyone who honestly wants to start this business, find a better way to establish a platform got your signals, smart people will not find or trust you this way. Scammers like these channels. Why not use better and probably the best places to make yourself known like YouTube, Facebook, Tweeter, and many other platforms?

Just have a small group of people following you and by the word of mouth you should snowball followers exponentially. Well, scammers will not last long here, it will be a matter of days before they are exposed and could even become an easy target for criminal prosecution. So even a dishonest business has a risk to it that needs management. Honest signal service providers will still have a reputation to preserve, even if their signals are of high quality there will be bad reviews from people that fail to follow simple instructions (there are so many you would be surprised). Well, we guess this is just the nature of this business with no barriers to entry for consumers, everyone is interested.

Scammers will not be completely anonymous of Telegram or IG, but they have enough obscurity so they can scam a substantial group of people without prying eyes of justice. Whatsmore, these groups are easy to make and the whole cycle can start over. This should not inspire you, it is also a way to make money, you will just belong to the dark side to ruin what good is left about forex trading. Search out for the website or testimonial if they exist about the group, with good results you can check.

We have noticed a lot of these “scam chat groups” are younger, rarely passed the fourth decade. Interestingly, both the victims or customers and the scammers have a similar mentality. They both seek the easy way to gather substantial income in a short time. Although scammers have a plan on how to do it and they have better success than their customers. Another interesting pattern here can be noticed, when we use common sense, would you invest or trust the quality of a signal service run by mature traders in their 40s, or 50s, or rather a young group that rarely passes 35? Common sense says to go with the more experienced ones. We are sure there are talented and devoted trading killers in their 20s, this is just an observation we made. Forex trading, at least on the professional level, requires a long hard work on testing and forging the mindset for this market.

Only repetition, learning by mistakes, and swallowing most of the “unexpected” out of forex can make you experienced enough to become a signal provider. The signal whose many accounts depend on. Responsibility only experienced mind can take with confidence. All this, of course, needs time, unlikely to be a part of someone’s life when they are just out of high school. Whatsmore, even young great forex traders are simply better when they get older, their systems are improved, they have more irreplaceable experience and of course more consistent performance. A good and different perspective for young traders comes from the positive traits of a young mind. They are really great with new technologies, they can soak new concepts which in turn make interesting automated trading software solutions. EAs will take control of their early trading psychological challenges and now we have another type of signal provider and “traders”. We can go even further and say experience plays part in the making of EAs too, let’s say a combination of an experienced trader and a youngster who is great at making EAs from expert concepts produces rare masterpieces.

With experience, you will notice marketing tricks which are common flags of a service or product without substance. Have you noticed the marketing elements for signals and other parts of the forex business? Unfortunately, these marketing elements are common. They usually involve promoting an expensive, extravagant lifestyle, featuring supercars, champagne, private jets, girls, and suits. These target men, as they are more interested in forex (more on this topic in Women in Forex). Additionally, they target men who are still affected by this marketing. Be smart to them and they will filter you out, you are more likely to be a problem than a “customer”. Aside from the internet, TVs and mass media channels are full of it. You will see a sharp increase in specialized marketeer numbers for every segment of internet published product or service platforms nowadays. The question is, do you belong to this group of people affected by this type of marketing? If you are now you know better, if not your chances of finding a legit signal provider are very good. So let’s go deeper into other warning signs.

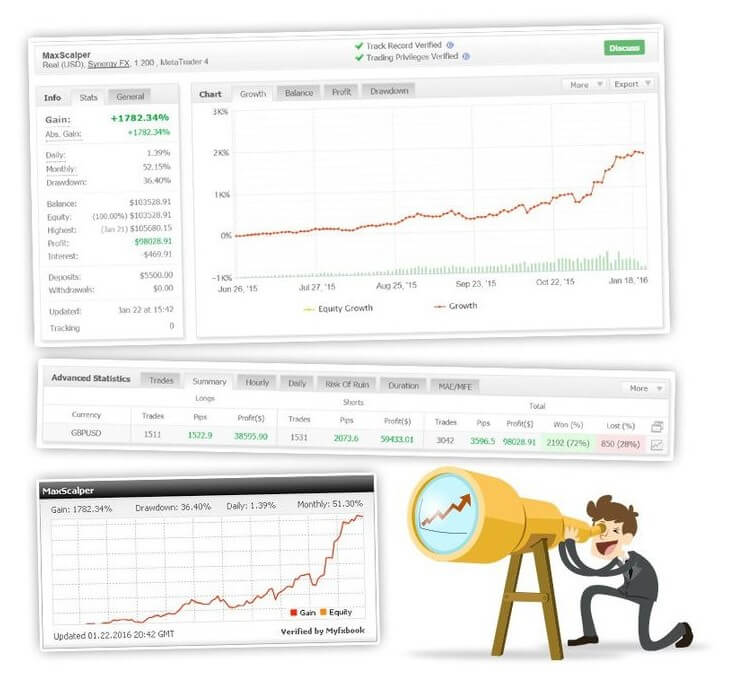
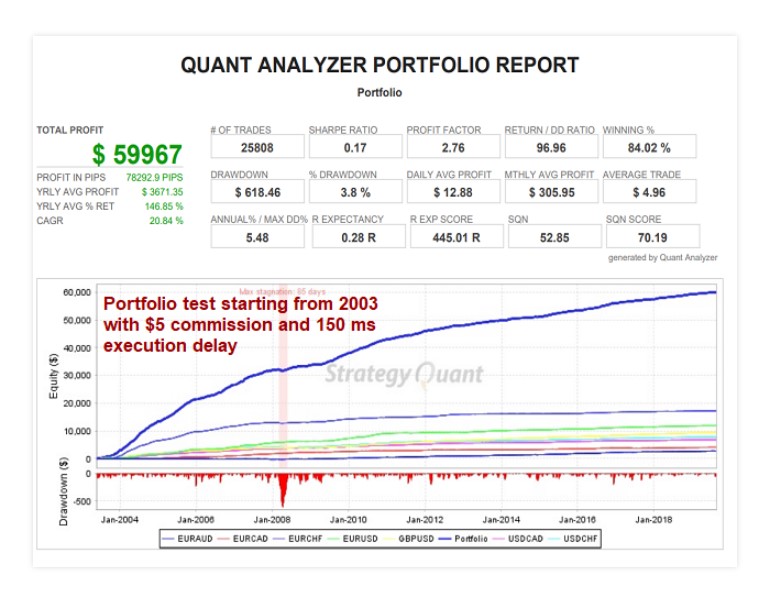
A legit signal provider will promote their results. Common sense says you want to invest into a money-making business, or at least the business with high and probable reward compared to the risk involved. Now you will want to measure the rewards to risks ratio by looking at their past performance. Do you still have that suspicious eyebrow? Good, you will need to check this performance sheet (more on this later). If they do not have one, but they have good reviews, check that too. Is the rating sample large enough to confirm the positive outlook of reviewers? Are the reviews informative and not too short?

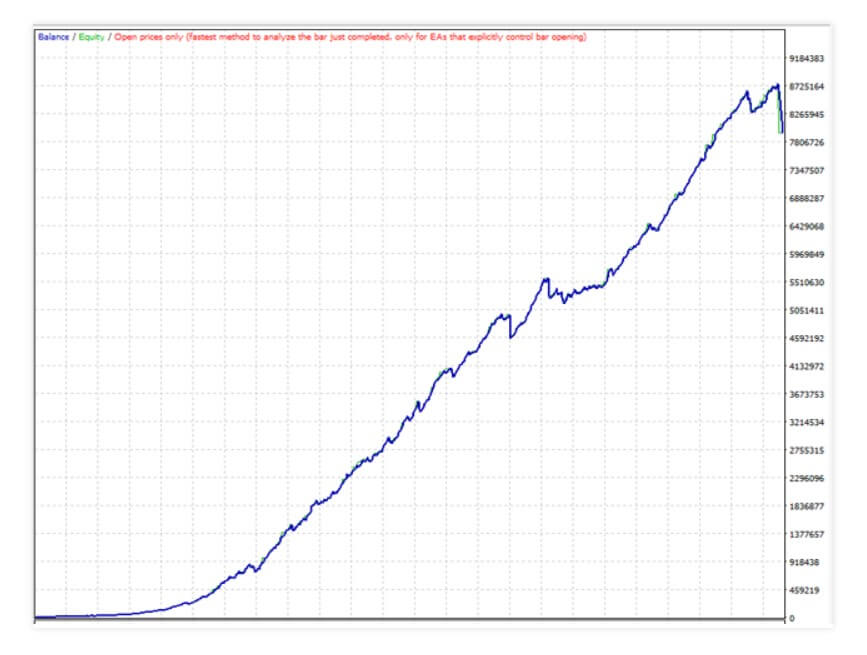
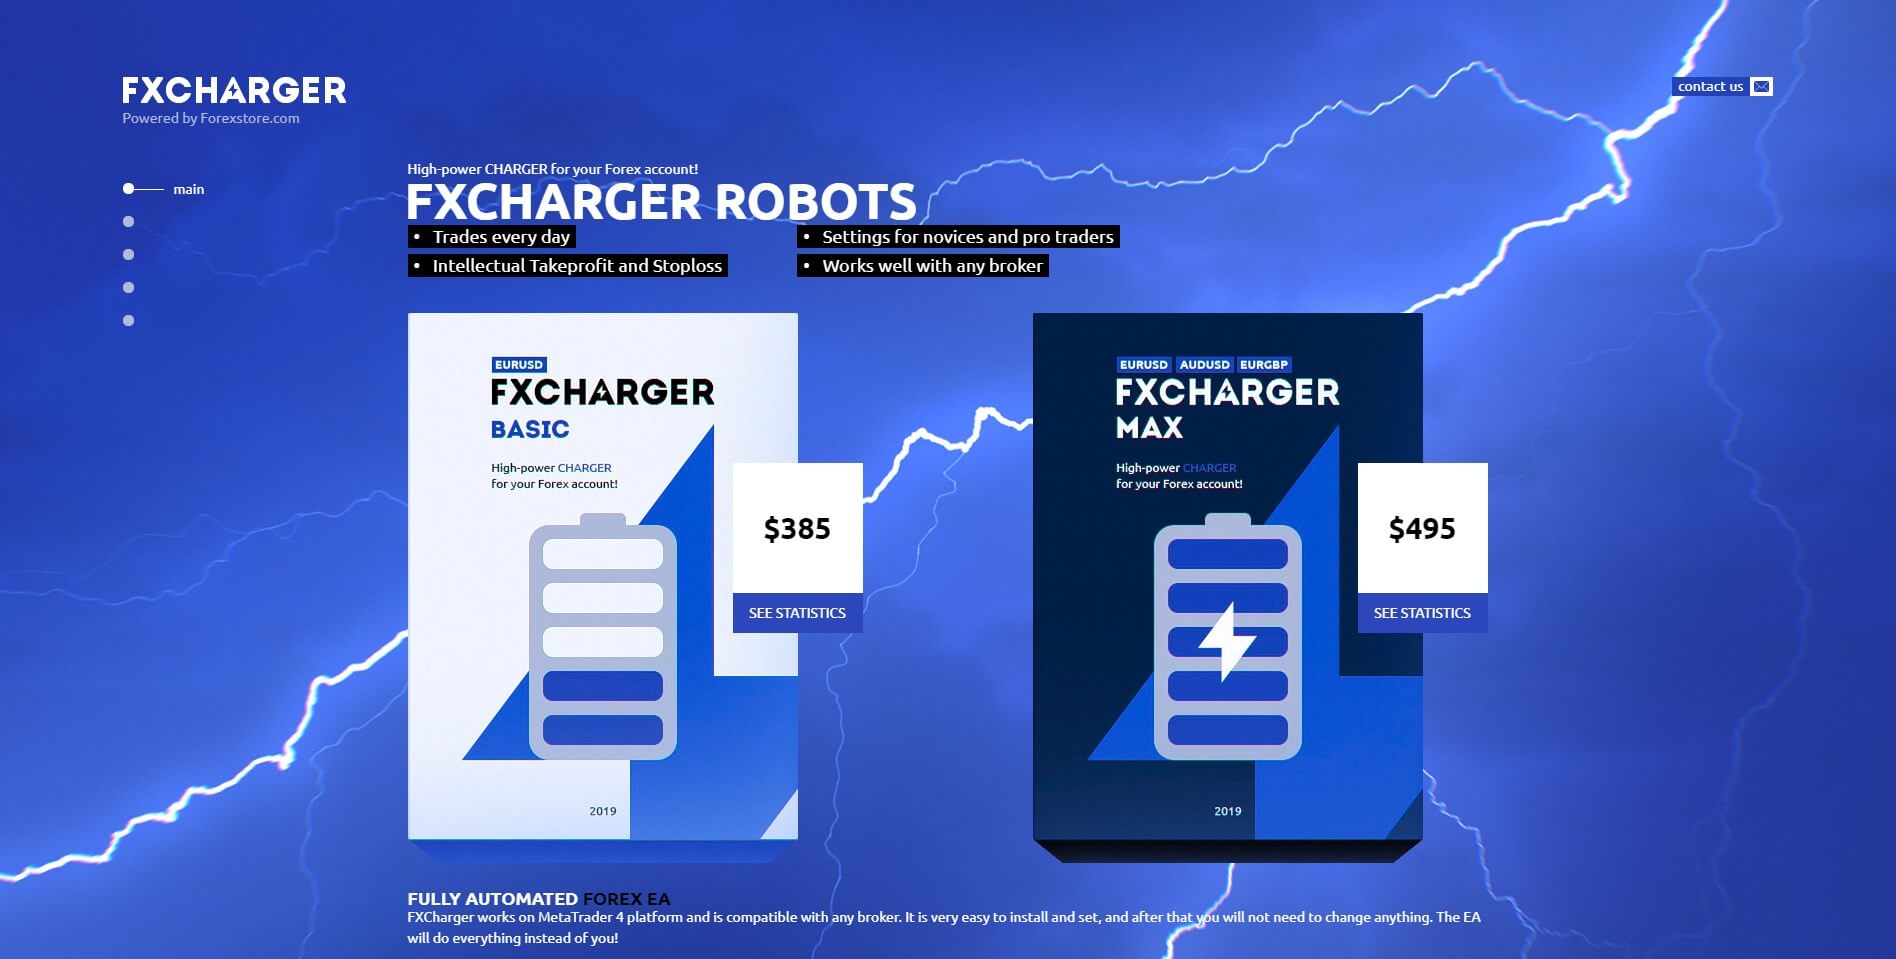
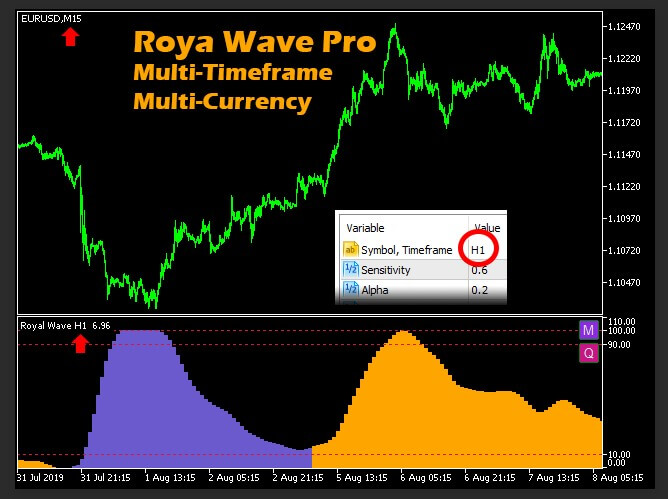
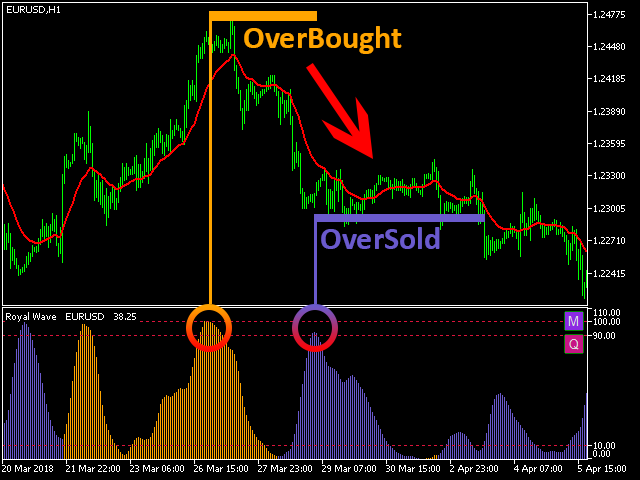
If yes, then maybe you have something worth your while, still, your work is not over, most of the websites without the performance track record are a well-obscured scam. These scams are even reputable, a massive amount of marketing campaigns are funded to keep the bad covered and the “good” pushed to your face. The accessibility of the internet makes this easy, making your work to find the truth harder. Summing the elements, the websites would contain a very well and flashy presentation. Optimistic, inexperienced visitors will feel like these “pros” know what they are doing, just look at these charts, animations, pretty customer support girls, and percentages! “With this percentage gains, I could buy…soon!”. This should not be your thinking.

The group has extensive experience within financial institutions and financial investing ventures. Well, does this mean they are great trading forex? The short answer is no. The long answer will tell you why it is probably a “legit scam”. This experienced group has left corporate life so they can maintain their signals service, it is a better business option to them isn’t it? Okay, what about the fact financial institutions can generate mediocre results at best for you. They are not something a professional trader would aim for. To uncover it all in a funny way take a look at the book by Fred Schwed “Where Are the Customers’ Yachts?: or A Good Hard Look at Wall Street”. Put simply, they have experience making money from you more than for you.

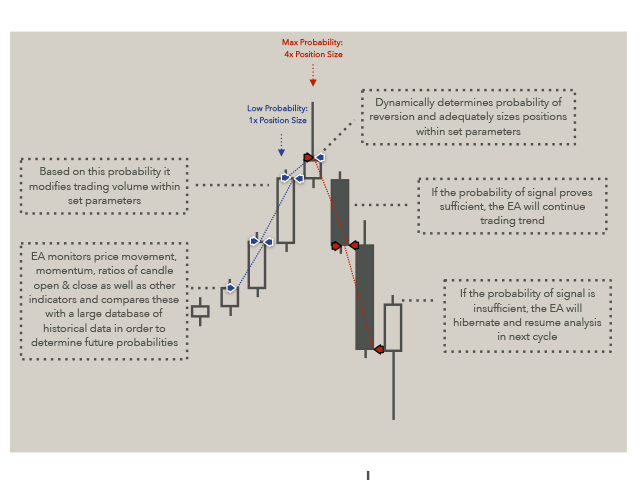
Financial flashy words are making them educated, geeky, impressive, dedicated performers. Most websites may choose to go with this language or a simple approach in line with your age. Complex technical expressions will make you believe they know what they are doing for sure, a good place to invest. Well, it is another method of how to make you trust them. If you go a bit deeper, you will find no arguments their AI or algorithms are as good as they are promoted. Pay attention if the phrases tell you anything you can check, refer to, or measure. If not, this is a red flag sign to move on.

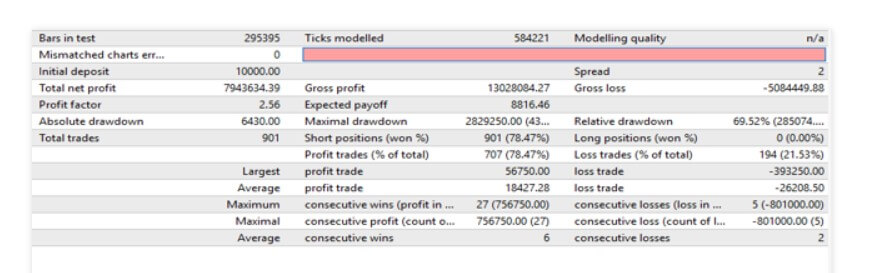
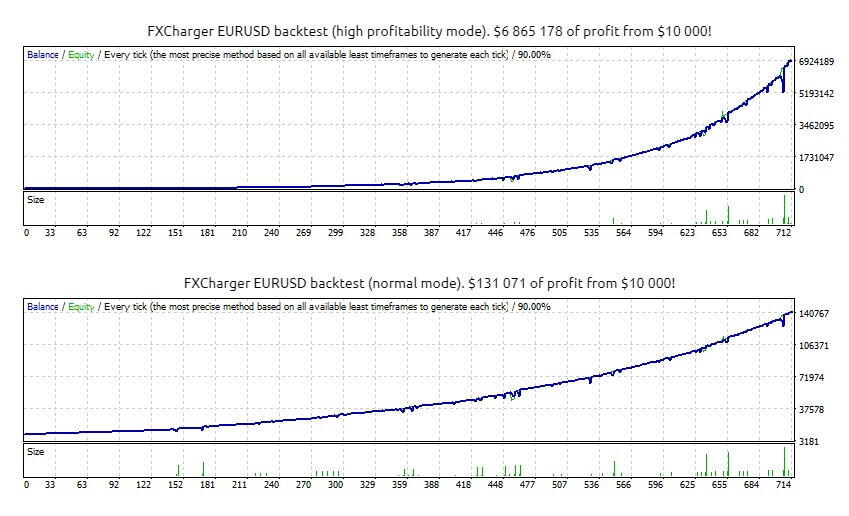
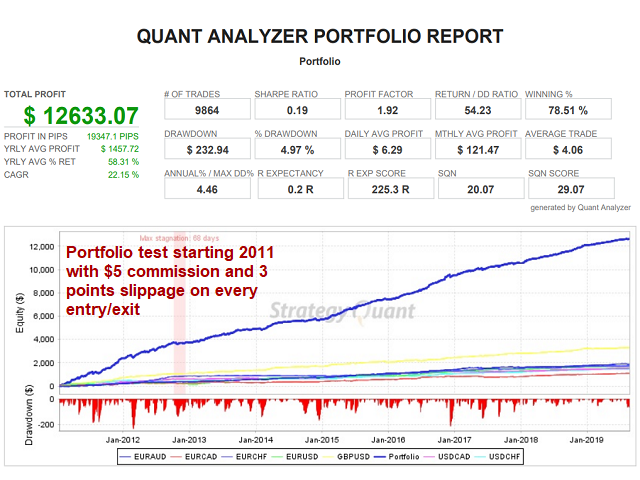
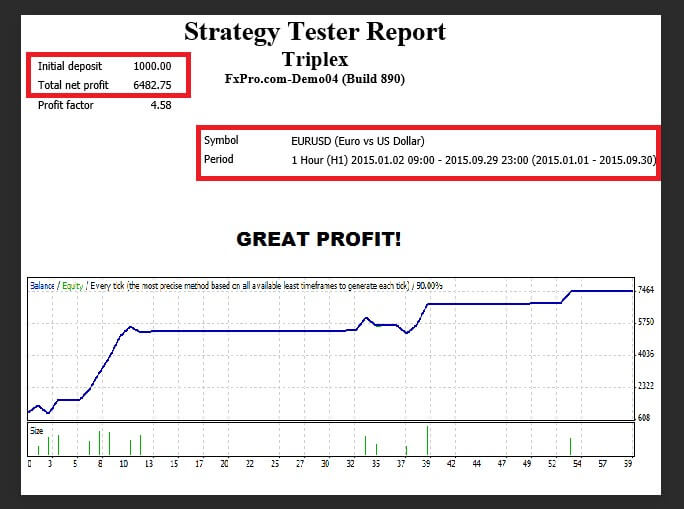
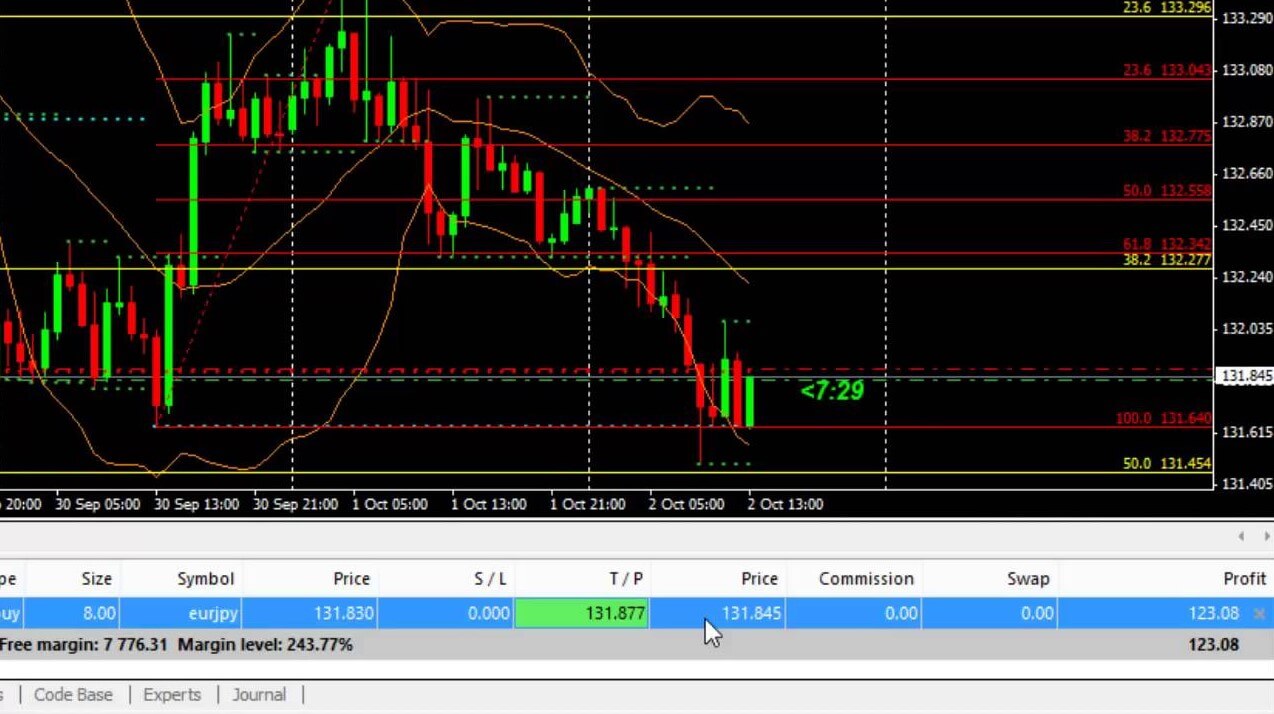
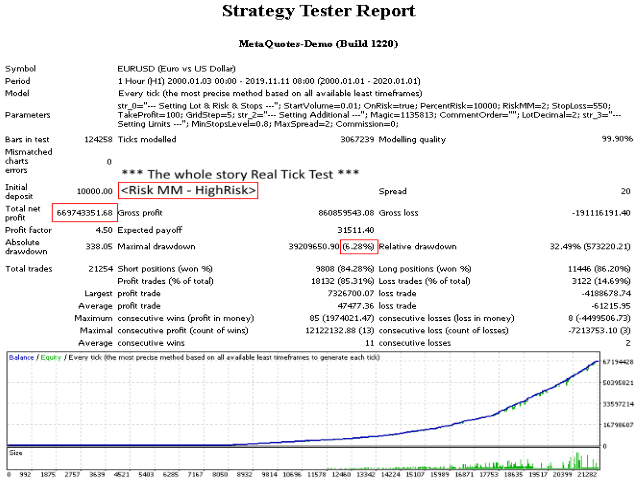
Back to the results sheet you need to check. Now, you may see some gain numbers on the page. How easy is to put some number in there? Takes you a second, is it backed up? Go on and inquire about how they attained this number by showing you their trades journal. Is this table legit and matches the data in your MT4 or other platforms? More often than not the table will be completely made up if you are even given one. After reading this it is not likely to be fooled, but know that even true results may not be completely what you want. Here is an example, the signal group could tell you they made an exaggerated figure gain, like 3000 pips per month. This could be true, or better said half true. The 3000 pip gain part is true but the other part about the 3500 pips lost is not mentioned. This is a nice example of wordplay and statistics multi presentation or interpretation.

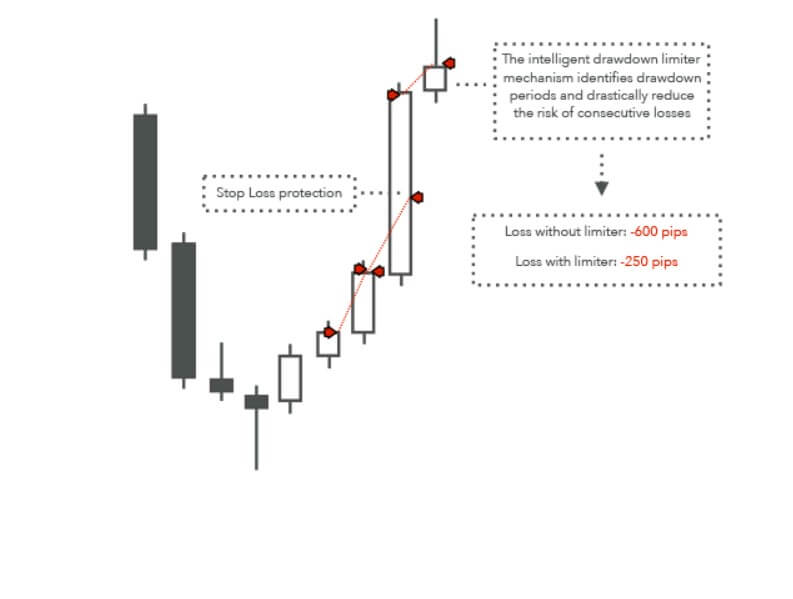
Nobody told you a lie, you just did not ask, you have assumed the losing in the equation. On top, you do not have arguments to accuse them of lying. Stating the more than 80% win rate is also a sign of this, some of the losing trades are omitted even when every trade matches. Similar is when we look at some EAs for sale, you will see extreme win ratios above 90% but you realize they are made on a very high number of short trades, and those 10% losing trades negated all the gains or worse. Inquire about the net results.

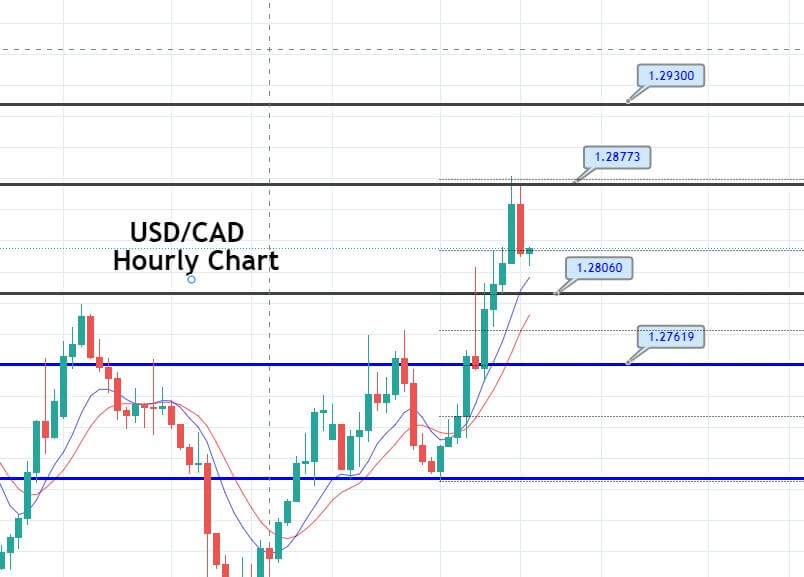
Speaking of net results, there is another interesting way to show great, truthful but deceiving performance. You may see a very high pip gain, for example, 3000 pips per month, including the losses. This is impressive, right? If you have assumed all is made on spot forex, you are deceived. Making 2000 pips on index trading is not great and an average trader can do it consistently. Some assets like Indexes, crypto, or precious metals move at extreme ranges when compared to spot forex. Therefore, pip gains from these assets carry different weights. If the result is all made from forex, know there is even more reason to be skeptical. An additional step to check is the period covered for this performance. Is it just a result of one month while all others do not even come close? Are the trades positions extremely big or only on exotic currencies?

One of the hardest to crack schemes is the dual lines approach and averaging packages. The Dual Lines method applies to many scam services, but let’s focus on results presentation. Scammers open two demo accounts or more. On one they pick a very volatile pair, probably an exotic and go long. The other account has a short position. Now all they have to do is wait, after some time they will have one loser and one winner. If they have more accounts, half will probably be very nice performers. Losing accounts are closed, winning ones are promoted to you or anyone willing to go with their signal service.

The Dual Line can even go trade by trade with their customers. They will tell you to go short and tell some other guy to go long. At the end of a few cycles, they will have one who is absolutely trusting their “service”. If they are using the channels mentioned above, they are still under the radar. Whatsmore, they can close the channel and start a new with a winning account they made in the previous venture. Nothing shady with the results right? Sports betting applies the science of averaging, bringing you various packages that perform but in reality, they are a “truthful half”. Everything is legit here, no lies. Is it ethical? Another debate.

The results are outdated. Many will miss this red flag, even it is obvious. You may see EAs performance spooling gains until 2019, for example. No strong trends in the forex market and the account is shut down after a few losing streaks, but the overall performance is legit and good looking. Well, the website promoting this EA or signal service is still online, surprisingly. Guess what, they will still sell you the signal, like usual. Many do not pay attention to this and it is spreading the scam industry to the point forex becomes regarded as a scam at first thought.

After all of these flags, you may still think a signal service is worth the trouble. Here is what you need to consider, besides looking for the mentioned signs. Every signal service you have paid needs to be tried on a demo account. Assumed that the price of signing up for a service is more than coverable by the gains you will potentially have, you need to be sure the results from this forward testing matches. Since you are going to follow them for a long time, 2 months of demo testing will save you the trouble of risking real money. Note that you will need to have an optimal account size for this service to be profitable in the long run. Besides, you should consider investing only money you can afford to spend and not care about it, like the account is already gone.

Legit signal providers are rare, but it is even more rare to find the service in line with your lifestyle. The signals you are about to get could be at times you are sleeping, at work, or simply not convenient for you. Another reason to demo trade, but know that you are not a master of your account (time) and bound to signals pace.

Categories
Forex Service Review

TPA True Price Action MT4 Indicator Review

This indicator coded for the MetaTrader 4 and 5 platform belongs to the paid category and has a specific way of giving signals and trading use. The first version is published on the 3rd of July 2019, it is not a very old indicator but has received some attention. The developer is Janusz Trojca from Poland now under the team name of InvestSoft. This team has a total of 10 products with good ratings, some of them complement the TPA indicator for a complete trading system. As the name describes the indicator is based on the Price Action strategies known for the use of support and resistance lines. The authors developed a blog website investsoft.eu/ with several articles about the TPA indicator and how to use it in conjunction with others.

Overview

The page presenting the indicator on the MQL5 may look too complicated and probably will turn away customers looking for a simpler solution or just do not want to invest time learning how to interpret the signals given by the TPA indicator. The developer first wants to point out that TPA is not repainting and gives signals once the candle is closed. It can be used as the confirmation indicator but also as an exit. There are multiple ways a trader can use the signals. TPA is versatile when it comes to where it is used and on what timeframe. This means it is universal.

TPA is presented as a tool that is not the mainstream, thus avoiding the common techniques used unsuccessfully by the 90% of traders. These are characterized as misleading, most of the traders do not make a significant success if any, just because they are using the tools market makers know about and predict. However, the page does not say anything about the indicator’s exact strategy and formulas. The latest update is version 2.1 from November 2019 giving the indicator a cleaner code, the TAP line, and performance optimizations.

TPA indicator developers made a Telegram group chat for owners of the indicator where trading and other support are delivered to those that need it. Since the indicator is intended for those that know a bit about trading or for those that are willing to learn, it has the guide that is not short and could be harder to follow for some users. The demo is available and mentioned that even it could be tested in the Strategy Tester module of the MT4, the results do not count for the other factors traders implement when trading. Therefore, it is not just a plain signal following, the results in the simulation may not be valid.

In the blog article manual for the TPA indicator, we can see the scope of usage. It is essentially a trend following strategy using higher timeframe filters, price levels, risk management, and other measures outside the indicator function. The TAP line is added as the filter to counter small corrections that do not change the bigger underlying trend, it is a noise that should be filtered. The main idea is to follow the market makers and big trends they produce. 10 questions are designed for you to follow the logic of trading and using the TPA indicator.

According to them, the TPA line slope determines if the market is ranging and if there is a trend to follow. The higher timeframe is also important to analyze. Other steps are required too and involve subjective analysis of other signals, such as Fibonacci levels. The manual is also written in a hard to read English and not everyone can understand what is required. Therefore, this indicator is not for beginners. Many will be in doubt with the subjective interpretation of inconclusive TPA signals. There are some pictures as examples to see how the TPA line on 50 period acts as a rebound level, considered to be used by many market makers.

Service Cost

The indicator price is $198 for 5 activations or to rent for one month for $40. The developer states that the demo may not show the valid results in the Tester module but it does not mean trader cannot use and try the Demo without the Strategy Tester.

Conclusion

As the indicator is not explained very well and it requires some trading knowledge, it does not receive the popularity as some other indicators. The higher price is also a barrier for more indicator users. For those that understand and have used for this one after the demo trial, it is not a high price to pay. As for the rating, the TPA indicator has 4.5 stars out of 38 reviews. The review sample is high enough to have a representative image of user satisfaction. We have found only 2 users with a 1-star rating but did not disclose why the TPA is bad. The rest of user reviews that are not perfect state that TPA does not show the exit points. In our opinion, TPA has potential but requires a good amount of forward-testing and your own set of rules on how to interpret the signals. The support Telegram channel is a very good starting point if you decide to use this one, just do not expect to understand it very quickly if you are new to the scene.

This Forex service can be found at the following web address: https://www.mql5.com/en/market/product/39932

Categories
Forex Service Review

Scalping Max EA Review

Scalper Max is an Expert Advisor for the MetaTrader 4 platform designed to conduct scalping trading on major currency pairs. As per the developer’s words, it is not limited to one scalping method but more of them. It is fully automated and incorporates AI that has been updated. The latest version is 2.0 from 17th September 2019. The initial version is just 3 days older meaning the EA has not received updates except one. The developer of Scalper Max EA is Xuan Nguyen Thanh from Vietnam.

Overview

Scalper Max does not have a great introduction story, the MQL5 page describing this EA does not have a lot of content, especially not for the price. The intro states an AI that can learn and adapt to market conditions consisting of many algorithms. It can be used on many broker accounts with the commission or no commission and higher spreads. As usual, since scalper EAs require very good execution times and no slippage, the setup has to be with brokers able to deliver great conditions. Scalper Max does not use discouraged methods such as Martingale, Arbitrage, or Grid. Trades have to Take Profit and Stop Loss levels set and optimized by the EA.

It is not disclosed how the EA works and what the AI is exactly doing when calculating these levels. It is recommended to use the EA on GBP/USD, GBP/JPY, GBP/AUD, EUR/JPY, EUR/USD, USDJPY, USD/CHF, EUR/CHF, EUR/AUD, and NZD/USD on M1, M5 and M15 timeframes. There are two default optimized settings the developer has published in the comments section. They are optimized for commission or no-commission accounts. Brokers tested are Tickmill, ICMarkets, and NordFx.

Settings for Scalper Max are simple and in our opinion does not feature a lot. What you can change is set the Autolot management – risk-based trade size allocation set the minimum allowed spreads or slippage, maximum lot size per trade, and some cosmetic and appearance customization. Relative to the price of this EA, these features are not attractive. You cannot have a glimpse of what indicators are used, what logic, or what scalping method based on these settings.

The performance charts of Scalper Max are impressive, although we are used to seeing extreme results. Now the author did not use a real account for chart presentations, but on the Tickmill demo account. Based on the image, the EA produced a nice, steady-growing chart with a 483% gain. By looking at the winning percentage, it Is very close to coinflipping, 51% of trades won. The logical conclusion would be that this EA is great with Money Management but we do not know how the EA trades. The maximum drawdown is 8.1%.

On the MT4 Strategy Tester module, the EA showed different results. GBP/JPY pair was used and the winning percentage is 63.95%, much better than 51%. Maximal drawdown is an impressive 1.63%. Profit trades are at least double the size of losing trades meaning the EA cuts short trades that do not come in the right direction, not using the extreme Stop Loss levels as with some EAs and therefore also limiting the drawdown to just 1.63%. GBP/USD pair backtesting on M5 using the 99% precision modeling also shows similar results.

The maximal drawdown is even lower, 1.17%, 63% of winning trades, and the same good Money Management. Interestingly, GBP/AUD testing on M% timeframe shows just 51% winning trades but with similar gains as other pairs. The average consecutive wins number is the same as the average losses – 2. On the EUR/JPY, the success rate rises to 68.09% and this does not change the fact Scalper Max has a very good Money Management and manages to show only charts with consistent gains and no drops.

Service Cost

Now, the price of the Scalper Max is no less than $2500 to buy (6 activations) and $1800 to rent for a year. This extreme price has no presented arguments of the tech incorporated in this EA and no proven work behind it. The charts and what little content about the EA are showing are simply not enough. One could think this EA is fake but a demo is available so you can test it in various ways. Of course, price this high reflects on the EA popularity.

Conclusion

Scalper Max received bad ratings, based on 7 user reviews on the MQL5 Experts repository. The users complain about very different results than what is presented on the developer signal page and in the EA Overview. The main concern is the poor performance, some have changed brokers and tried different things just to see the same bad results. Some of the reviews are:

“Refund, this is a liar, this EA will not make you profit, only loss, he has no signal of real account number, every time you ask him, he will only hide”, or “For the month of using the adviser – only loss, wasted money, Alpari broker account ECN.Pro. I would like to return the money …”

There are also two perfect score reviews claiming good results.

In our opinion, this Scalper Max can be tested to confirm these results. Still, it should be noted that you could probably buy 10 automated software products for the price of this one, that has better ratings, testing, and performance. Given the fact that the developer also has one other product selling for $30,000, we can confirm this is not a serious proposition.

Categories
Forex Service Review

PipTick VWAP MT4 Indicator Review

PipTick VWAP for the MT4 platform is a special form of the Volume-Weighted Average Price indicator. One of the most used Moving Averages apart from the EMA or Exponential Moving Average is VWAP for its adaptability to recent market changes. Michael Jurnik from the Czech Republic is the developer of this tool, partner at PipTick. They have published 59 products, many of them not having much popularity or ratings.

Overview

The initial version of PipTick VWAP MT4 was released on 25th February 2015. It is an old indicator that has received just one review for that time. The latest update was on the 12th of May 2016 to version 1.3 where calculation accuracy has been improved and added some parameters for visuals. This indicator is also available for the MetaTrader 5 platform, both are in the paid category on the MQL5 market.

There are many ways you can use the VWAP and is a part of many trends following systems when combined with other tools. The specifics of this version is that it works in five modes. Moving mode sets the indicator to calculate as the Moving Average, while in Daily mode the VWAP is calculated from day start to the end, thus giving the traders daily range often used in trading. Weekly and Monthly do this for the selected periods and Session Time gives the ability to set a custom period for this calculation.

VWAP will be displayed as a band on the chart and thus it could be used as Bollinger Bands for reversals. Still, the best way to use the tool is for trend following and setting the Risk Management levels such as Take Profit and Stop Loss. There are 3 bands, each of them represents Standard Deviation on different sensitivity. If you combine other Moving Averages you may have a great trade exit system where the cross with the deviation line will signal precise trend exhaustion. The author suggests using the indicator with Price Action or Candle patterns.

The main features of PipTick VWAP are several calculation modes, first, second, and third standard deviation levels, customizable visuals, EA friendly, and is described as fast and reliable. There is also a demo video showing the indicator in action although not much can be concluded from it, it will just plug the lines and the channel and the rest can be used and combined in so many ways.

The settings panel will give you the ability to adjust the input and output parameters. Input parameters are Volume Method (to use real or tick Volume), VWAP mode, MA Period, colors for the lines, and visibility of all the lines for deviations, etc. Output parameters allow you to set the VWAP value, and bottom and top values for the first, second, and third standard deviations. These settings give enough freedom to test and adapt the indicator to the trader’s system and also opens the creativity.

Service Cost

The price of PipTick VWAP is $57 to buy and have 50 activations. Renting starts at $17 for one month and $37 for 3 months. A demo is available and it has been downloaded 959 times at the moment of this review. This shows some popularity but as the reviews and comments go, it Is very low.

Conclusion

PipTick VWAP for MT4 has received only one rating and it is not positive:

“This project seems to be stoped. It hasn’t been updated since 2016 and the developer doesn’t answer questions since 2018.”

The indicator consumes a large amount of CPU if the [Max bars in the chart] in the Options menu has a large value. I’ve proposed a simple solution, but it doesn’t respond, so I can’t use it and I’ve had to uninstall it.” Based on the comments section we have noted the developer did not notice user complains but plans to update the performance issues in version 1.4 soon. In our opinion, the price tag for this simple indicator is too high, not much is done here and this kind of indicator could be found on the internet for free, probably even on the MQL5 marketplace.

This Forex service can be found at the following web address: https://www.mql5.com/en/market/product/8187

Categories
Forex Service Review

MA Multi Moving Average Standard Indicator Review

MA Multi stands for Moving Average Multi Timeframe indicator that is useful in many ways and for many strategies. The developer of this indicator is Dmitriy Susloparov from Russia having 16 products offered on the MQL5 marketplace. None of them have received much attention and only MA Multi and one more indicator have ratings. Most of the indicators published are similar, they are basic indicators made multi-timeframe on a single chart. MA Multi also exists for the MetaTrader 5 platform. The first appearance on the MQL5 market is on the 3rd of May 2017 and updated on 31st, a few days later on request by one user. The developer responded quickly and made the additional option to turn off redrawing on closing each candle, updating the indicator to version 1.1.

Overview

MA Multi will work with any combination of timeframes on a chart, thus plotting several lines for each timeframe you turn on. As the Moving average has a multitude of uses, having a combination of default MT4 indicators, and this one can result in having a completely new indicator generating unique signals. It can even mean a whole new trading system. As you add channels, ATR, and other indicators on the same chart, technical analysis, and interpretation open a plethora of possible signals. Therefore, this indicator does a simple job, this is basic coding, and that are many free versions of such indicators, but, having this one customized to your liking is a nice gesture. MA Multi will be displayed as a Step MA for higher timeframes as this is how it looks like when you switch. Each line has its color, width, or whatever visuals you like.

In the settings you can set the Period, Method for calculation of the MA, the new Redraw option, and a list of timeframes to show or disable on the chart. The developer has uploaded a video showing a practical example of how the indicator can be used in trend following strategies, still, as we have mentioned, the possibilities on how you can use this are endless. The video is in Russian but it is not necessary to understand the use of multi-timeframe MA.

Service Cost

The price of this simple indicator is $10 to buy and having 5 activations. There is no possibility to rent this one but a demo is offered.

Conclusion

The developer is very open to additional updates. It seems, so if you have a special request to adapt the tool, you can send a message in the Comments section. Unfortunately, the price of $10 is low, but the indicator is very popular and has wide availability on the internet and forums for free, from other coders. It that sense, purchasing this one may be a good idea if you plan to ask the developer about updating with your needed features.

This Forex service can be found at the following web address: https://www.mql5.com/en/market/product/22642

Categories
Forex Service Review

Infinity TrendLine Indicator Review

Infinity Trendline is a trend following indicator with integrated solutions for Taking Profit and Stop Loss management. It is developed for the MetaTrader 4 and 5. It was a top free indicator once it showed up in November 2018 on the MQL5 market and since it has received many updates. New things are mostly about adding features and updating the code, enriching the indicator with new goodies. The latest update sets the version to 52.0 and is updated recently, in March 2020. Evgenii Aksenov is the author of this popular indicator/ trading system consisting of few indicators. Main takeaways are the easy-to-use trading signal system, good support, and the fact this is a free indicator that is usable even though the PRO version has more features.

Overview

Infinity TrendLine mainline may look like a kind of Step Moving Average. The author is not very clear on the inner workings on this main trend confirmation indicator but based on the settings we believe it is the ATR or Average True Range, a classic one for measuring volatility. In the Overview page, this is just explained by analysis of the average range of bulls and bears. The indicator will show you a trend signal with an arrow and it will automatically calculate 3 Take Profit levels and a Stop Loss. There is a panel on the side that shows you the probability of the price reaching the first, second, and third Take Profit. Based on this you can trade signals with the highest probability. Note that the free version will not give you the Take Profit 2 and 3, the result based on historic trades will not be shown, and many of the customization options are turned off.

Consequently, the free version feels like a marketing tool, and judging by the Overview page full of marketing cannons, the developers are heavily oriented to sales. This is not always a bad sign, the free version still has some usability. You will have a quick symbol selection pane once you click the “Free” button with the timeframes and the success percentages on each, giving you the ability to scan for the best opportunities. This rounds up on how to use the indicator, each signal optionally has a higher timeframe filter for better noise signals reduction.

These functions are available in this free version. Unfortunately, a good portion is left out, such as calculation type option, amplitude settings, Take Profit and Stop Loss settings, and adding custom symbols for the probabilities scanner. In the early days, the indicator had Amplitude, Period, and other settings for the Zig Zag indicator were available, but it seems the free version is updated in favor of the PRO, therefore becoming the sales channel. Even the screenshots on the Overview page are using the PRO version, and the feature list presents only what is in the PRO. Furthermore, if you buy the PRO version you are offered with other accompanying indicators from this developer for free, such as the HTF_Histogram indicator which seems to be necessary to determine the Higher Time Frame trend. More bundling sales techniques are evident. The developer will offer another indicator for free with the purchase of two of their products.

Conclusion

Infinity TrendLine with all these feature downgradings after each update still is useful as a trend baseline. Take Profit and Stop Loss levels can be used to a limited degree, but the true value of this line may be in its step-like plotting and a precise price crossing once the major trend is changing or losing momentum. As for the ratings, this one received 4.8 stars based on 60 reviews. 435 comments are signaling this indicator is still popular, giving traders a solid solution for trend trading. Although, most of the experienced traders will avoid such products providing automatic Take Profit or Stop Loss levels and the probabilities. These features are not transparent enough for them. Infinity TrendLine, even the PRO version is more for those that do not know to manage these key Risk Management levels and want a ready-made solution. As with all “All in One” products, they excel at nothing and are mediocre in everything. A notable hard to find average review is from Simone Gargano stating:

“The indicator is good, very easy to use and clear BUT as you may know before considering an indicator as good you would have tested it at least 6 months. I’ve loaded this indicator to my Koder Killer EA (used to test the indicators) and is not showing good results over the last 4 months like the indicator’s success rate shows (65%+ on average). I rate it 3 stars for this reason at the moment.”

All other positive reviews are a reason enough to test this indicator and if you need more options, consider the paid PRO version.

This Forex service can be found at the following web address: https://www.mql5.com/en/market/product/33083

Categories
Forex Service Review

Hamster Scalping Automated Expert Advisor Review

20This is a MetaTrader 4 Expert Advisor that uses the popular “hamster” name commonly attributed to scapers working during night sessions or in very low volatility periods. The latest version is Version 9.0 updated on 9th June 2019, the first version was published in late 2017. Also, there is the MT5 version. Since then the EA received a few upgrades including the ATR filtering. The Author is a Russian named Ramil Minniakhmetov, he is the developer of 22 other products and 2 signals such as Rebate Robot, Brazil System, EA Black Star, or “TheFirst” signal service. Most of his work has above 4-star reviews on the MQL5 repository. His website is www.orangeforex.ru.

Overview

Hamster Scalping EA is fully automated and does not use the martingale strategy. Martingale is a known method of investment for many years and is allowed in casinos and other gambling institutions since it always ends with a loss. This type of EAs which use night time scalping is probably the most dominant on the market. Hamster Scalping is using two indicators, the RSI and the ATR. RSI is used to provide a signal on the 5M timeframe to which the EA is designed to and on the EUR/USD currency pair GMT+2. ATR is used to filter the signal if the volatility is too high. Since this kind of scalping is very sensitive and any bigger movements can throw off the indicators, ATR is one of the better indicators used for this purpose.

The development of this EA took almost 4 years, much longer than the typical night scalper. Hamster Scalping’s performance is variable but according to the author’s readings, it is highly profitable but with a high drawdown of more than 50%. This is typical for EAs that allow relatively high Stop Loss tolerance to close the trade in small profit after a rebound if it happens at all. It is not unusual to see two Stop Loss triggers to counter several weeks of profit trades.

General recommendations are $100 minimum deposit with an ECN broker with fast execution times and low spreads, up to 5 points. If you are using VPS, the latency must not be higher than 3ms. Brokers with 4 or 5 digit price quoting will work, settings value entry should be in points regardless. The EA allows for enough customization although tempering even in small amounts may result in a very different performance.

Hamster Scalping allows changing the periods for both ATR and RSI, signal levels, Autolot size calculation, Take Profit and Stop Loss levels, Virtual Stop Loss or Take Profit (it is not relayed to the broker server, it is internally set instead thus invisible for the broker), and almost every function of the EA is configurable. The EA also features the newsreader, that can be adjusted to filter trading for high, mid, and even low impact news. The news feed comes from the ec.forexprostools.com, so it is not the most popular news feed media. Some additional tweaking is required to set this in the EA settings. You can set to avoid Wednesday triple swaps, although some brokers have this on Fridays.

Hamster Scalping is a relatively simple EA with a good amount of testing behind it and is not abandoned by the devs in favor of new products. Most of the developers and companies decide to focus efforts on more complex EA after initial success and often leave some good EAs outdated and unreliable to new market conditions. It is a good sign to see this simple EA recently updated.

Service Cost

Hamster Scalping price is $99 to buy and $45 per month if you rent it. For this, you will have 5 activations. The demo is available. This price is not high but compared to other night time scalpers it is in the mid-range. Still, since it has a good amount of testing and is being updated, it is well worth the money, especially if the demo works for you.

Conclusion

The attention this EA has received is high. There are over 20,000 comments on it and over 500 user reviews. On average the score is 4.4 at the moment of this review which is very good, there is a good number of reviews so the rating is based on a large sample, confirming a solid user satisfaction. Although, on the side, some of the reviews could be based on short term EA usage, where bad trades did not yet happen. Some of the notable negative reviews are mentioning the high Stop Loss tolerance, for example:

“Too risky!! BIG STOP LOSS…small profits..no loss position management…It’s a lottery!”

Or a 4-star review from Dhruv Patel:

“A lot of people with 1 star review are correct with their experiences with this EA. However, this EA has a lot of potential. I have made modifications to the set and put external measures in place to avoid those disastrous trades that gave this EA 1 star and backtested for 9 years. It works like a charm! Money management is crucial with this EA. This EA does not manage the big losses well, thus human intervention is required.”

Our recommendation is to try the default settings on the demo account, both backtest and forward test. The price of $99 is probably low enough for this EA to repay itself a few times over.

This Forex service can be found at the following web address: https://www.mql5.com/en/market/product/25853

Categories
Forex Service Review

FXCharger Trading Robot Review

FXCharger is an Expert Advisor (EA) for the MetaTrader 4 platform. It is on the scene since 2016 and is updated in 2019 to look more professionally. According to external sources, the company behind FXCharger also has other domains and products such as FXMower.com, ForexBringer.com, ForexSeven.com, and so on. Some of these brands are out of business. FXChrger has performance charts uploaded on myfxbook.com and some of them are verified. Note that this EA still does not have wide popularity and according to the charts has good performance.

Overview

FXCharger is a martingale EA at its base but includes adaptive Stop Loss and Take Profit levels according to market conditions. We believe this is based on volatility but it could be some other indicator values. There are two versions, FXCharger Basic and FXCharger Max. They are essentially the same EAs except the Max version is also applicable for the AUD/USD and EUR/GBP currency pairs, not only for the EUR/USD as the Basic version.

According to the developer, the EA is designed to have frequent trades, trades every day. This means the EA is also for the less patient, young traders that like to see results right away. The EA does not hold positions for long, it should end a trade in 1 to 4 days max. The EA setting allows the user to ser the maximum possible risk amount so every position has its limit to how much drawdown per position EA can tolerate. This function is more or less common with many EAs, although, for promotional reasons, the devs decided to state it as a special feature. Even if the EA is not connected to the market anymore for any reason, the Stop loss should be executed. This means the Stop Loss or Take Profit is set onto the broker server thus it is not invisible and acts like a normal Stop Loss set from the MT4.

Now, this setting could be crucial for martingale EAs. As with other martingales EAs, FXCharger has the same sudden drop patterns in the chart followed by gradual and smooth gains until the next drop and so on. Setting the low-risk tolerance could mean the trades will be closed before they can rebound to positives and Take Profit levels. As such, if this setting is not optimal, or better to say not by developer defaults, the EA performance could be very different.

On the website, there are 3 points where it is described (1) you will trade in profit thanks to smart Take Profit levels, (2) save deposit with smart Stop Loss, and (3) use reliable setting to get a stable profit. We cannot agree that even the best Take Profit leveling can make you profits but we agree that optimal Stop Loss protection can at least save you from complete account busting in a short time. FXCharger settings should not be tickled with is seems, as the devs have a refund policy in 30 days only if the EA is working by default settings.

Myfxbook performance charts show high levels or return. The EUR/USD pair shows gains of 1528.63% since Merch 2016. Three dips are evident, showing the Stop Loss in effect and according to our estimates, even after FXCharger made about 1400% gain, in May it dropped to 1100% from one Stop Loss trigger, 4 Stop Loss triggers in that month would almost bring the account to breakeven. Drawdown is increased to 29.46% in 2020 since the EA performed poorly in January and February piling the losses up to -15% per month. FXCharger average trade length is 5 days, a bit longer than advertised, won 60% of trades, winning 55.59 pips on average, and losing -79.86 pips. The Sharpe ratio is very low with this EA, a mere 0.01, meaning the returns do not compensate for the risk taken. The year 2016 and 217 were much better for this EA, none of the months ended negative and in 2018 19 and especially the beginning of 2020 is disappointing. Still, the EA has a total positive gain. The broker used for the testing is FXOpen.

The AUD/USD testing gained 580% since min 2018 and 14% on average per month. In contrary to the EUR/USD, the 2018 and 2019 year are all positive for FXCharger but seems to be off since July 2019. The trade success rate is 60%, the same as with the EUR/USD with a bit better Sharpe ratio of 0.04. The average win per trade is 54.57 pips and the average loss is -62.08 pips. The exposure is set to private. The drawdown presented on the website is an extreme 54.72%. The EUR/GBP pair performance chart and analysis is not published.

Service Cost

The FXCharger website will not disclose what indicators are used and the major content will be the statistics section. You will see multiple charts for the backtesting results for the EUR/USD, AUD/USD, and the EUR/GBP pair. FXCharger works on the 1-hour timeframe and has the normal and High Profitability modes.

The cost for the Basic version that works only on the EUR/USD is $385, which puts this EA in the mid to higher price range. For this price, you will get one license for any account, unlimited account online changes, and lifetime 24/7 support. A 30-day refund policy is valid if settings are not modified. FXCharger Max version is $495 which is regarded as expensive. The Max version has the same benefits but works with the other currency pairs mentioned. No demo is available.

Conclusion

In our opinion, this website does not give out enough information about this EA given the price range and does not mention the martingale strategy that is applied. Users report mixed results from major benchmark sites. Some of them state the refund policy is just a fake promotion:

“Fraud, a liar company. 5 days ago I bought it on the forexstore.com. Thither are written that 30 day warranty for the EA, I wrote that the robot did margin call on the demo account , he’s wrote this is not enough for a refund. I question what the warranty applies to??? If i could not give an asterisk. Nobody take the https://forexstore.com page for anything. Company fraud and criminals.”

Another seemingly unhappy reviewer wrote:

“Other reviewer is right that this company and other sites own by this EA developer are luring people in by fake 30 day money back guarantee. Run away.”

Others, however, say the support is responsive and that they have solid results. The final rating is mixed but not enough for anyone at this price for a martingale EA, especially concerning the extreme drawdowns and inconsistent results in 2020. Another concern is the undisclosed exposure and no performance since 2019 on the AUD/USD pair. Finally, we can only see backtesting results and no live results for the EUR/GBP. The website does not set strong selling points and even the 30-day return policy validity is arguable.

This Forex service can be found at the following web address: https://fxcharger.com/

Categories
Forex Service Review

TickUnit Scalper Currency Strength28 Pro Review

TickUnit Scalper Currency Strength28 PRO is a new indicator type on the scene popular with the scalper trading strategies. It is designed for the MetaTrader 4 and published on 5th July 2019. Since then it has received frequent updates with very good additions such as to save tick data for faster recovery. The developer of this combo indicator is Bernhard Schweigert from Morroco and he has 12 products offered on the MQL5 repository, most of them are popular and have very high ratings from the users. He made a currency correlation/strength indicator using Tick-Units data on 28 currency pairs, or all of the major currency combinations. It belongs to the paid category and could be regarded as a complete trading system.

Overview

TickUnit Scalper Currency Strength28 PRO is a combination of Advanced Currency Strength 28 and Advanced Currency IMPULSE with ALERT, both of them, of course, is the developer’s separate product. Currency Strenght can be used on 11 different tick units, 1, 2, 3, 4, 5, 6, 10, 12, 15, 20, and 30 seconds. You will have the convenience to have a single chart for all 28 pairs trading under the subwindow. Now, since the indicator is used on the lower than M1 timeframe, up to 30 seconds, it is not the standard MT4 indicator. Advanced Currency Strength28 Indicator is used for the standard MT4 timeframes and is a separate product. Tick Unit Scalper Currency Strength28 is presented as the first tick unit indicator on lower timeframes than M1. As such, fas broker conditions are a must, also the spreads must be raw. A user manual is made and linked in the ‘Overview’ page. It is detailed with gif visuals, although not very clear, traders that have a bit of trading and MT4 knowledge will understand how to use this special indicator.

The feature list is interesting but now everyone will see the value-added just by reading the description. One would need to try the indicator first. Sensitivity modes will adapt to the trading style, be it super frequent or slow and steady. Alerts are possible for extreme values in the Currency Strenght meter so you will know when a very good opportunity arises. Each currency has special dynamics, so the indicator already has pre-set parameters for each, thus making optimal signals. Dynamic Fibonacci levels are used for the Price Action zones as part of the proprietary code for this indicator, and according to the signal is generated. The zones represent areas of Resistance and Supply and are recommended to add on, it Is another indicator.

A signal is very easy to follow, it will be shown in the window and with one click a chart will open the currency pair. Even though the pictures show the Take Profit levels, it is not very clear if they are calculated by the indicator or if they are just fixed values. Trades should know when to trade, the momentum will show when the market is flat and no currency stands out as the weak or strong. Also, the traders should avoid main fundamental analysis events or factors that could affect the market. This is common for most scalper strategies. This said testing is valid only if manually done.

The settings are very detailed, you can change the Alert parameters, set the sensitivity and timeframe, visuals change, and more. Bernhard Schweigert also packed the templates and profiles for the MT4 and also has a blog with many useful updates, news, and tips.

Service Cost

TickUnit Scalper Currency Strength28 PRO is not available to buy, only to rent for 3 months or 1 year. 3-month rent has a price tag of $98 and 1 year $148. A demo is available. The reason for this kind of charging is probably because of good ratings and sustainability for the developer in the long term. Scalping is very popular and this indicator is unique and not hard to use. The logic behind the strategy is sound but may use some popular techniques such as Fibonacci levels.

Conclusion

There are only 5 reviews for this indicator and sums up a rating of 3.8 stars. This is not enough to have a verdict. Some of the useful user reviews are:

“Very good indicator and signals, but one has to still do some more analysis to filter good and bad signals.”

“THIS INDICATOR WORKS AND I RECOMMEND IT. IT HAS MADE ME MONEY. AS I ALREADY SEEN ITS PERFORMANCE ON THE MOST POPULAR CURRENCY PAIRS…As with the other of Bernhardt’s indicators, this is a good one!”

Traders that have seen the indicator in cation with the demo can easily learn to use it and test it. Since the author has already made the templates and profiles, you should have a ready-made best settings for each currency. The rent price is small to pay if this indicator matches your fast-paced scalping trading philosophy, as it is specialized for these traders only. Whatsmore, using faster than the M1 trading period will require very high focus and stress that most beginners will have difficulty handling.

This Forex service can be found at the following web address: https://www.mql5.com/en/market/product/39366

Categories
Forex Service Review

Scalp Tools Support and Resistance Levels Indicator Review

Scalp Tools Support and Resistance Levels is designed to do one thing, to identify the Support and Resistance levels. Usually, indicators that are specialized to do one thing are the ones that do this very well. Most successful trading systems are composed of a few specialized indicators for every aspect of the system. Even though the indicator name has the Scalp word, it is not limited just for scalper systems, most Price Action systems will rely on the Support and Resistance levels. This word is probably included in the name of the indicator for SEO purposes.

Nevertheless, the indicator has a perfect rating, has been developed long ago, on 9th September 2014. The latest iteration is version 2.7 updated on 5th December 2017. Scalp Tools Support and Resistance Levels is, therefore, a relatively old indicator that belongs to the paid category on the MQL5 market. Martin Fischer from Germany, the developer of this indicator has 23 products total with mixed ratings and a good part of them is free.

Overview

The tool offered is advanced, with a few very interesting features. The calculation for the important market levels is calculated automatically on several timeframes regardless of the trading instrument. Therefore, the indicator is universal. The usage is self-explanatory and the publisher has a youtube video presenting the indicator in just 1 and a half minutes. What we can see is that the design of the tool is in the form of a window with a menu. Support and Resistance lines are one of the few other options.

Timeframes available are from M1 to Monthly, the same as the MetaTrader 4 platform for which the tool is made. Here you can set the High Low distance in bars, or a range for which the tool will calculate the levels. The minimal difference in pips is also a definition parameter and the history used in the automatic analysis is defined by the bars or candles number. Interestingly, the analysis has the option to calculate levels at the cursor, as you move it. This is a unique feature that requires some coding and creativity. All parameters have the + and – buttons for ease of use. Such design does not make the tool eligible for testing in the MT4 tester module, although the tool such as this works at the moment of inserting, there is no point in testing the Support and Resistance levels through the simulation.

You will see the levels based on the settings and the evident levels based on the Price Action. Since the tool can differentiate the levels on multiple and simultaneous timeframes (traders can set H1 and Daily Support/Resistance levels on one chart), it increases the versatility. This indicator also uses round price levels as important Support/Resistance points.

https://youtu.be/_0jZ2bTS1Ag

Settings available for the tool (additional ones) are visual and the autosave function. Visuals are of course about the line width, color, type, about fond size, and so on. The autosave has the option to save periods and the symbols or to save only periods. This is quite handy, a trader will have the previously set parameters for each trading instrument.

Service Cost

Scalp Tools Support and Resistance Levels price is $30 to buy and $10 to rent for 3 months. You will have 5 activations per purchase and the demo is available. Note that the demo works only on the separate link provided by the developer. The Free Demo button will not give you the version that works offline.

Conclusion

Scalp Tools Support and Resistance Levels has only 5 reviews, but all have perfect ratings. It seems the tool did not receive much attention and popularity despite the advanced design. The most useful review is by Hailey stating:

”This is the handiest indicator and I wish all indicators were built on this principle. Click on it to see sup/res lines, click on it to remove. The support/resistance lines are right on the money. I put it on virtually every one of my templates! I don’t know the developer and I’m not getting a kickback on a $10 indicator. Just telling what I see. Great indicator.”

From our perspective, the tool is very handy but does only one thing and one that many traders can do without the need for an indicator. Therefore, the price of $30 could be a bit steep for a beginner and unnecessary for an expert (who probably already has his Support/Resistance indicator). However, in case your trading Price Action system does not have such an indicator, and you would benefit from one, Scalp Tools Support and Resistance Levels is a good choice.

This Forex service can be found at the following web address: https://www.mql5.com/en/market/product/5965

Categories
Forex Service Review

Pattern 1-2-3 Indicator Review

This pattern is popular among the Pirce Action strategy traders, or more precisely, the 1-2-3 Pattern is a reversal signal distinguished by a zig-zag move at the end of a trend. This indicator automatically plots this pattern on the MetaTrader 4 chart (also available for MT5). Initially published on 28th September 2016 on the MQL5 market, the developer Pavel Zamoshnikov from Russia released a few updates at the request of users. It was updated with new functionalities and bug fixes finishing with version 3.5 from April 2019. Since the pattern is commonly sought-after, the tool received some popularity. The author has a large pool of released products consisting of 45 indicators, EAs, and signals.

Overview

The indicator is very specialized in what it does, but since the drawing of a pattern is subjective, this task is not easy to code and to give the right levels for drawing points 2 and 3. The base of the formula comes from the Zig Zag indicator that is adjusted through several conditional measures, some of which can be altered in the “Method for pattern triggering” parameter. The Overview page is clear, showing all that the indicator can handle. 1-2-3 pattern is drawn in real-time, and once it is completely formed an alert will be triggered, without any redrawing. A video presenting how the indicator work is great and short. These patterns can show on any trading instrument, be it in forex, equities, or crypto, while the indicator does not require manual setting adjustment for each.

If traders want to adjust the actual 1-2-3 numbers display, it can be easily done in the settings. Fibonacci levels are used in conjunction with the adjusted, non-repainting Zig Zag indicator, so the points are pinned to one of up to 5 Fibbonaci levels scanned by the indicator. These levels are also used to Stop Loss and Take Profit automatic placement and can be displayed with description if set so. A full alert component is used to signal the trader by email, push, or to a mobile device. If traders want a complete automatic solution, a new published Exper Advisor is containing the 1-2-3 pattern recognition from this indicator.

According to the author, the recommended timeframe is from M5 to monthly, although the greater the number of candles drawing the pattern the better and longer the trends are. However, it seems there are some limitations to useability. Intraday traders would need to focus on the EU and US trading sessions as the patterns are not reliable on other markets.

In the settings panel, you can adjust the number of candles for calculation, Zig Zag indicator depth, the method for pattern triggering (breakout from the 3rd point line or just touching), show Take Profit and Stop Loss levels and how they are calculated, some visual settings and how or when the alert will be triggered.

Service Cost

The Pattern 1 2 3 indicator can be bought for $30 with 10 activations without the option to rent it. A demo is offered in the separate link on the ‘Overview’ page. This price is relatively low comparing to other indicators doing the same or similar function but we have found some free versions elsewhere, just not exclusively made for the 1-2-3 pattern.

Conclusion

A total of 19 users gave this indicator a good rating of 4.6 stars and commenting often, showing high interest. This descriptive 3-star review shows not all are happy:

“After purchasing the indicator, I found a lot of problems. From a formal point of view, this is a good indicator. However, when used in practice, there will be too much noise, which is not practical. The formation of the trend is mainly after the completion of the 123 mode, that is, after breaking the 2 points horizontal line. If only 2 points of the horizontal line are needed. After the breakthrough, the market signal is stable and other signals are redundant. Any other signal warnings are noise. There are no such separate alert message reminder options set in the metrics. Your indication is that multiple message reminders appear with a switch and the sound is the same. This is not a very good difference, it is trouble…”

Just note there are only two reviews with a rating lower than 5 stars.

This Forex service can be found at the following web address: https://www.mql5.com/en/market/product/18523

Categories
Forex Service Review

Currency Strength Matrix Indicator Review

Currency Strength Matrix is a paid indicator published on the MQL5 marketplace designed for the MetaTrader 4 platform. It belongs to the trend confirmation category although it is used in conjunction with other indicators. It tries to differentiate by offering better information for Price Action, Reversal, and Momentum trading strategies, according to the developer’s words. The initial version was published on 5th July 2017 by Raymond Gilmour from the United Kingdom, author of just one more indicator called Cycle Finder Pro.

All are with positive ratings although the developer made these to use them as a sales funnel to his website, it seems. Nevertheless, the indicator is not overpriced, the last update was on the 2nd of April 2019. Most of the updates optimized the code for better performance, some of the early updates added functionalities such as better identify cycles, automatic reading price action for oversized bars, and some visual upgrades.

Overview

The MQL5 Overview page has good content and clearly shows how to operate the indicator. Yet the inner workings are not disclosed. What is presented are three modules, each with its representation and performance. The Trend Matrix module is a table that shows which currency pair is in the trend by plotting a 1 in the corresponding matrix cell. This way could be confusing at the start but once you understand that the left table side currencies are terms, you can know if the trend is up or down. However, the second module shows the strength of each major currency (8 of them). This table measures the score for each currency from -6 to 6 where 6 is the most extreme case of a strong currency.

The score is calculated using the relevance of other currencies plus the 1 or 0 from the Trend table. Comparing the scores traders will know which currency is the weakest and the strongest and thus have a better perspective when entering trades. The last part of the Currency Strength Matrix combo is the Momentum chart. Basically, this is the Strength table represented in a chart moving in real-time. By looking at it traders can see the momentum or where the trend is progressing to. Additionally, the chart will show the lines for each currency, the line crossing can be the trade entry signal confirmation.

Currency Strength Matrix can be used and in our opinion, must be used along with other indicators. It is a first step in the decision process since it shows the most probable currency pair having a strong trend, or are not strong enough for any trade entry. The user guide describes 3 types of trading. The confirmed trend is when all 3 modules show a clear signal on one currency pair. Pairs should be consisting of a strong currency with a score of at least +5 and a weak one with at least -5. For “early trends” traders can use the 0 level line crossing on the Momentum chart that will signal the currency gaining or losing strength.

One should also be careful to select currencies only gaining momentum from the extreme scores, such as -5 or +5. “Begging trend” trading is done by looking at what currencies are at extremes and entering a trade once they start moving out of the extreme zone. This method carries the biggest risk but traders may have entered perfectly into an early and long trend.

In the settings panel, traders can adjust the ATR multiplier used for oversized candles detection. A lower multiplier will detect more candles but smaller. Calculation frequency can be adjusted so the indicators will use more time until they update. The rest of the settings are more cosmetic, turning the panels on or off, changing the font size and color, and so on.

Service Cost

The price for the Currency Strength Matrix is $98 for 10 activations. To rent it for 1 month will cost $39 and for 3 months $59. A demo is available. Notably, the author is promoting a free indicator that comes along with this one called Easy Draw for easy market switching.

Conclusion

As for the ratings, currently, 16 reviews are giving an average score of 4.5 stars and 136 comments. This shows that the indicator has some popularity although it does not reach the level most authors would like. The quality of the code seems to produce issues to some traders, most of the updates are about optimization. Certain users complain about this:

“Not good for me and bad. I do not recommend it at all. The owner of the indicator is asleep. There is no support or update for this indicator. Which I did not benefit from.”

Overall, currency strength meter indicators are popular among traders and therefore many versions are doing the same thing as this one. Some of them are free and can be found online.

This Forex service can be found at the following web address: https://www.mql5.com/en/market/product/23149

Categories
Forex Service Review

Density Scalper Forex EA Review

Density Scalper is a very interesting scalping strategy Expert Advisor developed for the MetaTrader 4 platform and published on the MQL5 website. The scalping is defined by the Mean Reversion strategy, meaning the trades are made on the assumption the price of an asset is high or low enough for a reversal to happen. Therefore this is a reversal scalper EA that avoids “unnatural” market events during the day and relies on the simple laws of demand and supply to find the most accurate signals. The developer is Roman Lengert from Germany who initially published the EA on 10th October 2019 on the MQL5 market.

Overview

The latest version is 2.4 updated recently, on the 10th of March 2020 during the latest COVID-19 world market event. The base code and idea of this EA are not new from the author, the previous product called NY Close Scalper is using the same principles except Density Scalper is optimized for better slippage management. Therefore the release date does not mean the EA does not have enough forward testing done.

In the Overview page of Density Scalper, there are a few disclaimers first. Aside from the general, that the past and backtesting performance does not guarantee future performance, there is a note stating any flash movements may ruin the strategy implemented and therefore the EA works only during the calm market environment and used the Stop Loss level. The execution of the Stop Loss may be delayed depending on the broker during the flash crash or other major events.

Every position made by this EA has the Stop Loss set. Mertinglage, Grid, or other unsustainable methods are not used. Density Scalper works on the M5 timeframe on the following assets: EUR/USD, GBP/USD, EUR/CHF, USD/CHF, USD/CAD, EUR/CAD, and EUR/AUD. Other experimental currency pairs are AUD/USD, AUD/NZD, AUD/CAD, EUR/NZD, CHF/JPY, GBP/CAD, GBP/AUD. Interestingly, the author showcases the maximal drawdown in $ value per lot or $35-50 per 0.01 lots for 16 years. In percentage terms, we have noticed 3.8% up to 4.97% in a different condition and a bit shorter-term (since 2009). Still, this Drawdown level is very attractive considering very good performance.

Quant Analyzer is used to showcase the performance. Some notable backtesting facts are 84.02% winning rate, 3.8% maximal drawdown using fixed lot allocation (0.1), $4.9 average trade value, 146.85% average yearly gain (portfolio on multiple pairs tested from 2003 using $5 commission and 150ms execution delay). Backtesting from 2011 till the end of 2019 shows a 4.98% drawdown on complete portfolio trading, 78.5% winning rate, 58.37% average yearly gain, and 9864 trades for this time.

Roman Lengert puts some effort to leave a rounded up quality supports and leaves a link for users to have good settings and have live monitoring charts. The links are provided on how to set up all of his EAs too in a separate blog post. The content is very organized and of high quality, leaving the impression of a dedicated developer that also has great knowledge about trading. Since the EA is a scalper on the M5 timeframe, it is imperative to have a good broker with low spreads and slippage and fast executions. A VPS is also needed for constant running as the EA collects historical data for trading. In the event of market disruptors such as elections, BREXIT, etc, the EA should be off. Note that the EA is using the Breaking News Filter in the results, to filter news impact on the market. The link is provided and recommended to use in conjunction.

As for the settings, there are just a few related to Money Management and certain trading conditions. Lot type can be set to “fixed” or “increasing”, while the maximum spread tolerance can also be set to avoid trading in times of high dynamic spreads. There are also other uninteresting settings related to server time and so on.

Service Cost

The price of Density Scalper EA is extreme, $2000 to buy having 5 activations, $125 to rent for 1 month, $300 for two, $500 for 6, and $900 for 1 year. To some, the price is well worth the trouble. The developer is very supportive and posted that for users that rented the EA lately causing disappointing results, he will discount the price for future rents. The demo is available so you could test this EA. According to the quality work and dedication, the price may be worth it if you have good results.

Conclusion

The final rating of all Roman Lengert’s work is above 4 and for the Density Scalper, a perfect 5 star based on 8 user reviews on MQL5. This sample may not enough get a complete picture of user satisfaction although there is a good probability this EA is a great addition to the trading community. Some of the user praises are:

“I have never seen a better EA, Roman is a very good Developer and his support is great. Five Stars!!”

Or the latest one from March 2020 describes the service very well in detail:

“Best Scalper and developer out there on MT4. Roman is brilliant in providing full transparency on all his EA’s, backed up with live results across multiple brokers. I have been running it now for 6 months and all my results across all his EA’s mirrors his signals perfectly, unlike other scalping programs out there at the moment. Roman has taken care of building in loads of safety checks and balances on slippage and account protection in case of a market crash. He is also very active in its on-going development and always responds very quickly to any questions. 10/10.”

On the MQL5 analysis page using the AxiTrade live account, Density Scalper shows ongoing trading since the 23rd of March 2019, a total of 211 trading days. The average holding time is 49 minutes meaning the EA is not the classic scalper. The chart shows a growth of 40.9% for this time, 37.39% for 2019, and 2.55% for the part of 2020. The developer stopped trading since the COVID-19 volatility spike on the forex market. The reason lies in the EA’s unsuitability to run in this environment as there is no calm nighttime. In March, Density Scalper suffered a loss of 1.43% with a spike in Drawdown like in the crisis 2008/09.

This Forex service can be found at the following web address: https://www.mql5.com/en/market/product/40941