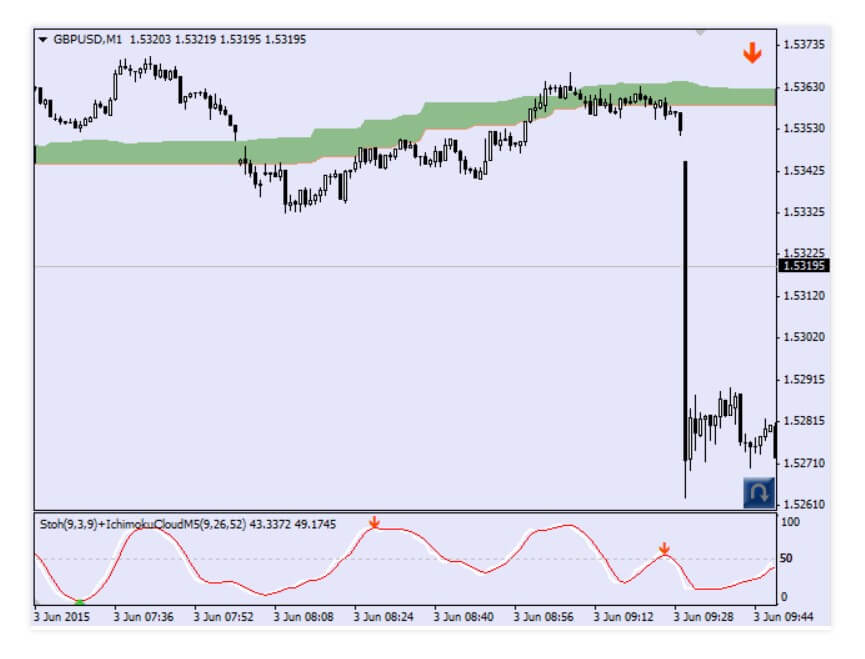
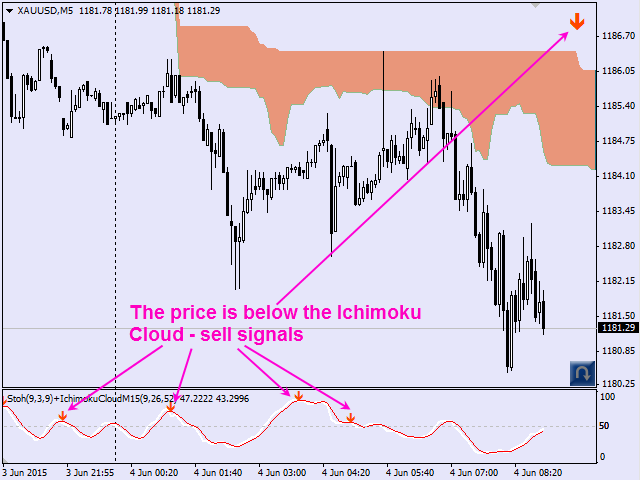
This indicator indicates the stochastic crossing in the direction of the trend that is determined by the relative price position in the characteristic Ichimoku cloud.
Overview
The main features of Stochastic Ichimoku are as follows:
-Flexible adjustments. Signals are filtered by bullish or bassist bars (parameter “BUY – only on bullish bar; parameter SELL – only on bear bar”).
-Stochastic crossing configuration levels (parameters “BUY-signal if Stochastic under this level” and “BUY-signal if Stochastic under this level”).
-Ability to use the Ichimoku cloud for higher time frames (parameter “Time frame of Ichimoku Cloud”).
Label in the top right corner will show you the direction of the trend:
-Up arrow indicates that the price is above the Ichimoku cloud;
-Down arrow indicates that the price is below the Ichimoku cloud;
-The price is in the cloud (plane: in this circumstance, the signal will not be generated).
The signal is activated not only when the bar is closed (signal formed), but also in the current bar that is not closed yet (signal likely). It has enough time to analyze the reality of the market and allows you to take time to make a decision and calculate trading parameters.
The indicator can generate an early exit signal from trade when the stochastic lines intersect inversely (against the trend). You can activate (ON) and deactivate (OFF) this option using a button in the bottom right corner of the chart (adjustable parameter). Activate this button only if you are in the market and want to close a trade according to the inverse crossing of stochastic. You can disable this chart button if this option is not required (“ON-OFF – Reverse signal button”=false).
In general, good results are obtained with the default parameters if an Ichimoku cloud time frame is set a level higher than the current one. For example, attach the indicator to a graph with М1, and set the cloud time frame (parameter “Timeframe of Ichimoku Cloud”) to М5. If a graph has a М30 time frame, set H1 as the cloud time frame, etc.
Parameters:
- Period K – period to calculate the Stochastic %K line.
- D Period – average period for calculating line %D.
- Deceleration – value of slowdown.
- BUY – Buy signal appears if Stochastic is below this level.
- SELL – Sell signal appears if Stochastic is above this level.
- BUY – A bullish bar only.
- SELL – The bearish bar only.
Conclusion
In short, we are talking about a well-known indicator (Ichimoku) that generally gives good results. If you want one of the multiple indicators of Ichimoku that exist in the market, this can be an option to consider, since its price ($30 USD) is affordable, and the indicator accumulates good comments from its users. The indicator can be found in the MQL market, and you also have a free demo version.
This Forex service can be found at the following web address: https://www.mql5.com/en/market/product/9925

