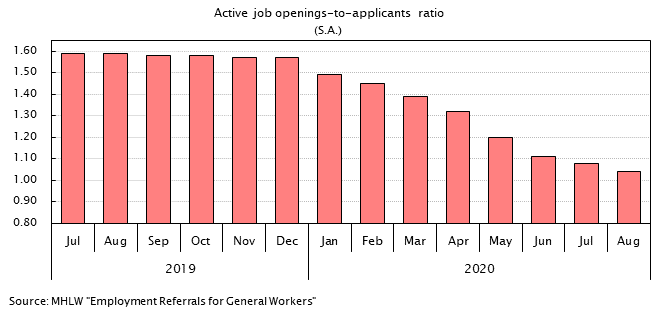
In this article, we will talk about the spread, which is actually an English term that means differential. And this is precisely what it means: A difference between the purchase price and the selling price of a given currency pair on the Forex market.
When trading on forex, our broker will offer us two prices for the same instrument. One of them, called “bid”, is the price at which you will buy the currency pair when we, as traders, decide to sell it. The other price, called “ask”, represents the price at which the Forex broker sells when we decide to buy.
Of course, the bid price (bid) will be a few points lower than the demand price (ask). The broker will always buy at a lower price. Well, the spread is neither more nor less than the existing range between the “bid” price and the “ask”. We will analyze this concept so significant for trading in the Forex market in more detail.
What is a Forex spread?
When entering a purchase order in currency pairs, you should look at the ask price, which the broker sells to. If immediately, after the purchase you decide to sell (without even allowing time for the asset to fluctuate), you would close the deal with a small loss. If you do the same operation, but in the opposite direction (short), the result would be the same.
This loss comes out of the difference between the two prices, that is, the spread. And it is precisely its meaning: it is the cost of trading in the market. It is the broker’s fee for executing our purchase and sale orders. Even if the position develops in our favor and we make profits, we will always close that position by assuming this cost, which is deducted from profits or added to losses.
All financial intermediaries make some kind of charge for offering those services that allow the trader to trade in the market; the spread is just a way to collect them.

Types of spread
Basically, there are two types of spreads in Forex: fixed spread and variable spread.
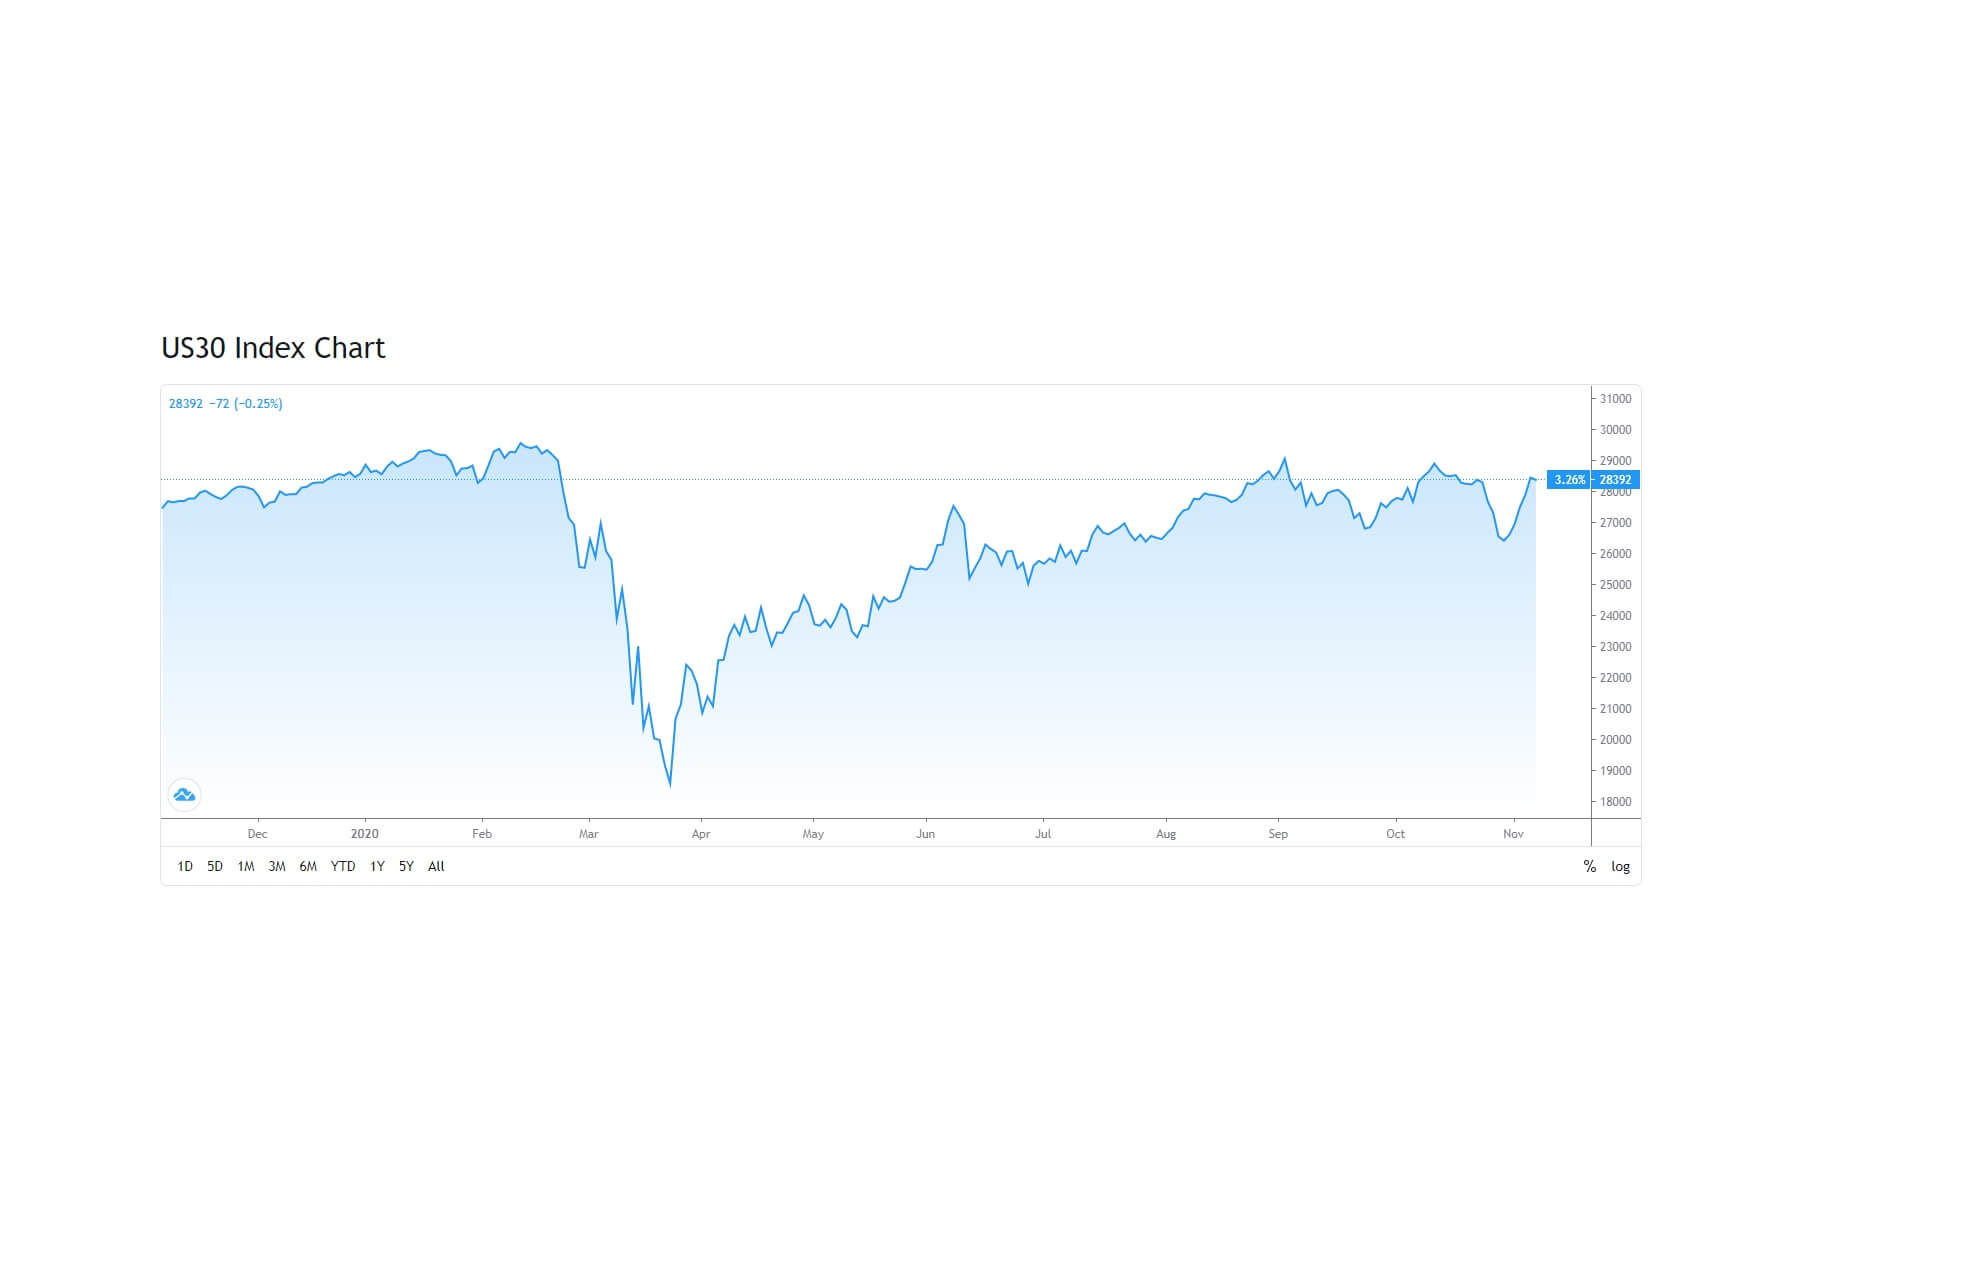
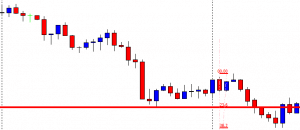
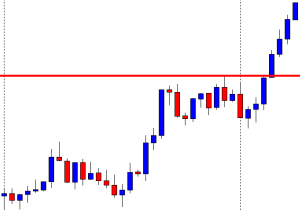
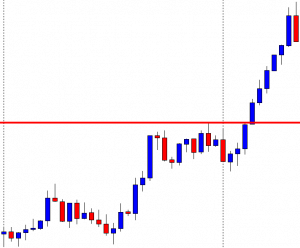
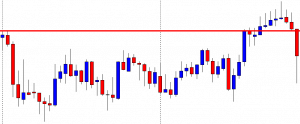
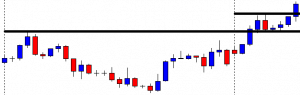
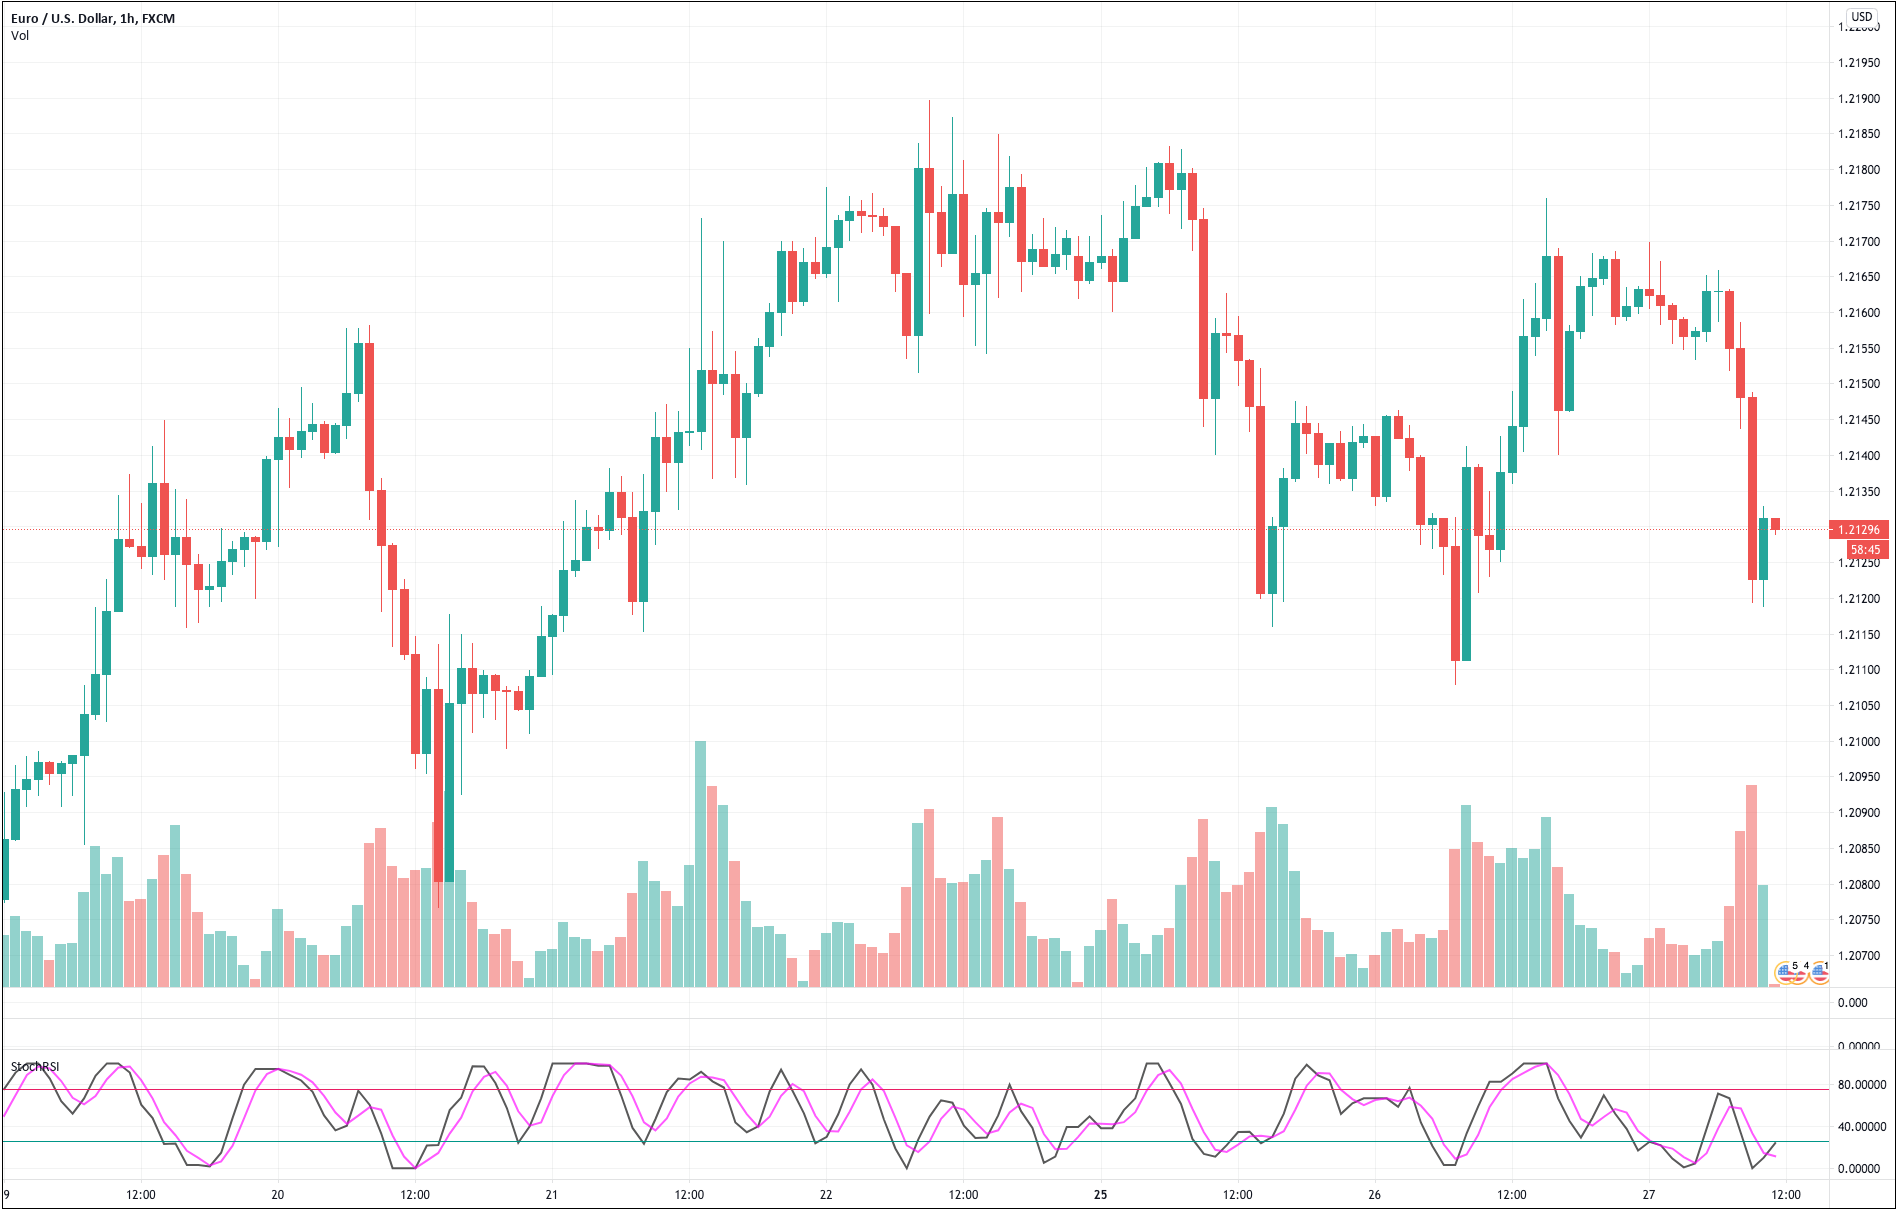
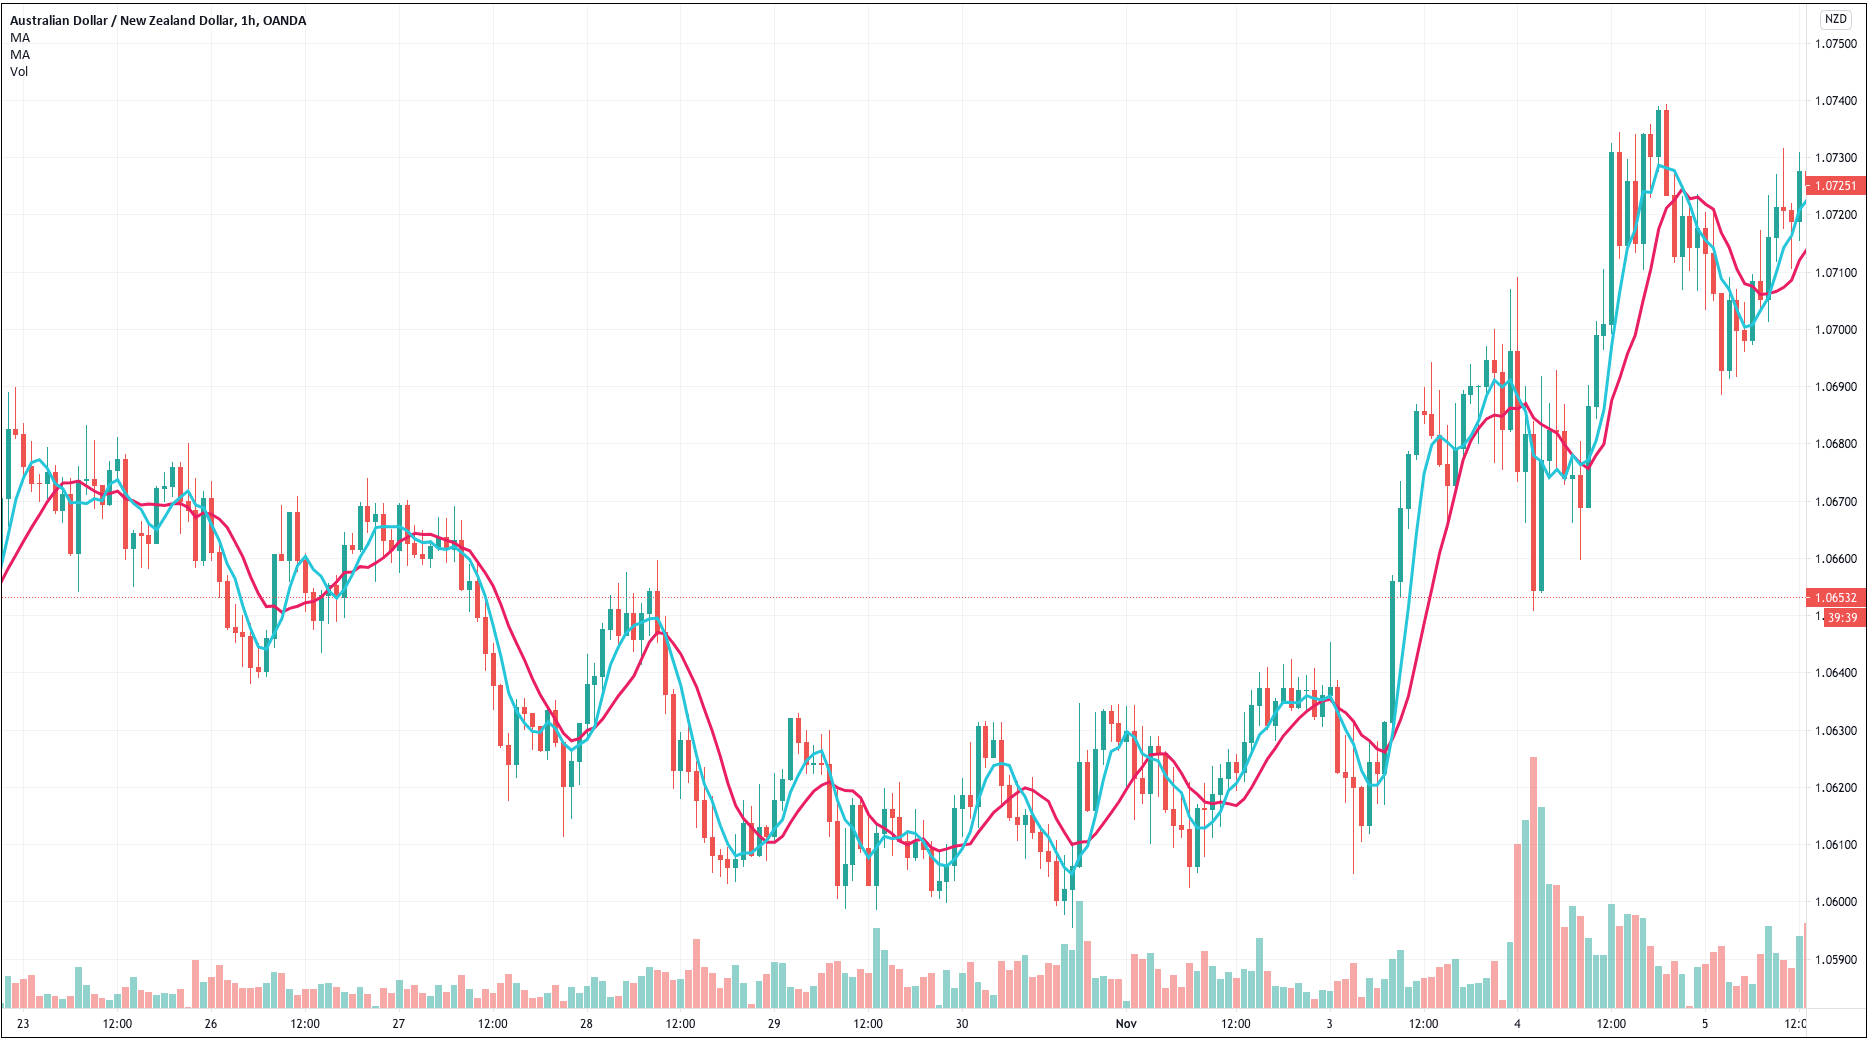
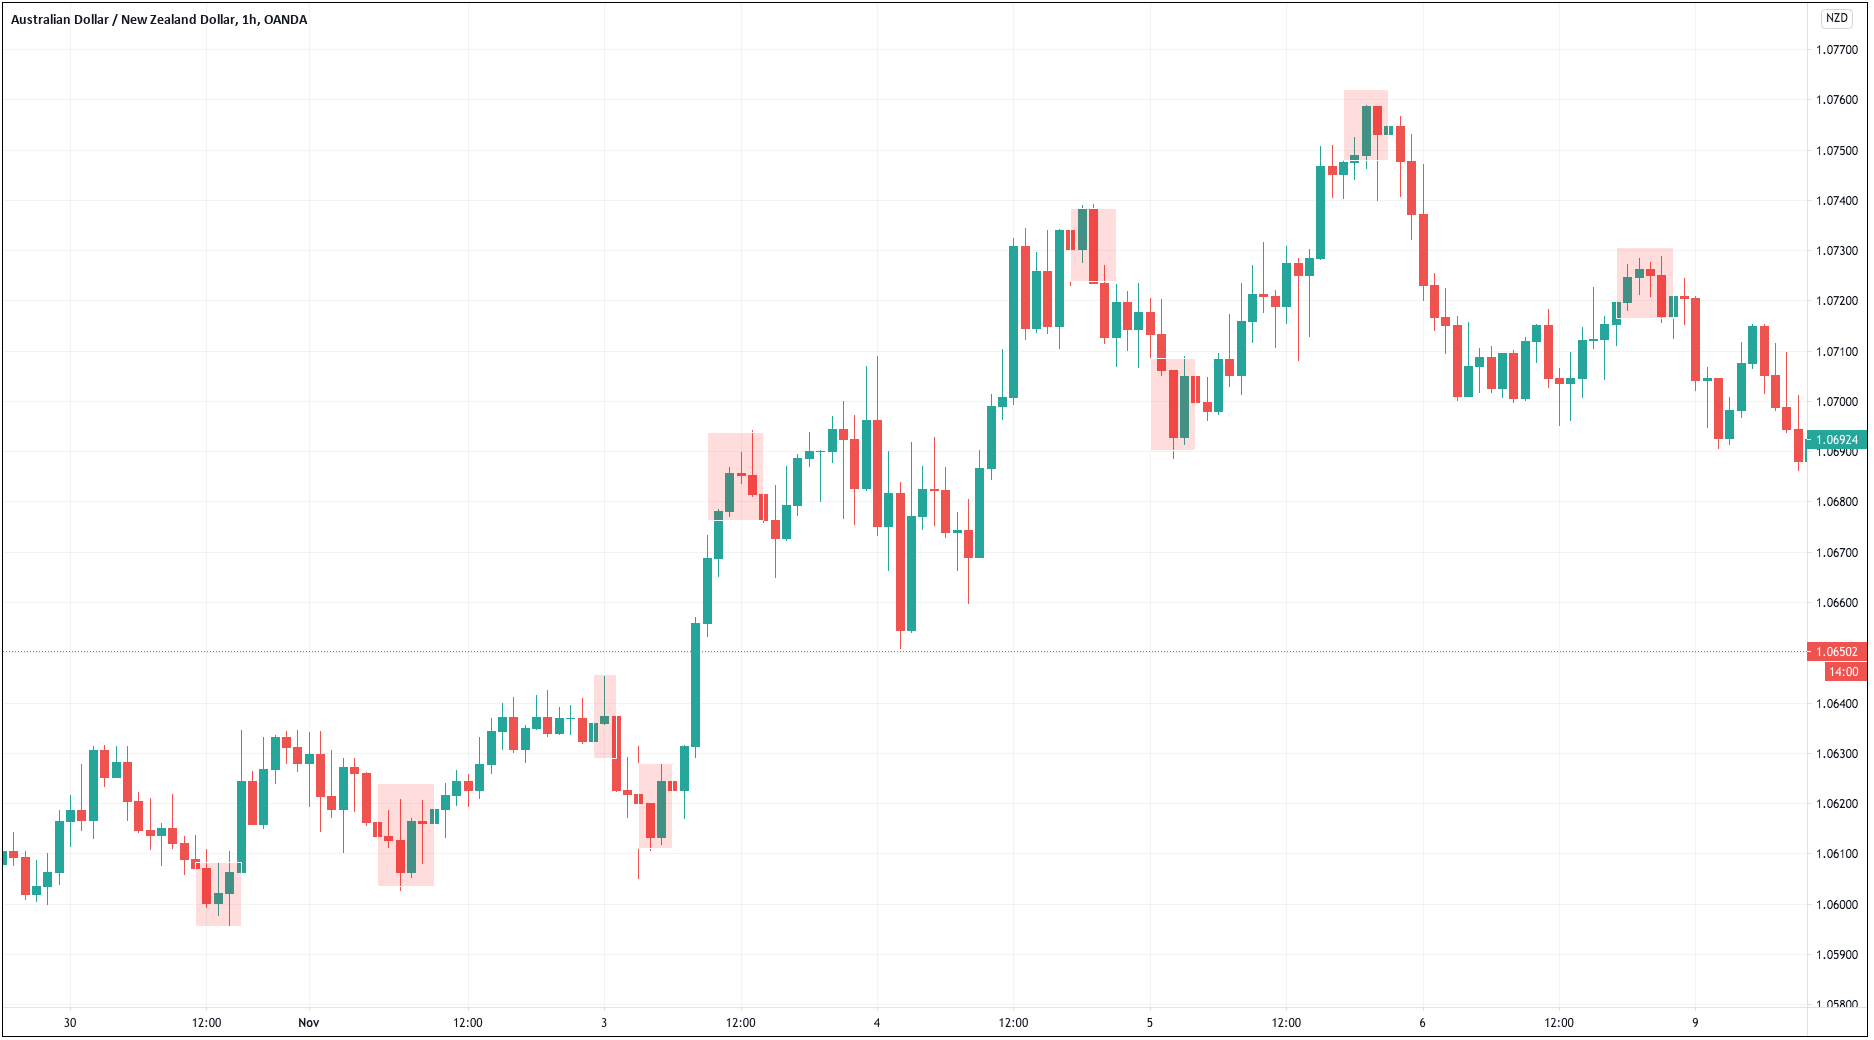
Fixed spread: This is a spread that remains unchanged, despite fluctuations in assets in the market. If, for example, the EUR/USD pair quotes as follows:
Bid: 1.0964
Ask: 1,0967
We can deduce that the existing spread is 0.0003 points; or what is the same, 3 pips difference. When it is a fixed spread, vary what the price of EUR/USD varies, the difference between both prices will always be 3 pips.
This type of spread is usually offered by those brokers that act as a direct counterpart to the trader’s operations (the broker buys when the trader sells and sells when the trader buys, assuming the opposite position with its possible profits or losses). These types of brokers are known as Market Makers. Each currency pair may have a different spread, however, it will remain constant no matter how much the price fluctuates.
Variable spread: In this case, the spread does not remain unchanged, it can vary depending on the conditions in the market at a certain time. Following the above example of EUR/USD, when it is a variable spread, it will not always be 3 pips. Depending on market conditions (liquidity and volatility), the spread may vary.
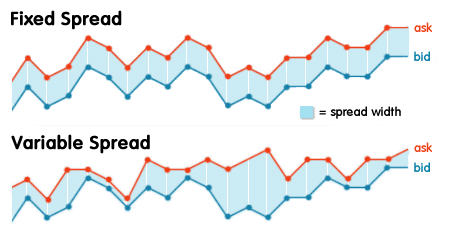
As a general rule, when the broker offers variable spreads, these are usually lower than in the case of a fixed spread. But, the trader knows the risk that the cost will increase at specific moments in the market (little liquidity or a lot of volatility).
This type of spread is usually offered by those brokers who transfer the trader’s orders directly to the market, not acting as their direct counterpart; this type of broker is known as ECN or STP. Depending on the supply and demand prices they obtain in the market, the spread is established.
How to collect the spread on Forex
Although it depends on the conditions of each broker, normally, the spread is loaded at the same time as opening a trading position. Whether it is a purchase (long deal) or a sale (short deal), as a general rule, our deal will start with a small loss. As I was saying at the beginning of the article, this loss is the amount of spread that the broker has loaded.
At the time of closing the position, a counter-opening order will be issued, but the spread has already been cashed and will only execute the order at the price that the broker marks at that time. Thus, the gains or losses of the operation will have the cost of the spread incorporated at the time of closing it.

Difference between the commission and spread
Commissions also involve the commissions of the broker to be able to carry out their work. The most important difference is to know how to collect this fee. A commission is charged by the broker each time an order is opened in the market, in other words, it is charged both when closing and when opening a trade; Then, we see how the costs related to trading are doubled. We are talking about that it can be a fixed amount or it can also be a percentage applied to the volume of money of the operation.
In the meantime, the spread is usually cashed only once and is calculated based on the value of each pip (we will soon see how spread can be calculated in Forex). Then, the spread is always measured in pips, not an amount or a percentage of the amount to invest.
How to view the spread in MetaTrader 4?
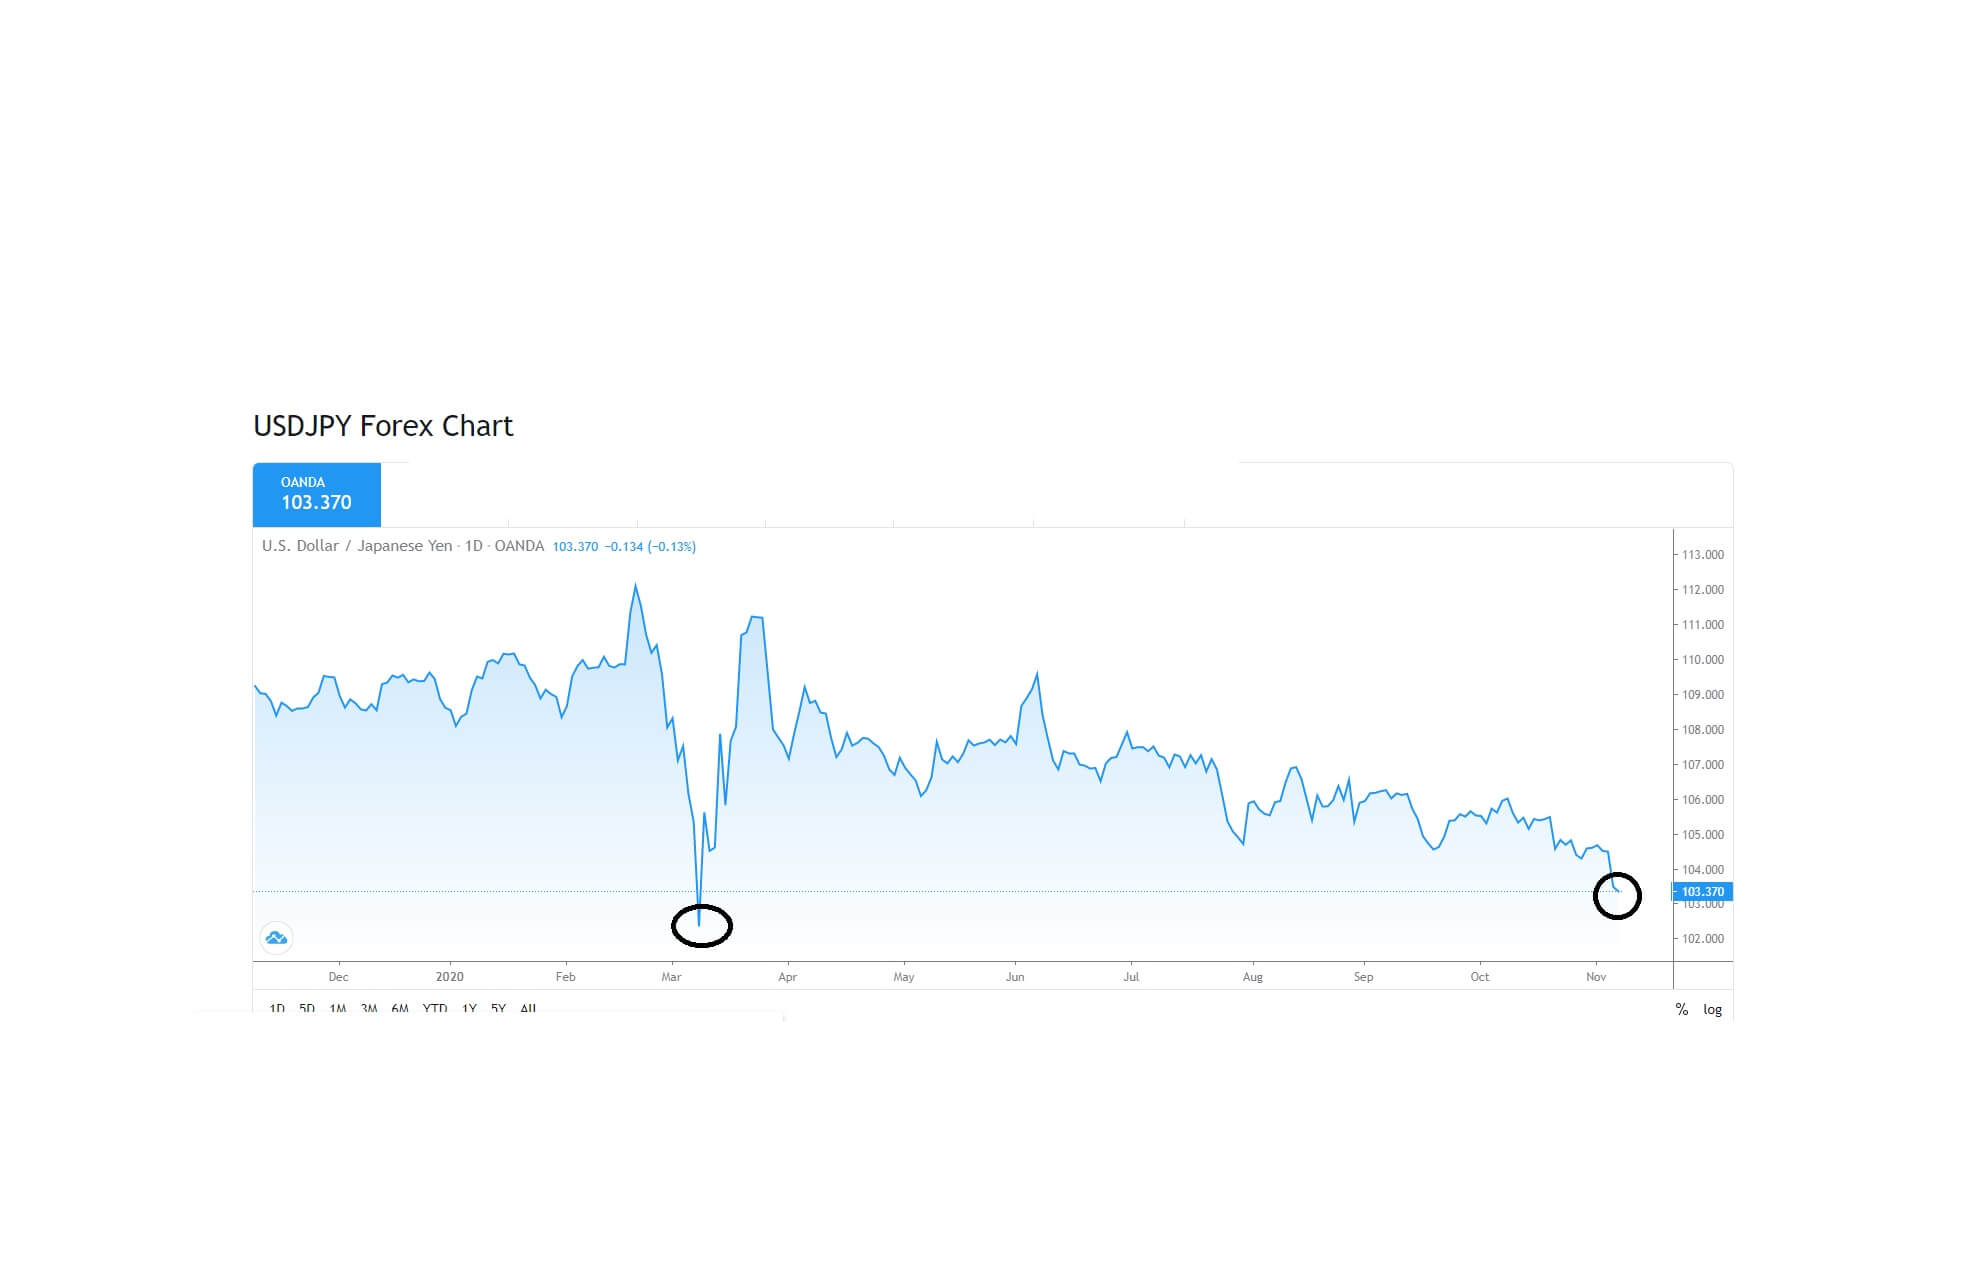
As I was saying, the spread is nothing more than the difference between the offer price (bid) and the demand price (ask) offered by the broker. Therefore, if we look at these two prices, we can calculate the difference and set the spread points (pips). The natural thing is that the spread is known when establishing the relationship with our broker since it is one of the commissions that the trader must face. You must inform us of this parameter, among other things, of your terms of employment.
In any case, the spread can be checked on MetaTrader 4 (and other trading platforms) simply by looking at the prices of each financial instrument. These values appear in the “Market Observation” window, which, by default, is located on the left side of the platform (can be switched manually). It is convenient to check to ensure that the broker meets the agreed conditions.
How to calculate the spread on Forex
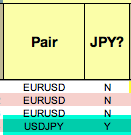
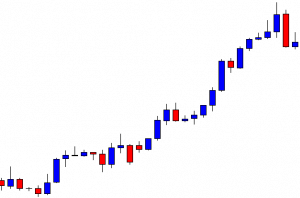
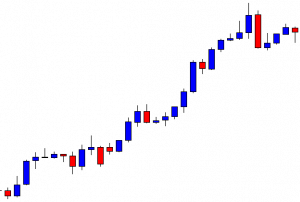
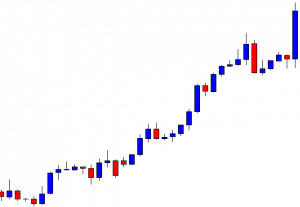
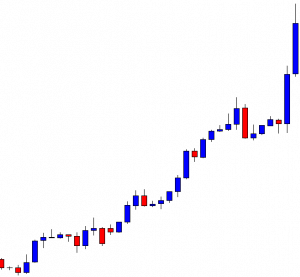
Spread is measured in basis points of fluctuation in the market (the minimum movement an asset can make). These points are called “pips” in the Forex market (Point In Percentage). A pip, that is, the minimum exchange rate variation between two currencies, corresponds to the fourth decimal (0.0001). The pairs in which the Japanese yen appears are quoted to two decimal places only, so their minimum variation is 0.01 (the second decimal represents a pip).
In summary, to calculate the spread, in principle we must calculate the value of each pip. Subsequently, we should only multiply it by the difference pips between the bid and ask price, that is, the spread. The monetary value of a pip is expressed in the quoted currency (the second of the pair). Beware, if this currency is not the local currency, we must keep in mind the exchange rate between the two to make the exact calculation.
A pip can have a value based on the amount we decide to invest. Thus, if we open a one-lot transaction (100,000 units of currency), the value of a pip will be 10 units of the quoted currency (100,000 x 0.0001). If we operate with two lots, 20 currency units; if we operate with a mini-lot (10,000 currency units) it will have a value of 1 currency unit; etc.
If the spread is 3 pips, for example, and the value of each pip is two units of the quoted currency (since we have traded with two mini-lots), its value will be 6 units of currency. To calculate how much it represents in euros, we must make the exchange between both currencies.

Factors Influencing Forex Spread
When the spread has been calculated, one of the most important factors that can influence when establishing the spread is the commercial policy of the broker in question. In other words, we know that there is a competition between intermediaries and also other marketing factors, each broker will set the differentials they think are appropriate. The trader, therefore, can contract with these conditions or look for another broker.
When we talk about variable spreads, the broker will set its prices depending on the prices that are in the market (the prices provided by liquidity providers at all times). Then, the factors that most influence the spread establishment in each currency pair of the Forex market will be the following: (whether fixed or variable spreads)
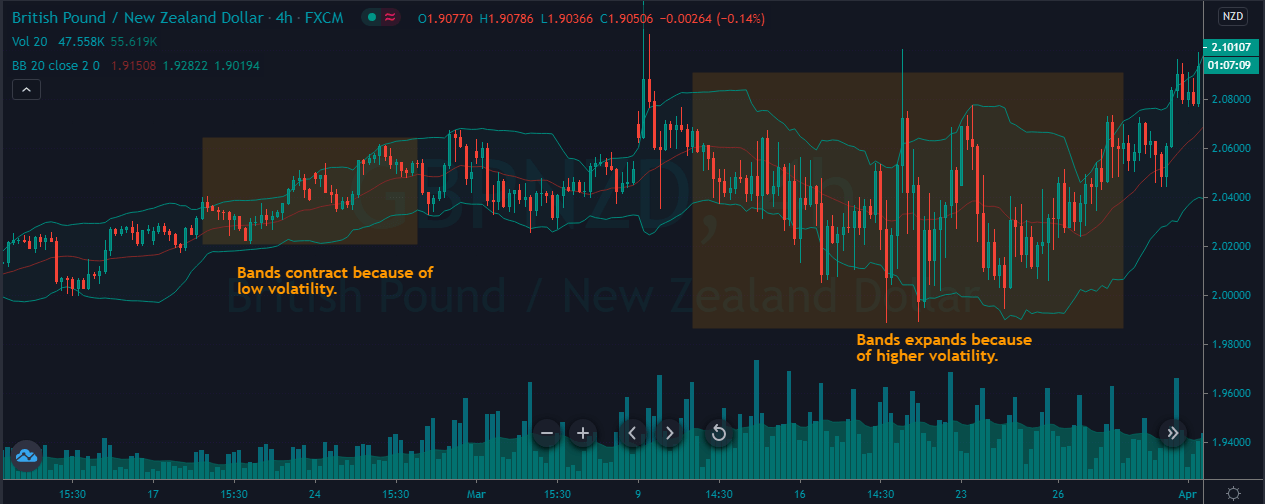
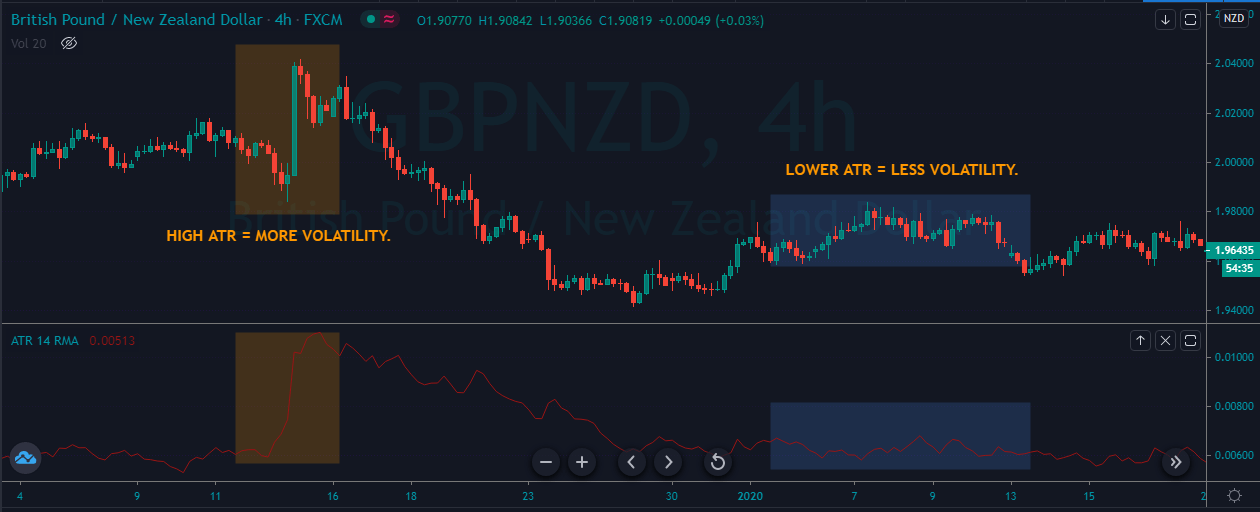
The volatility of the asset: if volatility is high, the spread increases. It usually happens when economic news publications are produced. The more volatile a financial asset is, the higher the spread the broker will charge us.
Market participants: in other words, the liquidity of the asset in question. If we see that there are a greater number of sellers and buyers it will be easy to marry the orders and consequently the differential will be smaller; the broker will have, in this way, suppliers in the market in more convenient prices, and this fact is transferred to the trader itself.
How do spreads work?
Once you’ve seen everything you need to know about the spread, let’s review it through an example to get a complete understanding of how spreads work. For example, suppose we carry out a long transaction in EUR/USD. The prices offered by the broker are as follows:
Bid (Offer): 1.1044
Ask (Demand): 1,1046
The spread is 2 pips (the difference of both prices)
If the trader wants to buy the pair EUR/USD you will have to pay 1.1046 dollars for each euro purchased. If you wish to sell it, the broker will pay you $1,1044 for each euro sold. Suppose the trader wants to buy three micro-lots (30,000 euros). The value of each pip will be 3 dollars (30,000 x 0,0001). If the spread is 2 pips, its value will be 6 dollars. This amount will be charged to your account at the time of opening the transaction. Therefore, your income statement will show a loss of about €5.43 (depending on the EUR/USD exchange rate).

This loss will be initial, it is necessary to allow the transaction to develop to generate sufficient profits that allow the trader to cover it. When the pair has advanced 2 pips to its advantage, the trader will find himself at the dead-end of the trade, the balance of it will be 0. From there, the trader will start to make profits. If, on the other hand, the transaction develops against you, the own losses of the position will be on this initial loss.
The transaction will be closed immediately when the trader decides, and this cost will be a reward obtained by the broker for providing the service that allows the trader to trade in the market. In this case, we have given as an example a spread of 2 pips, but depending on the currency pair that is intended to trade, it can be much higher and the price must fluctuate more to get to the deadlock.
The importance of understanding spreads
Knowing the spread is of great importance because it is one of the greatest costs that the trader has to face to operate in the markets. Keep in mind how much our broker charges us if the price is in line with the existing conditions in the sector if the service that it provides us justifies the cost of operation if the broker complies with the agreed conditions, etc., is essential. These issues can make the difference between success or failure in our trading.
On the other hand, it will be useful to know how to check and calculate the cost of the spread to define if the conditions are adapted to our style of trading (if we open or close several operations throughout the day or operate with longer time periods) and the assets we normally operate.
Remember that the Forex market does not have a single place, it is traded in different places. It is a decentralised market with no clearinghouse. The trader must contract with reliable and reliable brokers: those that are regulated by prestigious bodies. Keeping in mind everything related to the spread on Forex, as we have been dealing with in these lines, will be of great help to you in order to protect your interests before the broker itself and the aforementioned regulatory bodies.


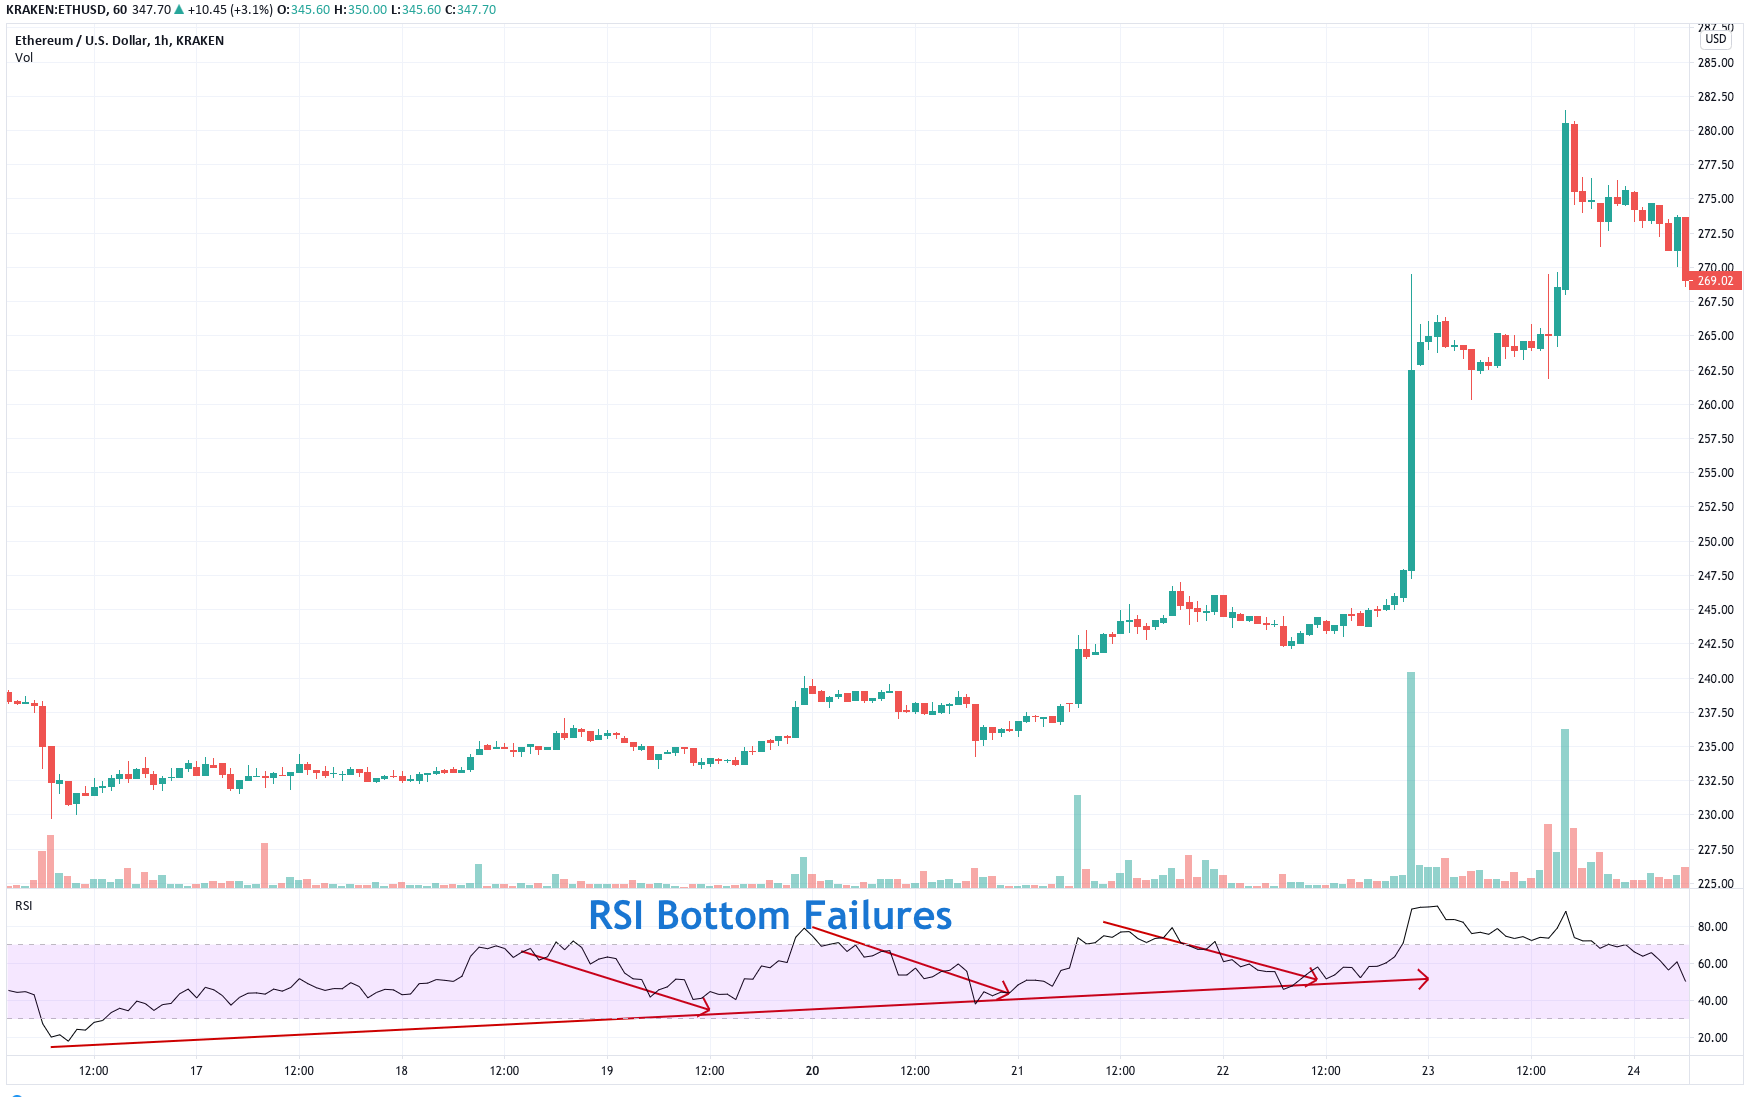


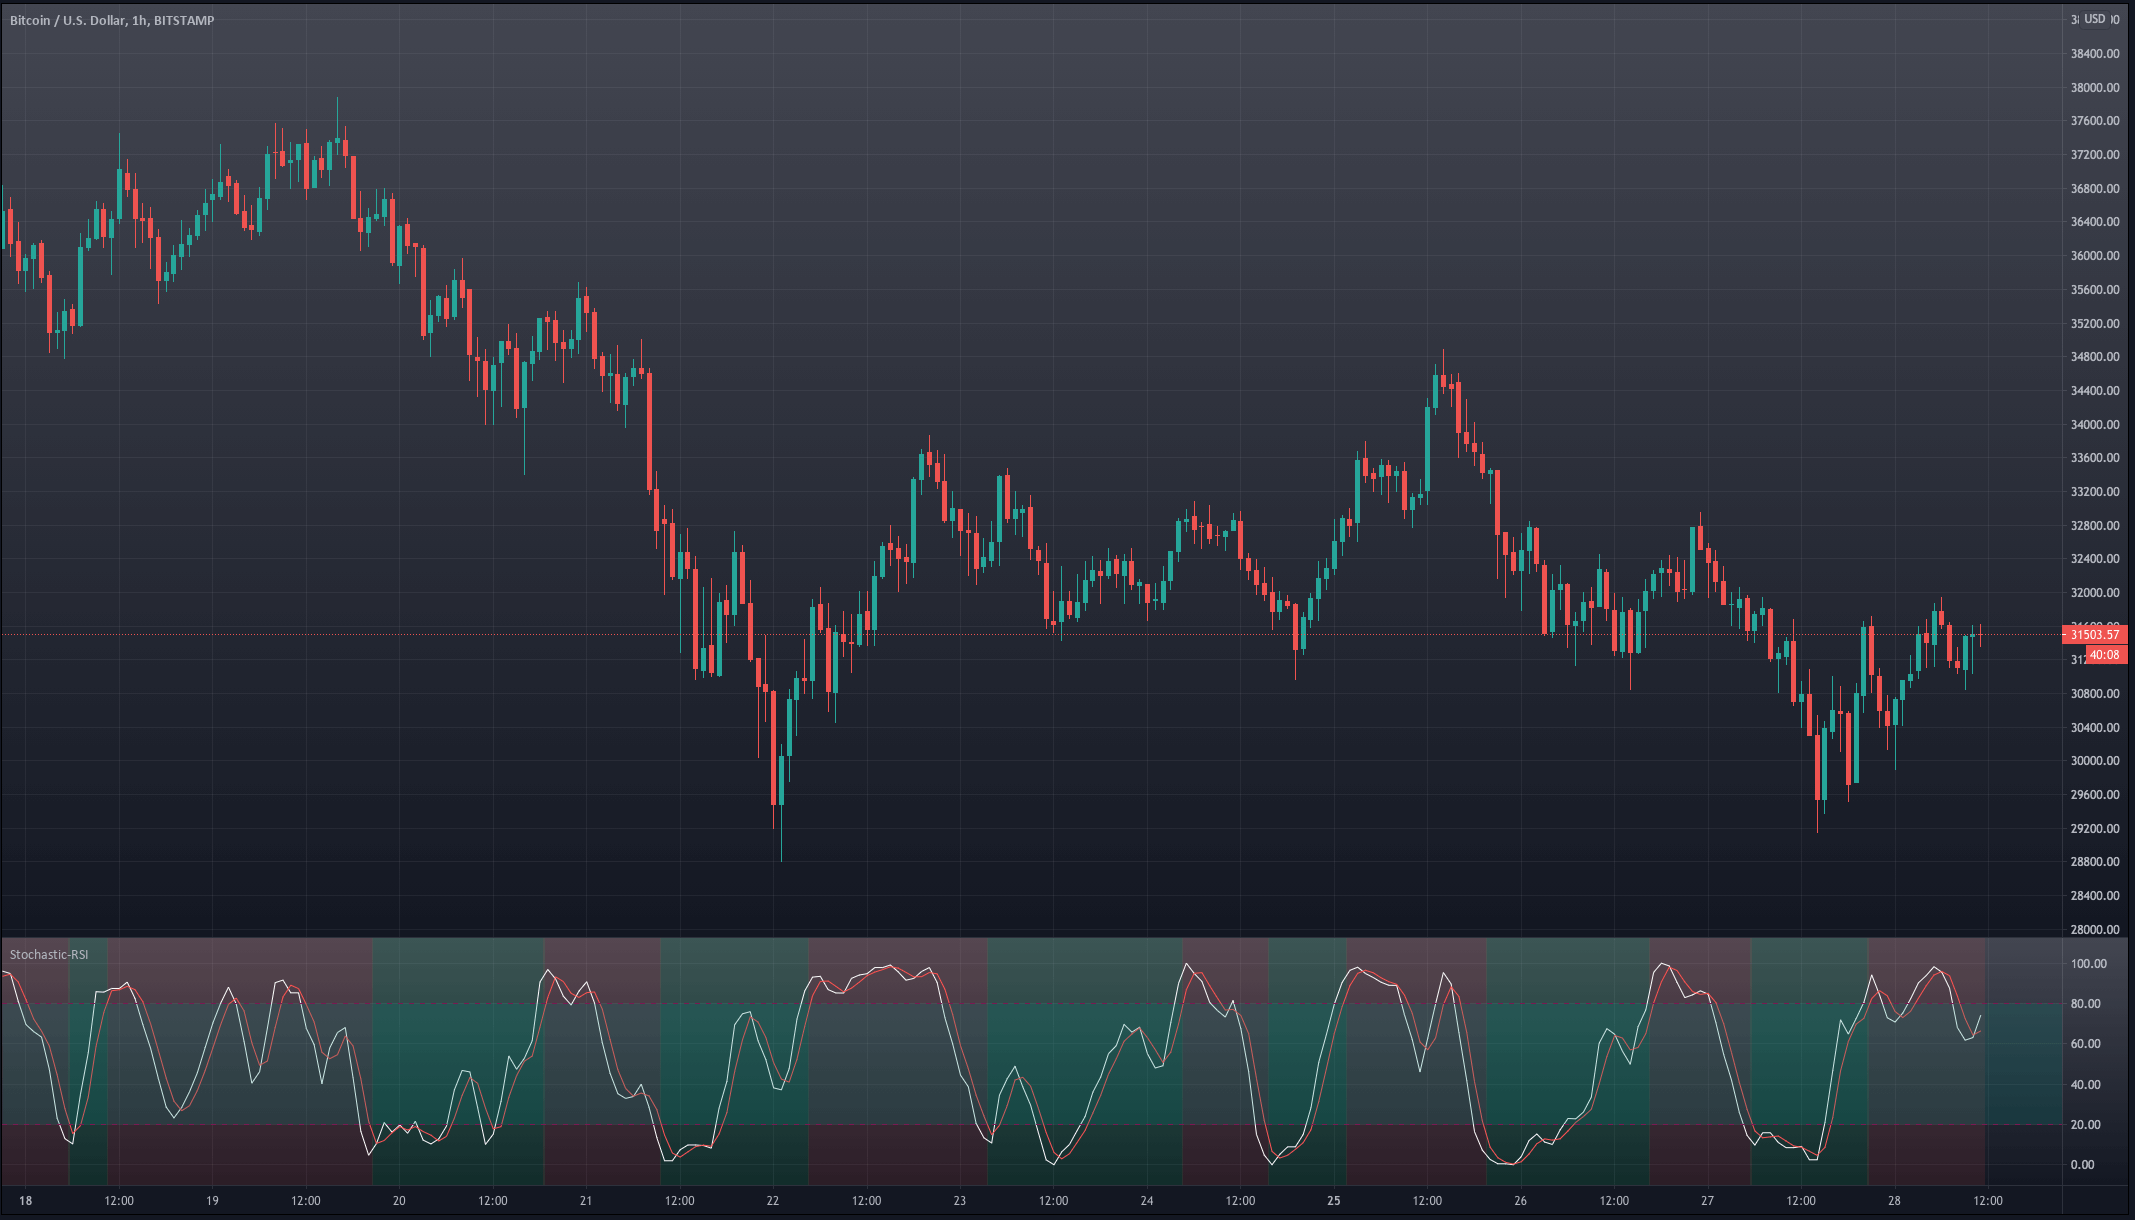
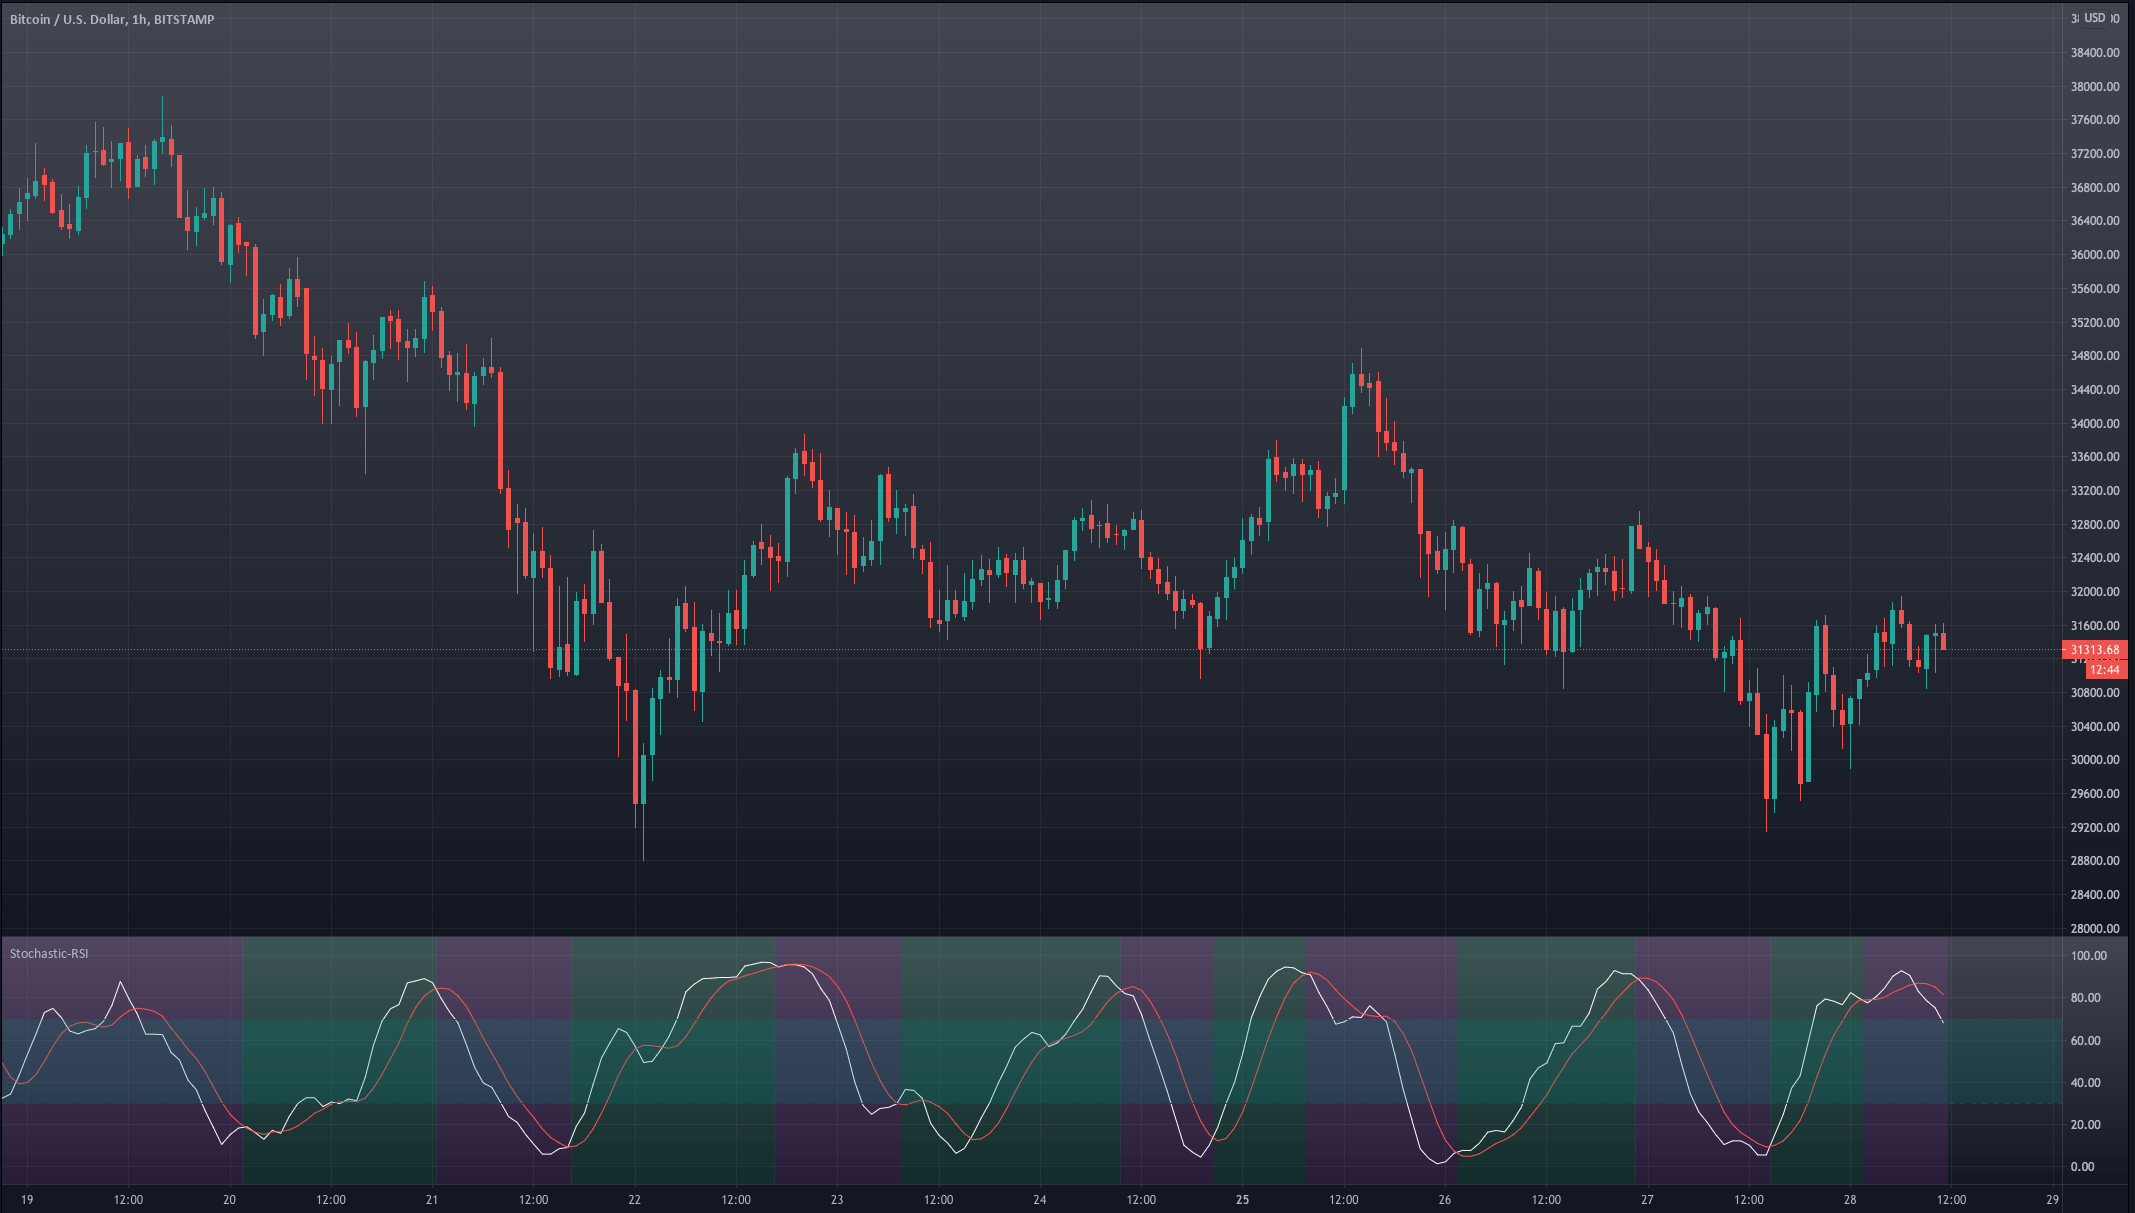
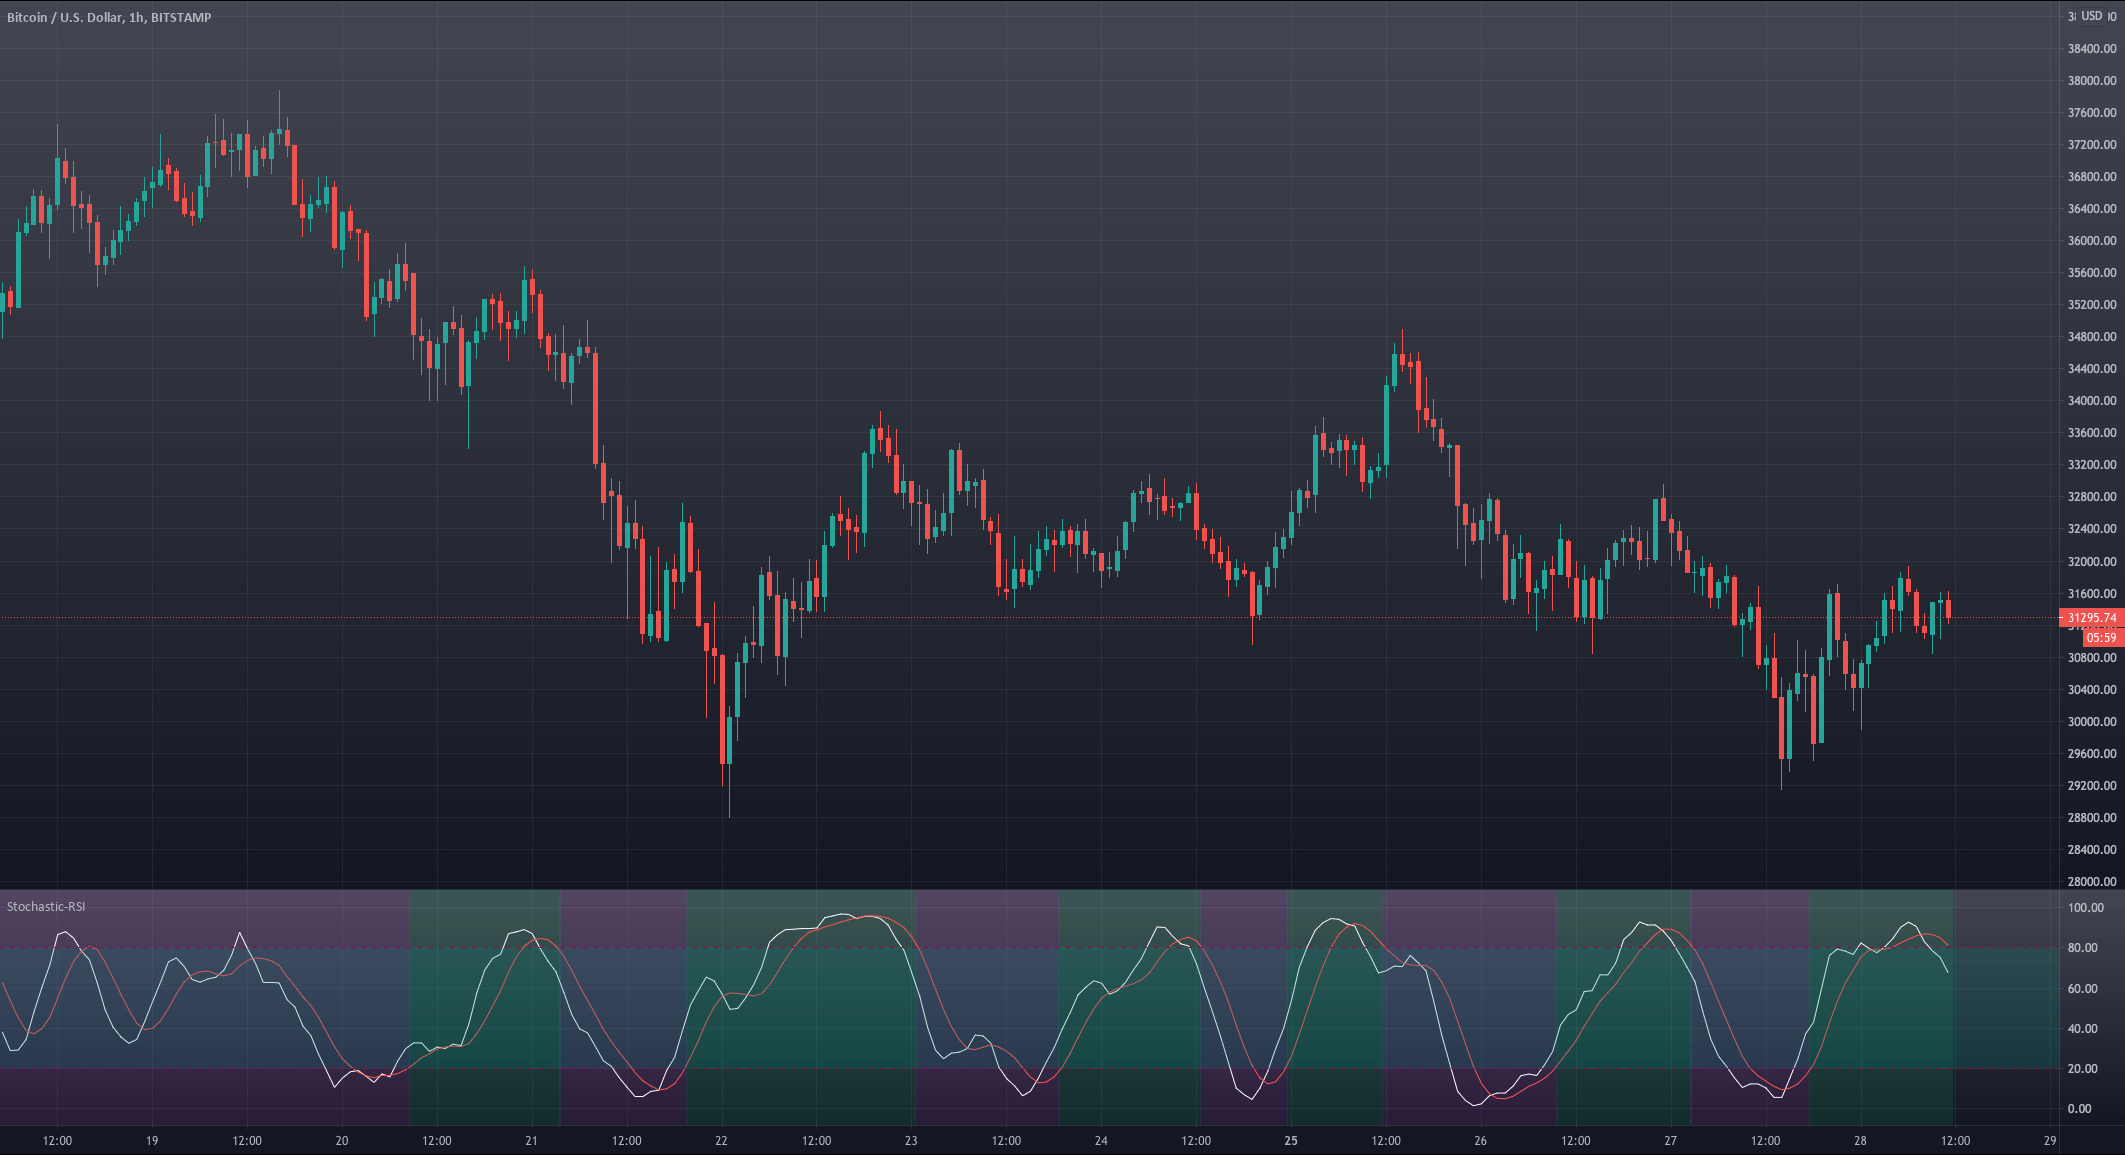

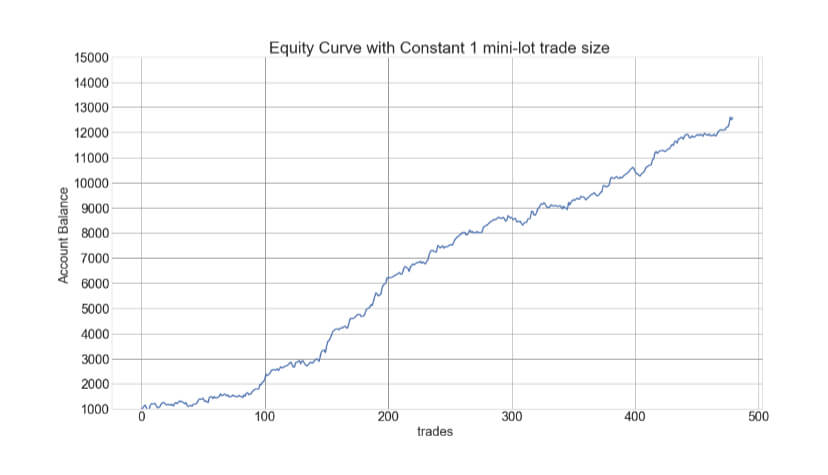
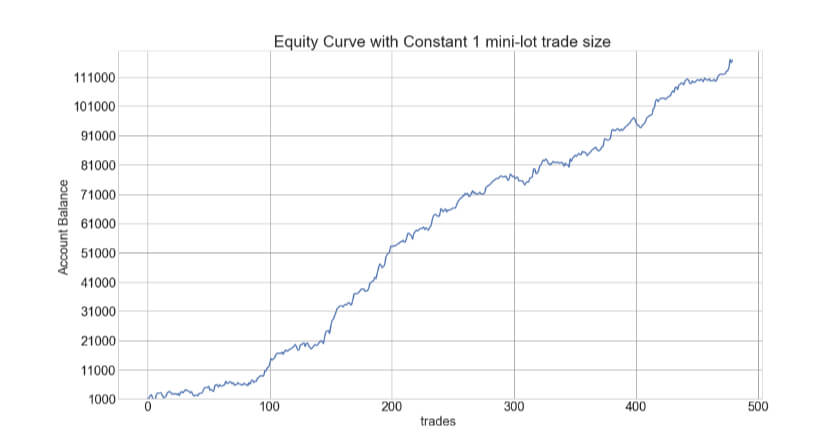
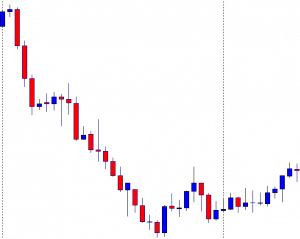
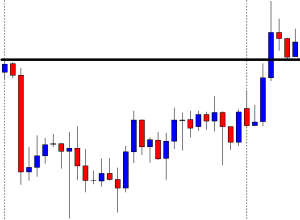
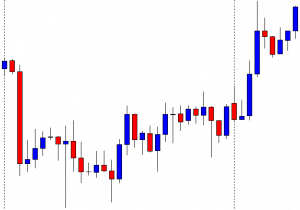
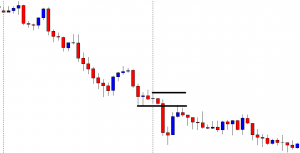
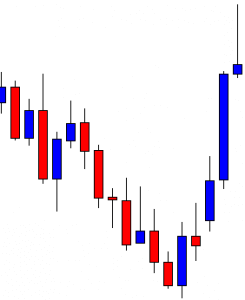
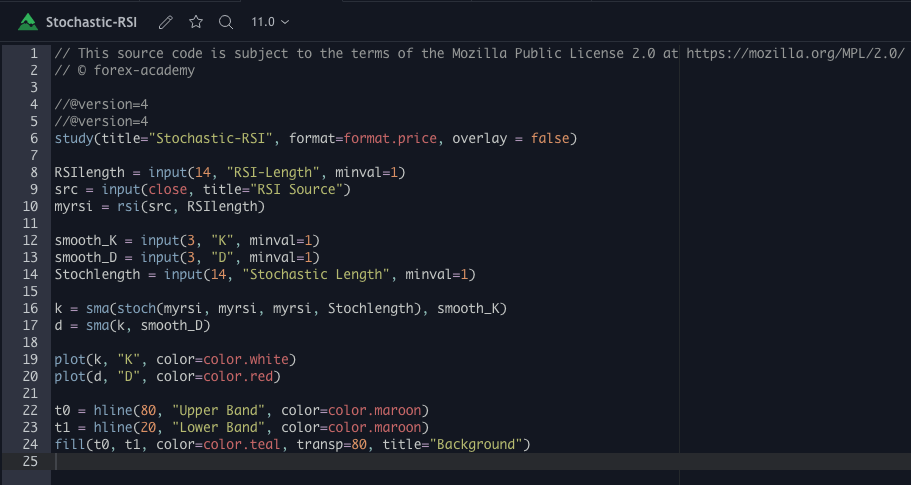
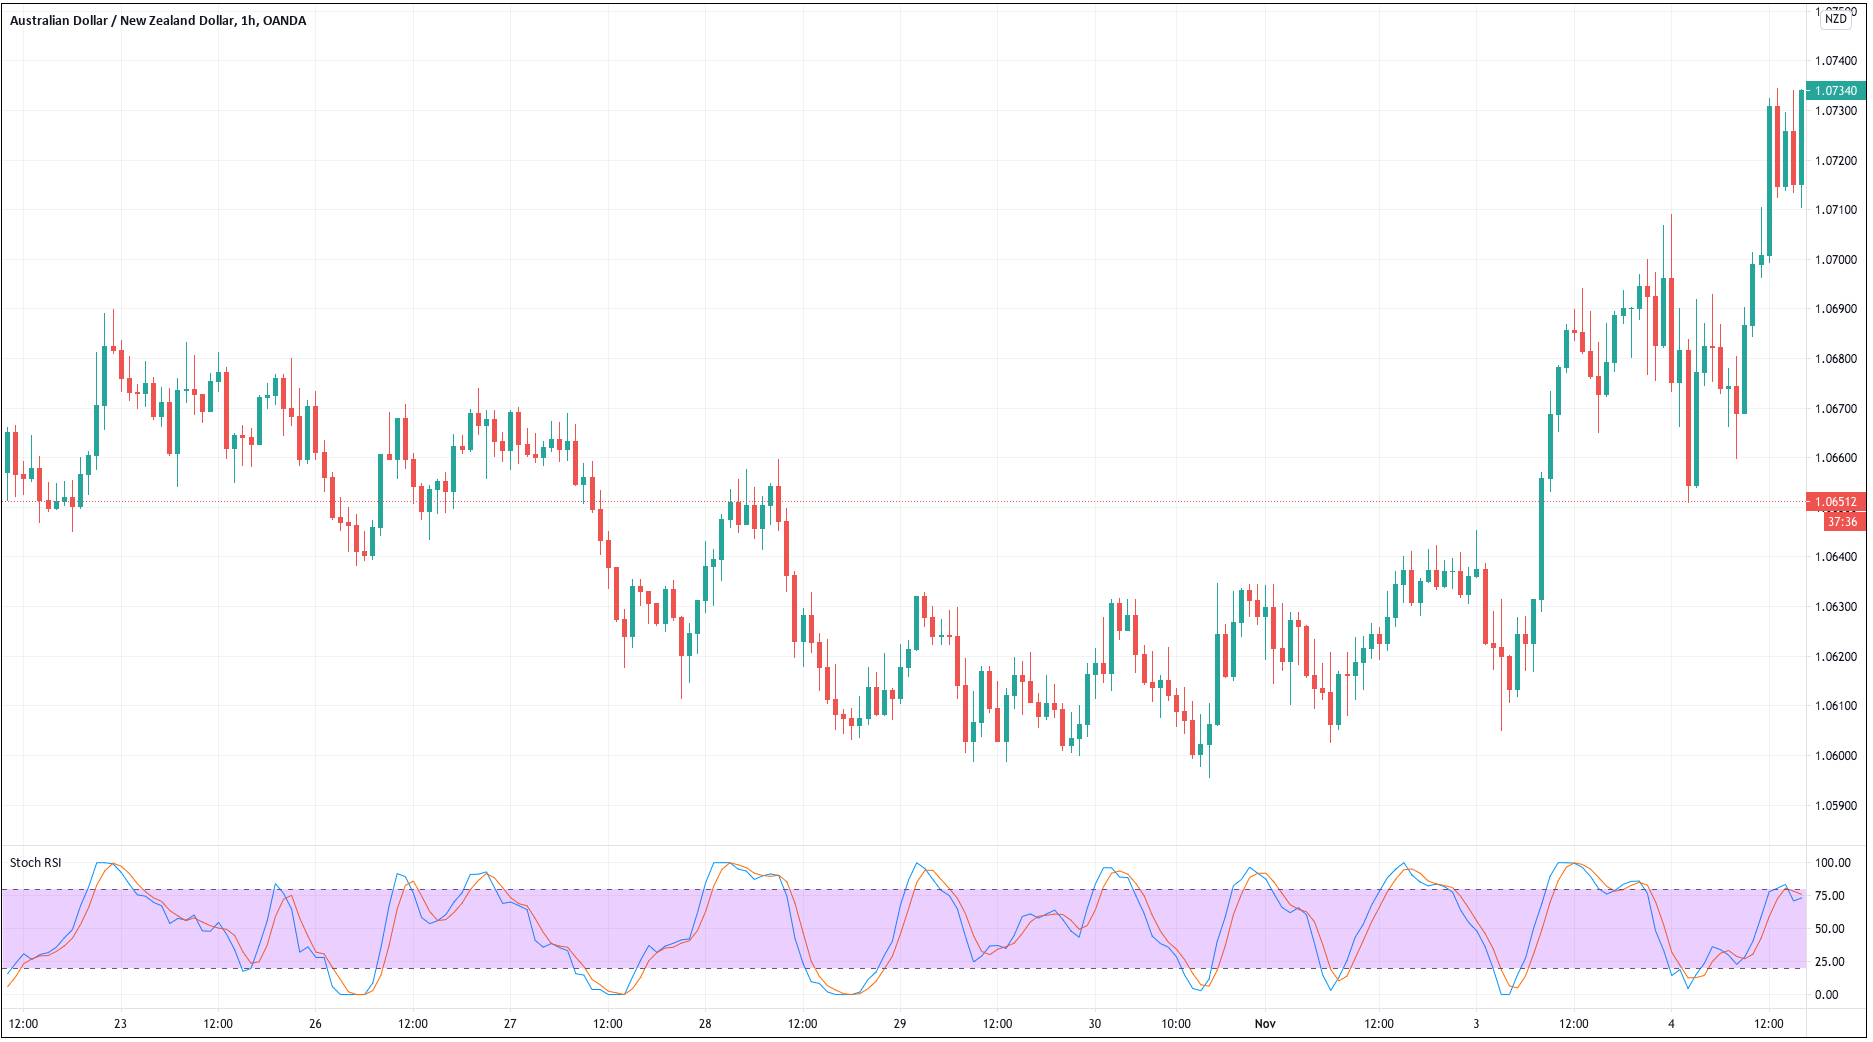
 For our example, we will use a simple yet quite exciting indicator called Stochastic RSI, which applies the Stochastic study to the RSI values. This operation smoothes the RSI, and it reveals much better the turning points on mean-reverting markets, such as in Forex. Let’s see how it behaves as a naked strategy.
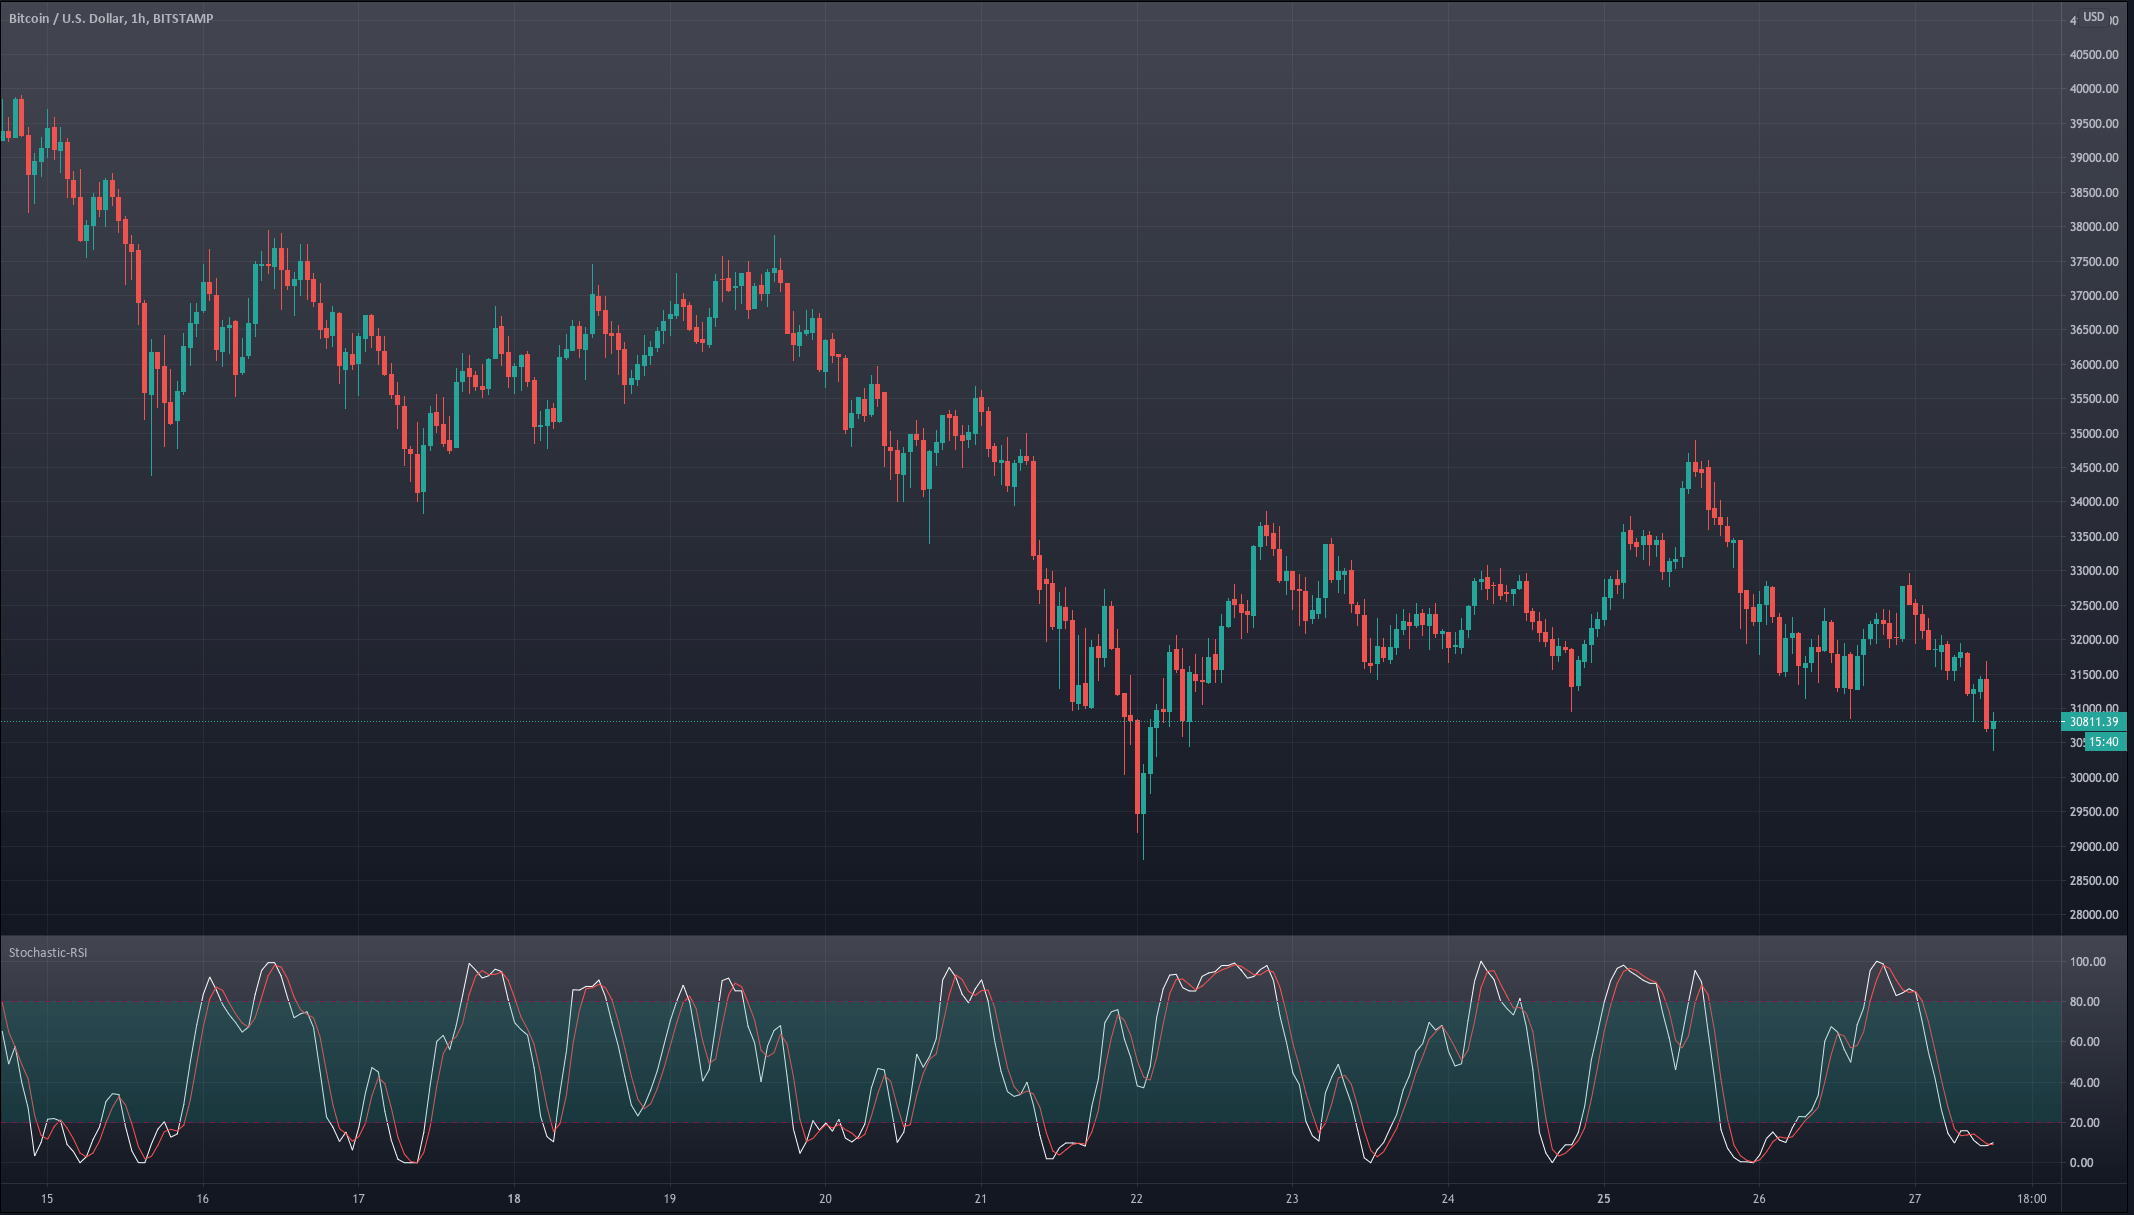


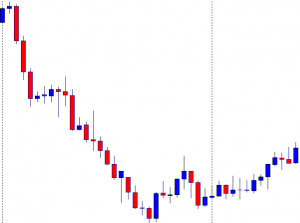
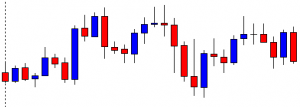
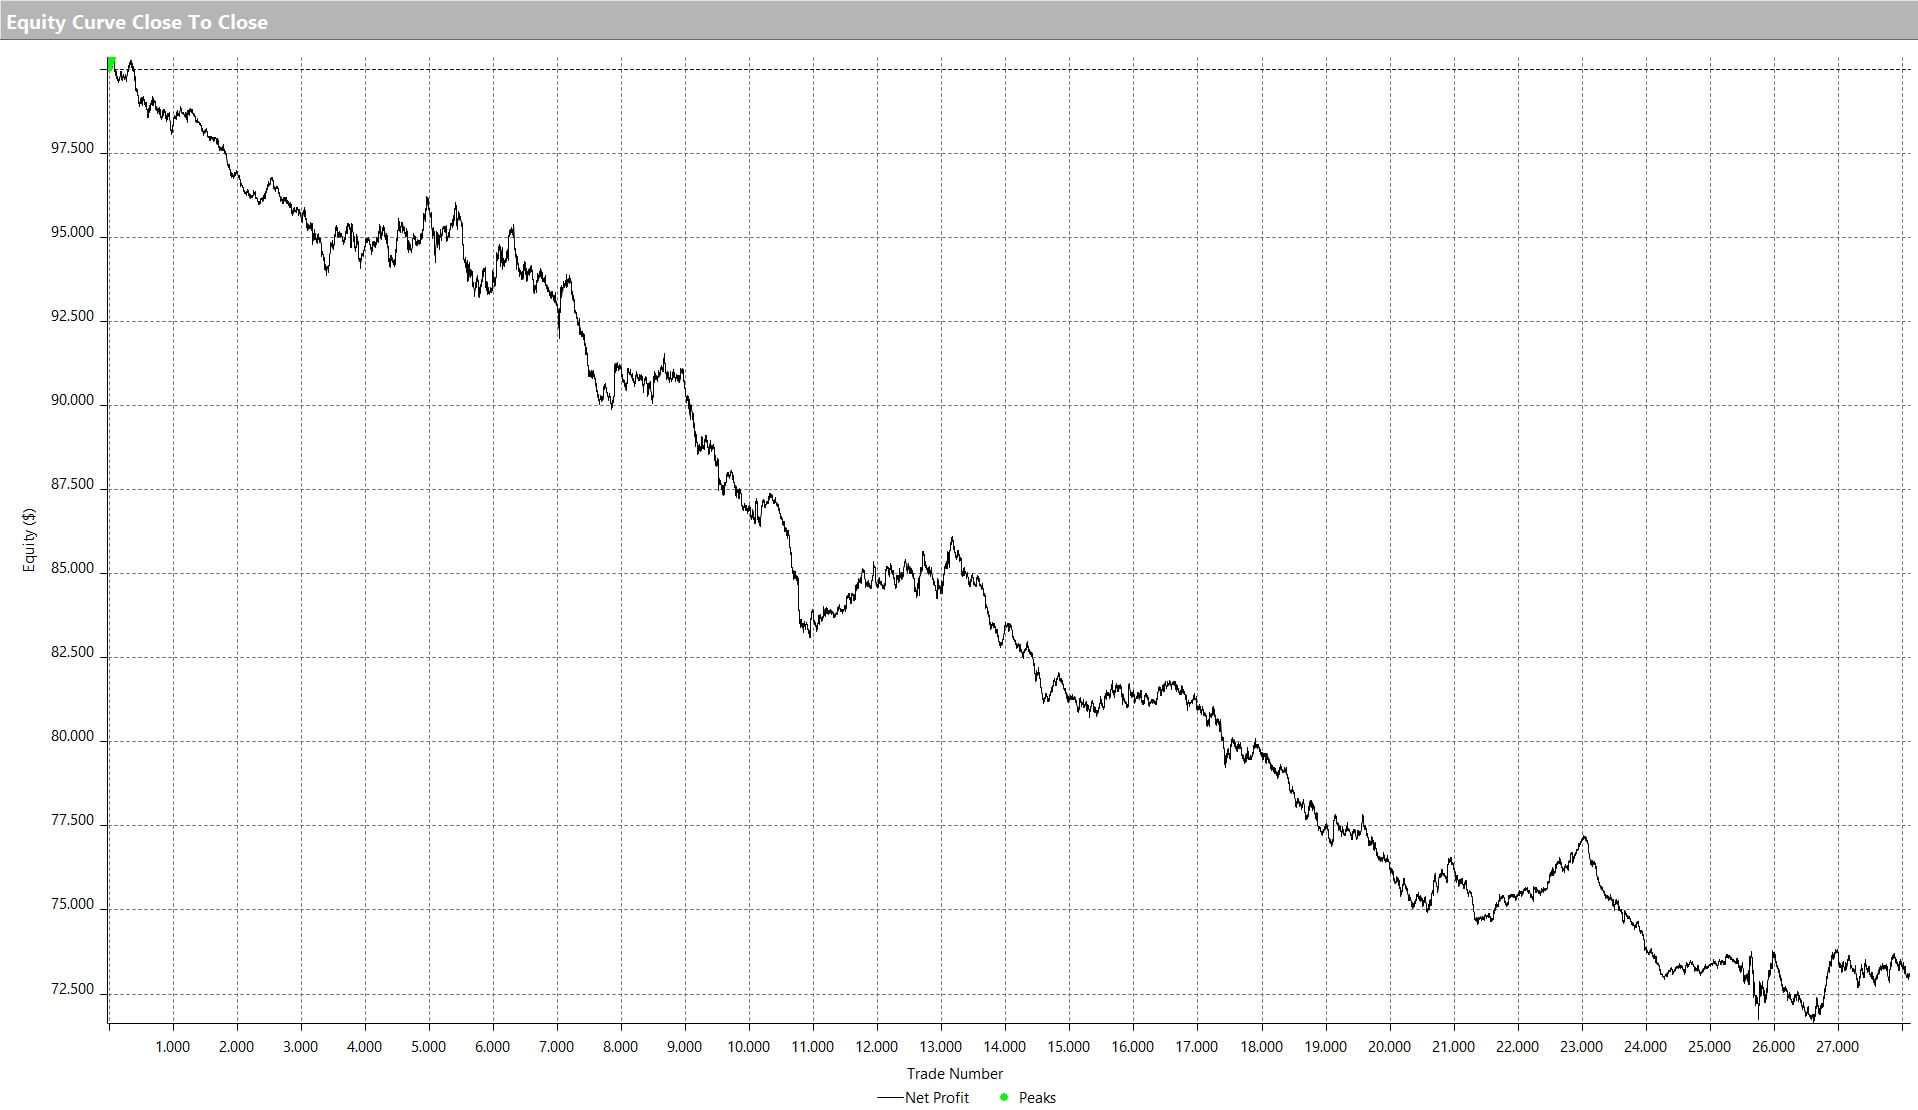
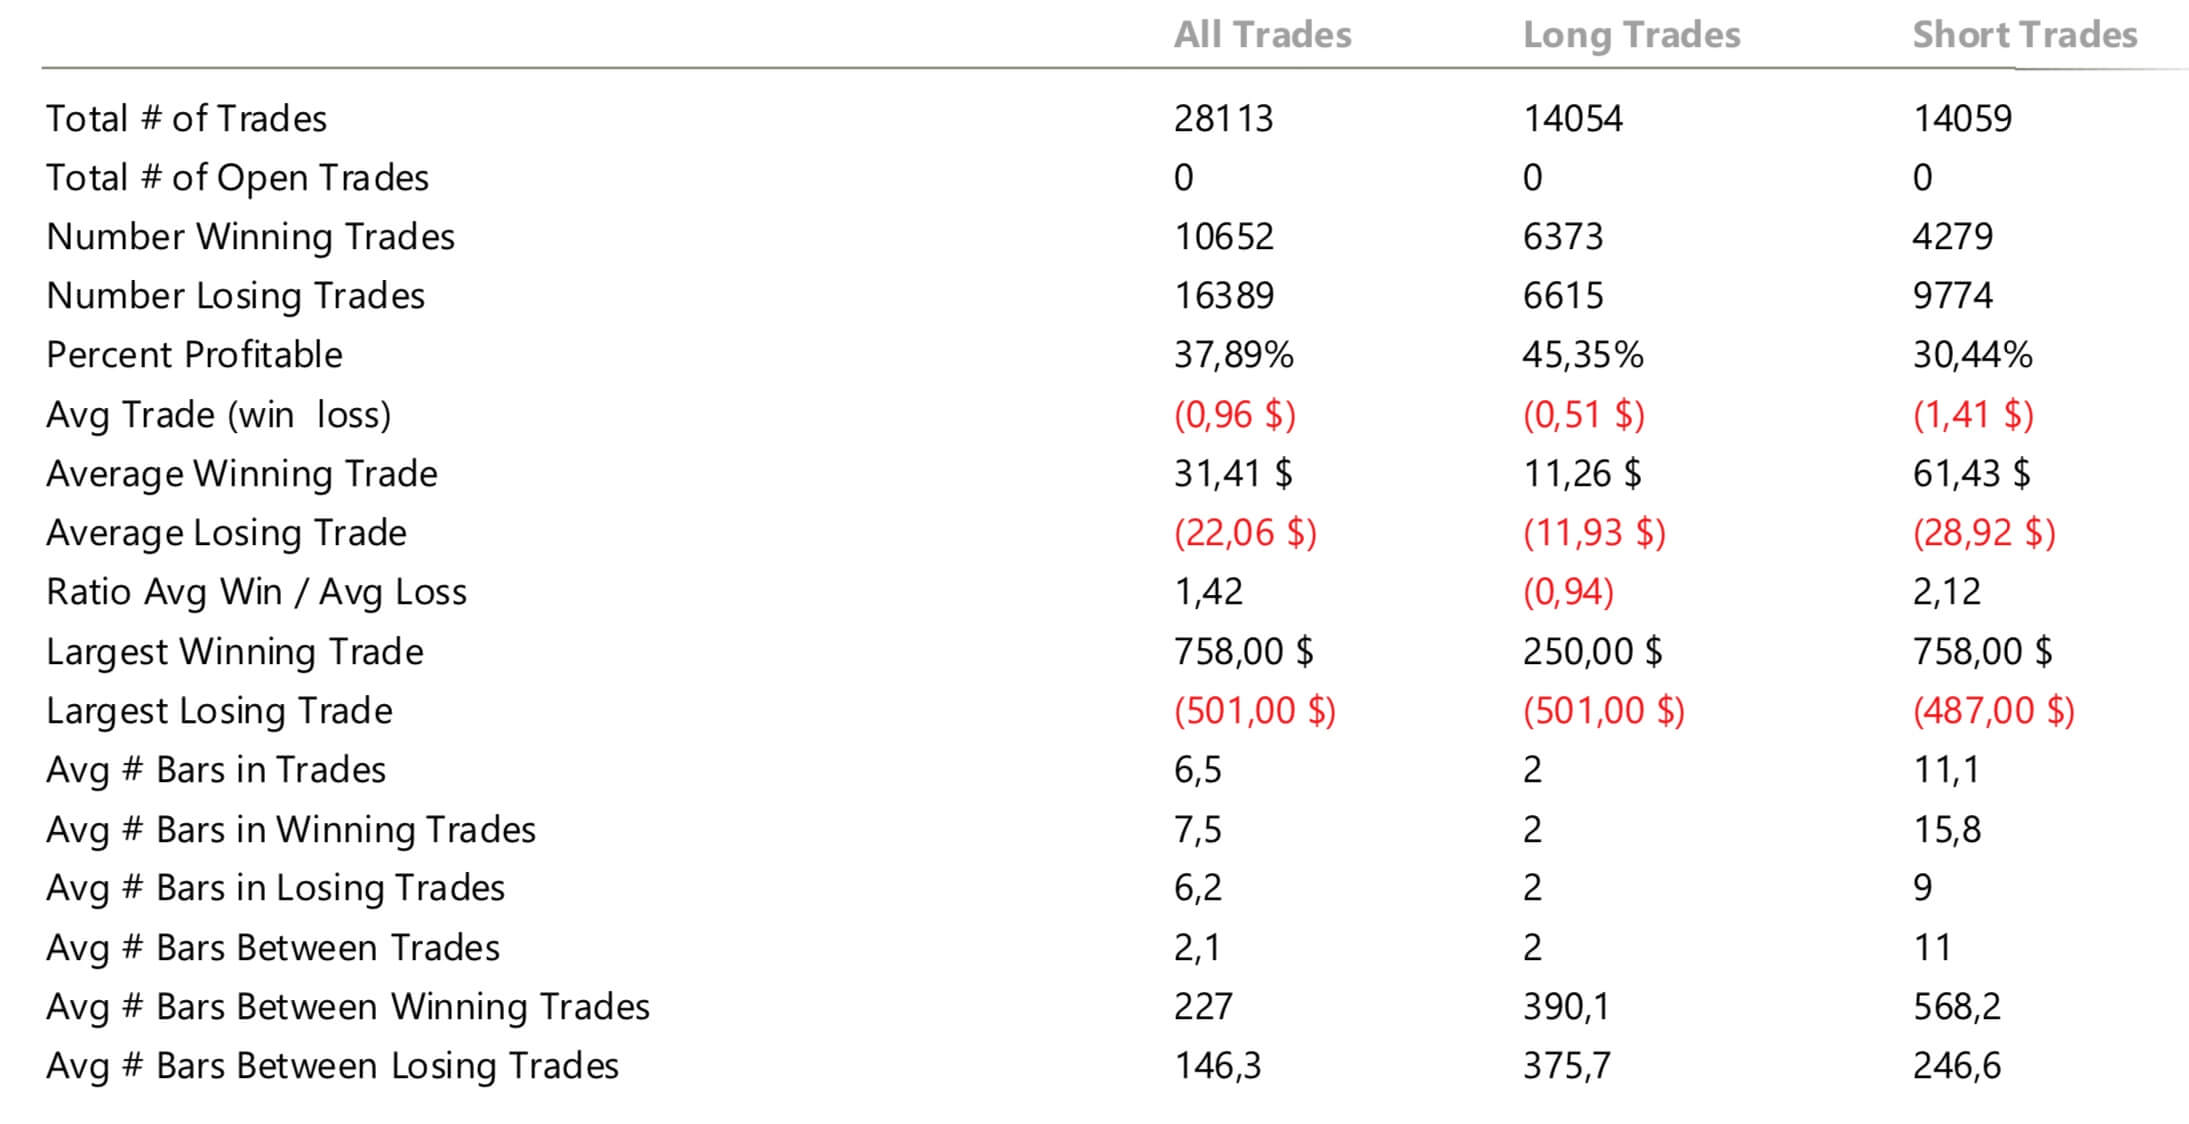
 The first step to see if the idea has merit is to test it in a historical sample under the market conditions it was supposed to operate. Of course, a trading idea is almost always referring to a market entry, as the concept is supposed to time the market. This entry is usually combined with a stop-loss and a
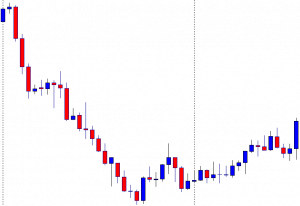
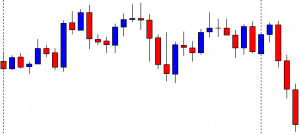
 After 100 backtested trades, the developer has enough information to detect the basic mistakes of the strategy. Maybe the entry has a large lag that hurts profits, or, worse, it is too early, thus triggering the stop-loss too often.

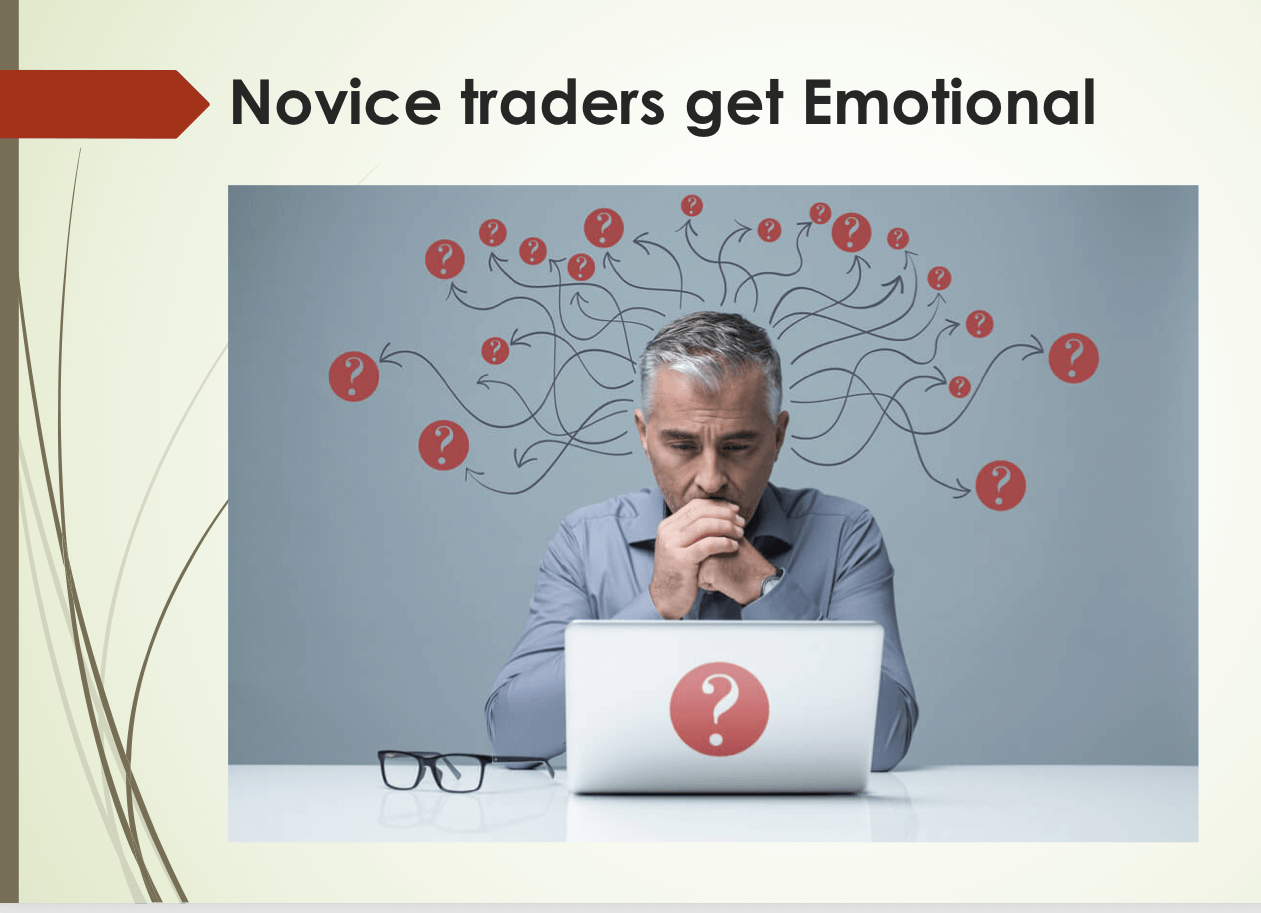 Traders, especially novice traders, get emotional and lose money because their emotions interfere and stop making rational decisions in the battle’s heat. Thus, the first thing to avoid is
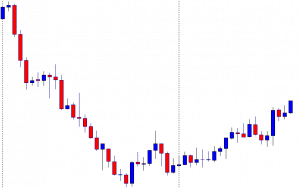
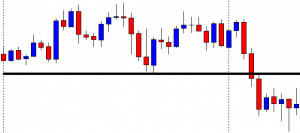
  The rubber band idea describes the price as if it was a rubber band or spring. When it moves far away from equilibrium, we expect the force to pull it to its center to increase and eventually drive it back to equilibrium.
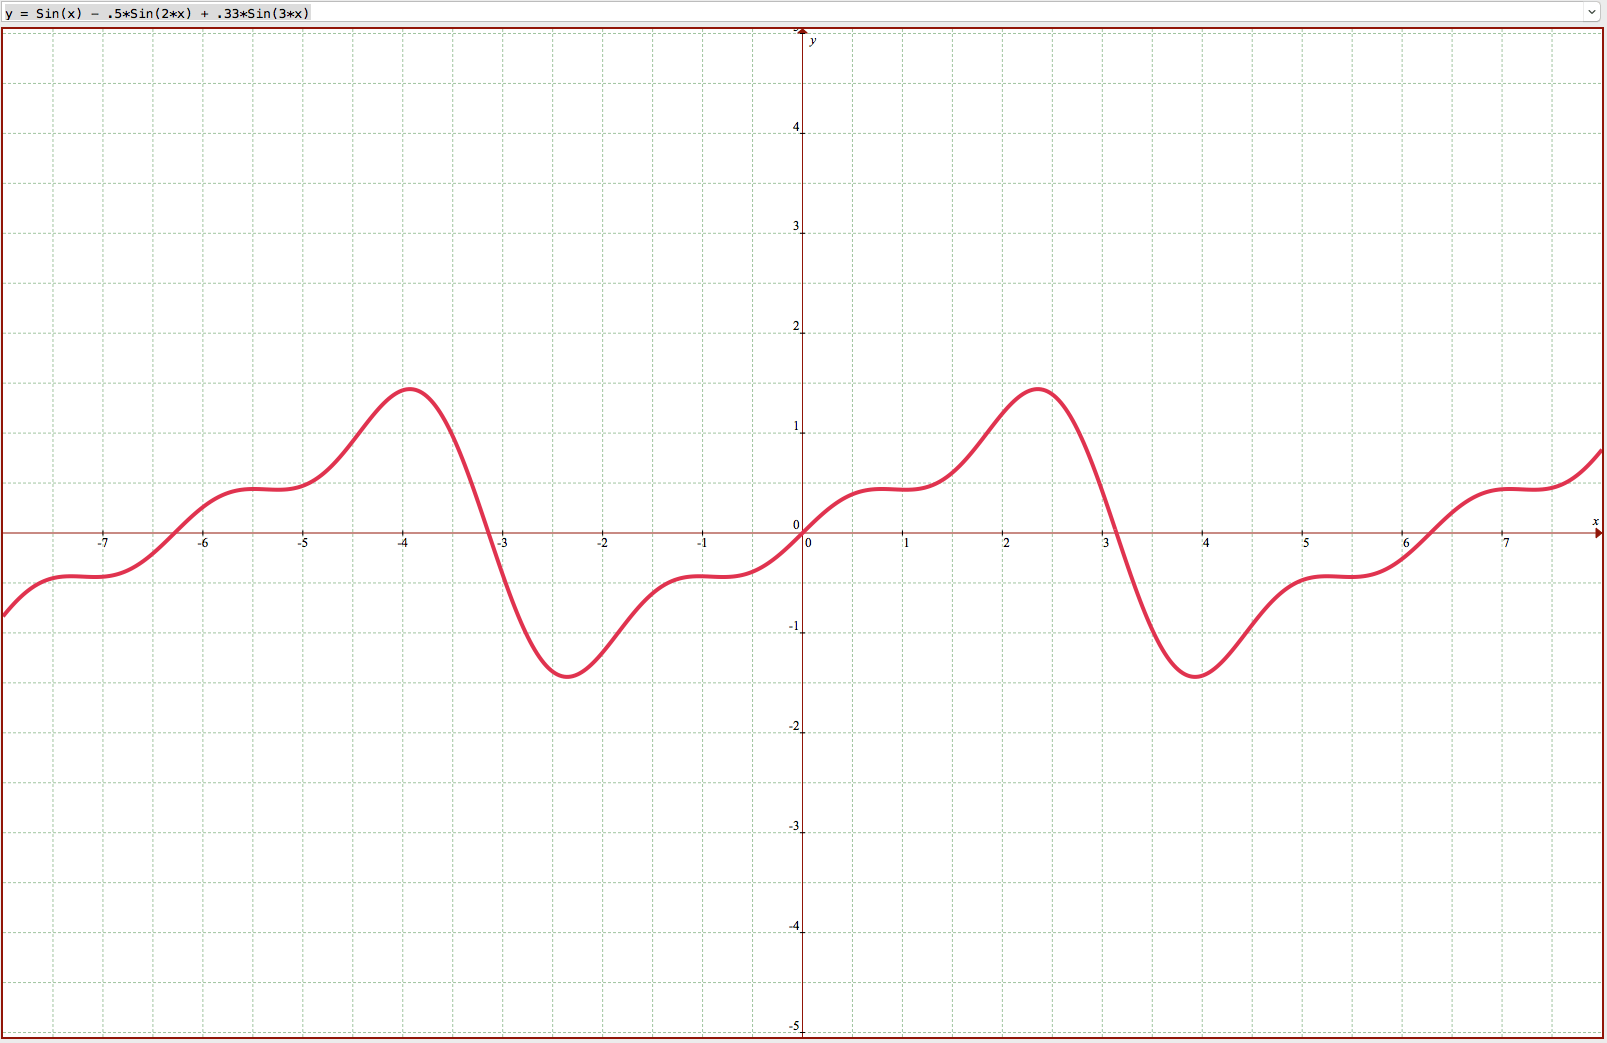 fferent waves are in sync, and chaotic moves occur when waves desync.


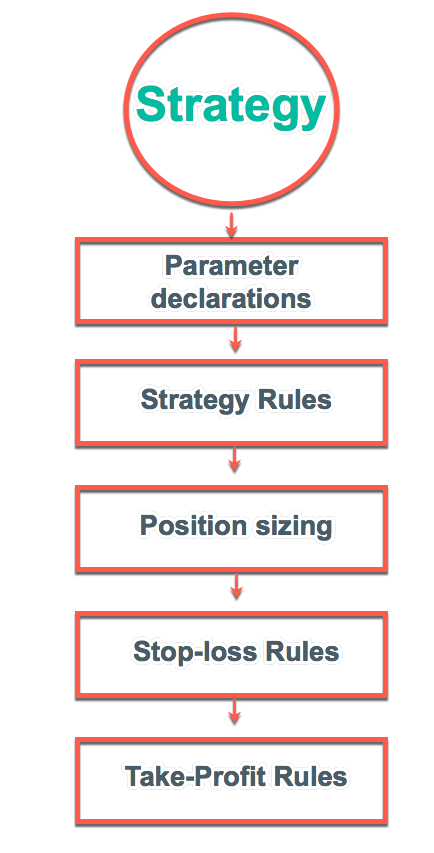
 As said in our previous video, financial markets are unbounded territories where each trader needs to set his own rules; otherwise, they will be influenced by his emotions and fail. A trading system is their set of rules that enable them a long-term success.
 The chosen timeframe should match the availability to trade. A trader with a day job would need to select a daily or a 12-hour timeframe, whereas a full-time trader could use shorter frames, such as 15-min, one, two, or four-hour timeframes.
 A permisioning filter is a way to avoid trading under determined circumstances. It can be a filter that allows only trading in the direction of the primary trend or an overbought/oversold sign that should be on for a determined candlestick or pattern formation to be valid.

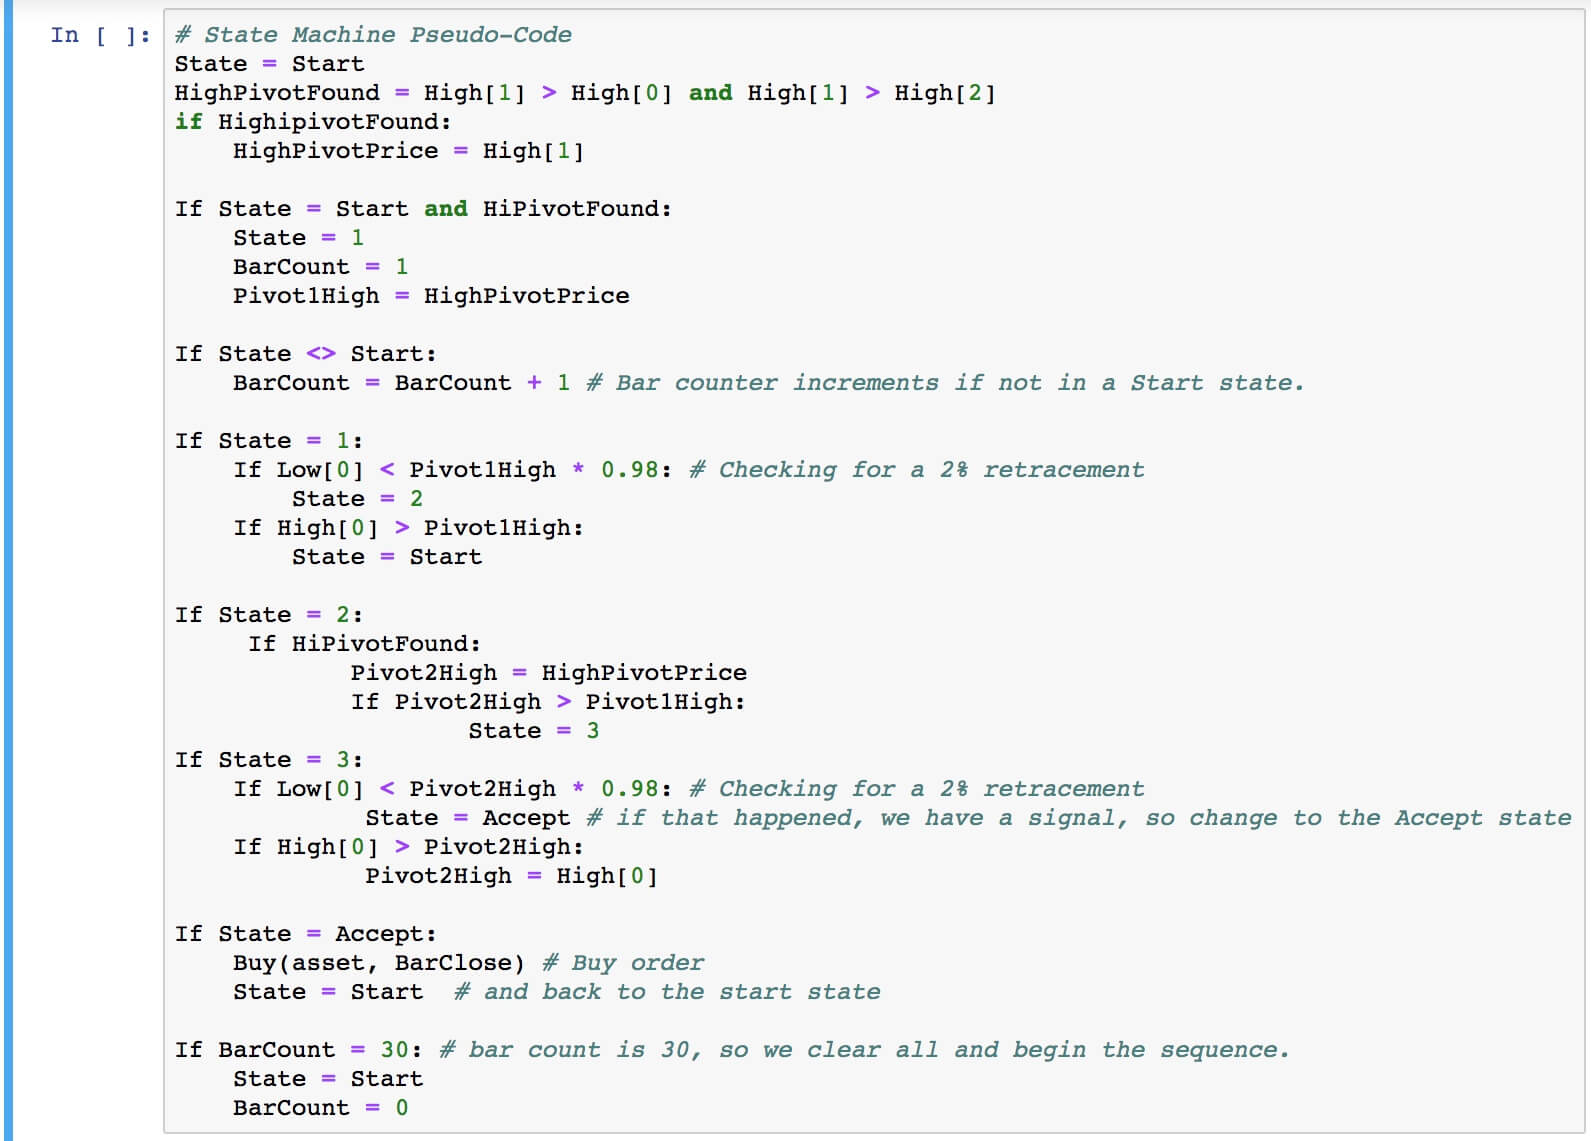
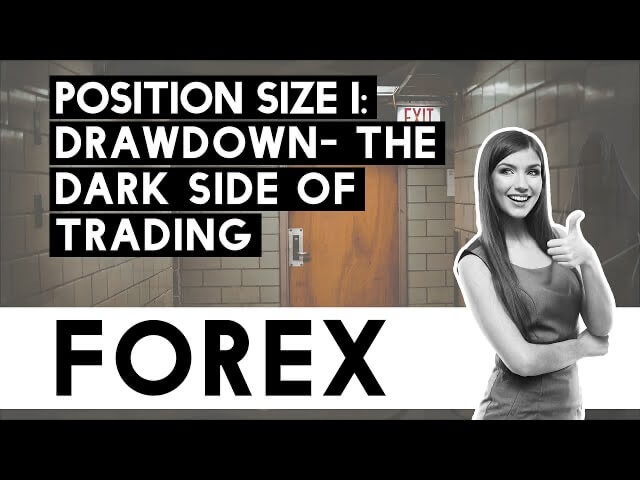
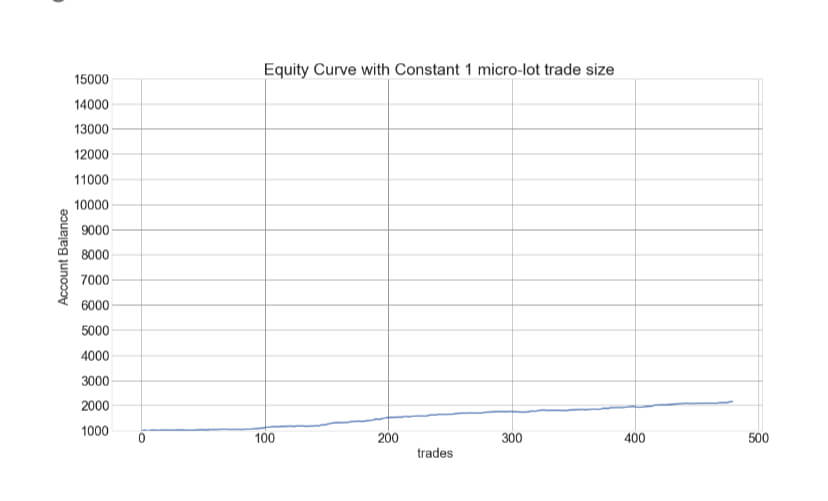
 Position sizing is the part of your plan that tells you how much risk you should take on a trade. We have had a