Categories
Chart Patterns Forex Daily Topic

Chart Patterns: Ascending Triangles

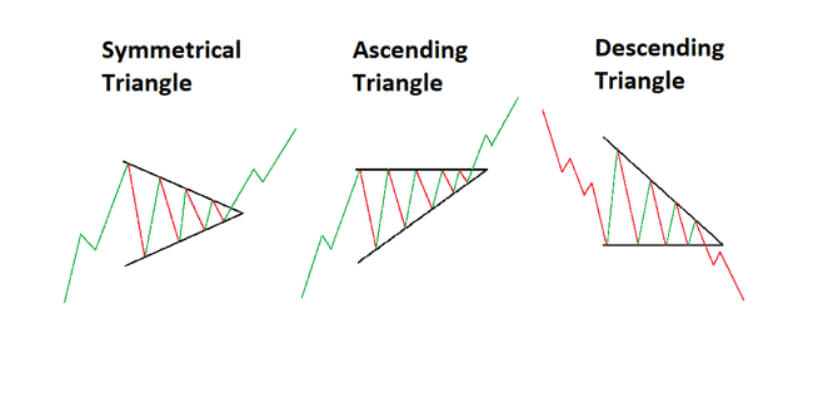
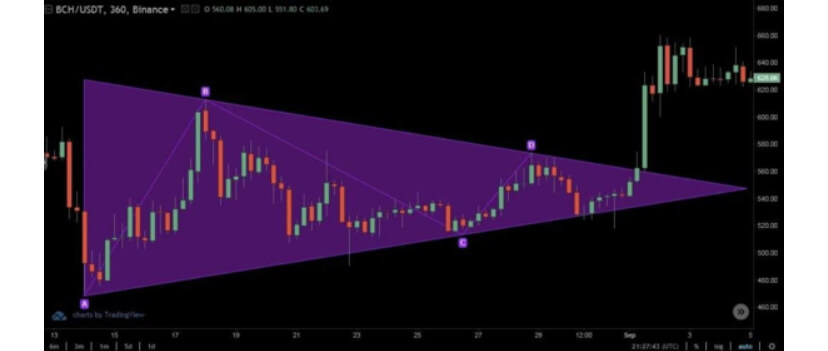
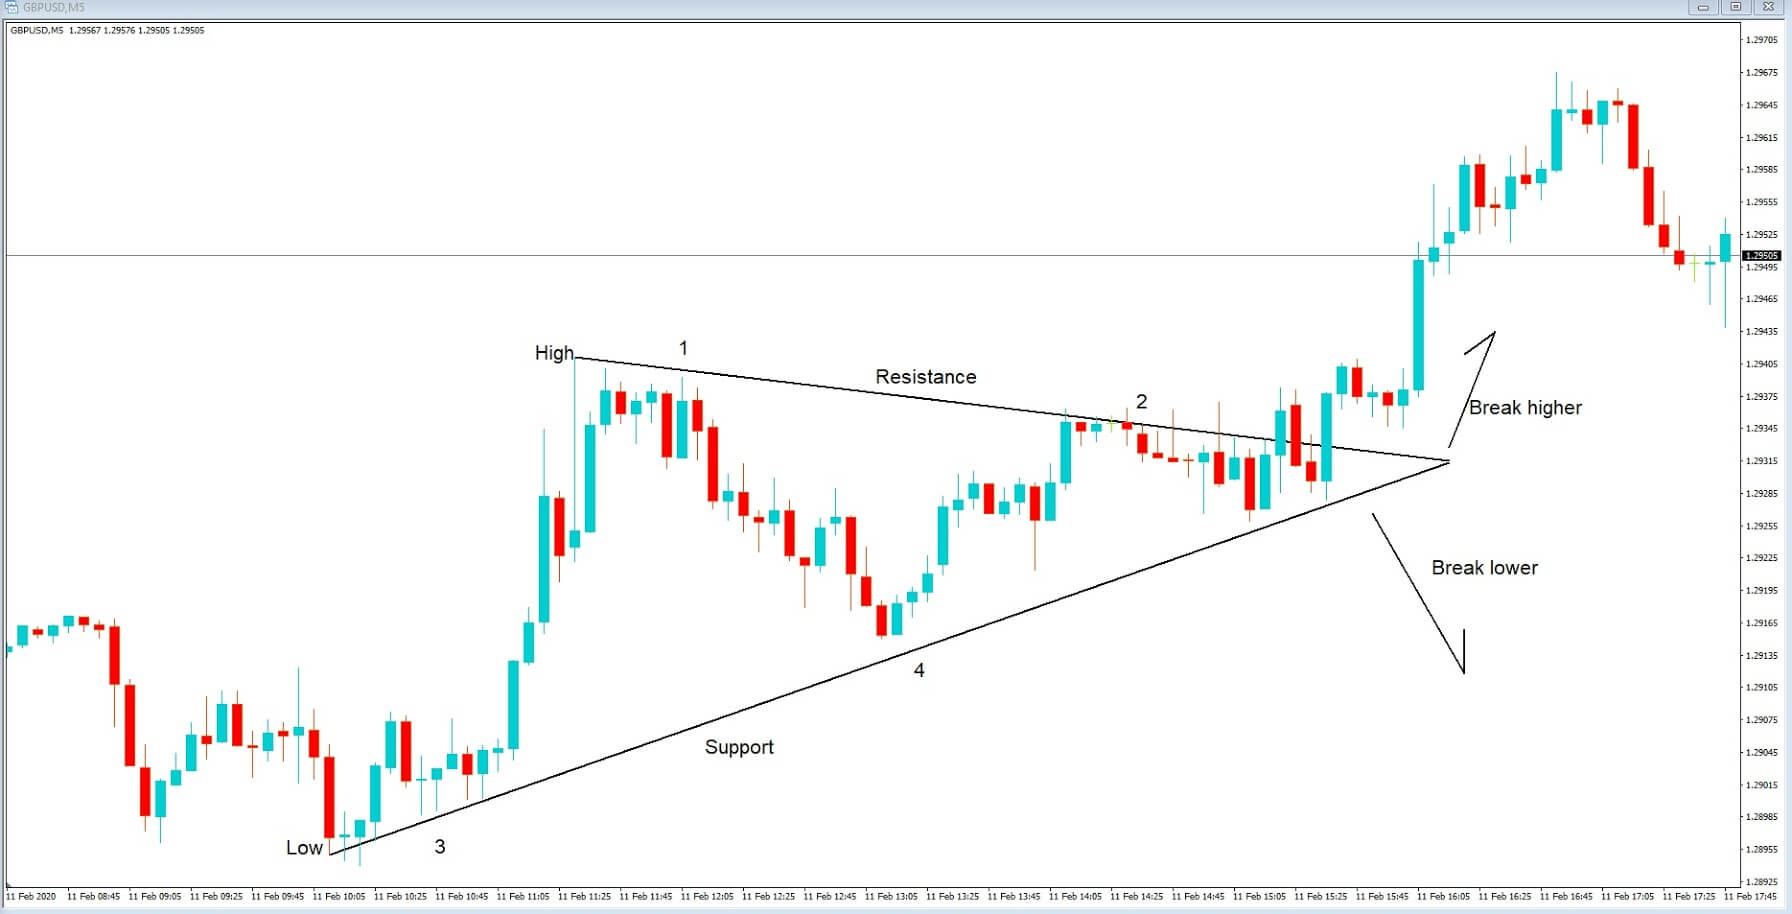
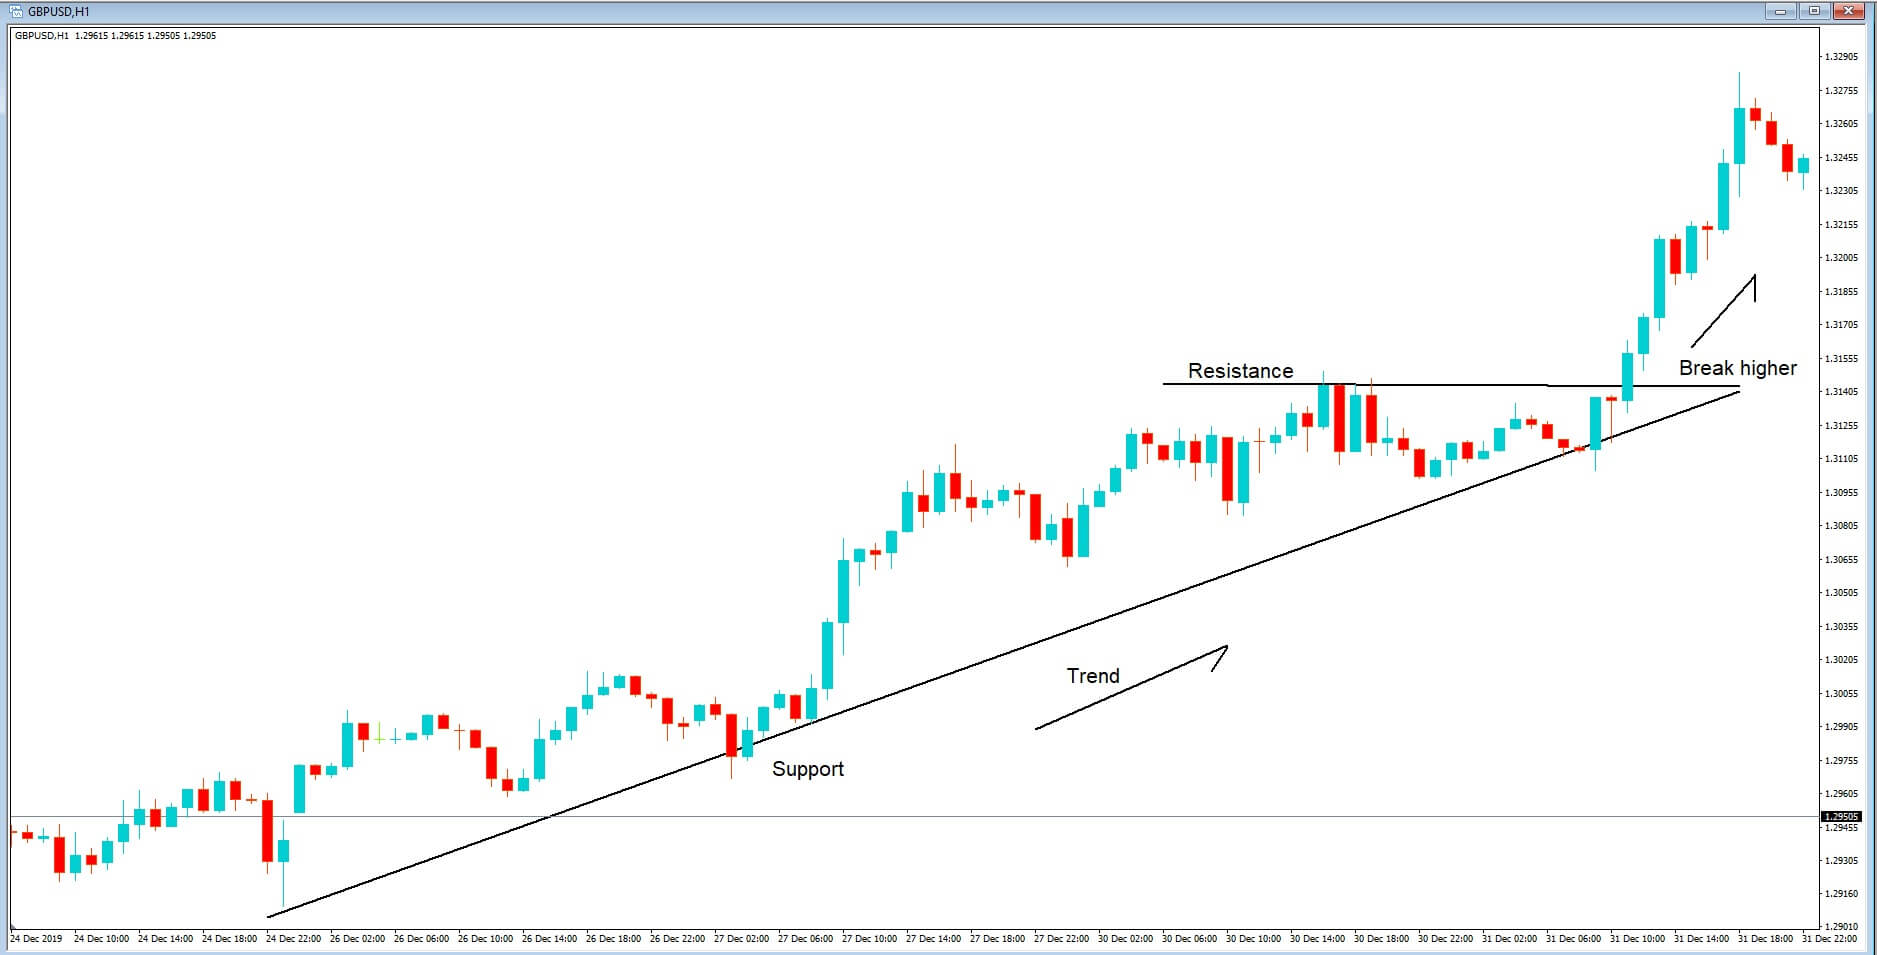
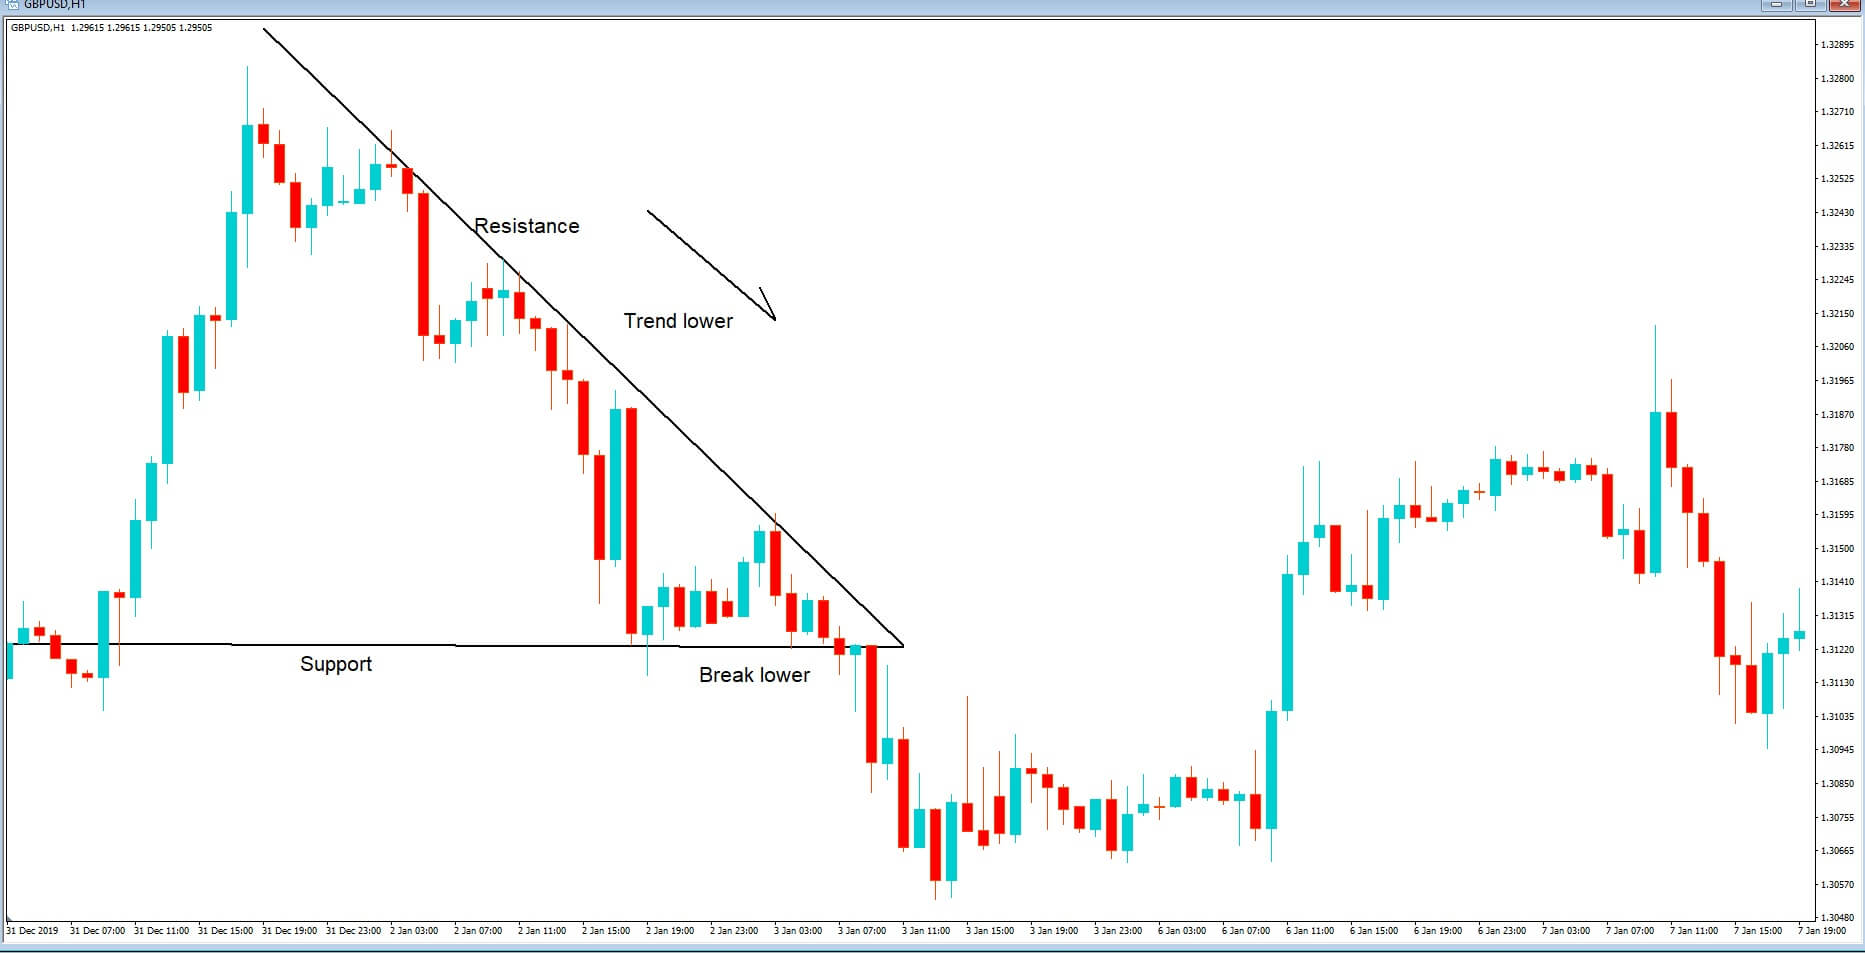
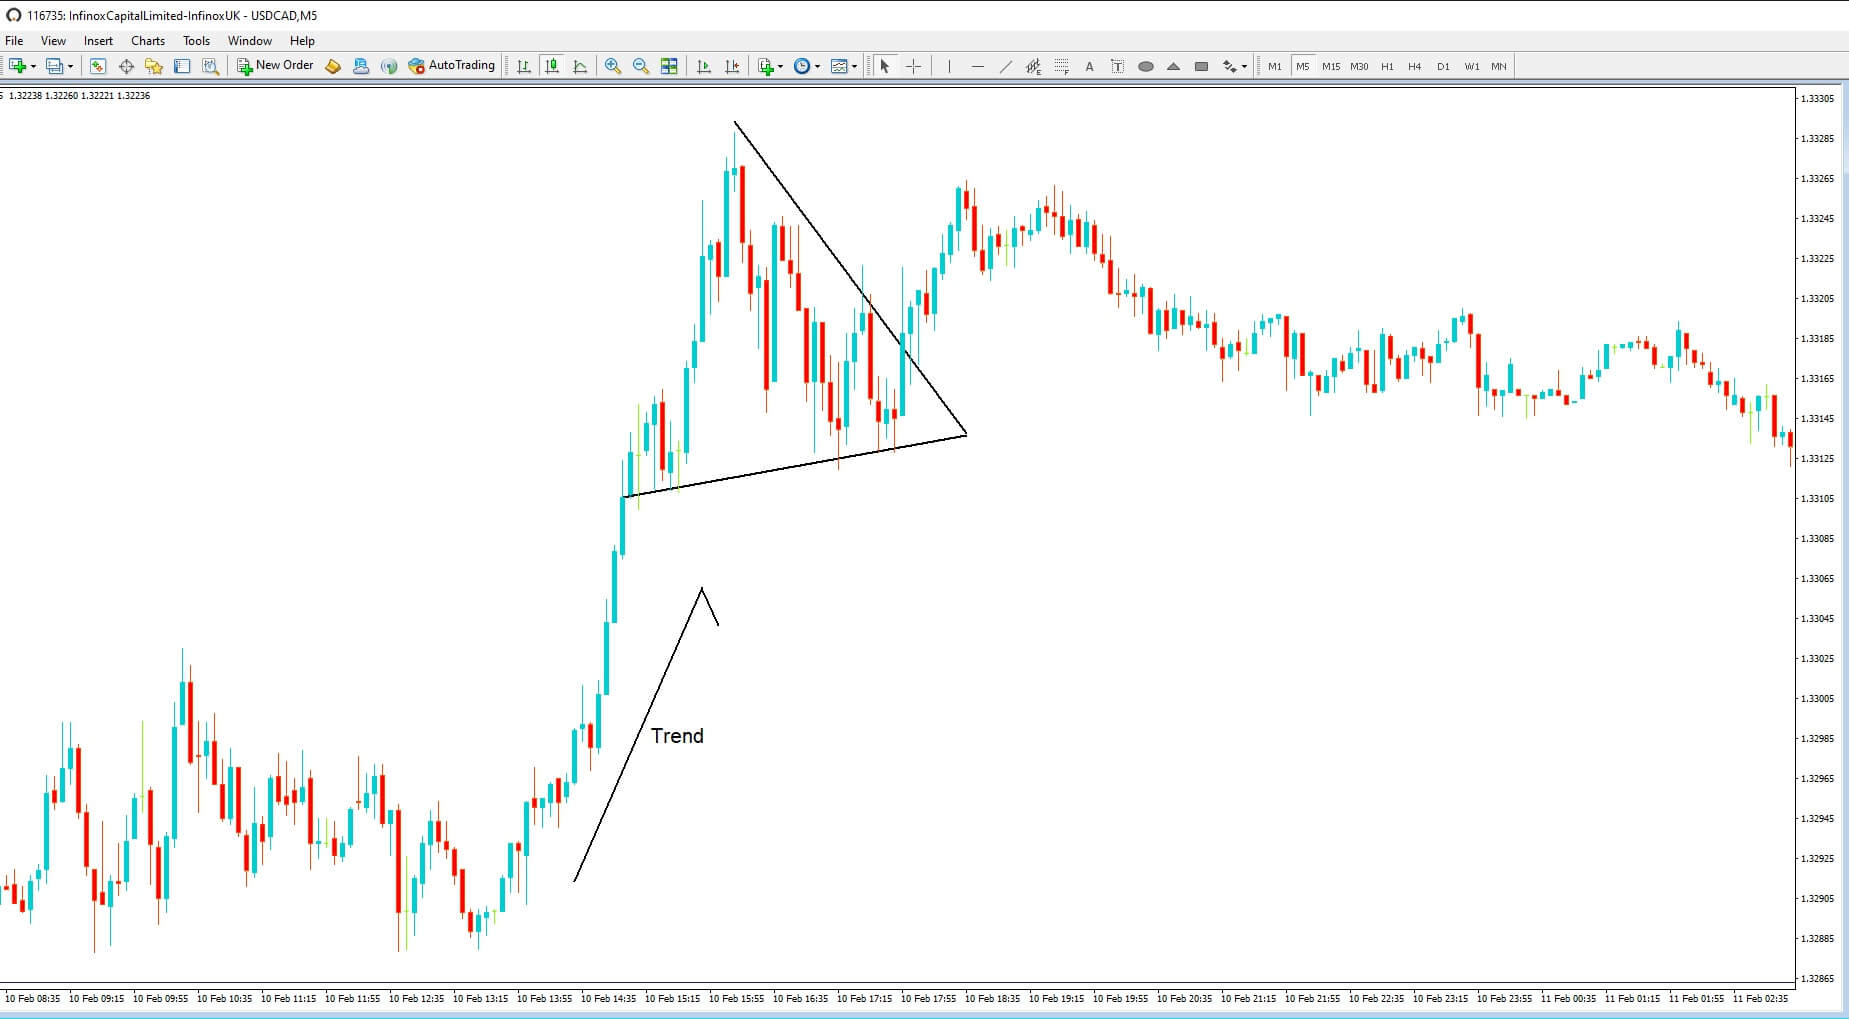
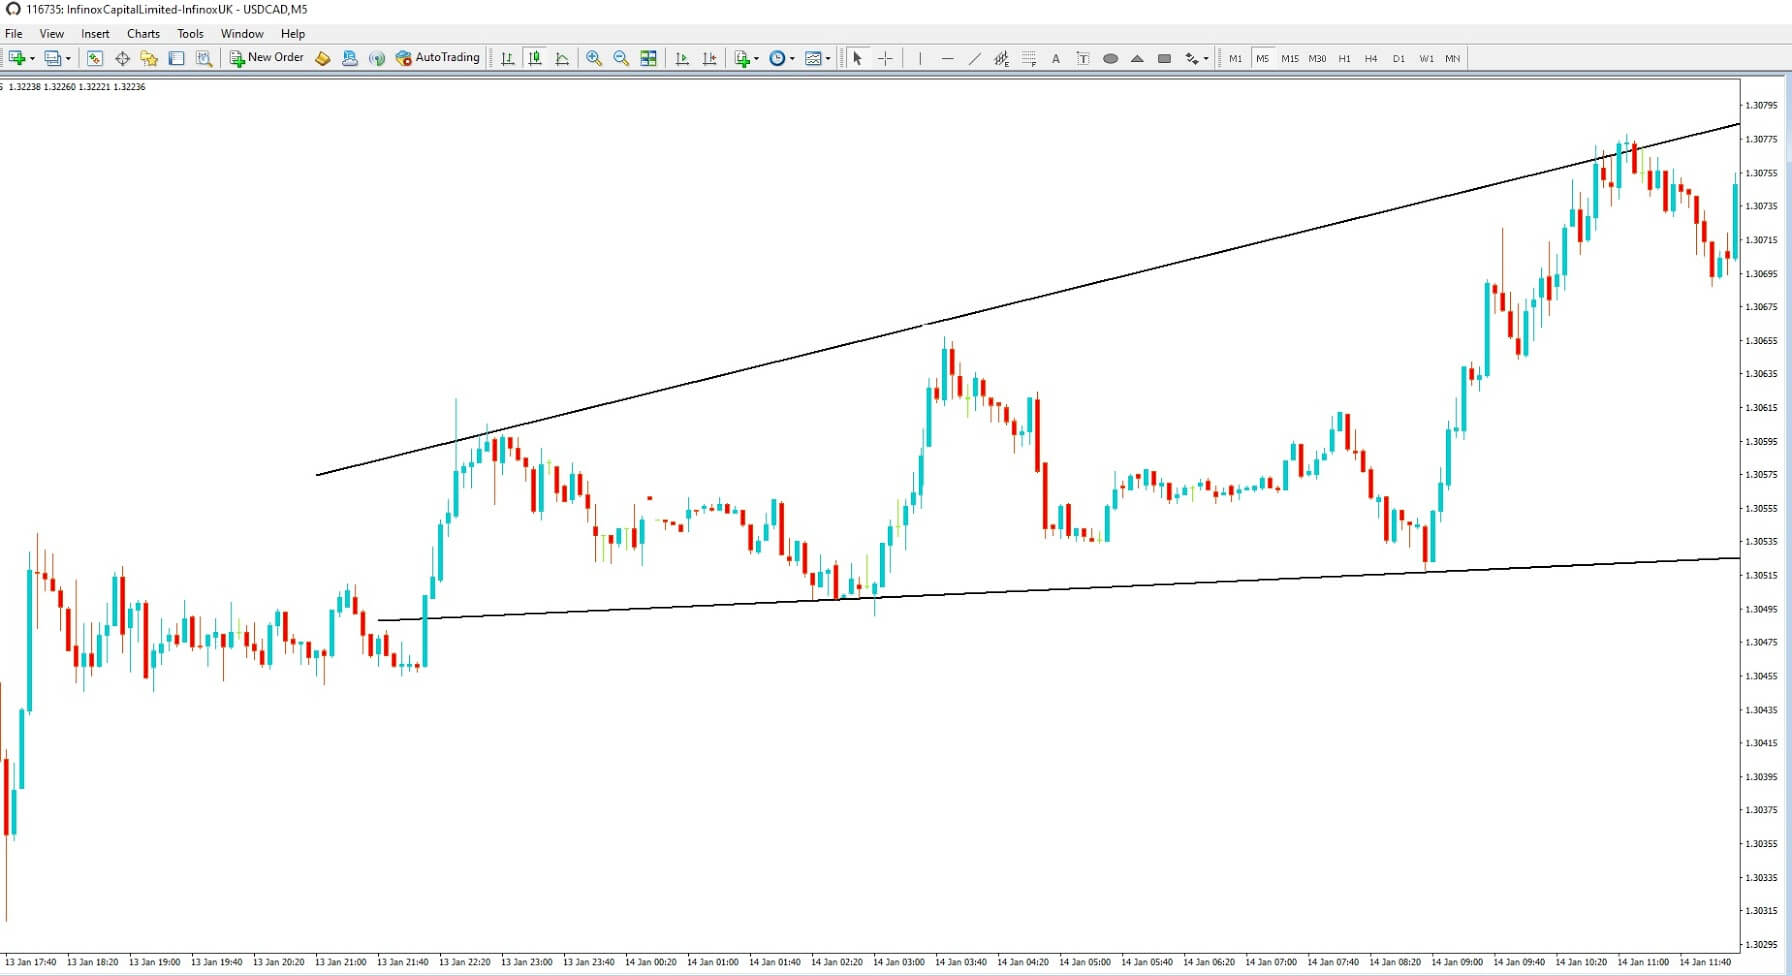
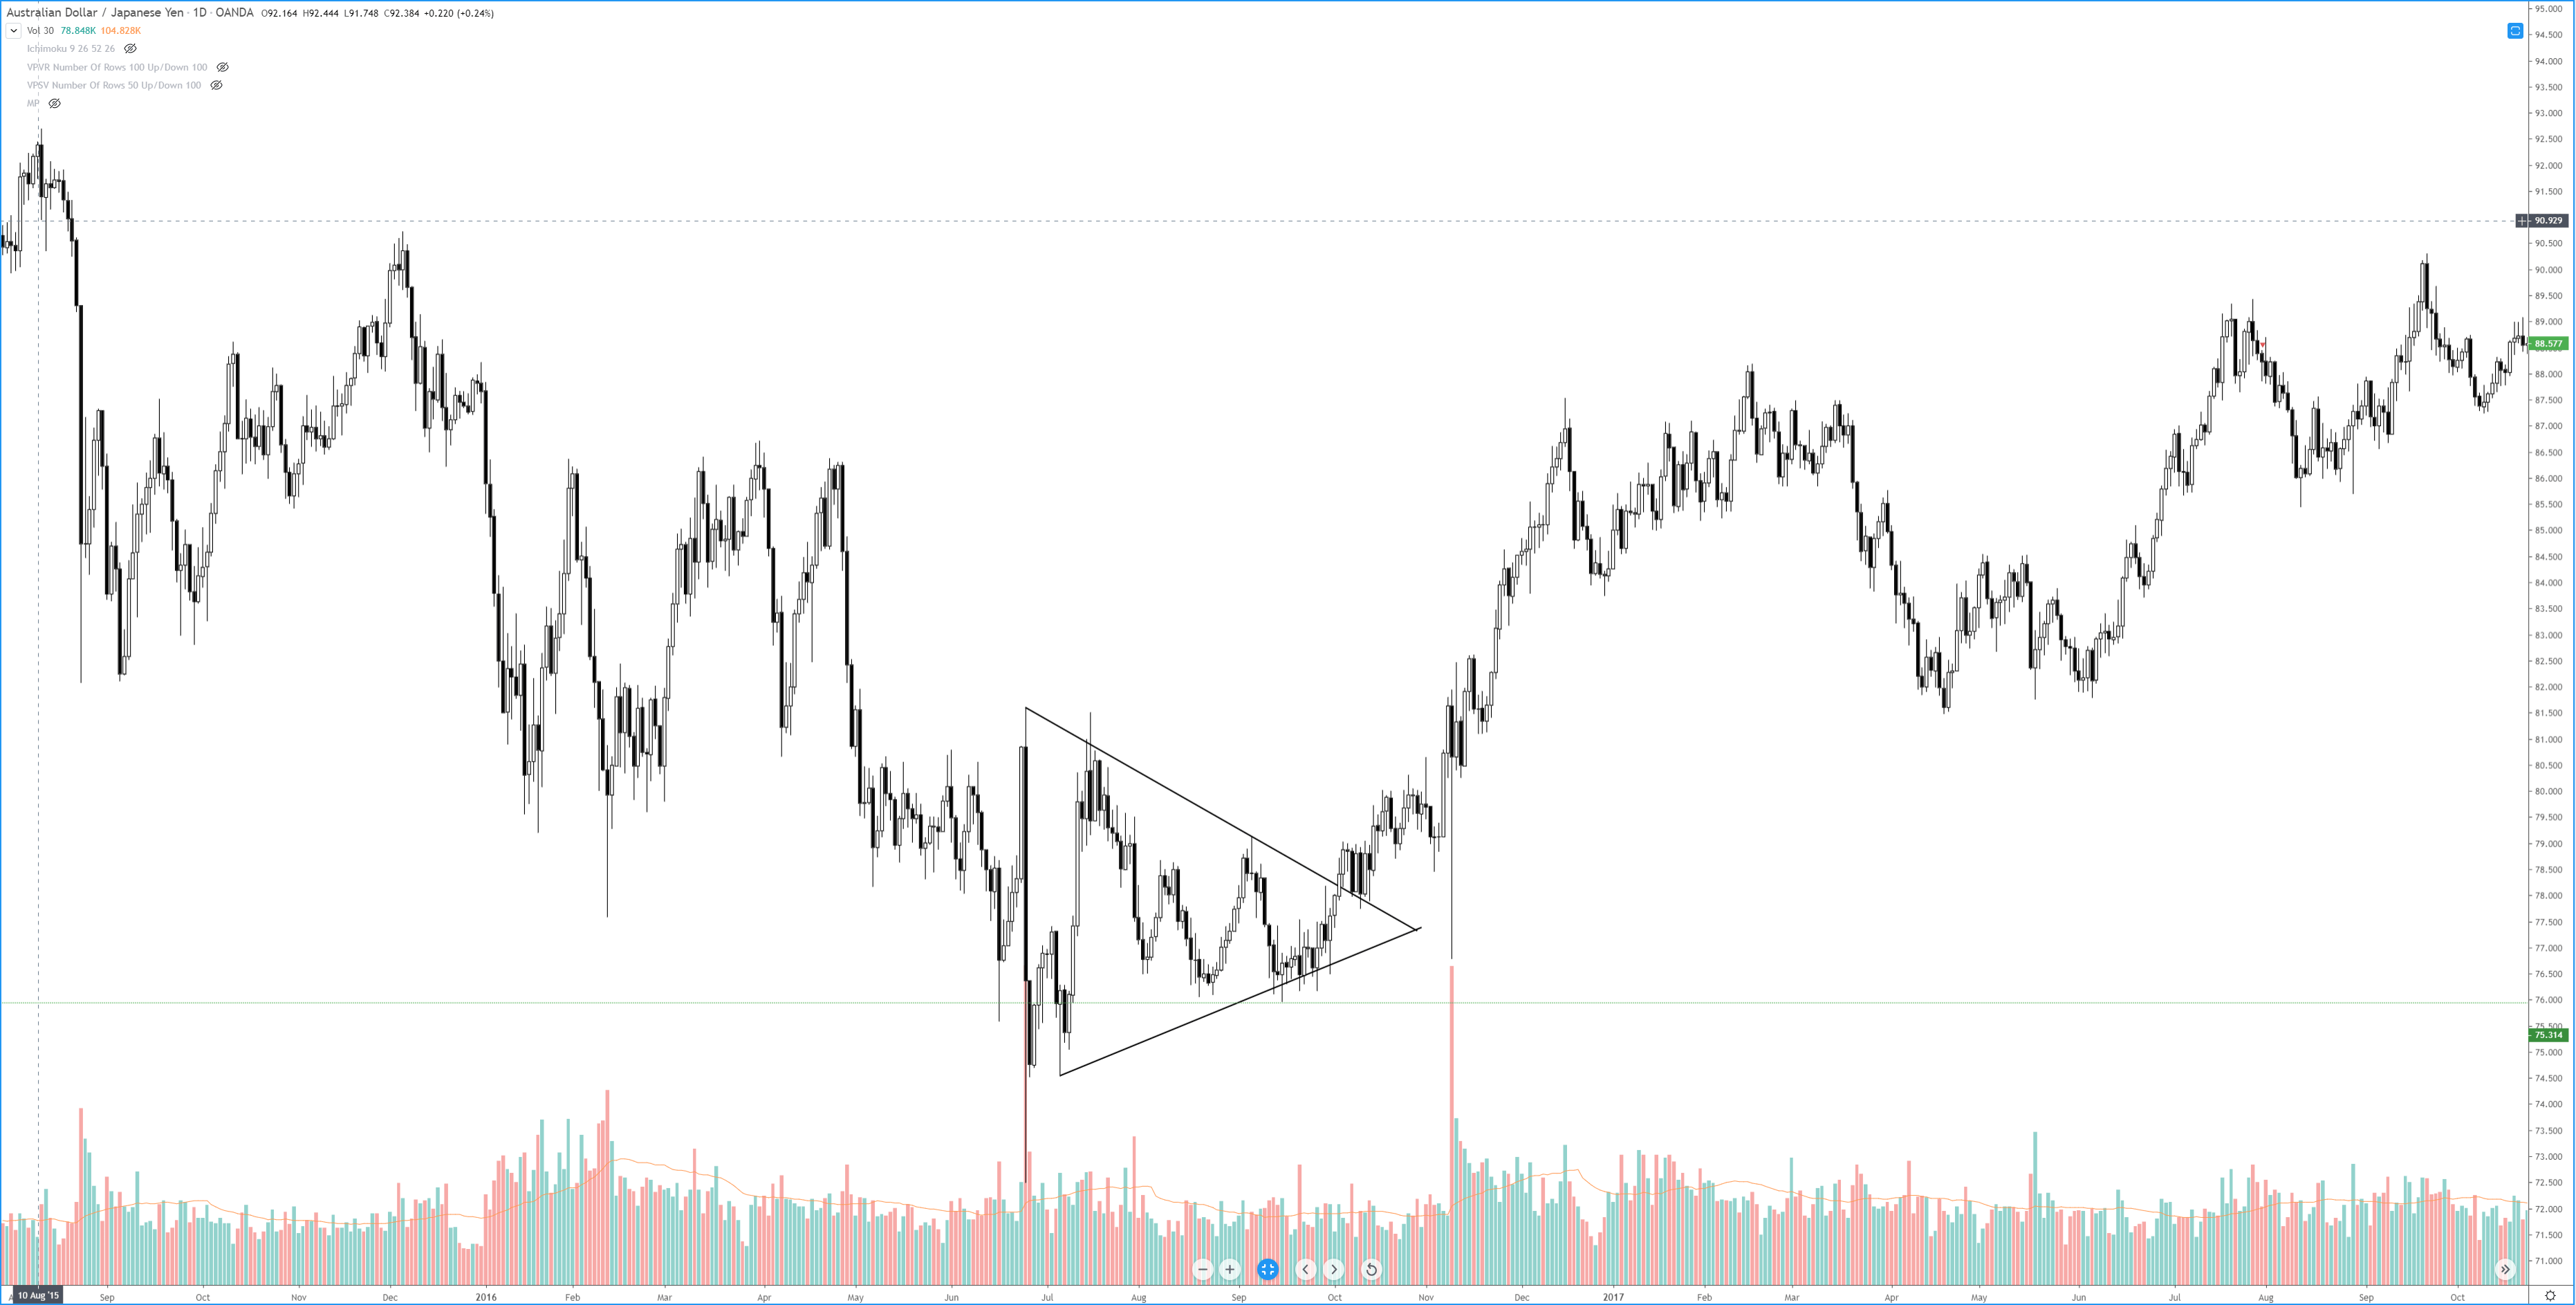
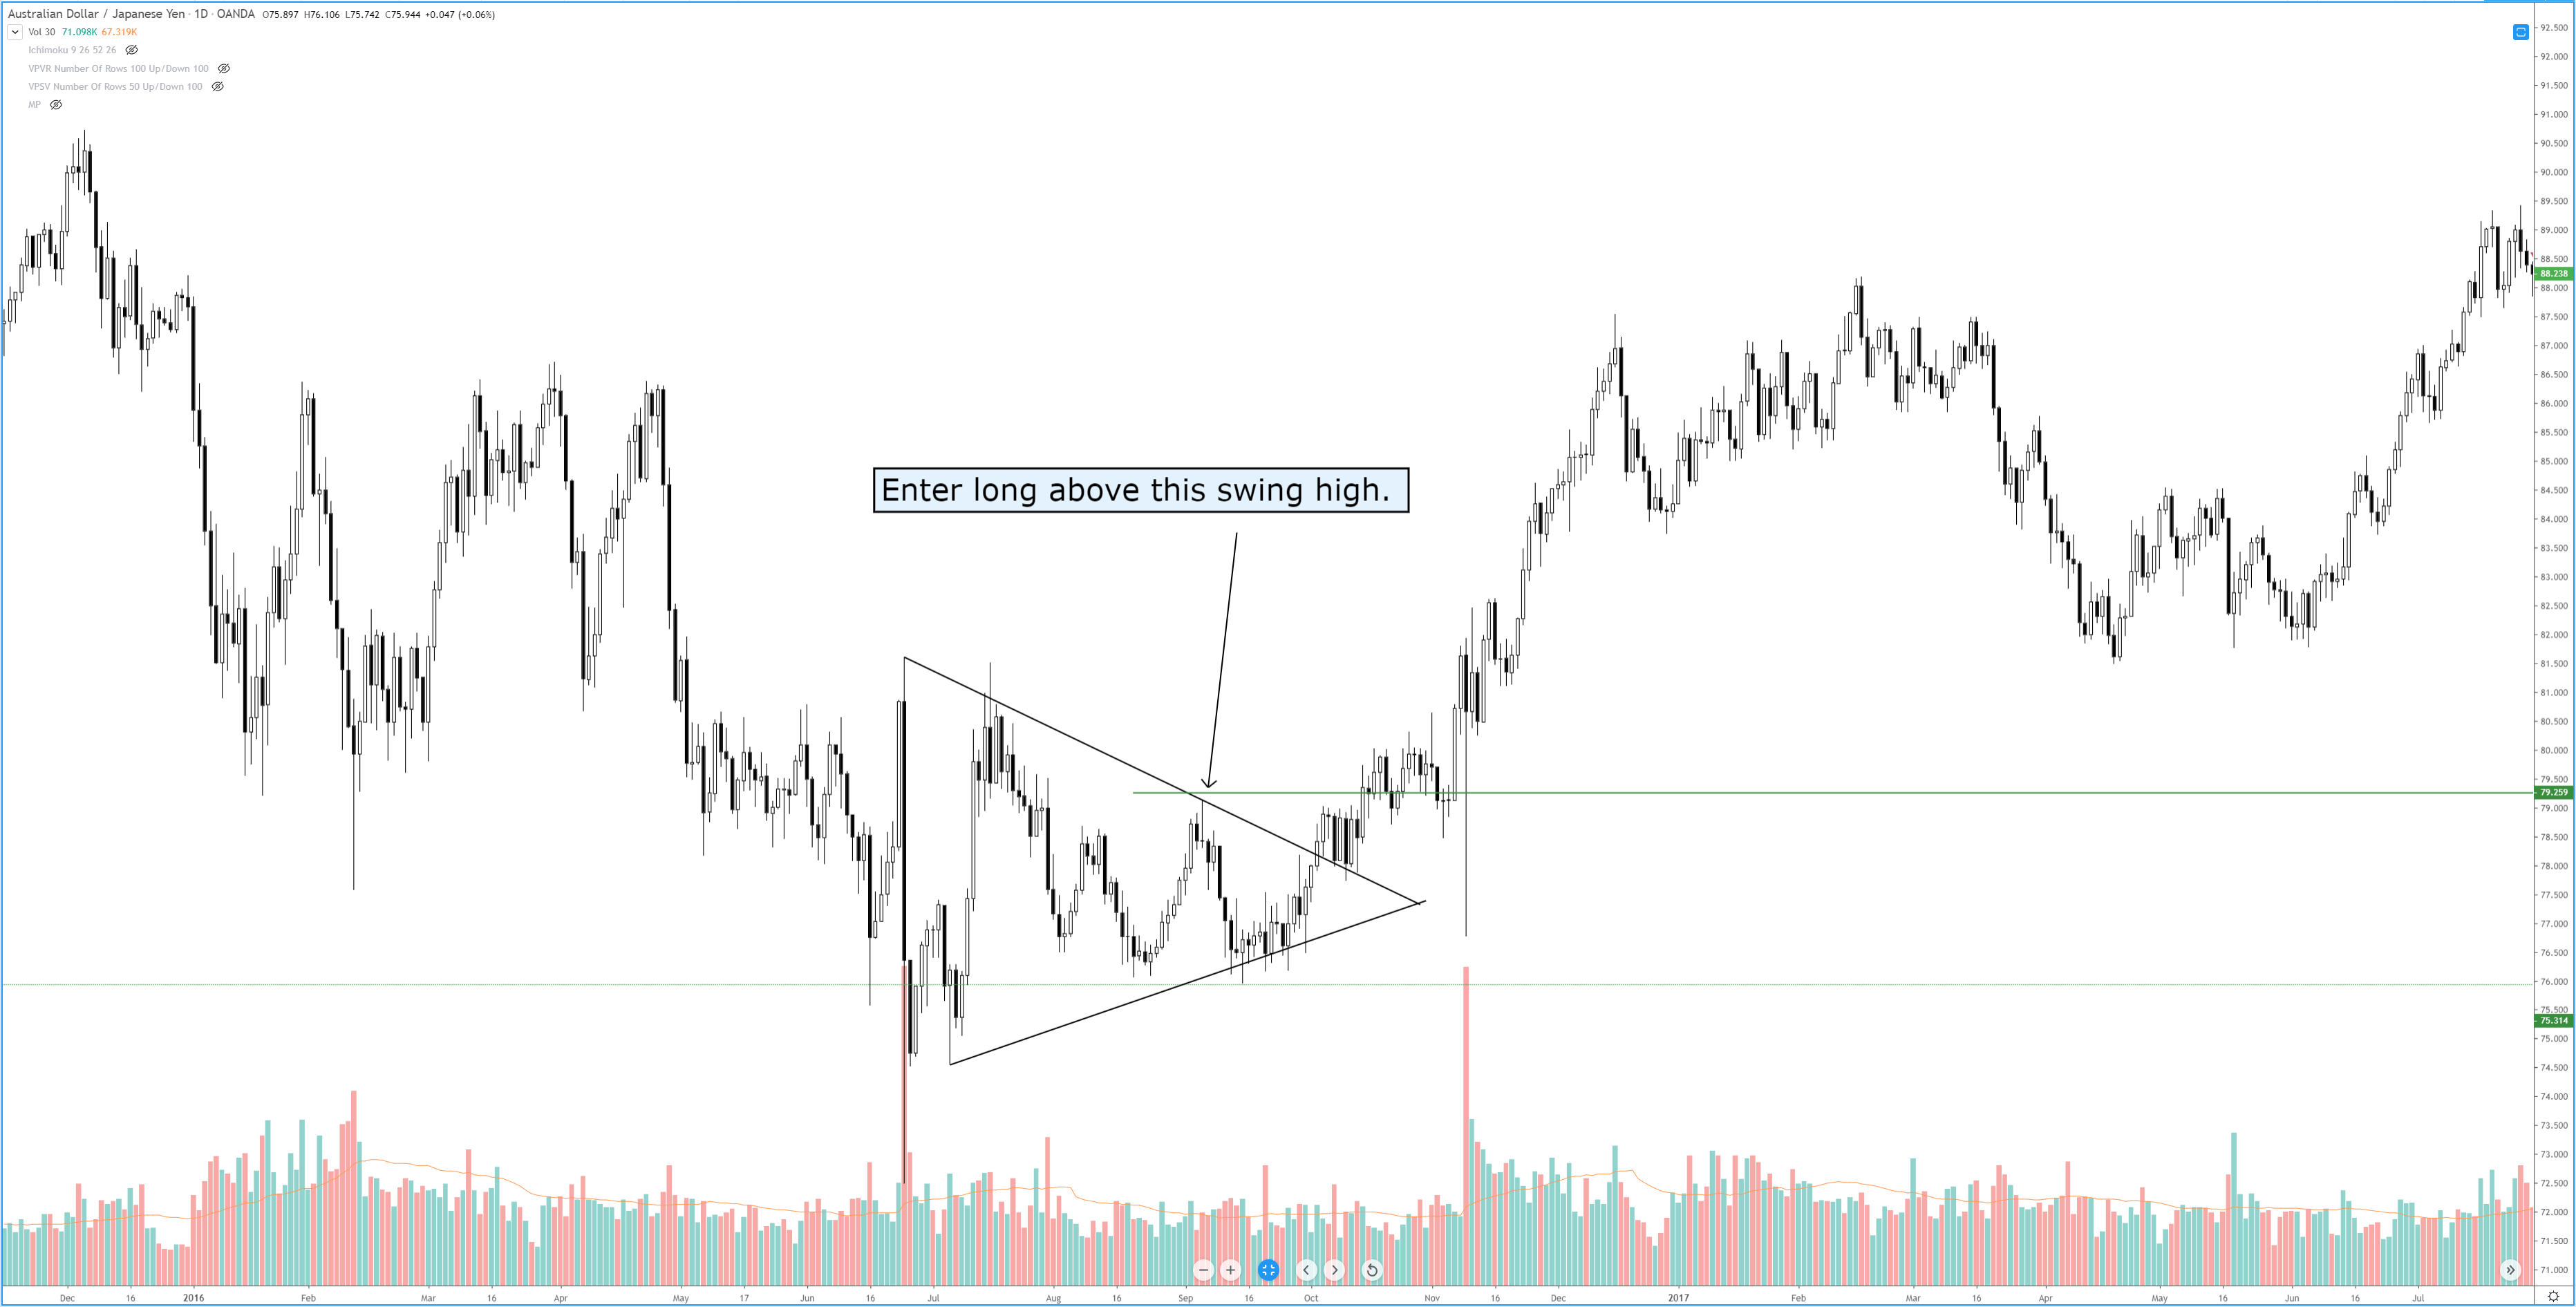
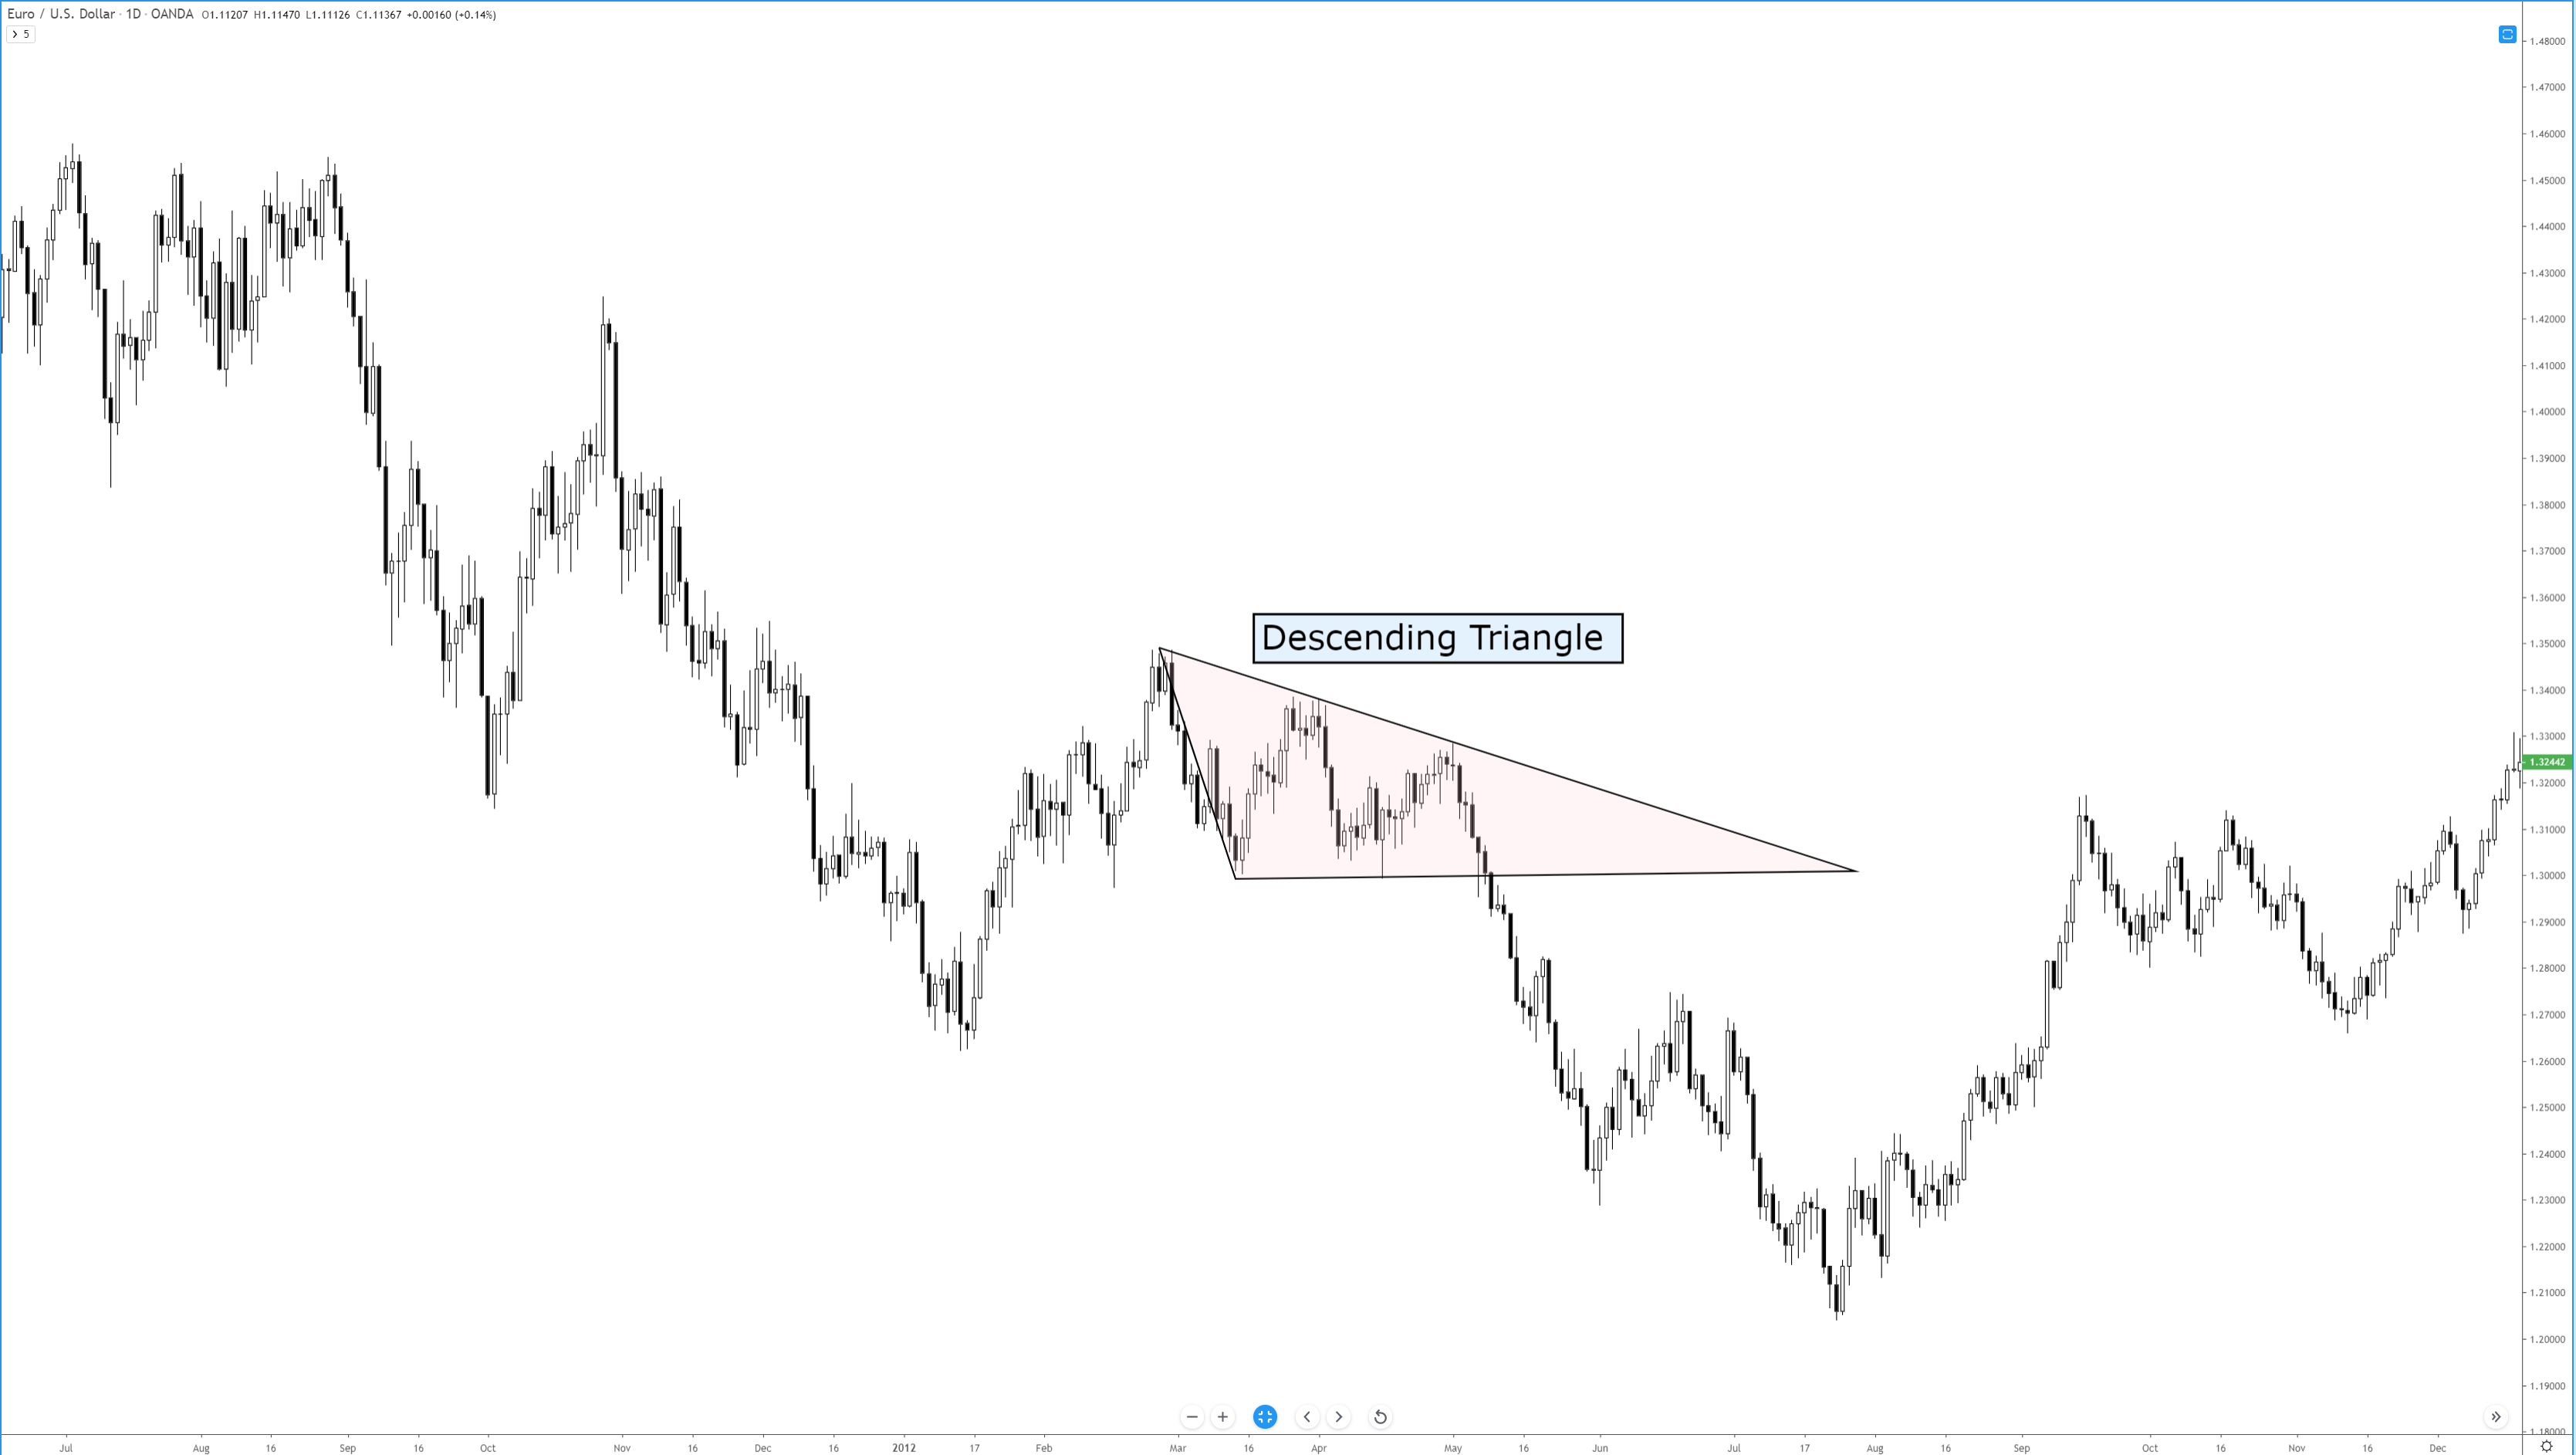
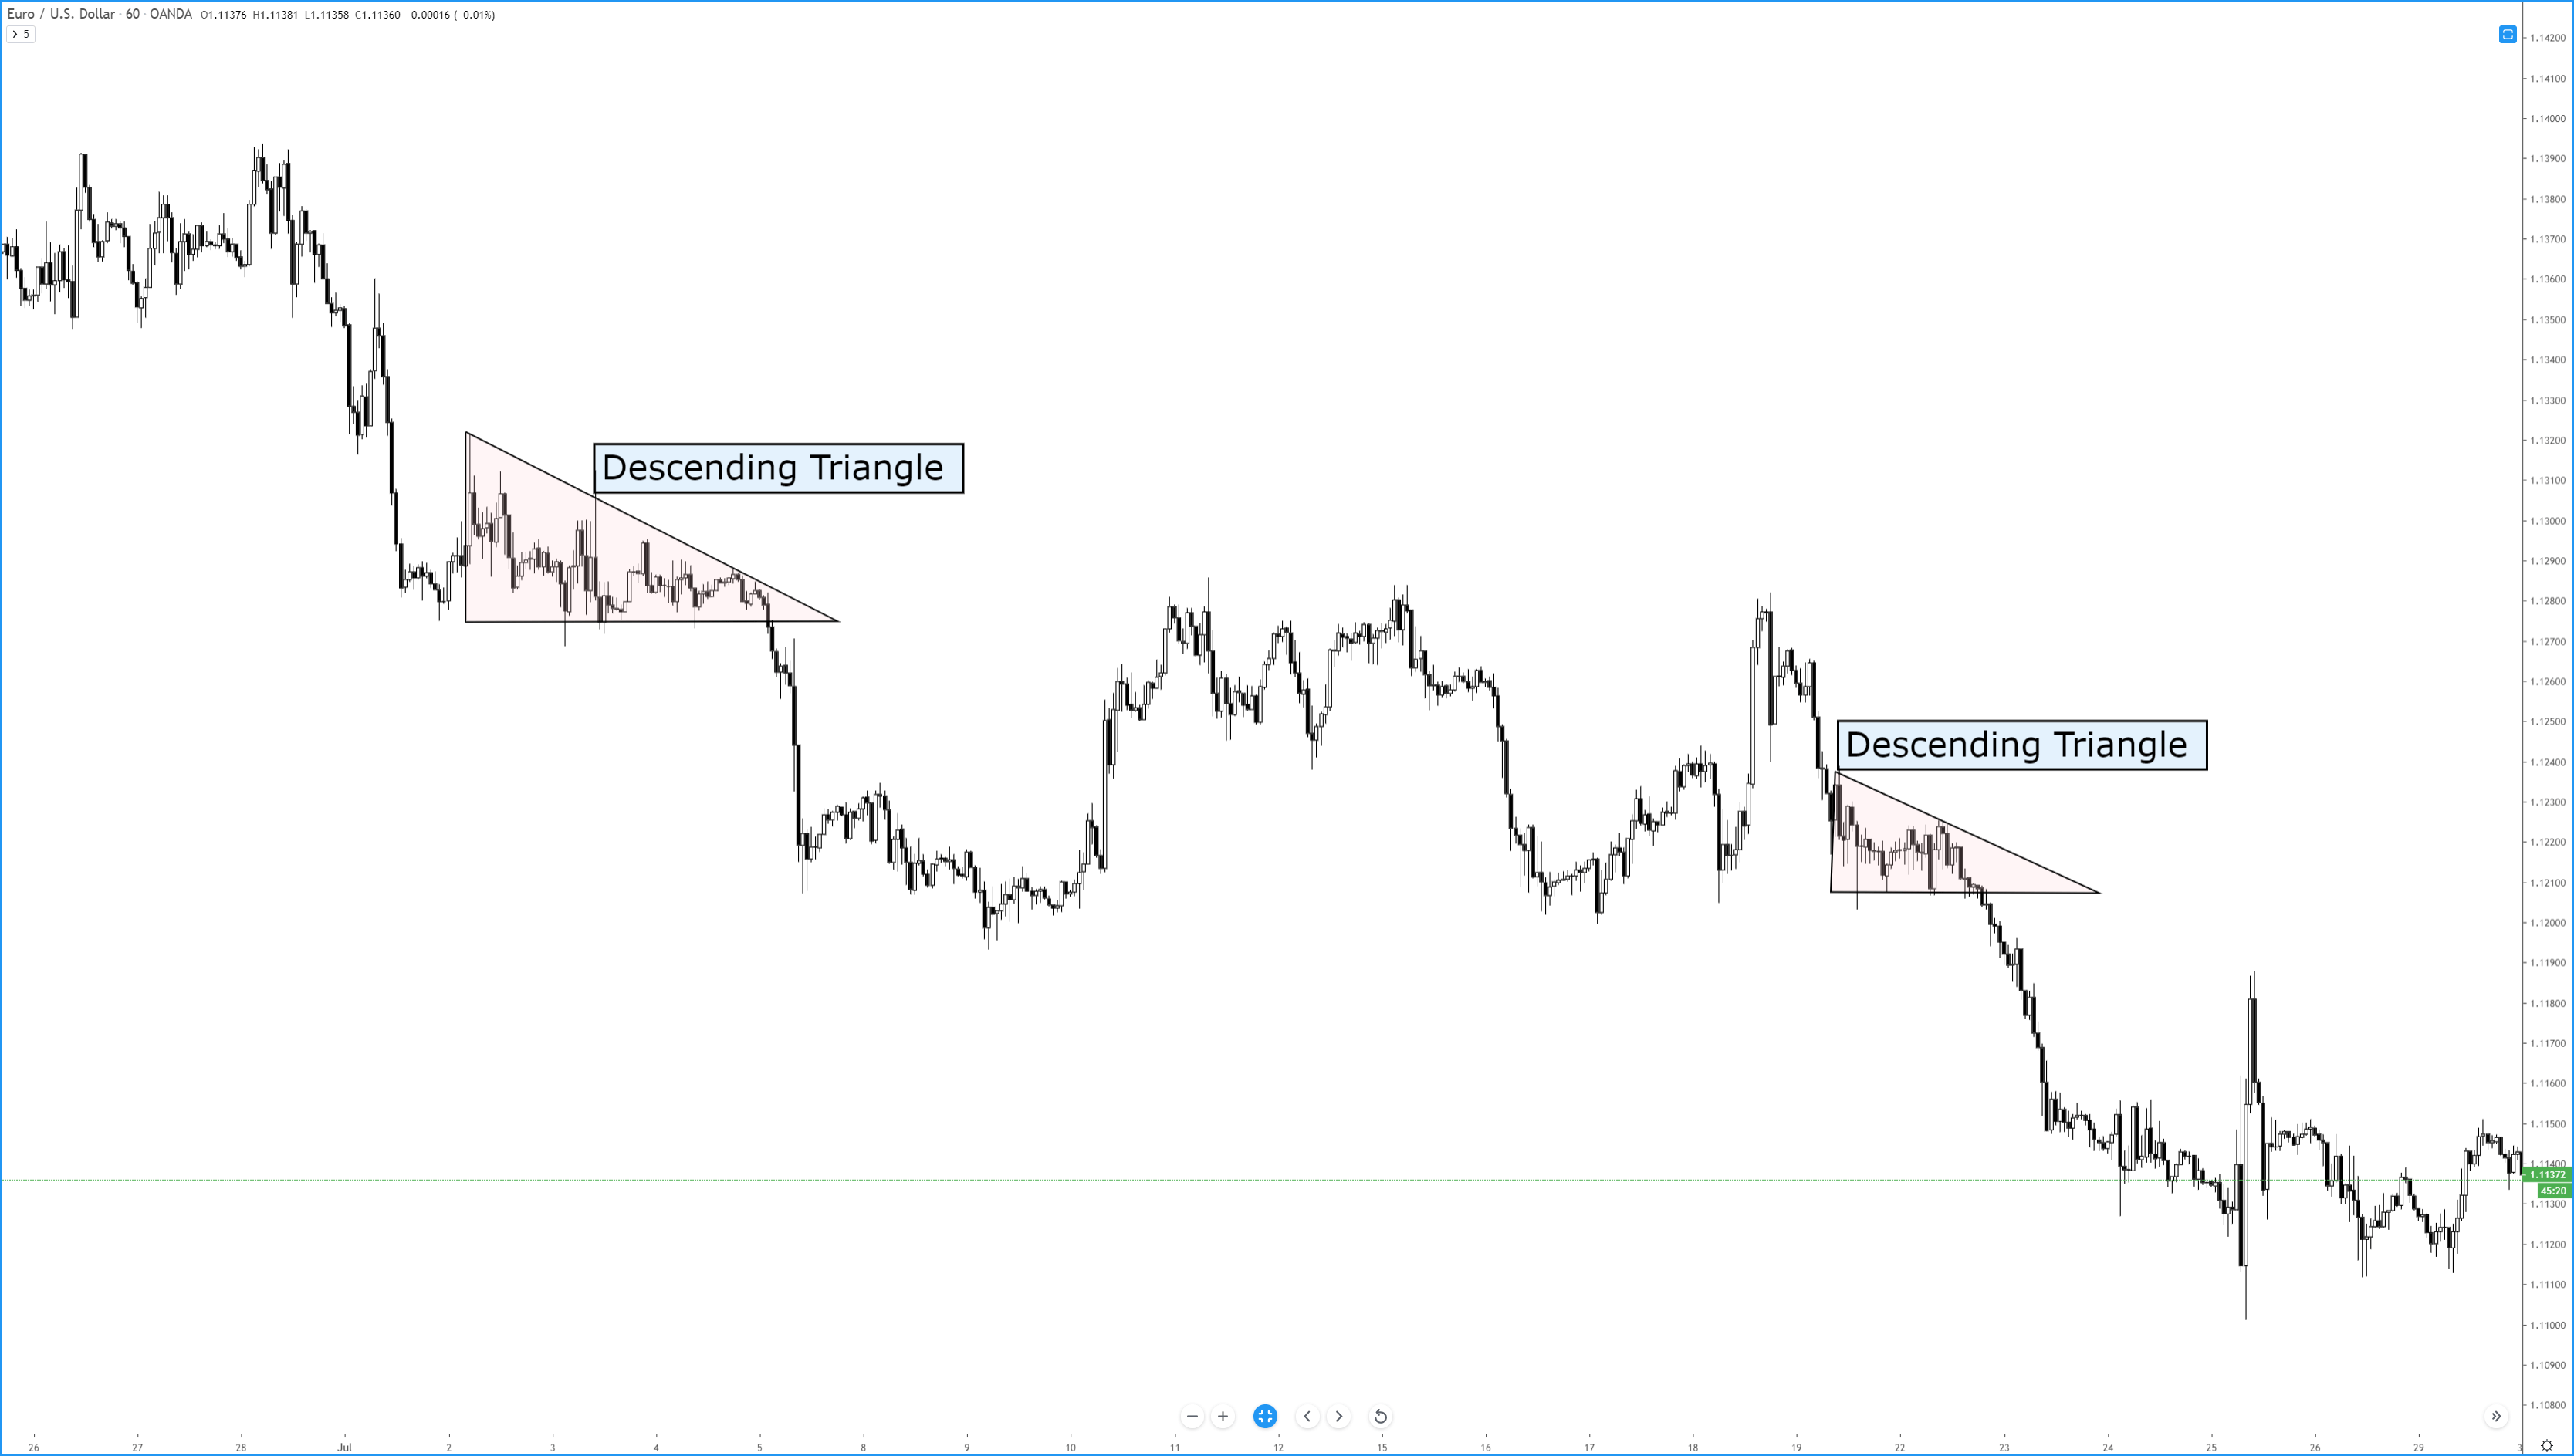
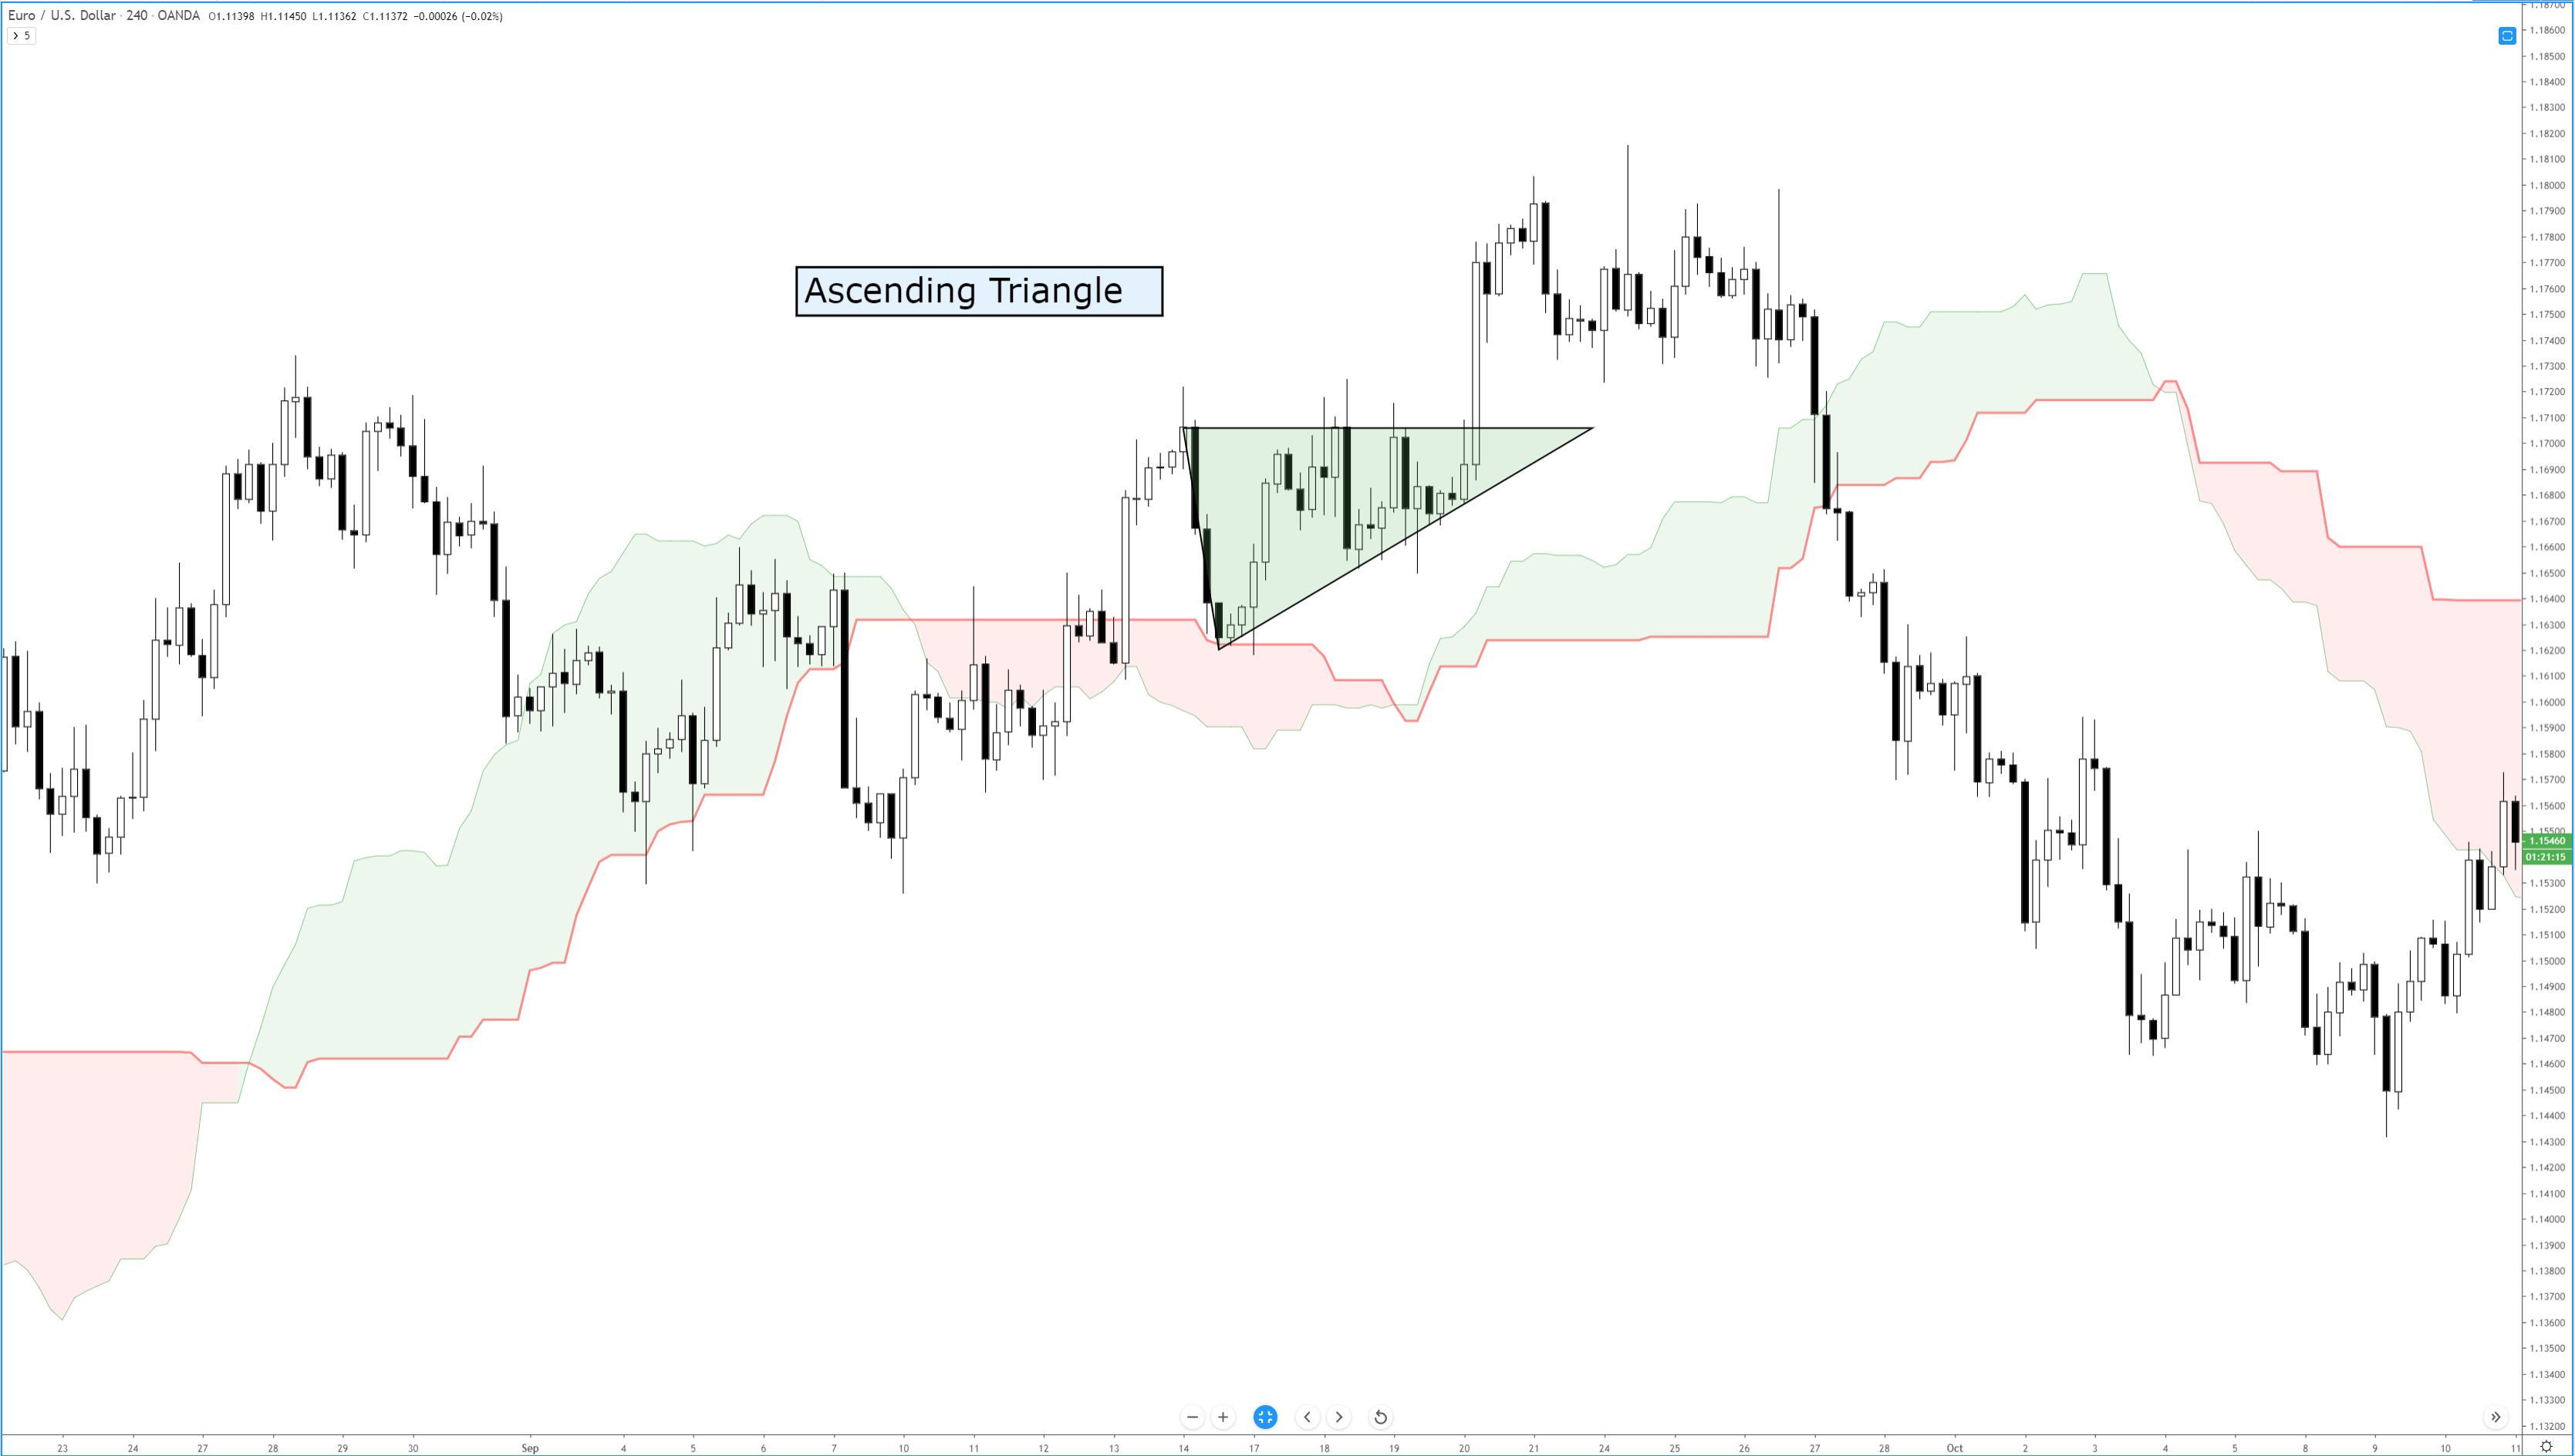
Of all the bullish continuation patterns that exist, few are as sought after as the ascending triangle. Like all triangle patterns, their development and construction are dependent on two trendlines that intersect and form an apex. The two primary identifying conditions of an ascending triangle I a flat, horizontal top and an upward sloping trendline.

Ascending Triangle
Ascending Triangle

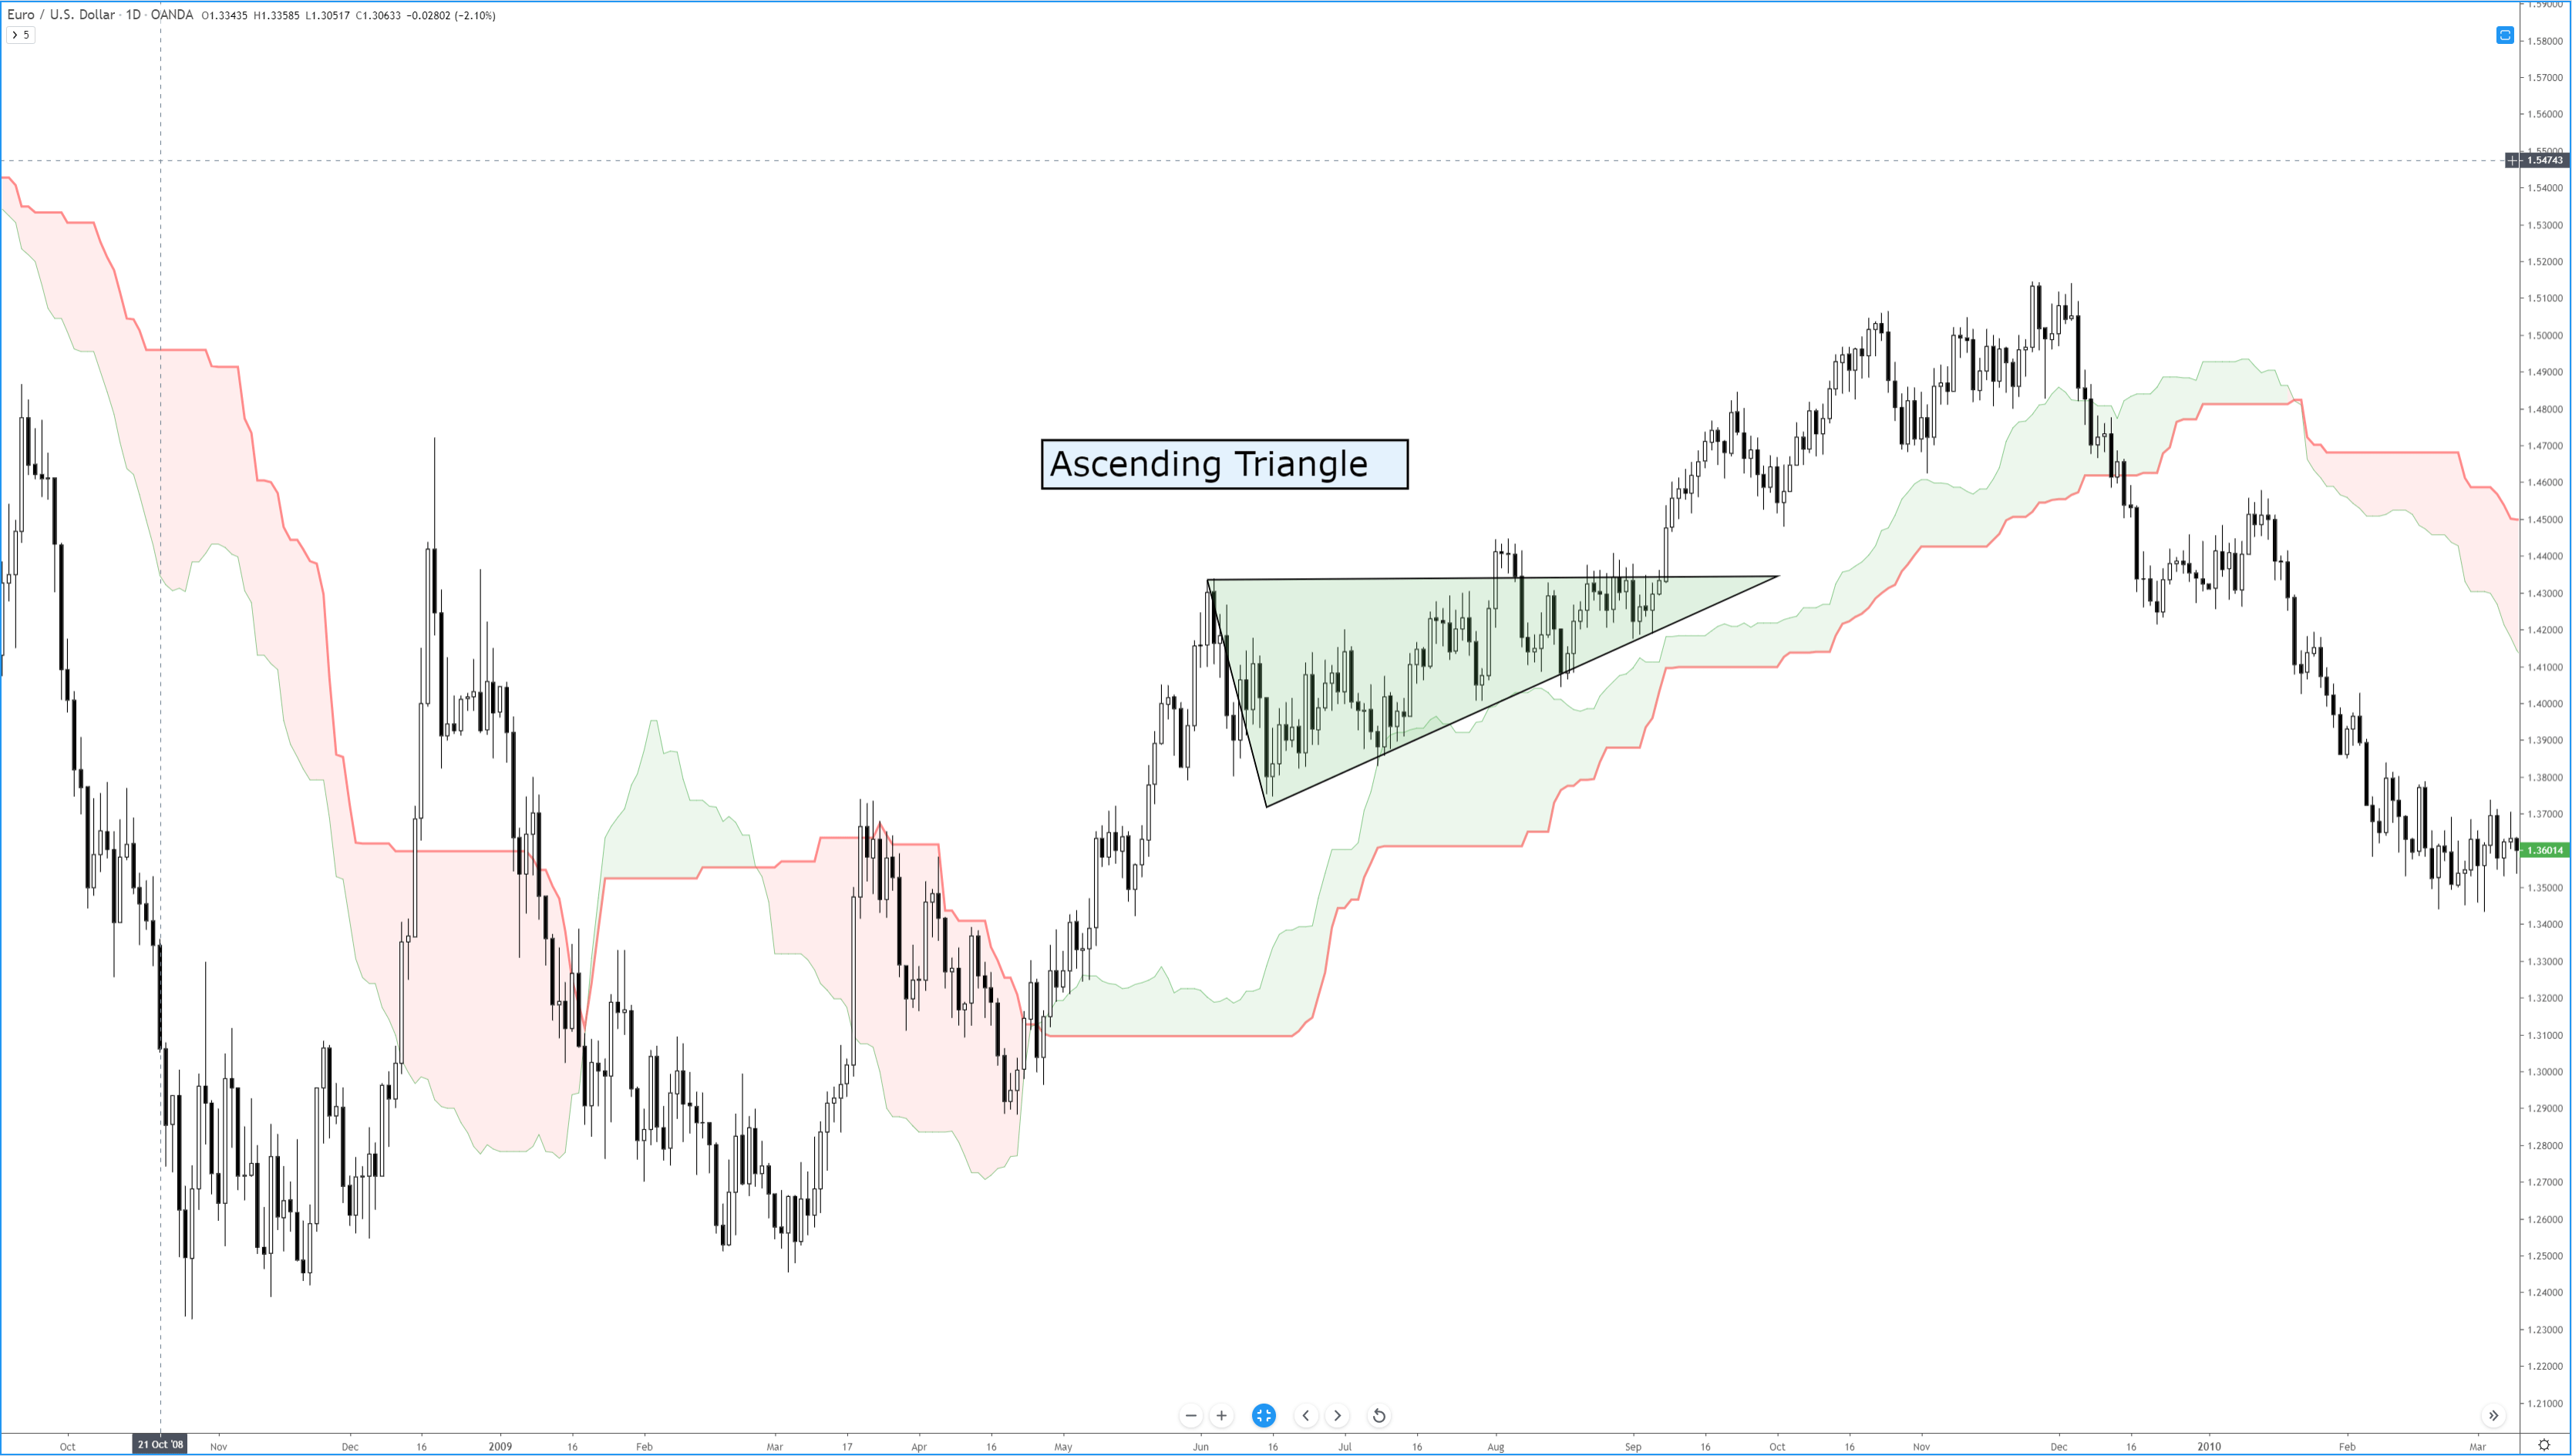
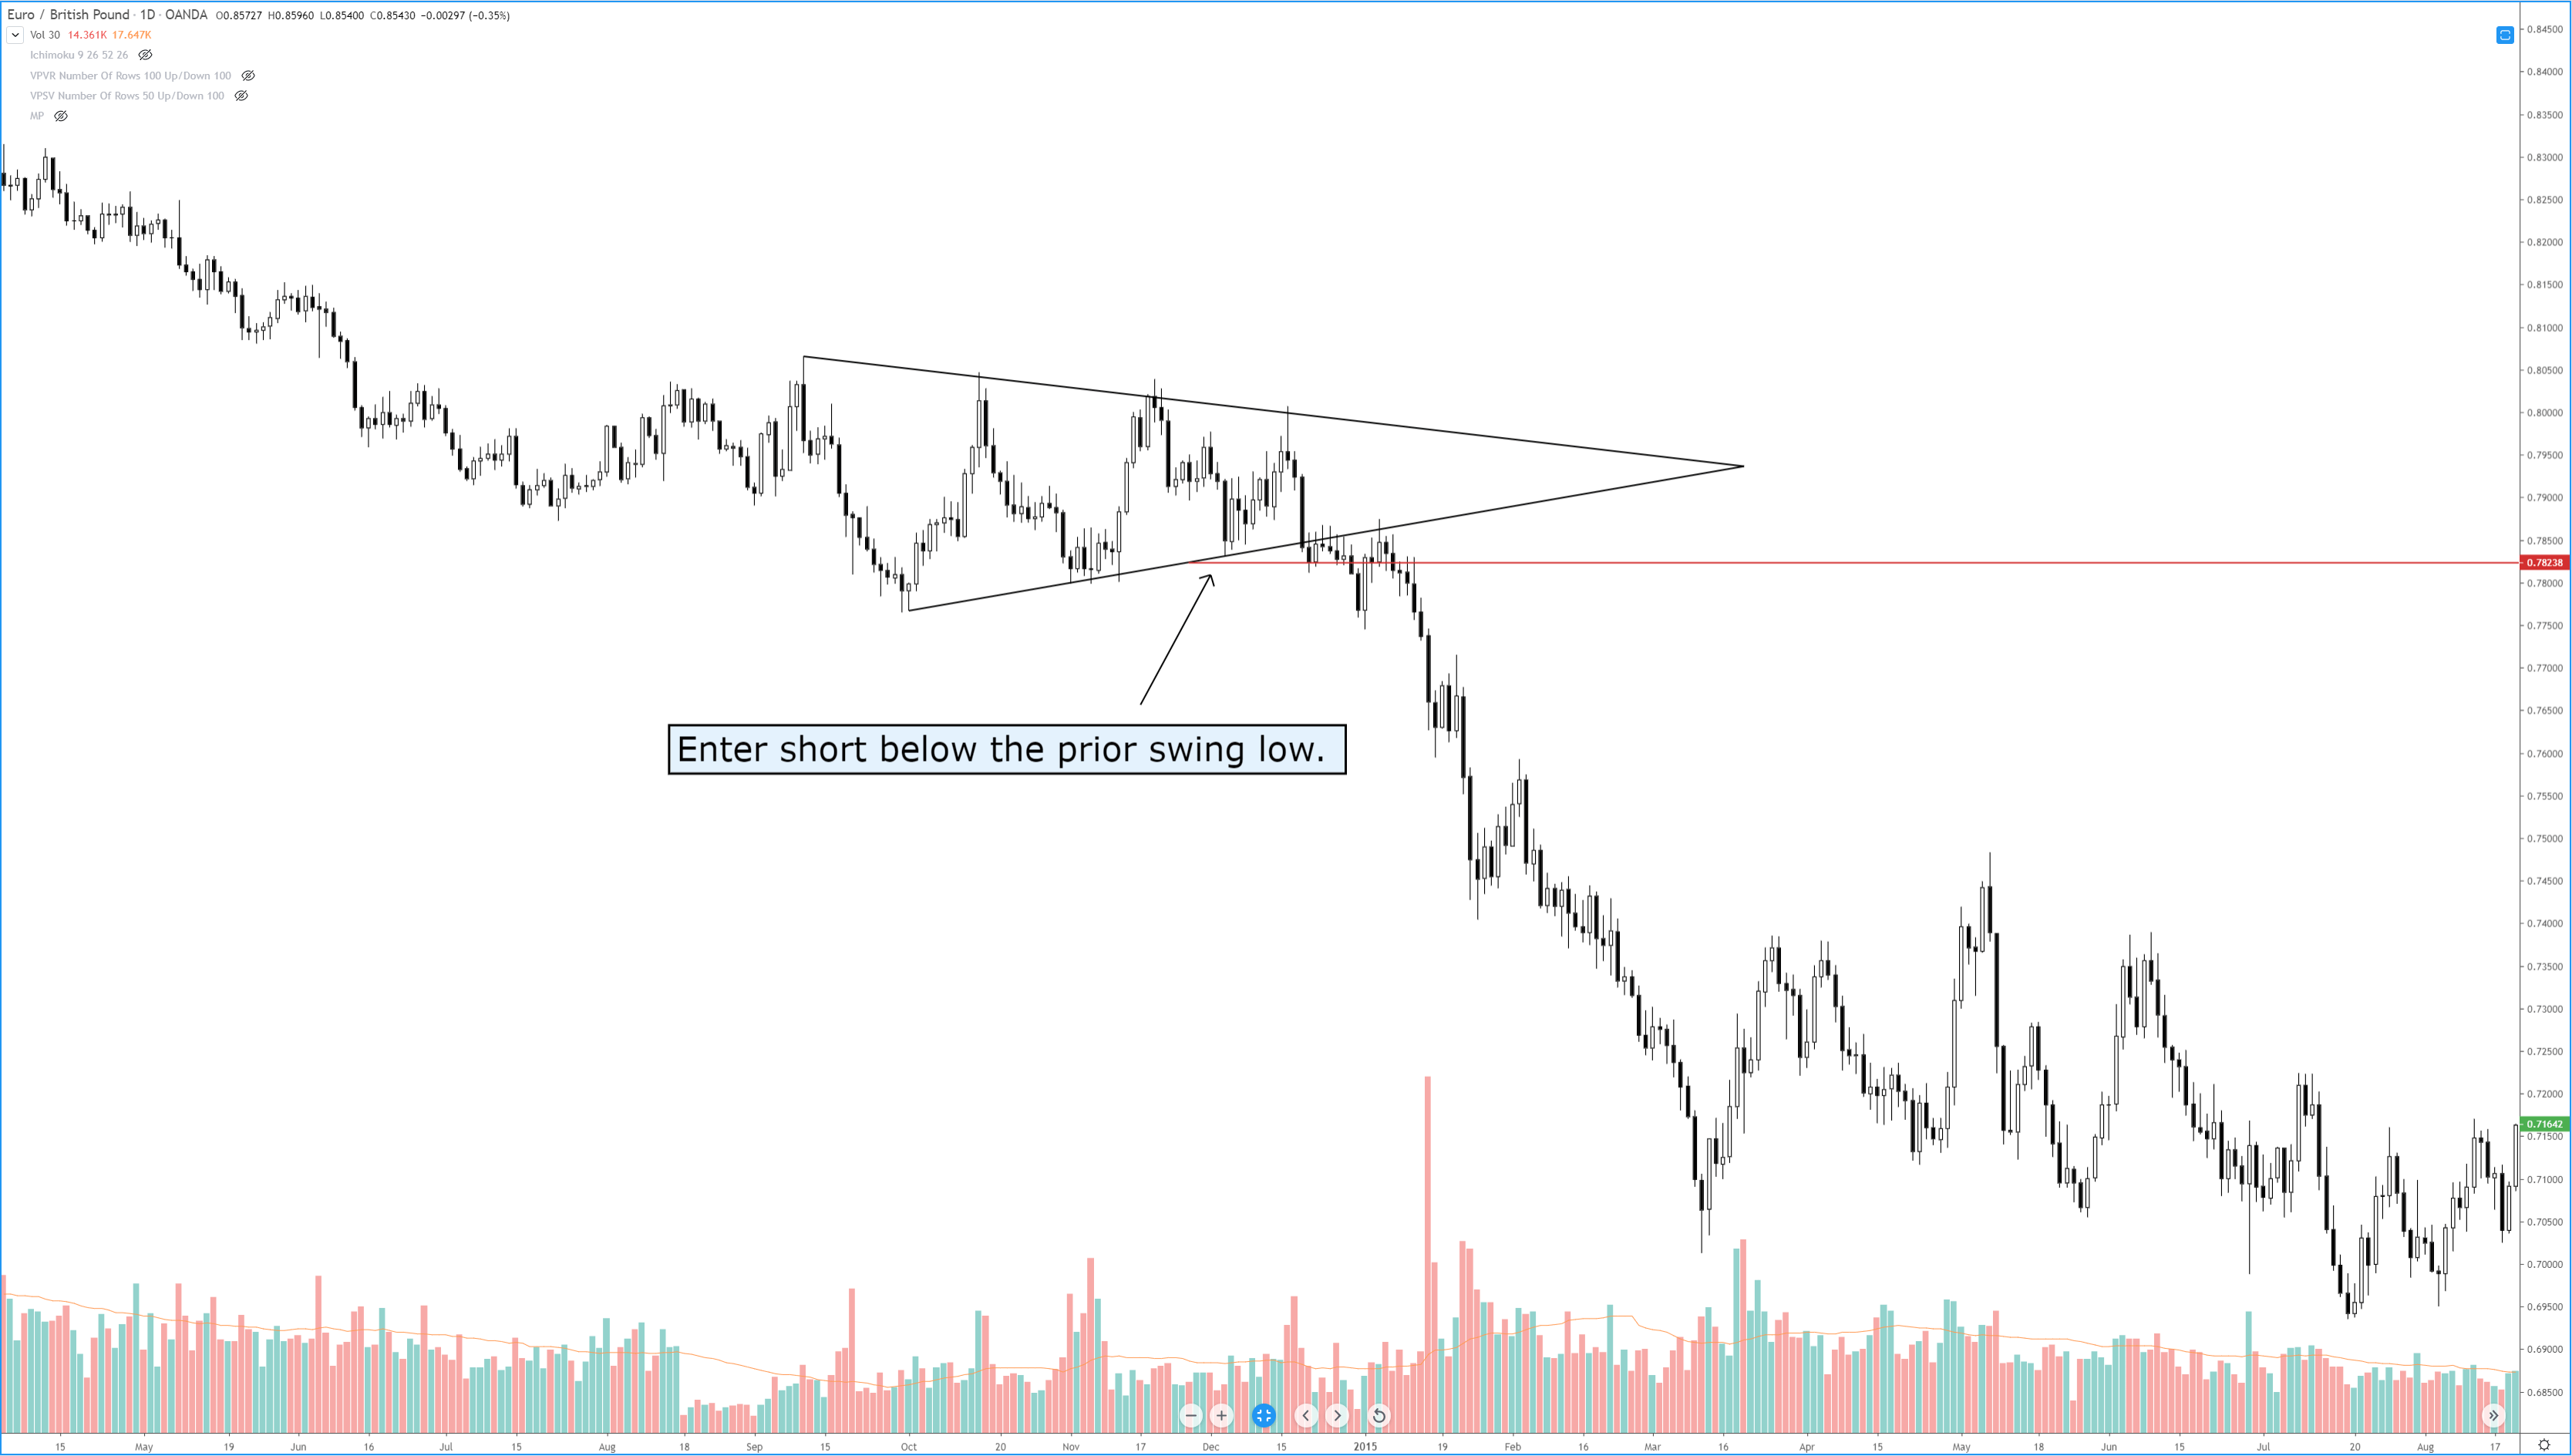
In addition to the two trendlines, there is a specific kind of behavior that the candlesticks must perform. The upper trendline and the lower trendline must be touched at least twice. Ideally, and according to Bulkowski, there should not be much open space inside the triangle. The same volume behavior that occurs in other triangles occurs here in the ascending triangle: price often breaks out in the final 2/3rds of the triangle, and volume decreases before the breakout. The psychology behind the formation of the ascending triangle is essential to understand. The pattern represents an apparent battle between longs and shorts. Short traders are under the impression that because the resistance level has been tested and has held, it will remain stronger. Long traders are under the impression that prices will move higher because of the formation of higher lows and an upward sloping trendline. Ultimately, shorts cover very quickly, just before or immediately after the breakout of the upper resistance.

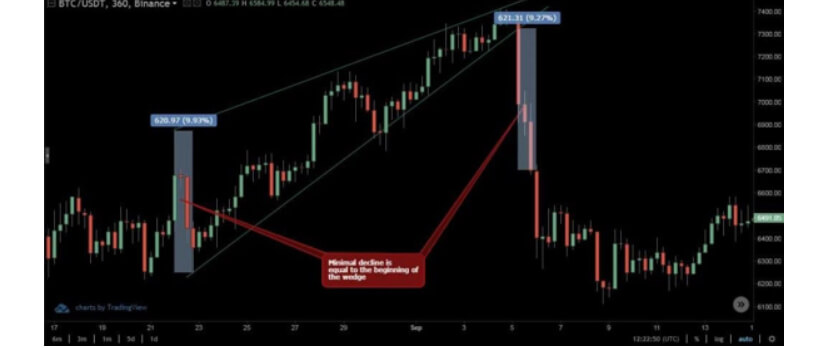
Bulkowski recorded that, in equity markets, the breakout direction of an ascending triangle is upwards 64% of the time. Dahlquist and Kirkpatrick recorded that upwards breakouts occur 77% of the time. Interestingly, the performance of this pattern is roughly average across all patterns – this is contrary to the belief of many traders who self-report a high positive expectancy of upwards breakouts. Dahlquist and Kirkpatrick did warn that there are many false breakouts and that failure rates are between 11% and 13%.

As with any pattern, it is essential to pay attention to price action first and then find tools to help you filter whether an entry at the breakout is appropriate. Additionally, be wary of throwbacks as they are frequent over 50% of the time – many conservative traders wait for a retest of the breakout to confirm a valid break from the ascending triangle.


Sources:

Kirkpatrick, C. D., & Dahlquist, J. R. (2016). Technical analysis: the complete resource for financial market technicians. Upper Saddle River: Financial Times/Prentice Hall.

Bulkowski, T. N. (2013). Visual guide to chart patterns. New York, NY: Bloomberg Press.

Bulkowski, T. N. (2008). Encyclopedia of candlestick charts. Hoboken, NJ: J. Wiley & Sons.

Bulkowski, T. N. (2002). Trading classic chart patterns. New York: Wiley.

Categories
Crypto Videos

Make Huge Profits Market Pattern Trading In Crypto (Head and Shoulders, Triangles, Wedges) Part 2/2


pattern trading in cryptocurrencies (Head and Shoulders, Triangles, Wedges) – part 2/2

This part of the guide will cover various triangle formations as well as wedges.

Triangles

Triangles come in three formations:
Ascending triangle
Descending triangle
Symmetrical triangle

Ascending triangle

Traders can spot an ascending triangle by the price going up and down between the constant line of resistance and the rising support.
The ascending triangle is widely considered to be a bullish formation, which leads to massive profits if approached the right way.
However, those not careful enough might consider taking a position near the support line in hopes of enhancing their gains, only to end up with a loss as formation didn’t complete, and the price movement turns to be a double or triple top bearish formation.
Targeted prices are measured by the widest distance between the highs and the lows, and applied up from the point of the breakout.
Experienced traders will wait for a confirmation of the upward breakout accompanied by a much bigger volume before taking a position, as breakouts without an increase in volume can catch traders in a bull-trap (as we showed on the chart).

Descending Triangle

A descending triangle is considered a typical bearish formation. For it to form, the price action needs to flow between a steady support line and descending resistance.
The pattern is confirmed only once a downward breakout with increased volume happens. Only then can a trader expect the continuation of the price movement to the downside.
Just like with ascending triangles, the price target is equal to the widest swing inside the triangle transferred from the breakout point to the downside.

One of the most famous descending triangles in cryptocurrencies is the one that formed on the 2018 Bitcoin chart.

Symmetrical triangle

These triangles are probably the most common formations in cryptocurrency trading. However, at the same time, they are the most unpredictable.

As the symmetrical triangle approaches its closure, the trading volume drops as traders are often indecisive about whether the price will unfold to the upside or downside. When the war between the bulls and the bears resolves, we get two outcomes: positive and negative.
Any of these breakout movements will be followed by an increase in volume, which will be even more visible due to the reduced trading volume before the breakout.
Once the breakout happens, traders can expect the target price to be the same distance as the distance between the breakout side and the base of the triangle.

Wedges

Wedges are very common formations in crypto trading as well. They are considered a multiple price wave reversal patterns.
The price action in a wedge swings from highs to lows multiple times before breaking out of the pattern.
Wedge formations come in two forms:

Rising wedges
Falling wedges

Rising wedge

As opposed to the ascending triangle formation, the rising wedge has price swings that travel through highs and lows, but both the highs and lows are getting higher. This formation announces a bullish trend reversal into a strong bearish sentiment.

Falling wedge

The falling wedge formation, on the other hand, looks like a mirror image of the rising wedge and announces a trend reversal from bearish to bullish.

As with other patterns, it is advisable for traders to get the confirmation of the breakout before taking a position.
The minimum targeted price for the falling wedge is the exact opposite of the ascending wedge.

One thing to notice is that, in the cryptocurrency market, peaks do not necessarily follow highs and lows in an exact straight line. They are rather just close enough in the price range to mark the formation.

Categories
Forex Videos

Break The Brokers & Conquer The Forex Market By Trading Triangles!

Triangle Formations

Triangle formations are another key tool used by technical traders to gauge potential price action moves based on triangle patterns that form on their charts.

Such patterns regularly occur and where traders will draw the patterns on their screens themselves rather than using a technical tool to do the job for them. The triangles can then be used areas of support and resistance around these triangle formations in order to trade from.
So what is a triangle, or wedge as it is sometimes referred to as? It literally is what appears to be a triangle based on price action, where traders will identify these areas by drawing lines onto their screen charts, such as in example A.

Example A

Here we can see a low point and a high point, as marked on the chart, and where are we have drawn two lines which act as resistance and support, the rules of which require that price action must touch both lines on at least on two occasions, which they do at positions 1 and 2.3 and 4, and where price action goes through a period of consolidation and becomes wedged to a point that it must eventually break from, either lower or break higher. In this situation It breaks higher from the triangle, and where the previous area of resistance at its furthermost point goes on to become an area of support, from where bulls come in and drive price higher.

Example B


Example B is an ascending triangle formation. It offers bullish setups and where the main characteristics are price action moving higher, with a flat top, which is confirmed by at least two attempts of price action to move higher than the area of resistance. Here we can see that the price action trend is higher and where price action is largely following our support line until price action flattens off and where we see resistance forming at the furthest most point of the wedge. Traders will be looking for a break higher or a break lower from the wedge. In this situation, we have a break higher and a continuation with the overall upward trend.


Example C


Example C is a descending triangle. This shape offers bearish setups. Again we have at least two confirmed attempts to breach the area of support and at least two attempts to move higher than our area of resistance and where the overall trend is moving lower until price action eventually breaks lower from the furthermost point of our triangle shape.
Other shapes in this category include falling or descending wedge formations, where price action is contained within two narrowing lines and is identified by lower highs and lower lows such as, in example D.

Example D


Also, a rising or ascending wedge, where price action again is contained in two narrowing lines, but this time identified by higher highs and higher lows, such as in example E.

Example E


In both wedge-shapes, traders will be looking for a break out as the lines narrow and where the breaks usually prove to be good entry points for trading the opposite direction as the previous trends run out of steam.


Example F


Slightly more complex are the symmetrical triangle shapes as in example F, and where we would identify lower tops and higher bottoms with an almost flag-like appearance, and where we can see our confirmed area of support and resistance is breached and where price action eventually moves lower and where our initial area of support becomes an area of resistance.

We would usually look for our initial breakout from the first area of price action to reach the peak of the initial high. However, the shape is considered neutral with no real particular bias.
The next shape is a bullish Pennant and is defined by an initial upward trend with a triangle shape based on a slightly ascending support line with a confirmed area of resistance with lower highs and where we would expect a breach higher from this triangle shape formation such as in example G.


Example G


Our final shape in this series is the expanding wedge, which, as the name would suggest, is an area of price action that expands as it moves forward, as in example H. This might typically occur as extra volume enters the market after a period of tight consolidation.


Example H

Categories
Chart Patterns

Chart Patterns: Symmetrical Triangles

Symmetrical Triangles

Out of all the triangle patterns, symmetrical triangles are perhaps the most common and the most common and the most subjective. Symmetrical triangles have a standard neutral bias; however, symmetrical triangles most often form after a prior trend, because they most commonly form after a prior move. The preference of their trading direction is determined by the direction from the previous move. If the preceding move was bullish, then the symmetrical triangle is viewed as a bullish continuation pattern. Like all triangle patterns that form after a trending move, they are known as pennants.

The construction of a symmetrical triangle is like any other triangle: it requires to trendlines that intersect: one upward sloping angle and one downwards sloping angle. Price action should touch both the upper and lower trendlines at least twice – but ideally three times. A lack of open space within the triangle is ideal. Breakouts often occur in the final 1/3rd of the triangle. Volume typically falls before the breakout.

I believe that understanding the psychology of how this pattern forms is essential. The symmetrical triangle is the result of a condition that is very common in any traded market: consolidation. It’s not just common; it’s normal. Consolidation is representative of two things: equilibrium on the part of buyers and sellers and indecision by active speculators. The psychology of price action inside a symmetrical triangle is different than what occurs in an ascending or descending triangle, which both have a marked bias during the construction. Symmetrical triangles are the epitome of indecision, and traders can very quickly fall victim to whipsaws.

Symmetrical triangles, while the most common, are also the most confusing. Take the image below:

Symmetrical Triangle

The symmetrical triangle on the daily chart for the AUDJPY is a bearish pennant – a bearish continuation pattern. While any triangle that forms after an established trending move has a high probability of pushing the price in the direction of the trend, it doesn’t always happen that way. As I wrote above, symmetrical patterns are inherently neutral – so it is important to watch them. We can see that this symmetrical triangle did not cause a continuation move south – it reversed. Regardless of the direction of the breakout, some rules should be applied when entering a trade based on a breakout of a symmetrical triangle.

Symmetrical Triangle - Long Entry
Symmetrical Triangle – Long Entry

First, unlike the ascending and descending triangles, we don’t enter on the break. We want to enter when price breaks the prior high (or low). For the chart above, we would enter long above the previous swing high that touched the downtrend line.

Symmetrical Triangle - Short Entry
Symmetrical Triangle – Short Entry

The short entry from a breakout below a symmetrical triangle is the inverse of the bullish entry. On the chart above, the short entry is when price moves below the prior swing low that tagged the uptrend line – not on the initial breakout.

Pullbacks and throwbacks occur 59% of the time. Symmetrical triangles are notorious for many false breakouts, so look for frequent wicks/shadows to pierce the trendlines. Dahlquist and Kirkpatrick wrote that volume that increases on the breakout increases the performance of the pattern, but it is otherwise below average in its performance.


Sources:

Kirkpatrick, C. D., & Dahlquist, J. R. (2016). Technical analysis: the complete resource for financial market technicians. Upper Saddle River: Financial Times/Prentice Hall.

Bulkowski, T. N. (2013). Visual guide to chart patterns. New York, NY: Bloomberg Press.

Bulkowski, T. N. (2008). Encyclopedia of candlestick charts. Hoboken, NJ: J. Wiley & Sons.

Bulkowski, T. N. (2002). Trading classic chart patterns. New York: Wiley.

Categories
Chart Patterns

Chart Patterns: Descending Triangle

Descending Triangle
Descending Triangle

The descending triangle is another version of the many triangle patterns in technical analysis. It is the opposite of the ascending triangle. This pattern is overwhelmingly bearish and is one of the more common bearish continuation patterns. If you’ve read Dahlquist and Kirkpatrick’s Technical Analysis, you will find that this pattern is treated with some considerable positivity. It was one of the best-performing patterns. But there is a caveat to why this is.

Descending Triangle
Descending Triangle

The two trendlines required for the formation of a descending triangle are a flat, horizontal trendline that acts as support with a downward sloping trendline that acts as resistance. Ideally, price should touch both the upper and lower trendlines twice. Volume typically decreases as price gets closer to the apex. Breakouts occur within the final 1/3rd of the pattern. Dahlquist and Kirkpatrick report that increasing volume is actually more favorable for this pattern. The most common breakout is lower at 64% of the time.

I’ve written in prior articles about the dangers of putting to much stock into technical analysis books where the initial testing of patterns and results have been in traditional equity markets (stock markets). I believe that one of the reasons that Dahlquist and Kirkpatrick have reported such powerful and swift moves with a downward breakout is due to the nature of bear moves in equity markets. Because markets like the stock market are exceedingly long-biased, any dramatic drop below crucial support will have an exceedingly more dramatic move when compared to the forex markets – which are primarily range bound. Another factor that may attribute to the overperformance of this pattern in stock markets vs. forex markets is the ease of shorting in forex vs. the stock market.

Sources:

Kirkpatrick, C. D., & Dahlquist, J. R. (2016). Technical analysis: the complete resource for financial market technicians. Upper Saddle River: Financial Times/Prentice Hall.

Bulkowski, T. N. (2013). Visual guide to chart patterns. New York, NY: Bloomberg Press.

Bulkowski, T. N. (2008). Encyclopedia of candlestick charts. Hoboken, NJ: J. Wiley & Sons.

Bulkowski, T. N. (2002). Trading classic chart patterns. New York: Wiley.