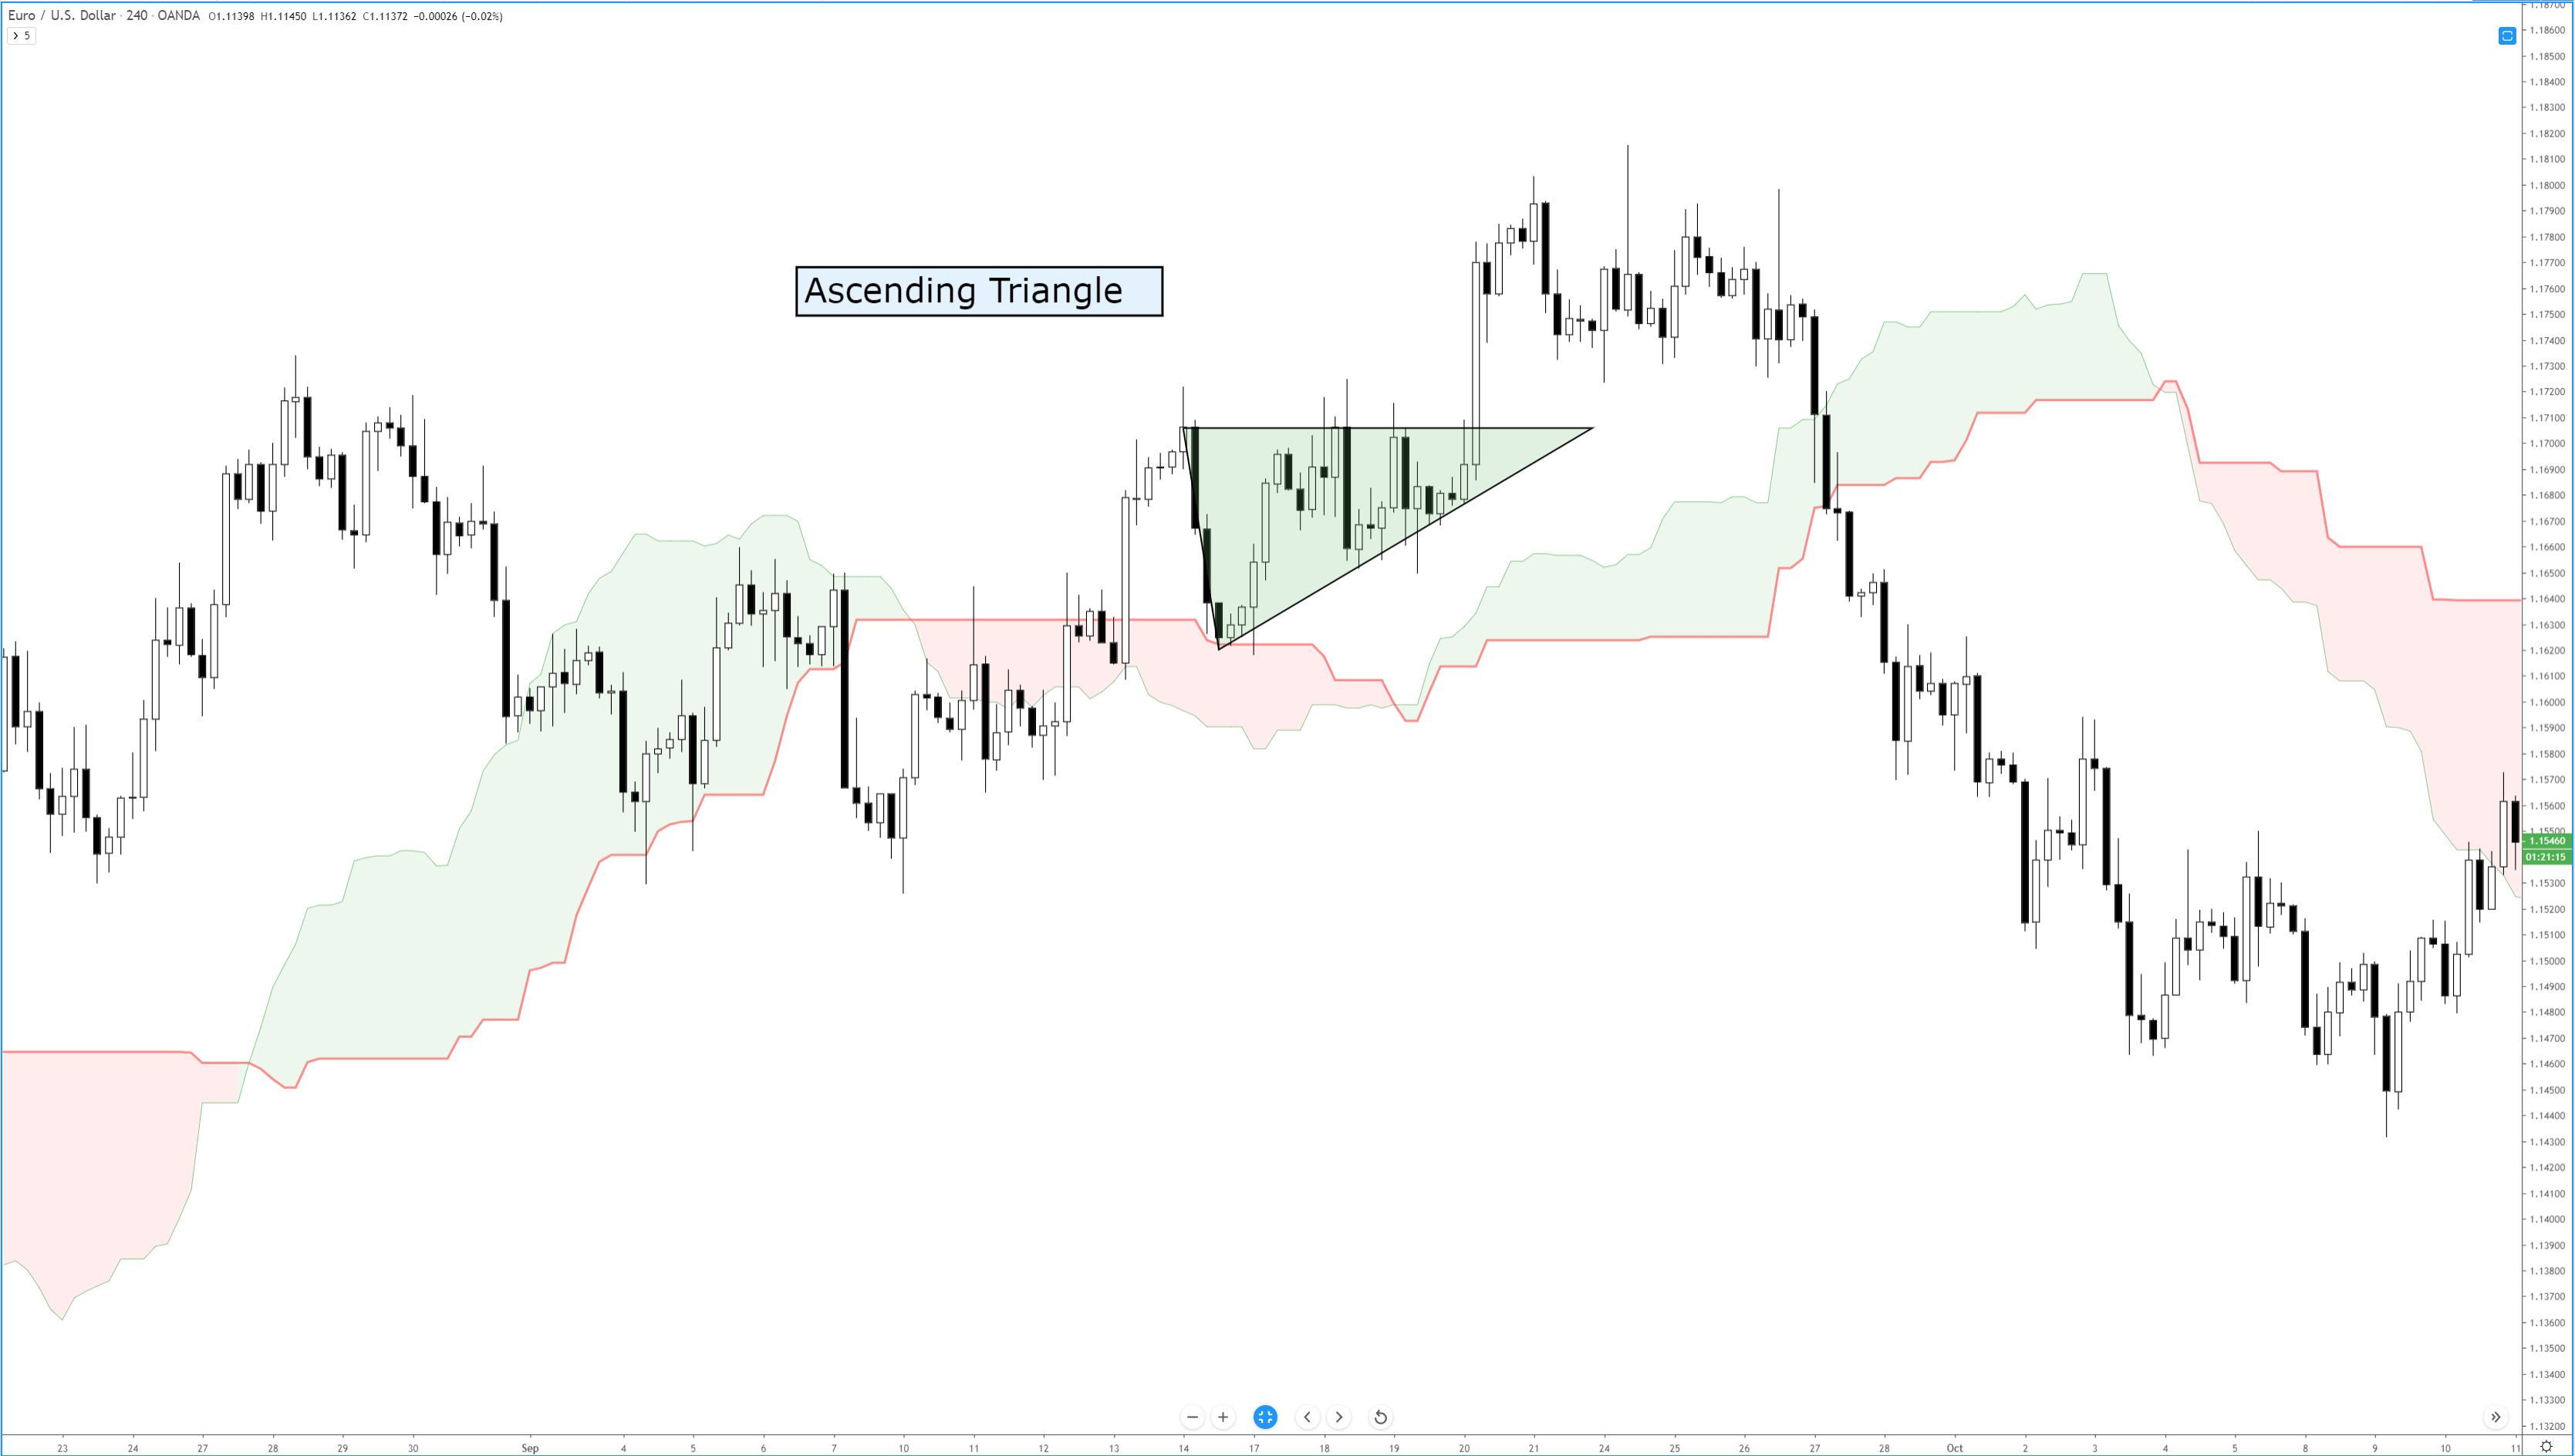
Of all the bullish continuation patterns that exist, few are as sought after as the ascending triangle. Like all triangle patterns, their development and construction are dependent on two trendlines that intersect and form an apex. The two primary identifying conditions of an ascending triangle I a flat, horizontal top and an upward sloping trendline.
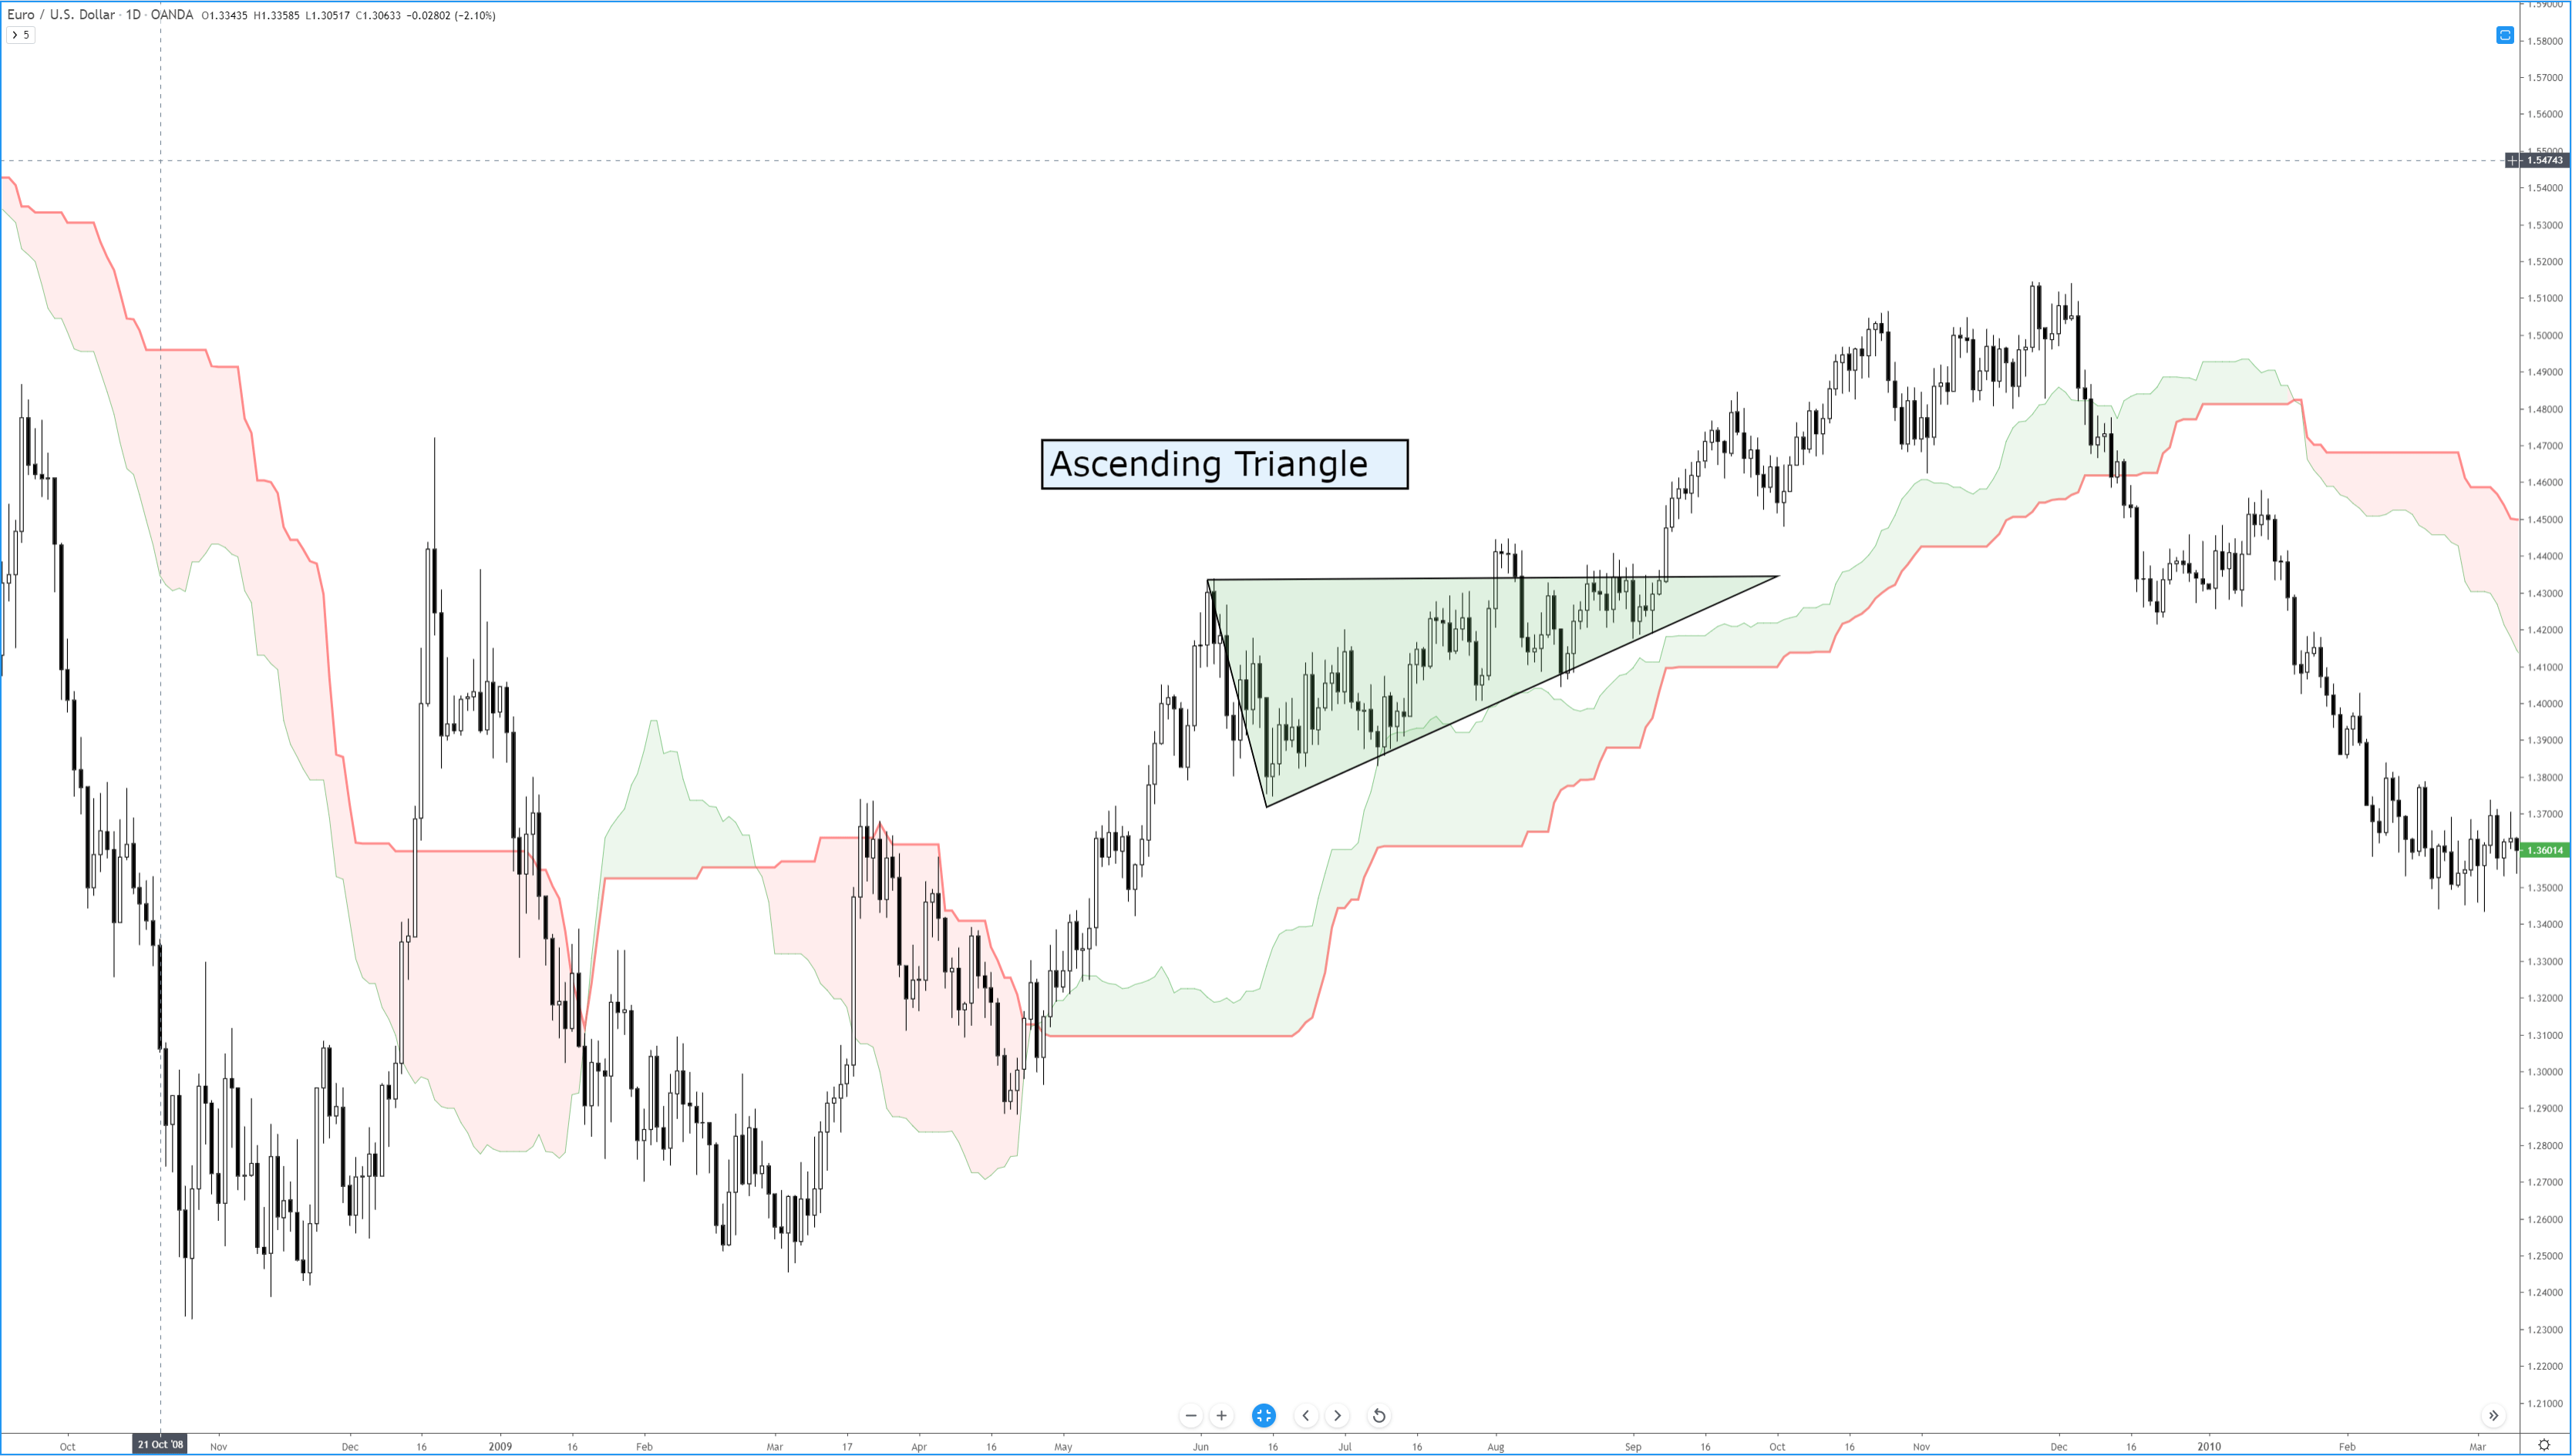
In addition to the two trendlines, there is a specific kind of behavior that the candlesticks must perform. The upper trendline and the lower trendline must be touched at least twice. Ideally, and according to Bulkowski, there should not be much open space inside the triangle. The same volume behavior that occurs in other triangles occurs here in the ascending triangle: price often breaks out in the final 2/3rds of the triangle, and volume decreases before the breakout. The psychology behind the formation of the ascending triangle is essential to understand. The pattern represents an apparent battle between longs and shorts. Short traders are under the impression that because the resistance level has been tested and has held, it will remain stronger. Long traders are under the impression that prices will move higher because of the formation of higher lows and an upward sloping trendline. Ultimately, shorts cover very quickly, just before or immediately after the breakout of the upper resistance.
Bulkowski recorded that, in equity markets, the breakout direction of an ascending triangle is upwards 64% of the time. Dahlquist and Kirkpatrick recorded that upwards breakouts occur 77% of the time. Interestingly, the performance of this pattern is roughly average across all patterns – this is contrary to the belief of many traders who self-report a high positive expectancy of upwards breakouts. Dahlquist and Kirkpatrick did warn that there are many false breakouts and that failure rates are between 11% and 13%.
As with any pattern, it is essential to pay attention to price action first and then find tools to help you filter whether an entry at the breakout is appropriate. Additionally, be wary of throwbacks as they are frequent over 50% of the time – many conservative traders wait for a retest of the breakout to confirm a valid break from the ascending triangle.
Sources:
Kirkpatrick, C. D., & Dahlquist, J. R. (2016). Technical analysis: the complete resource for financial market technicians. Upper Saddle River: Financial Times/Prentice Hall.
Bulkowski, T. N. (2013). Visual guide to chart patterns. New York, NY: Bloomberg Press.
Bulkowski, T. N. (2008). Encyclopedia of candlestick charts. Hoboken, NJ: J. Wiley & Sons.
Bulkowski, T. N. (2002). Trading classic chart patterns. New York: Wiley.

