Symmetrical Triangles
Out of all the triangle patterns, symmetrical triangles are perhaps the most common and the most common and the most subjective. Symmetrical triangles have a standard neutral bias; however, symmetrical triangles most often form after a prior trend, because they most commonly form after a prior move. The preference of their trading direction is determined by the direction from the previous move. If the preceding move was bullish, then the symmetrical triangle is viewed as a bullish continuation pattern. Like all triangle patterns that form after a trending move, they are known as pennants.

The construction of a symmetrical triangle is like any other triangle: it requires to trendlines that intersect: one upward sloping angle and one downwards sloping angle. Price action should touch both the upper and lower trendlines at least twice – but ideally three times. A lack of open space within the triangle is ideal. Breakouts often occur in the final 1/3rd of the triangle. Volume typically falls before the breakout.
I believe that understanding the psychology of how this pattern forms is essential. The symmetrical triangle is the result of a condition that is very common in any traded market: consolidation. It’s not just common; it’s normal. Consolidation is representative of two things: equilibrium on the part of buyers and sellers and indecision by active speculators. The psychology of price action inside a symmetrical triangle is different than what occurs in an ascending or descending triangle, which both have a marked bias during the construction. Symmetrical triangles are the epitome of indecision, and traders can very quickly fall victim to whipsaws.
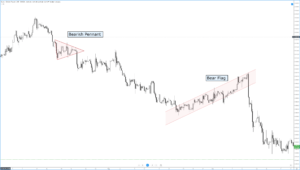
Symmetrical triangles, while the most common, are also the most confusing. Take the image below:
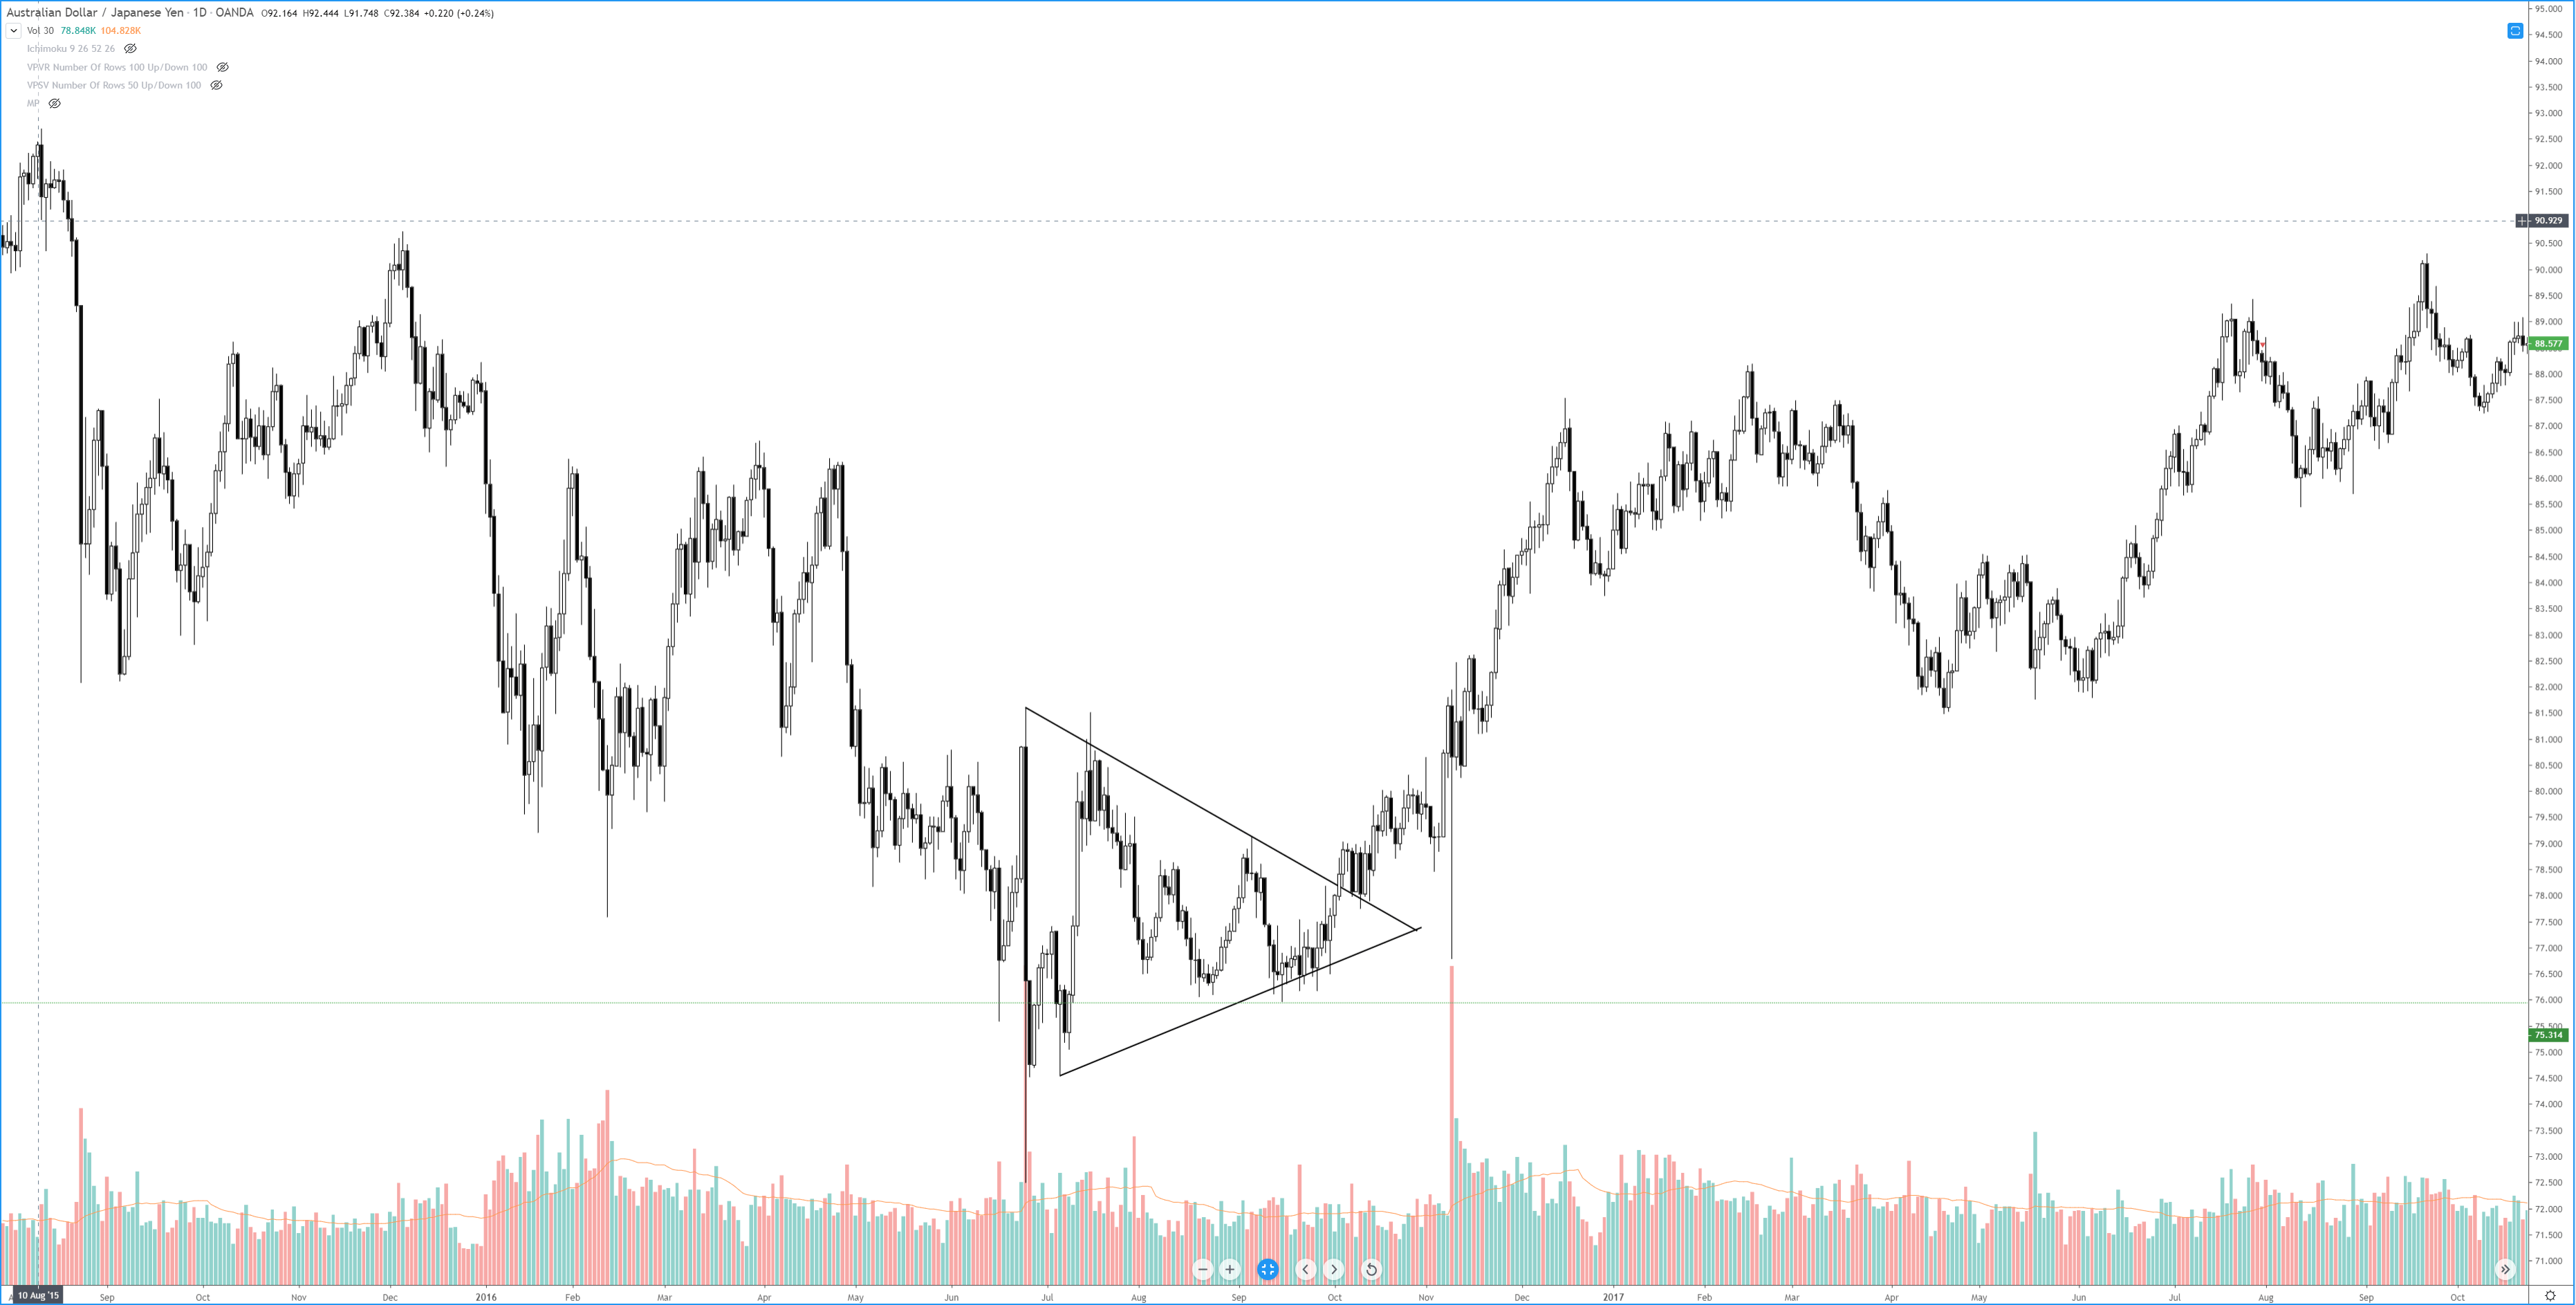
The symmetrical triangle on the daily chart for the AUDJPY is a bearish pennant – a bearish continuation pattern. While any triangle that forms after an established trending move has a high probability of pushing the price in the direction of the trend, it doesn’t always happen that way. As I wrote above, symmetrical patterns are inherently neutral – so it is important to watch them. We can see that this symmetrical triangle did not cause a continuation move south – it reversed. Regardless of the direction of the breakout, some rules should be applied when entering a trade based on a breakout of a symmetrical triangle.
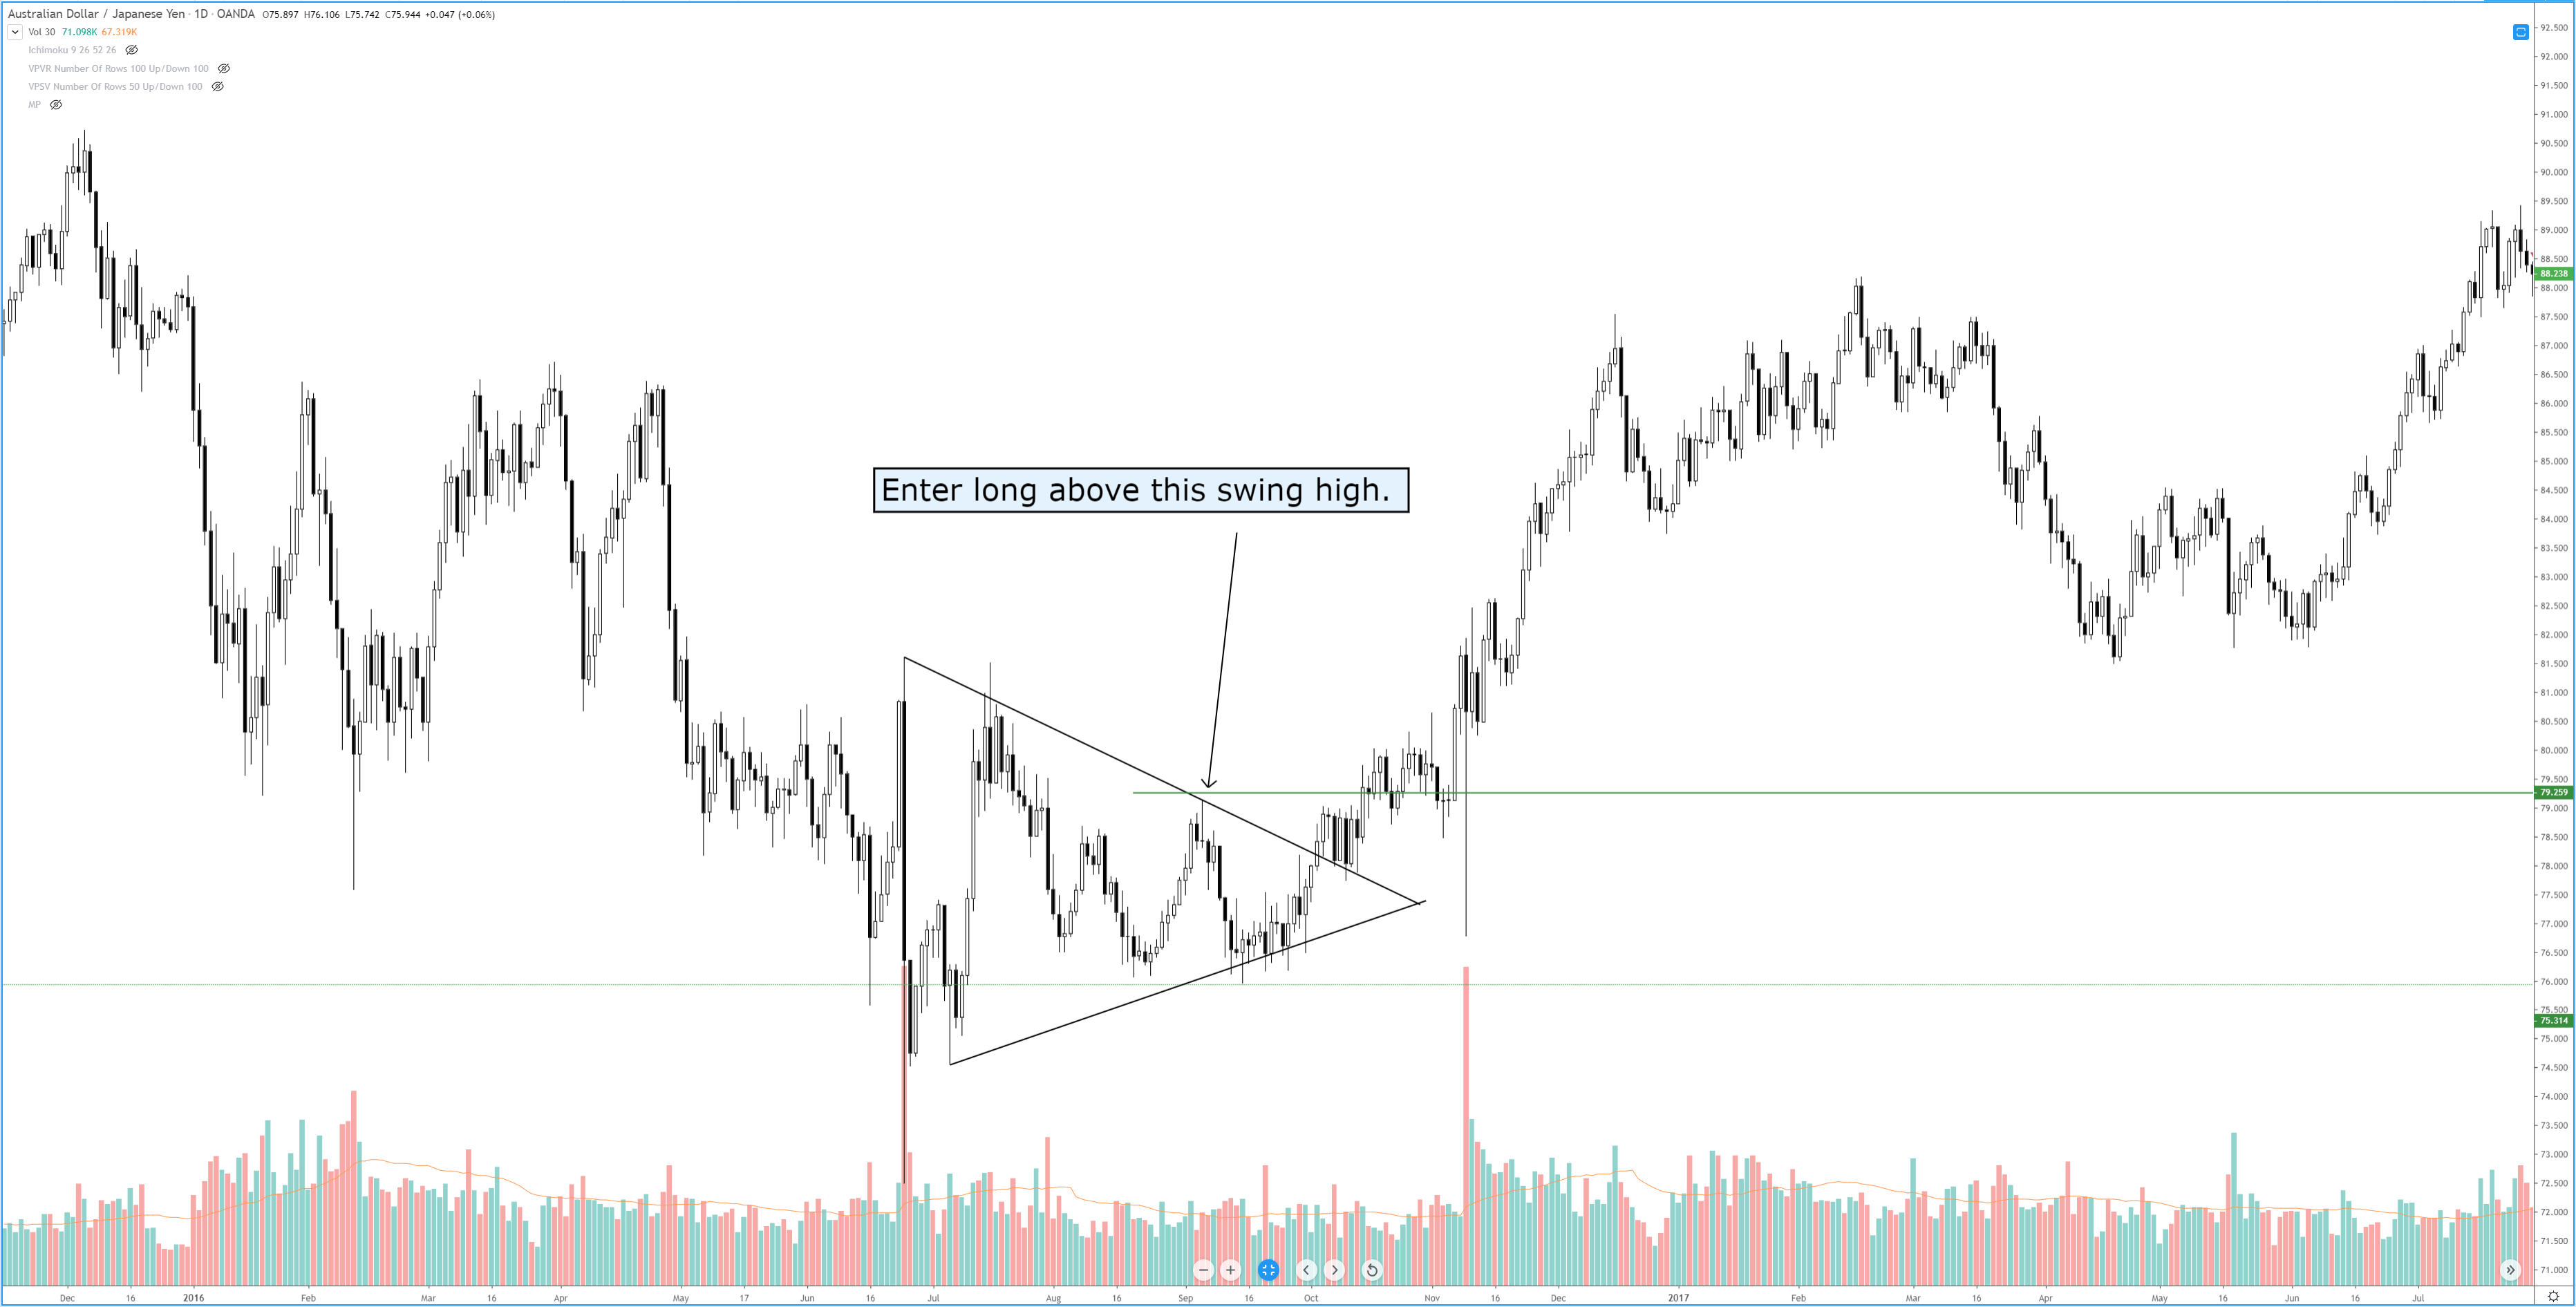
First, unlike the ascending and descending triangles, we don’t enter on the break. We want to enter when price breaks the prior high (or low). For the chart above, we would enter long above the previous swing high that touched the downtrend line.
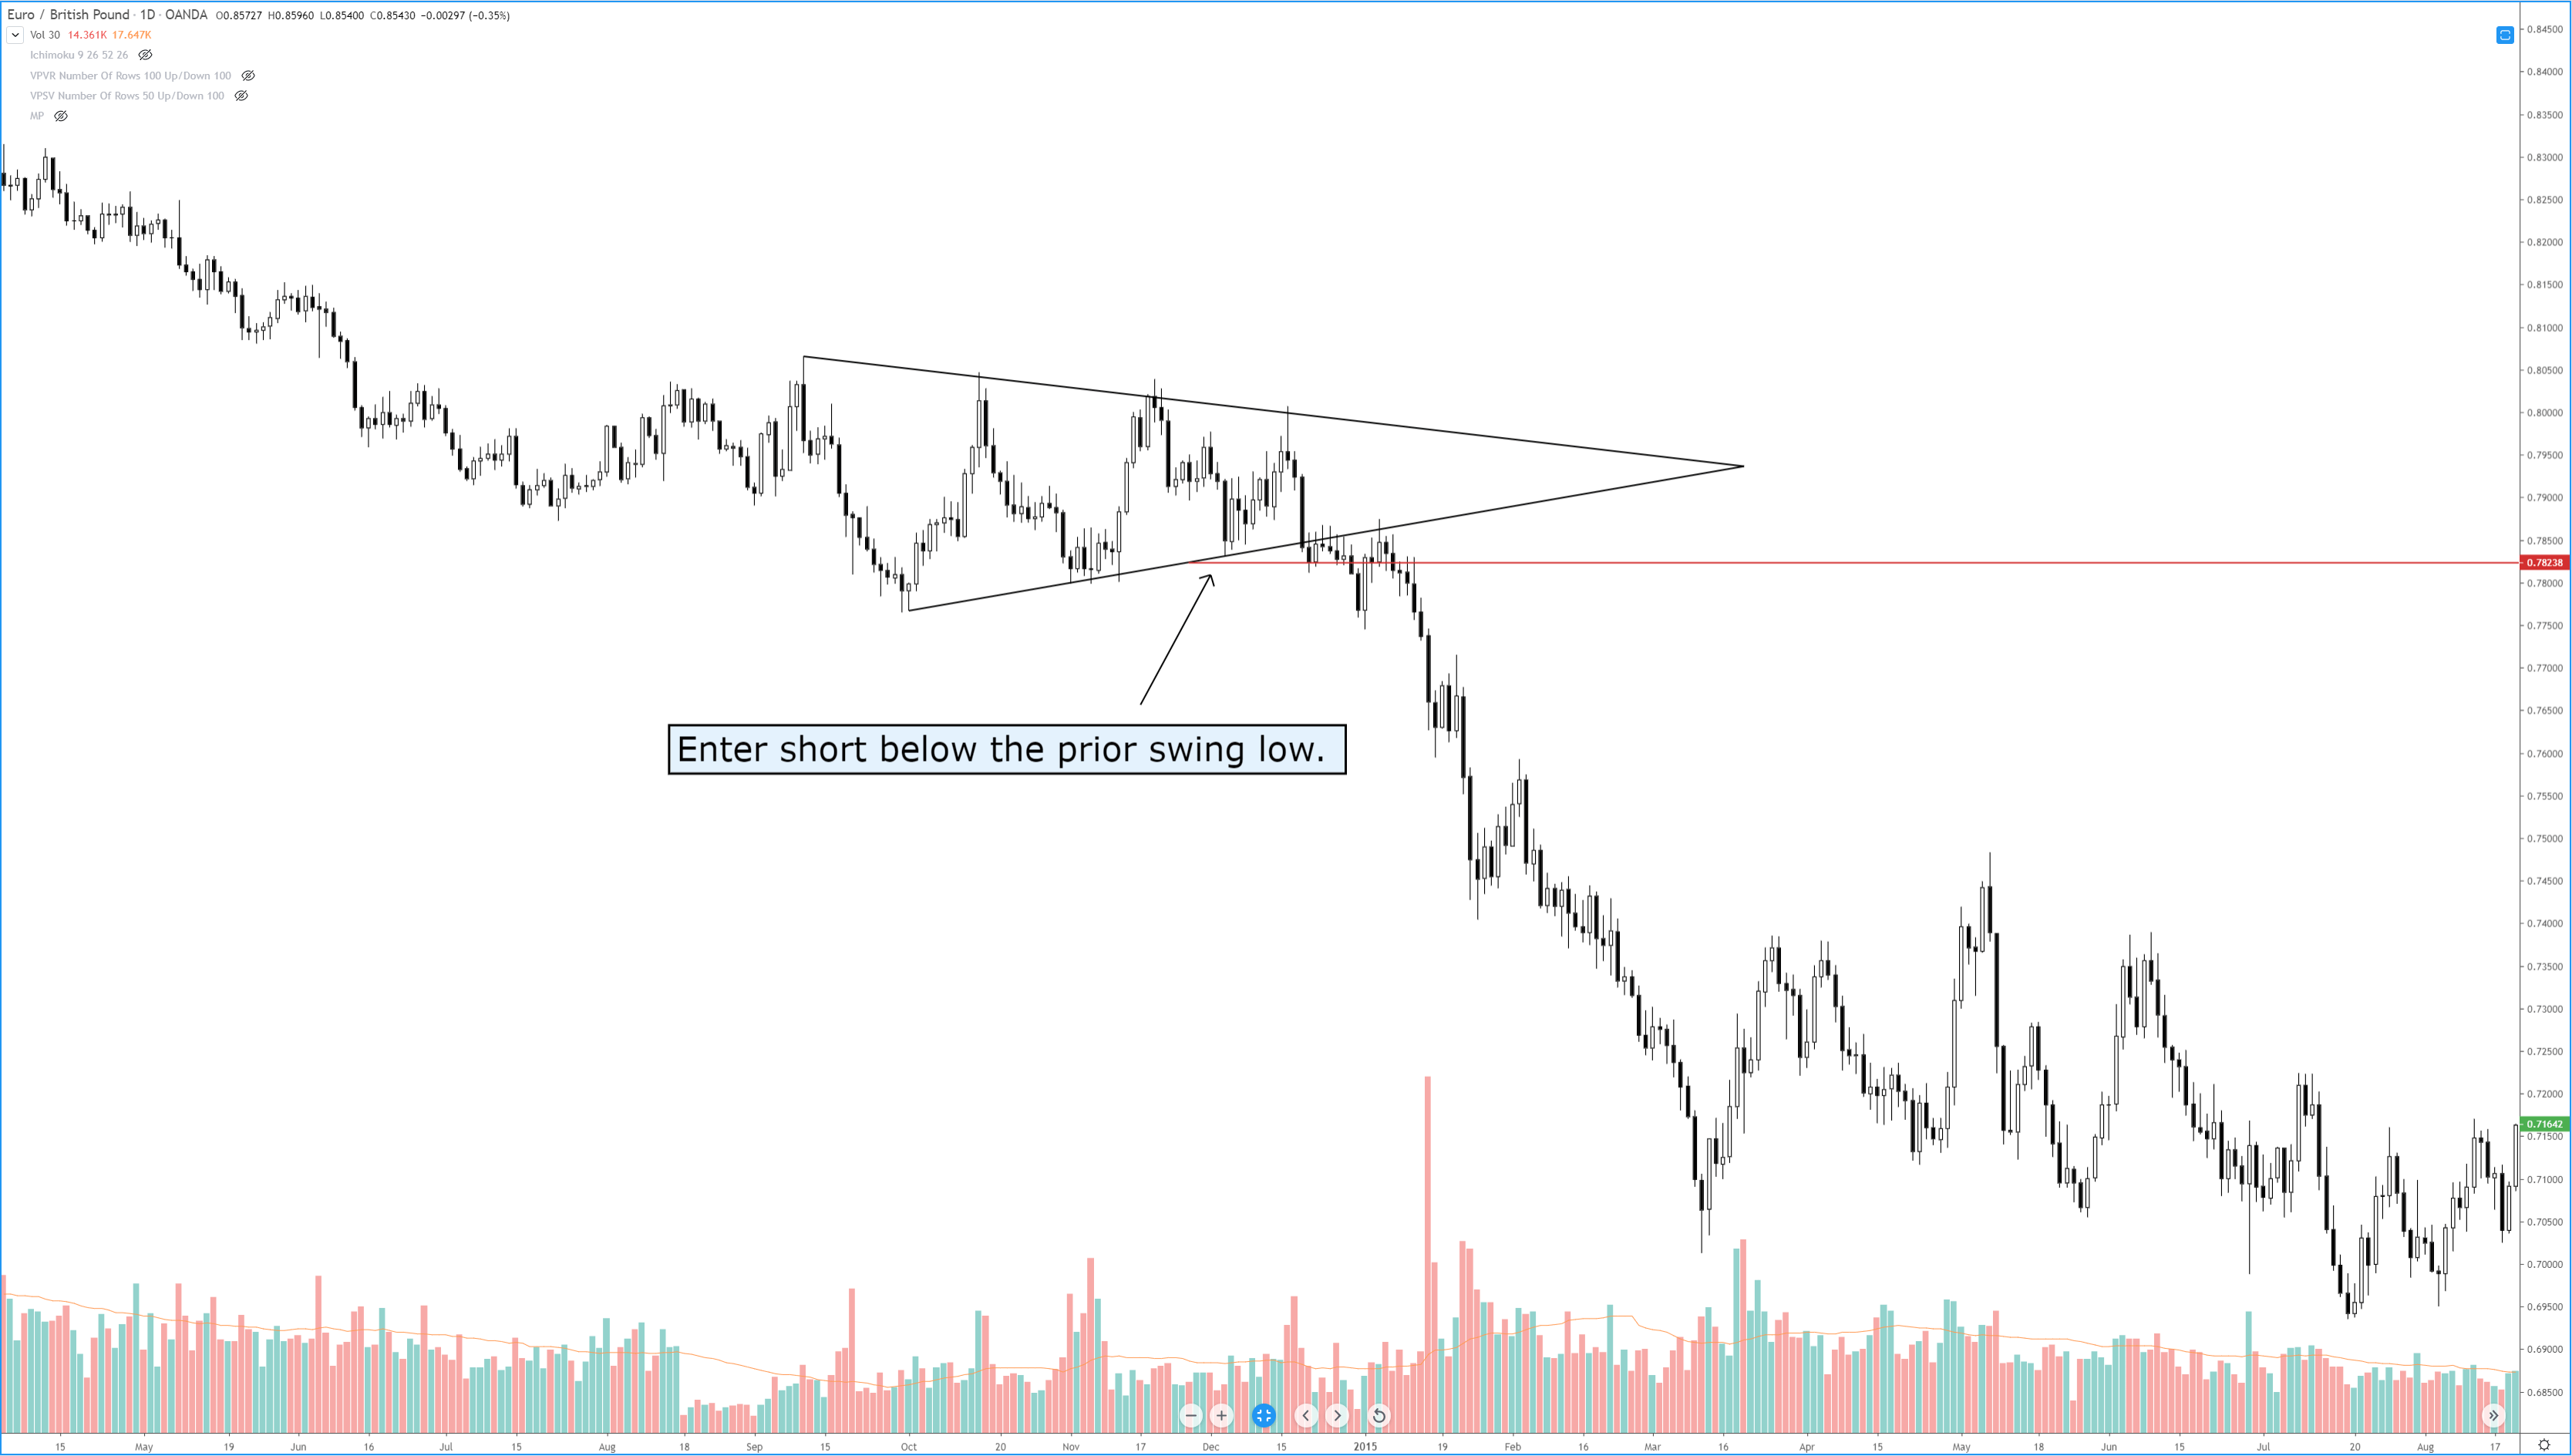
The short entry from a breakout below a symmetrical triangle is the inverse of the bullish entry. On the chart above, the short entry is when price moves below the prior swing low that tagged the uptrend line – not on the initial breakout.
Pullbacks and throwbacks occur 59% of the time. Symmetrical triangles are notorious for many false breakouts, so look for frequent wicks/shadows to pierce the trendlines. Dahlquist and Kirkpatrick wrote that volume that increases on the breakout increases the performance of the pattern, but it is otherwise below average in its performance.
Sources:
Kirkpatrick, C. D., & Dahlquist, J. R. (2016). Technical analysis: the complete resource for financial market technicians. Upper Saddle River: Financial Times/Prentice Hall.
Bulkowski, T. N. (2013). Visual guide to chart patterns. New York, NY: Bloomberg Press.
Bulkowski, T. N. (2008). Encyclopedia of candlestick charts. Hoboken, NJ: J. Wiley & Sons.
Bulkowski, T. N. (2002). Trading classic chart patterns. New York: Wiley.