Flags and Pennants
If you’ve ever traded a chart and you’ve seen what looks like a reversal in the trend, but as soon as you enter the trend seems to continue, odds are you were trading against a continuation pattern. Flags and pennants are titles given to patterns that show up as small countertrend moves that ultimately trap participants and then use their momentum to keep the price moving in the direction of the trend. Flags are represented as rectangular channels, and pennants are represented as triangles.
Before a flag or pennant can be identified, we first need a flag pole. A flag pole is any clear trending price action that, well, looks like a pole. See below:
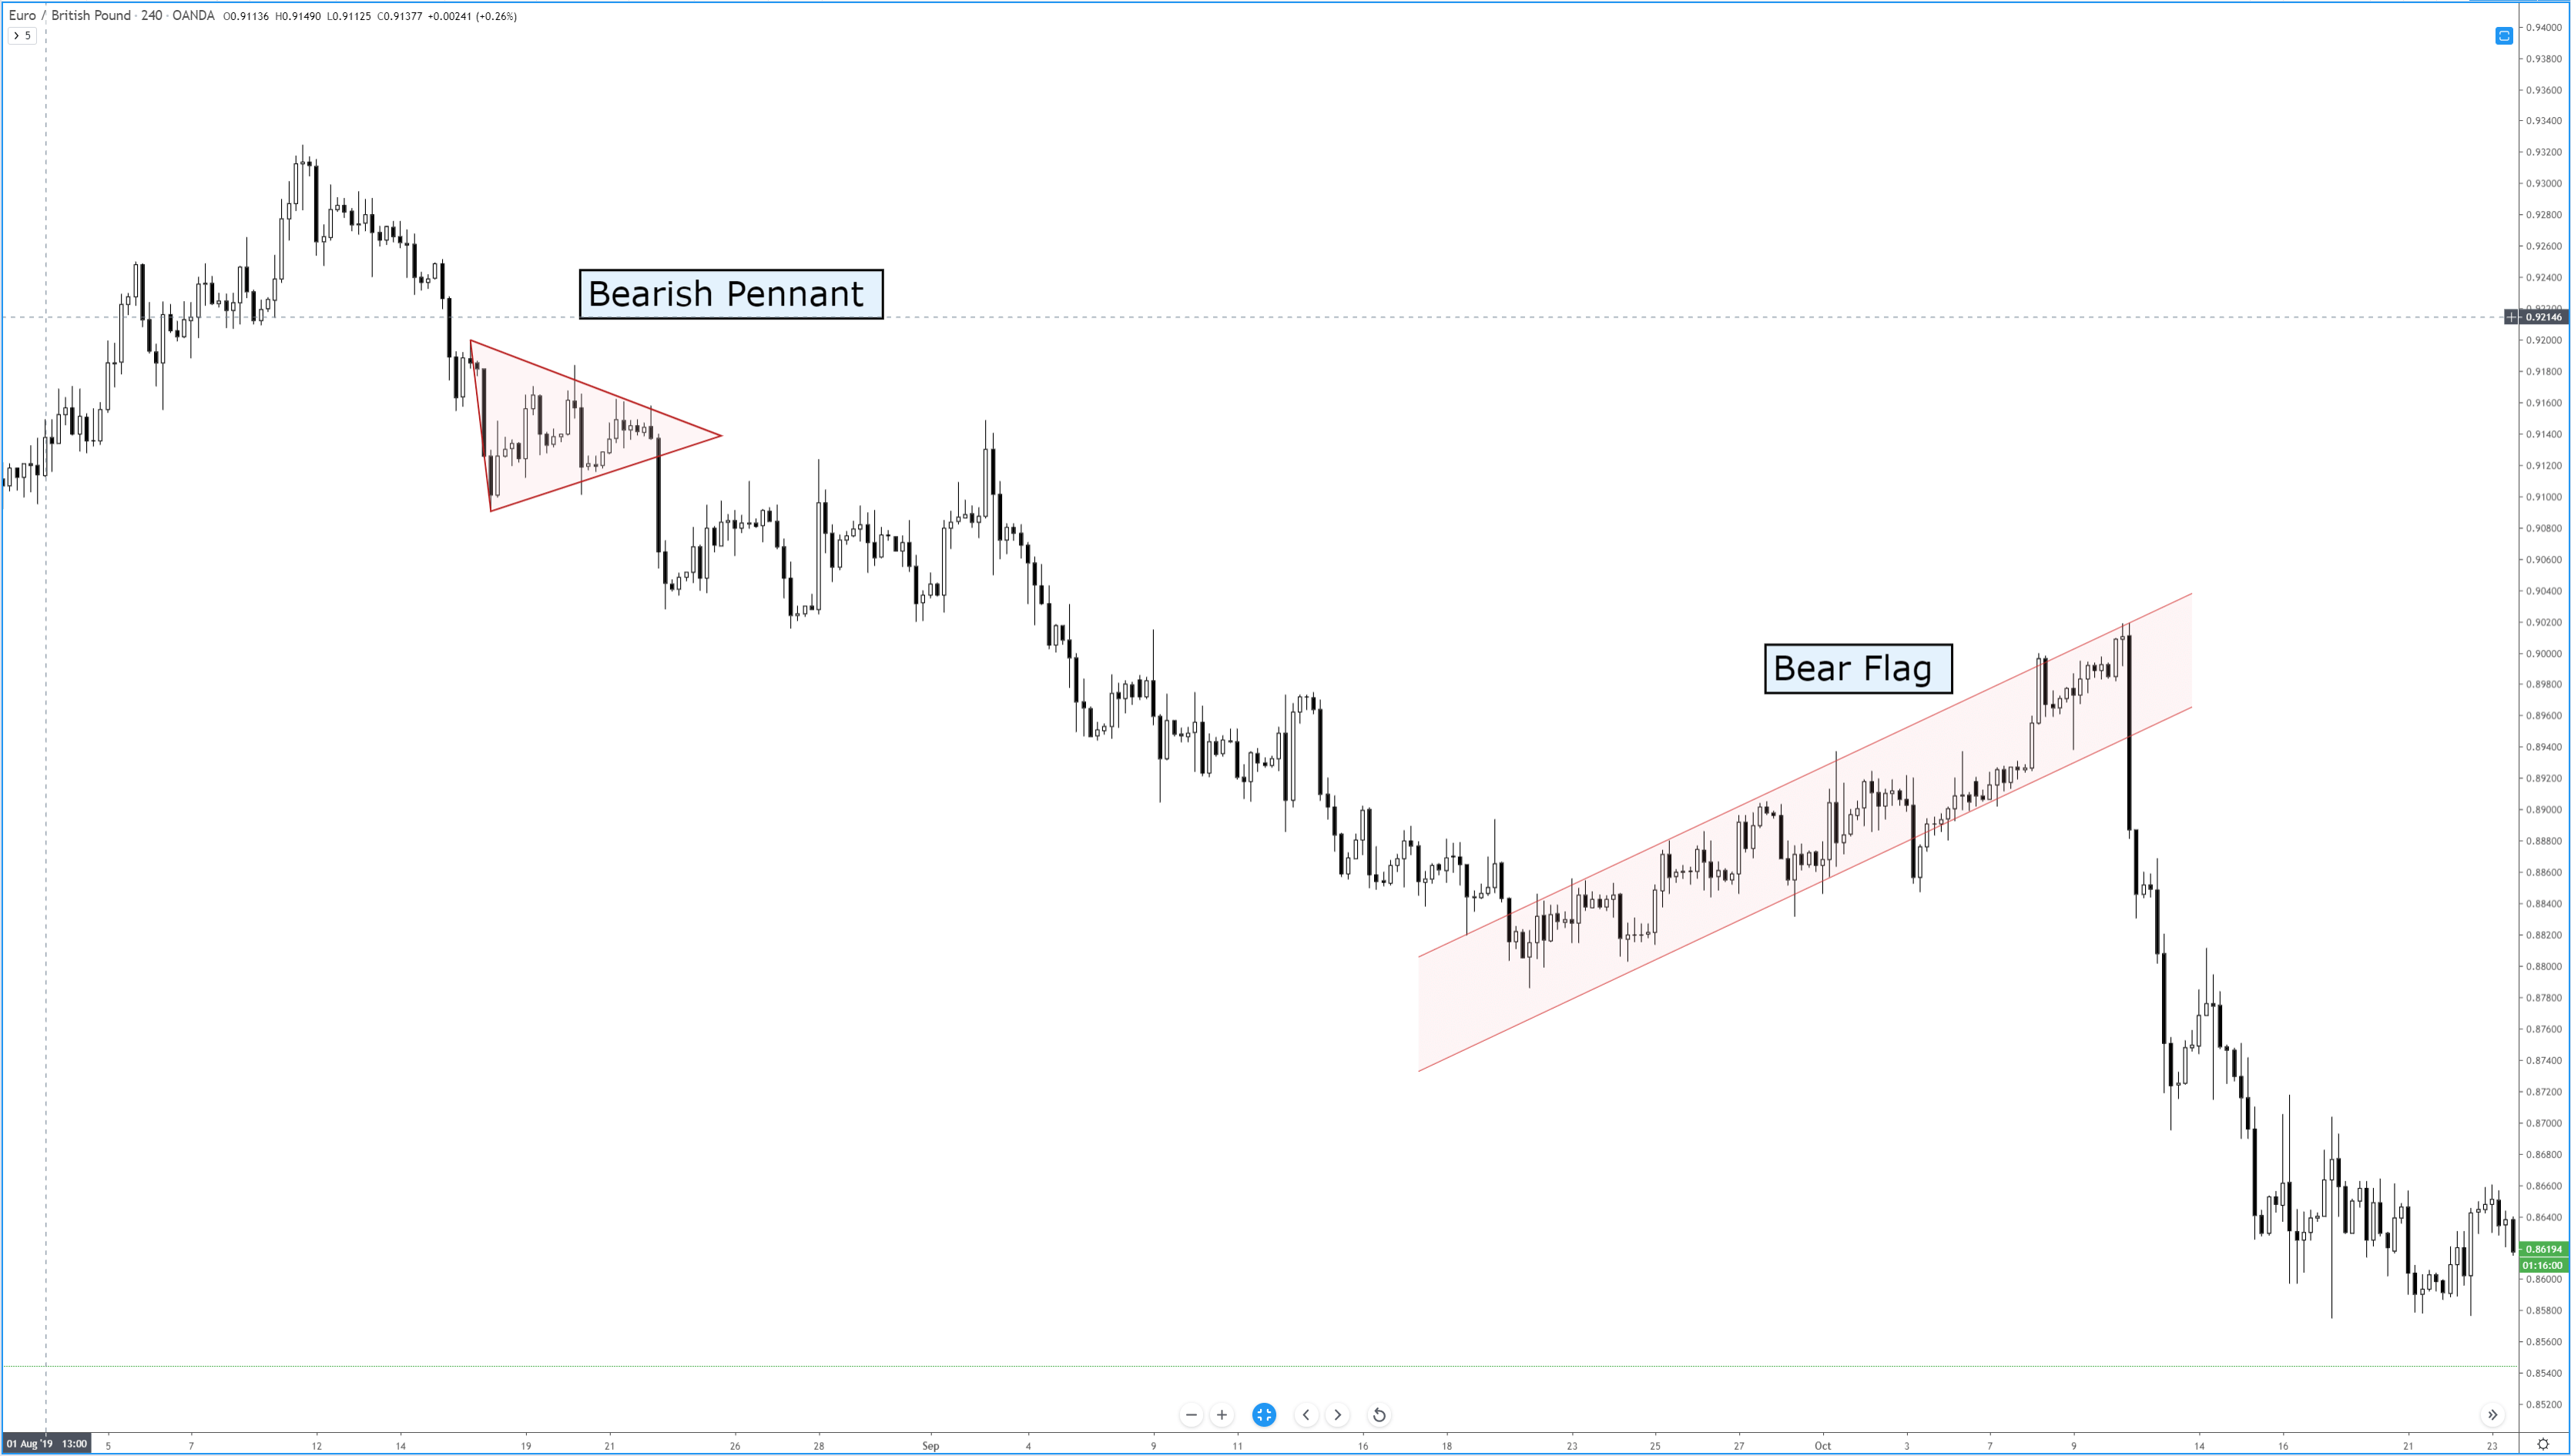
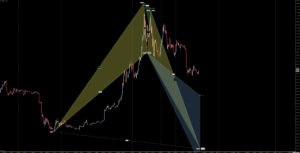
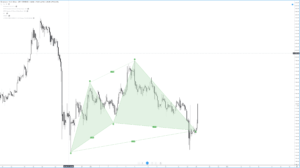
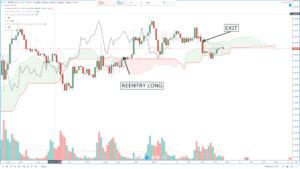
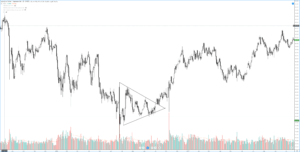
The images above show examples of bearish flags and bearish pennants, as well as bullish flags and bullish pennants. If you are unfamiliar with how to trade triangles or rectangles, refer to the articles that discuss the various triangle patterns. But we can review the basics of entering these great continuation patterns.
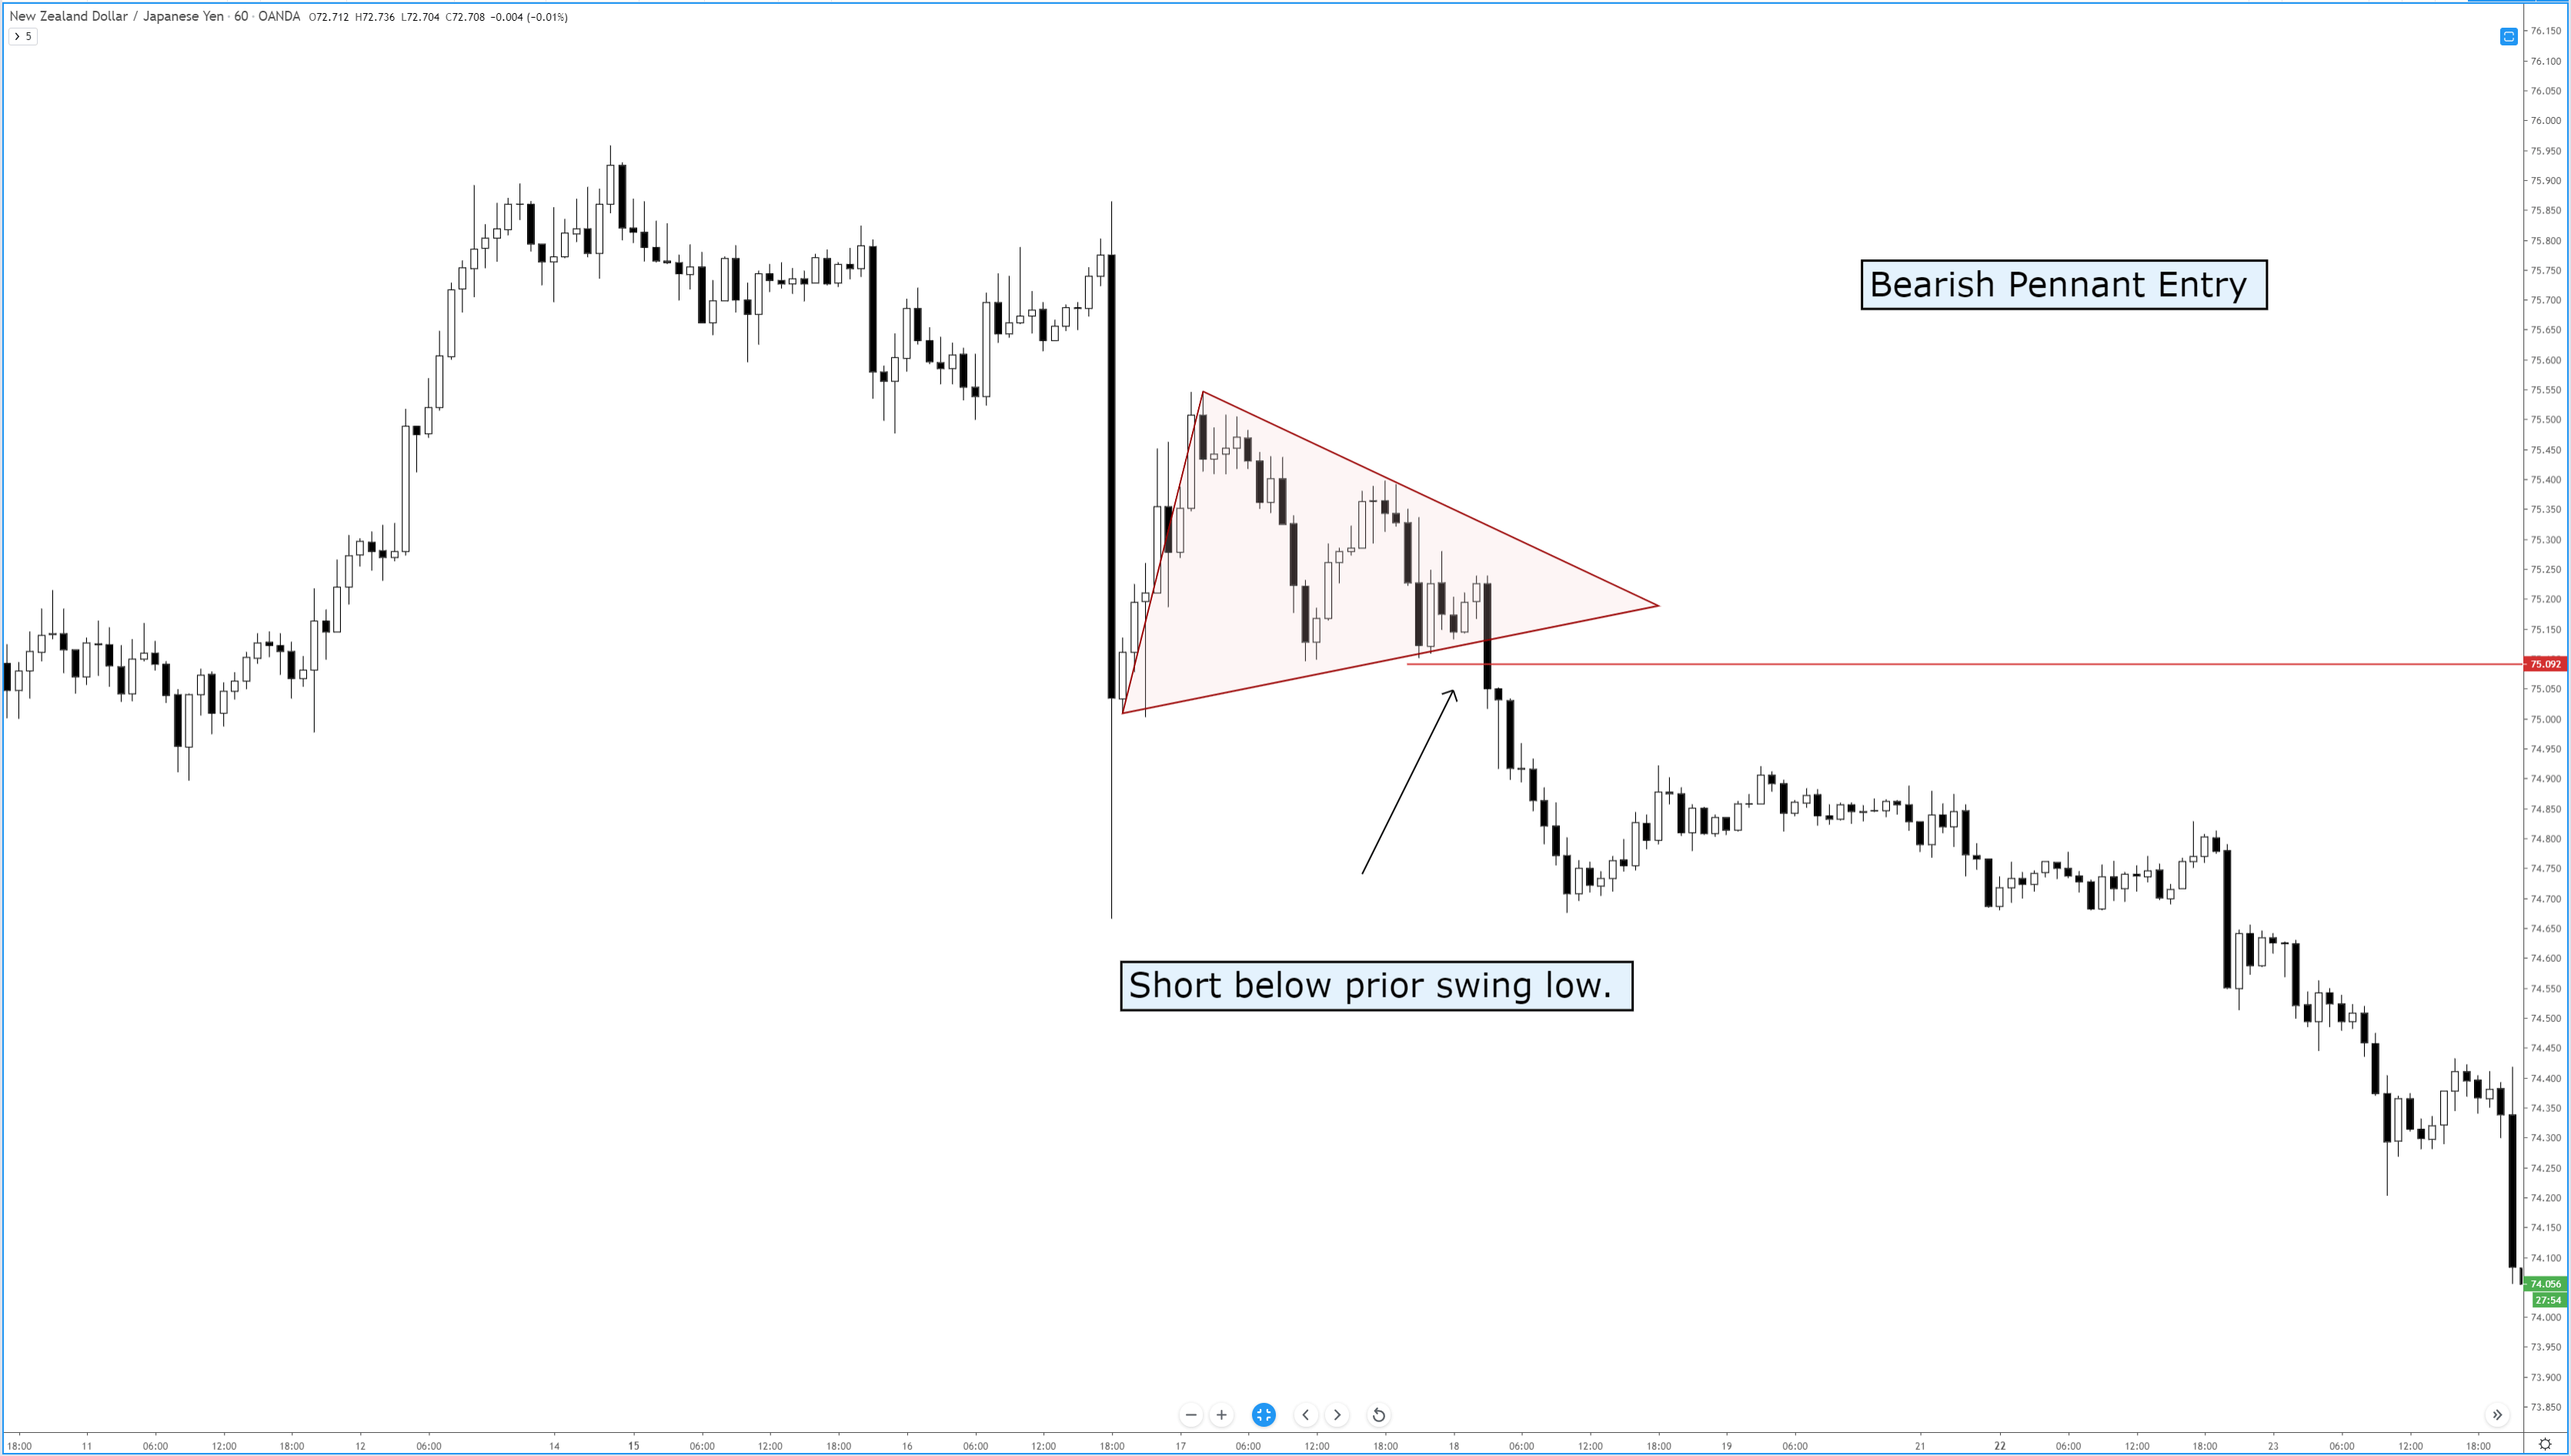

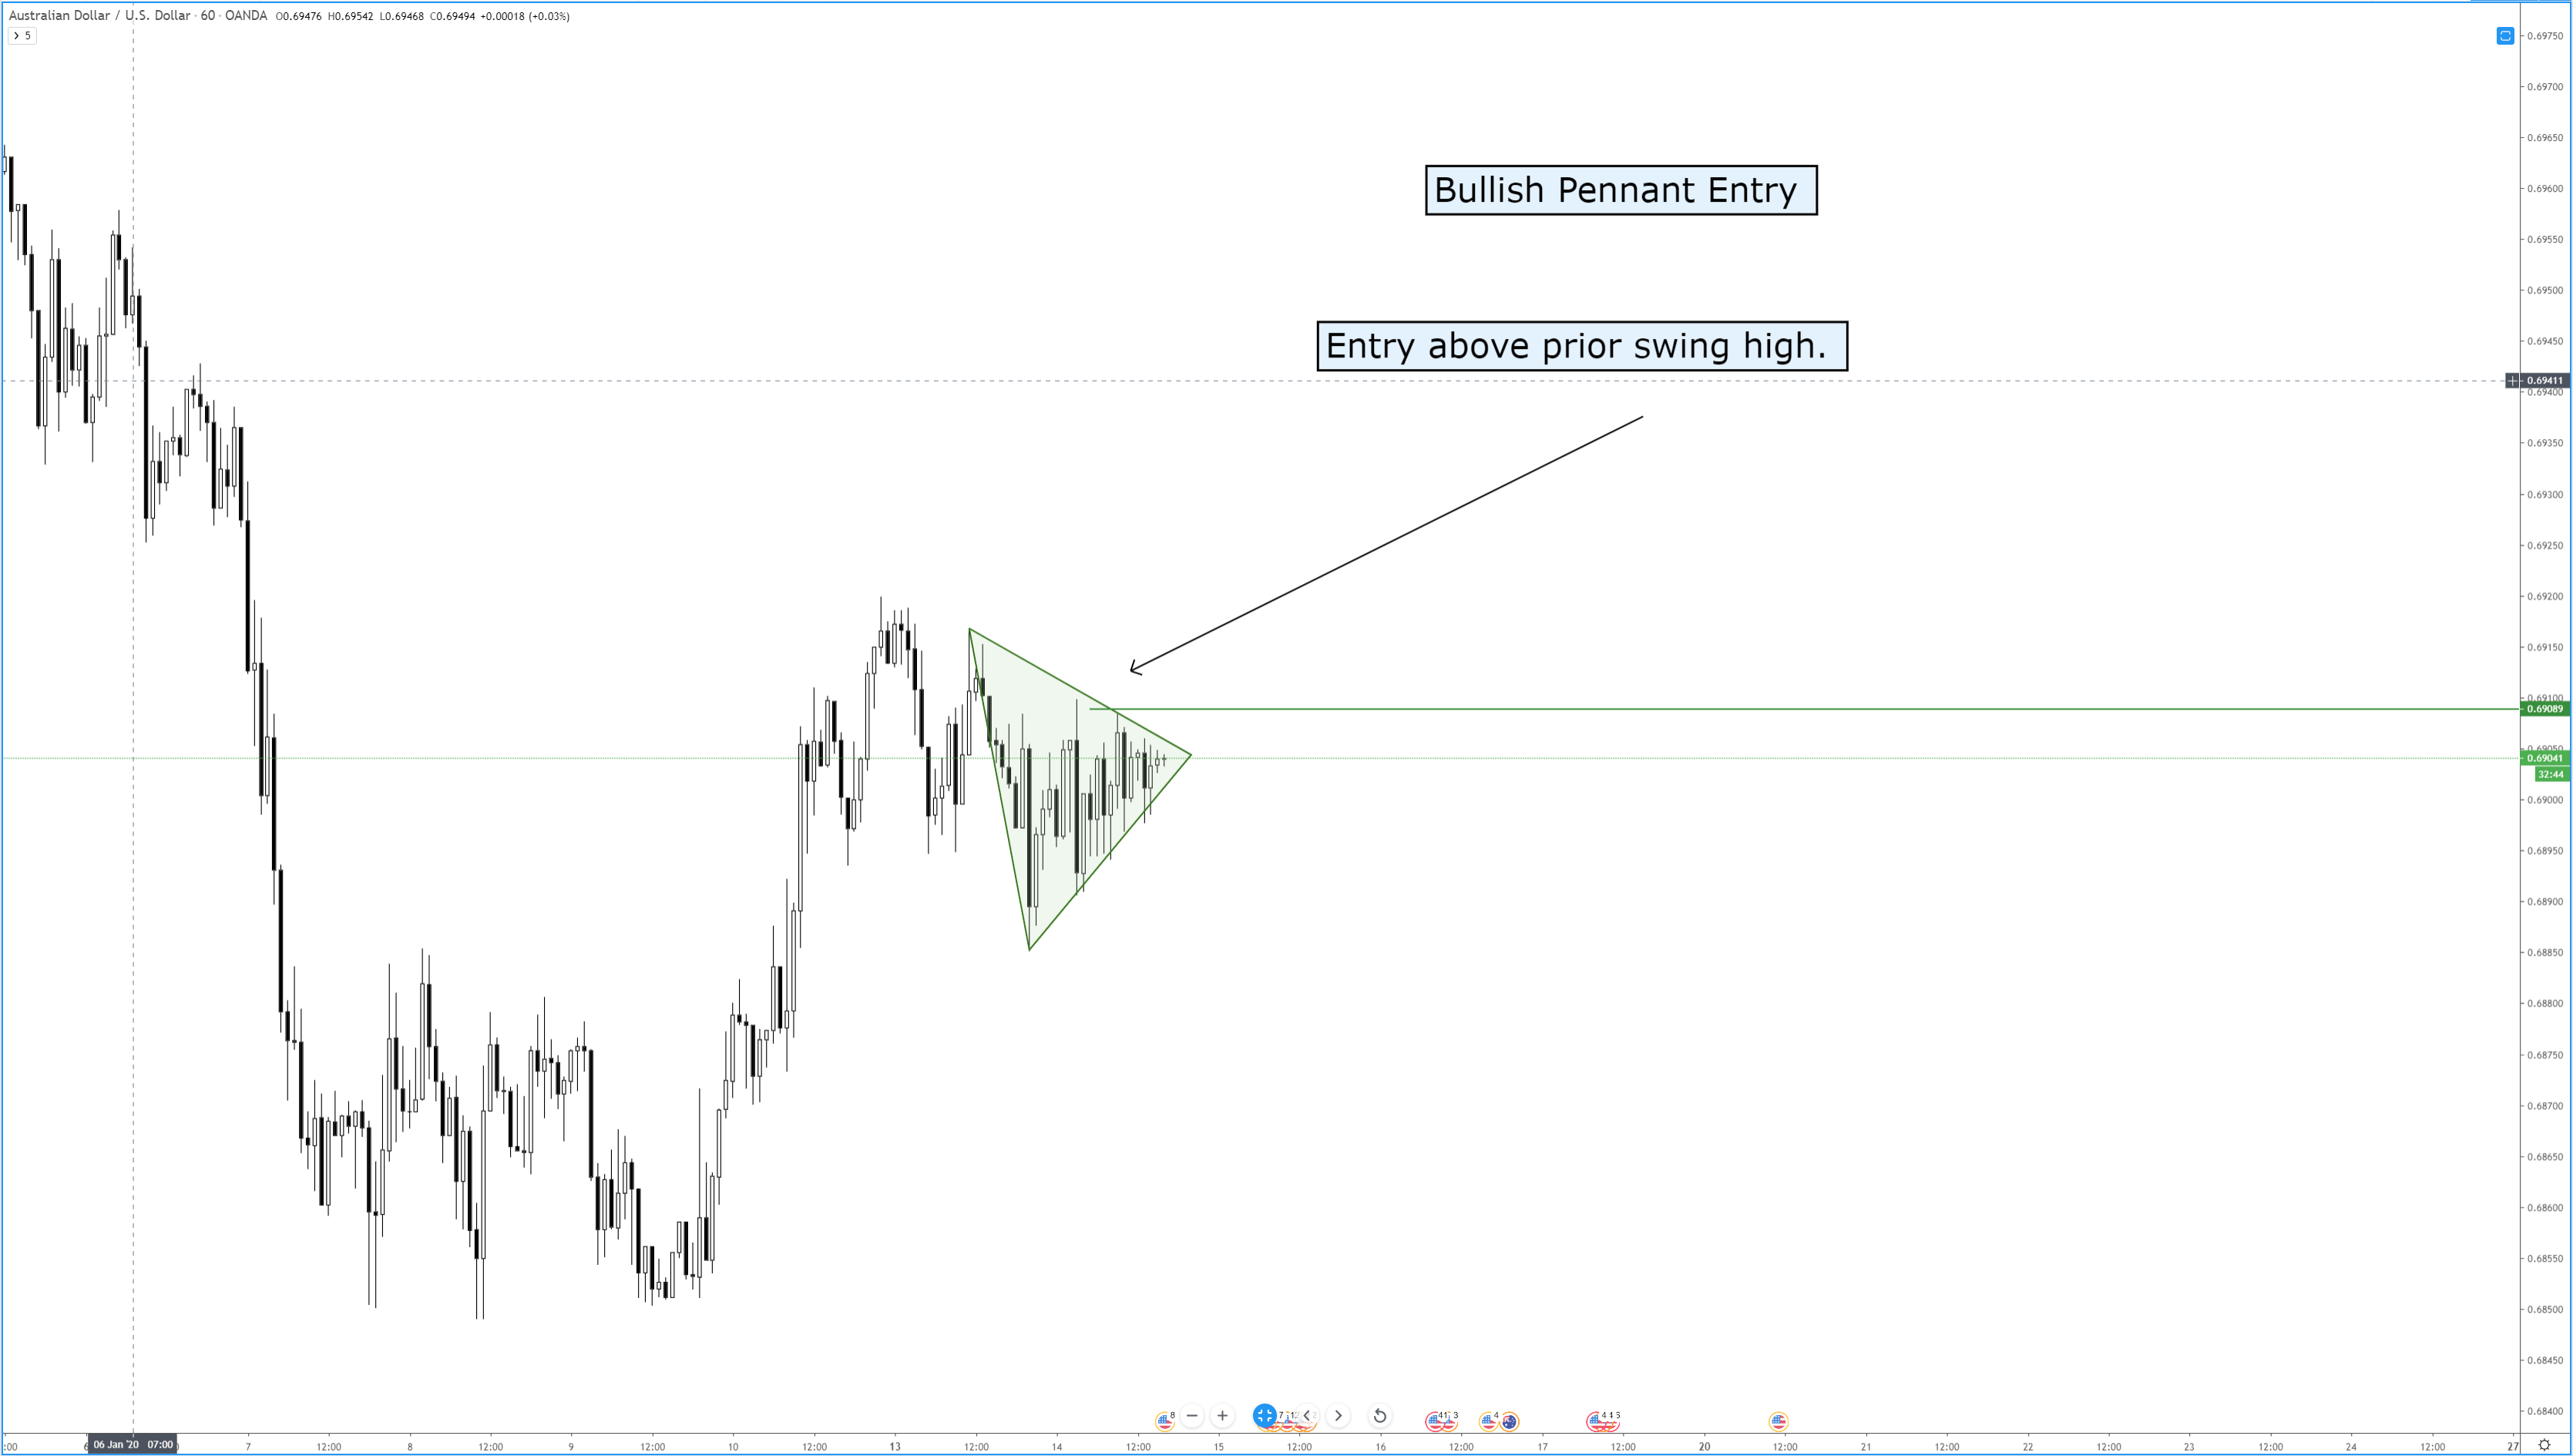
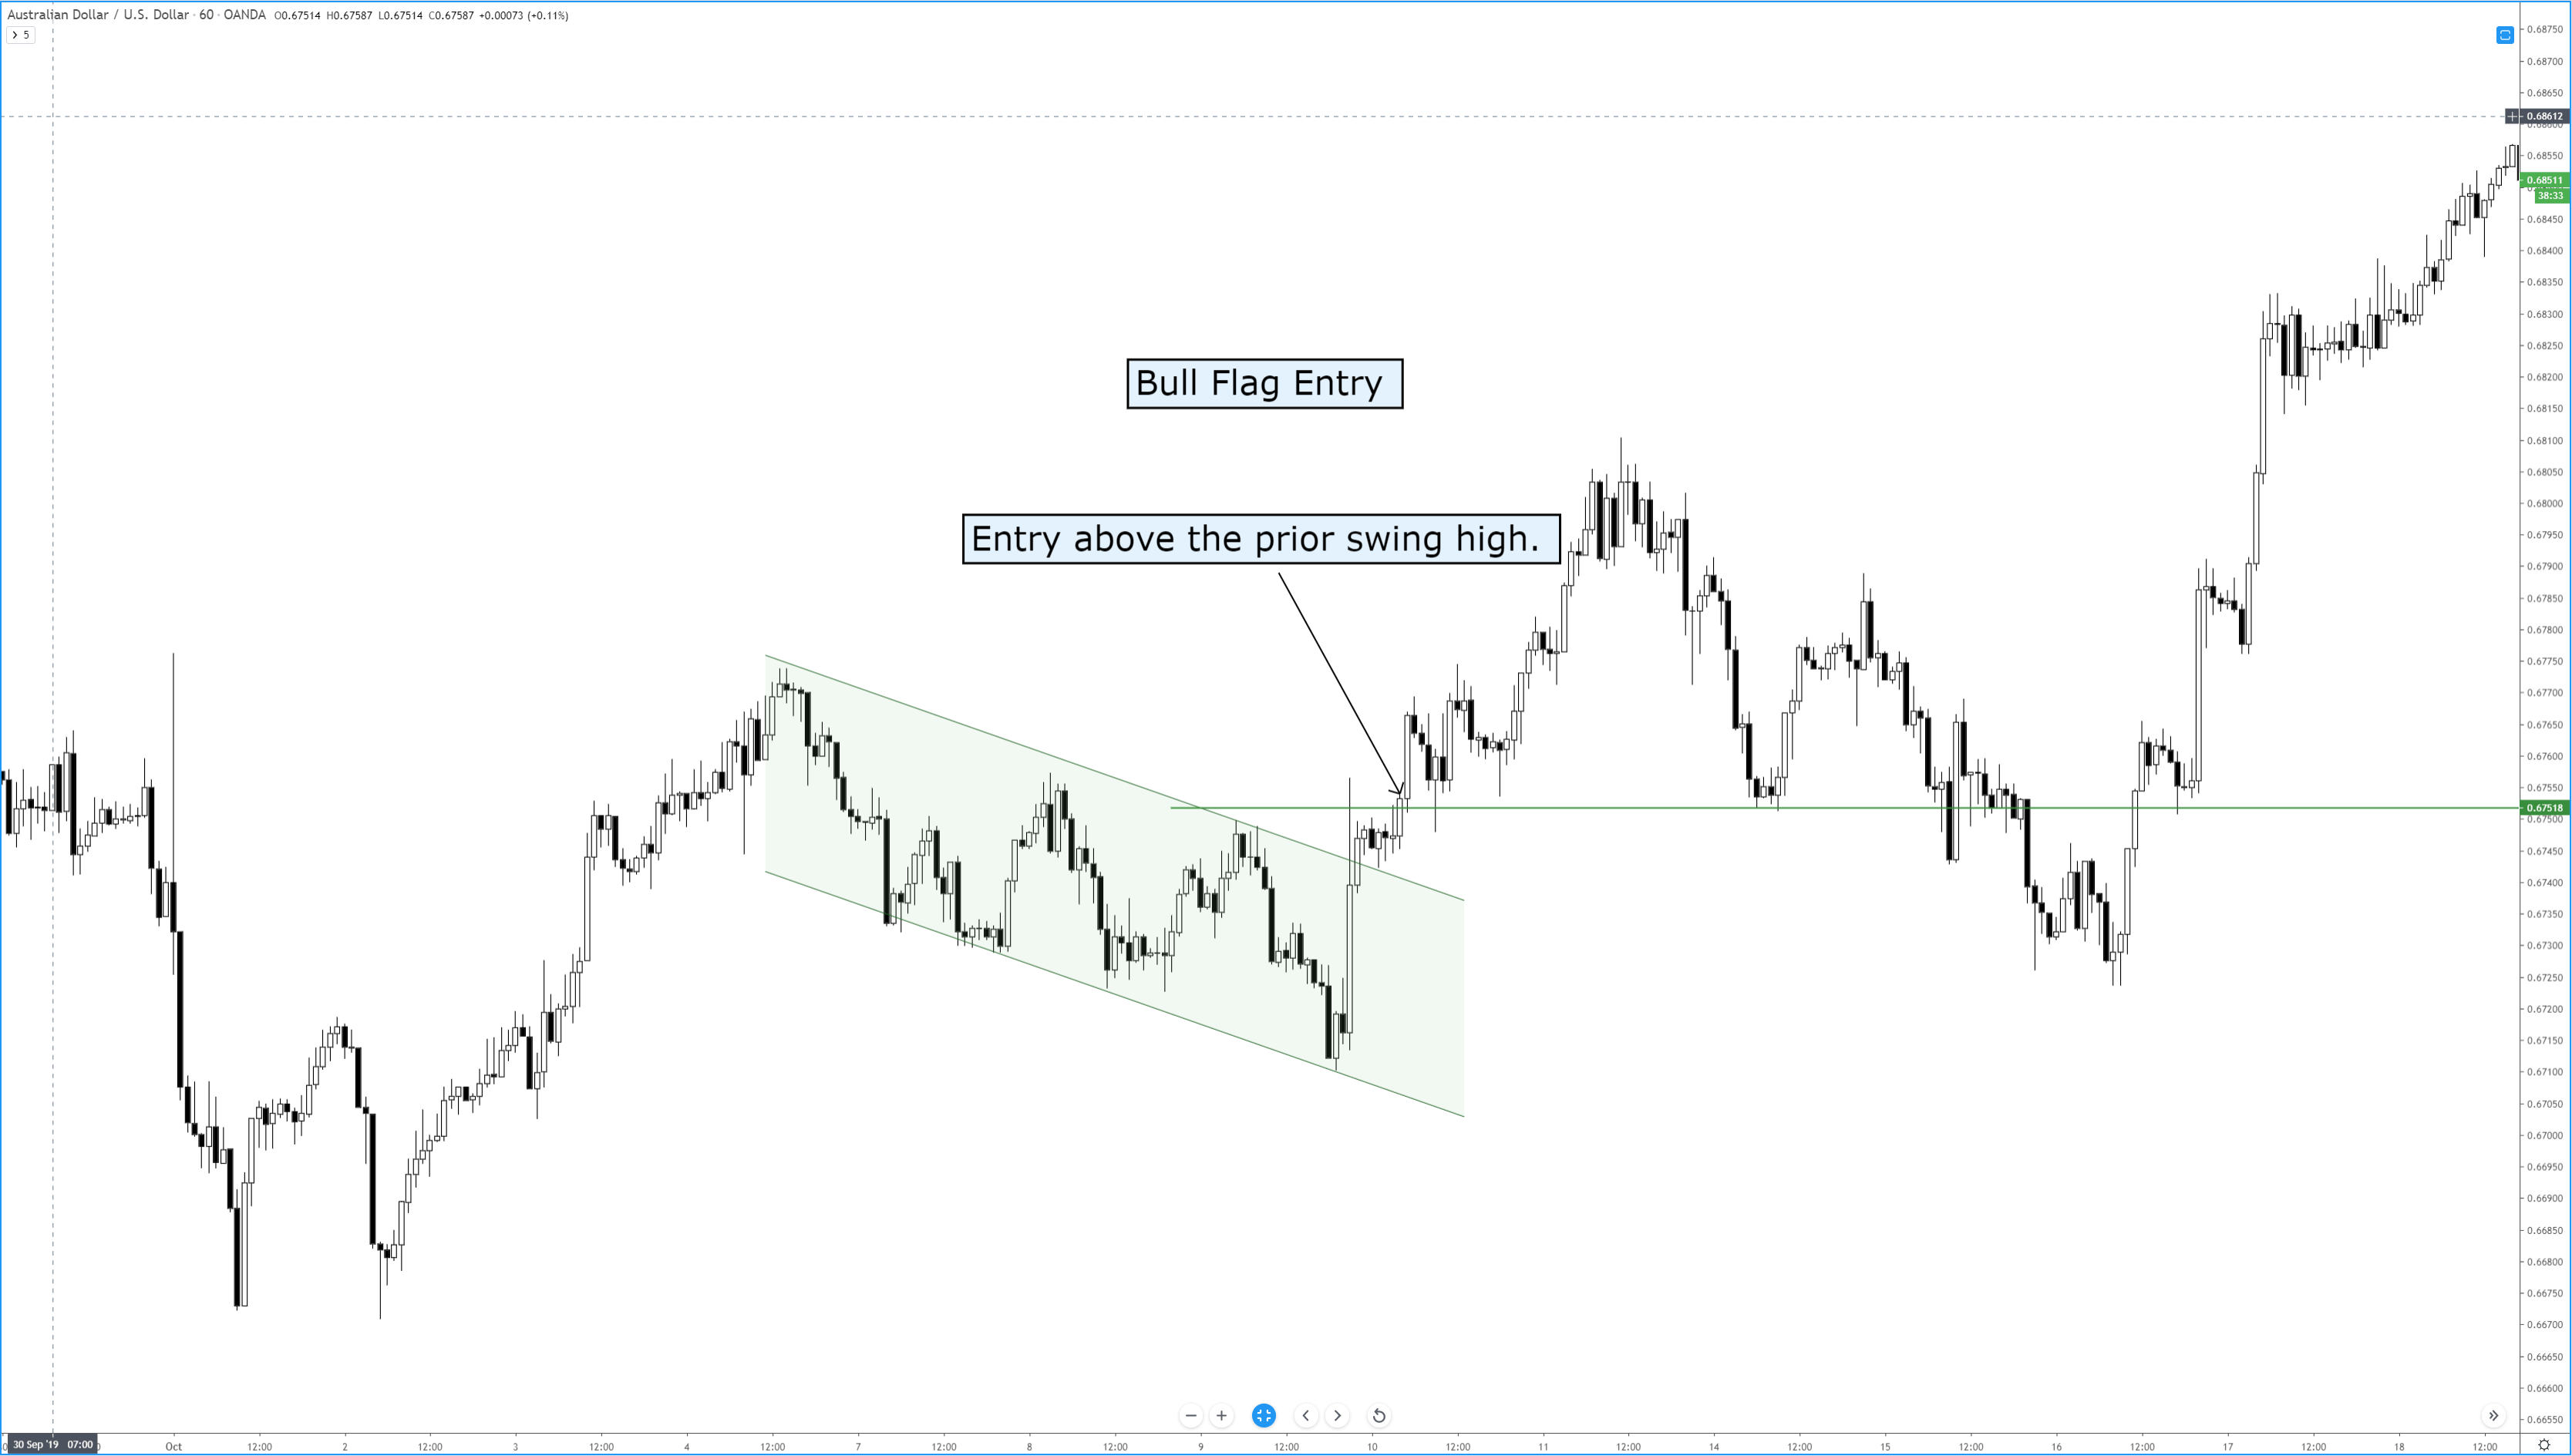
Learning how to trade flags and pennants is one of the most useful and enjoyable things that you can learn – especially as a new trader. Flags and pennants help train your brain to get used to buying dips during bull runs and shorting rallies during bear moves. If you get to a point where you can profitably trade flags and pennants, then you have transitioned into a trader who is very near outperforming the vast majority of your peers. It may seem like an easy thing to do – but it is an entirely different thing to execute. Analyzing and identifying a flag or pennant is easy; trading it is difficult.
I can not stress enough how profitable these patterns can be – and how easily you can miss them even in plain sight. The problem resides with your brain – that ‘lizard’ part that kicks in when you are are fearful of your account. When you begin to feel the fear of your account losing money, that triggers a powerful part of your brain known as the limbic system. The limbic system controls fear and pleasure. And when your fear sense is triggered, it hyper focuses the synapsis across your brain. Things that you would passively identify like flags and pennants are tertiary in their importance when the limbic system is acting in your defense. You need to find ways to ‘pause’ the process with things like alerts. On the images above, you saw horizontal lines above prior swing highs and below prior swing lows. Placing alerts at those points may be enough to interrupt your primary fear response and allow you to make money on your emotions.
Because if you are feeling it, so is everyone else.
Sources:
Kirkpatrick, C. D., & Dahlquist, J. R. (2016). Technical analysis: the complete resource for financial market technicians. Upper Saddle River: Financial Times/Prentice Hall.
Bulkowski, T. N. (2013). Visual guide to chart patterns. New York, NY: Bloomberg Press.
Bulkowski, T. N. (2008). Encyclopedia of candlestick charts. Hoboken, NJ: J. Wiley & Sons.
Bulkowski, T. N. (2002). Trading classic chart patterns. New York: Wiley.


