On the news front, the eyes will remain on the FOMC Statement and Federal Funds Rate, which is not expected to change the interest rate. Still, it will help us understand U.S. economic situation and policymakers’ stance on it. Besides, the Durable Goods Orders m/m from the U.S. will also remain in highlights.
Economic Events to Watch Today
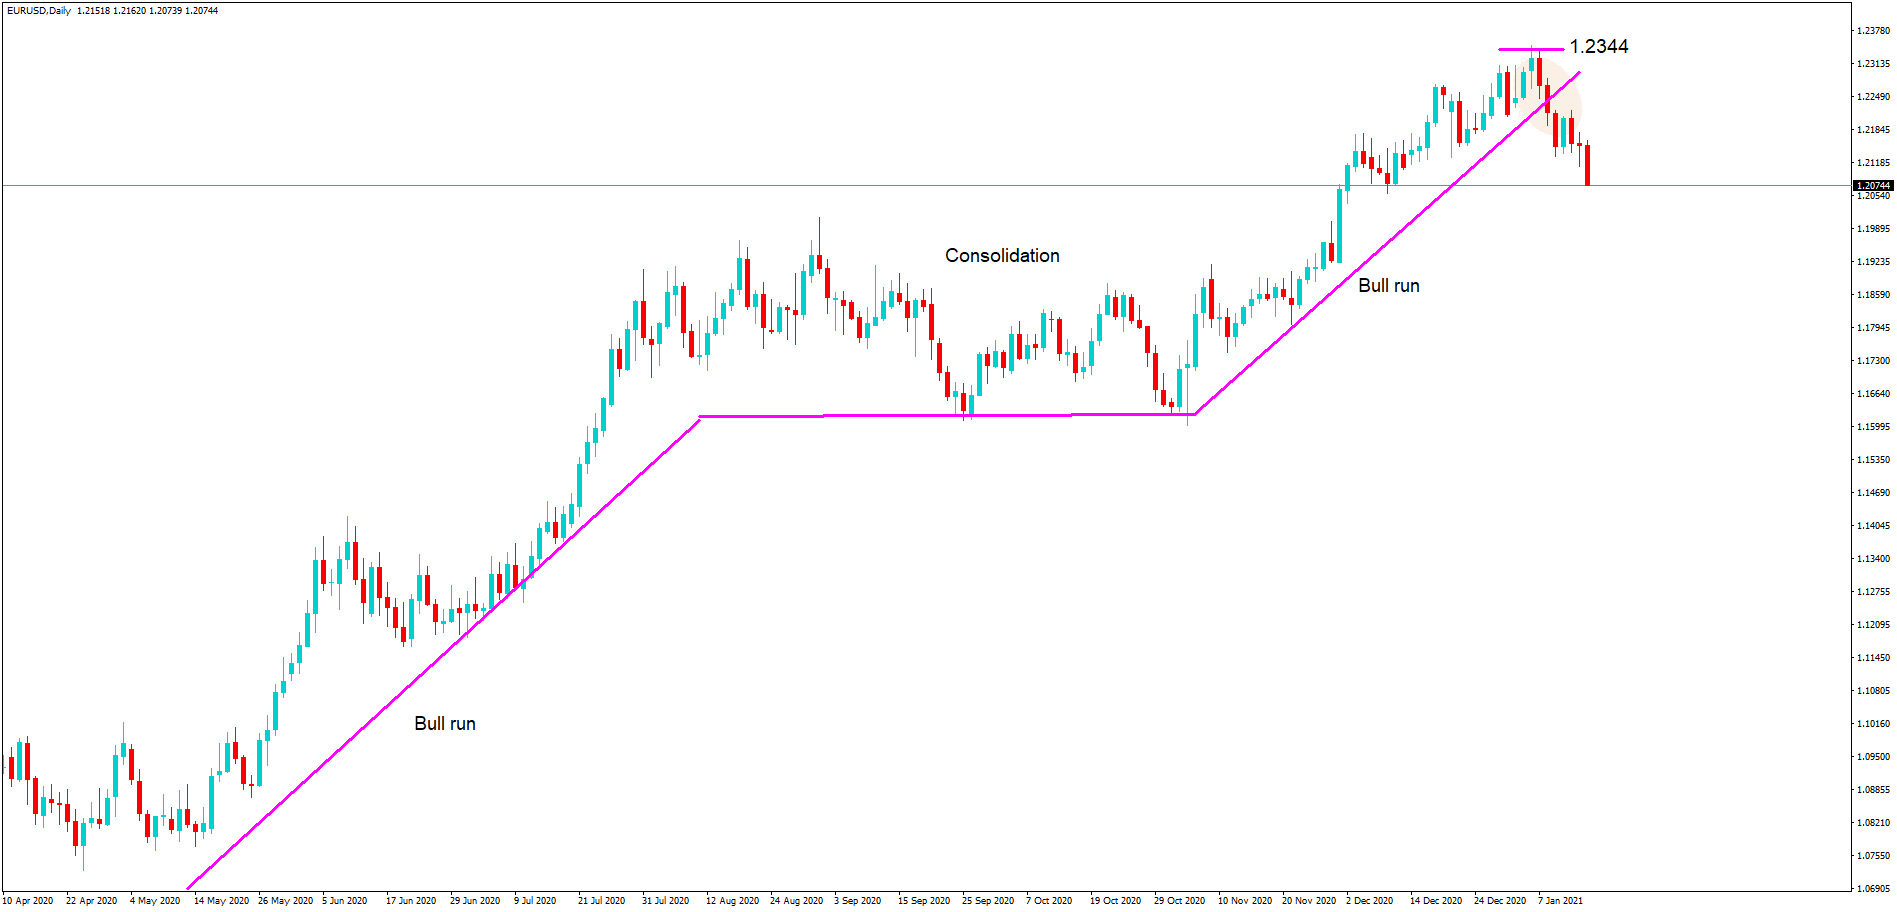
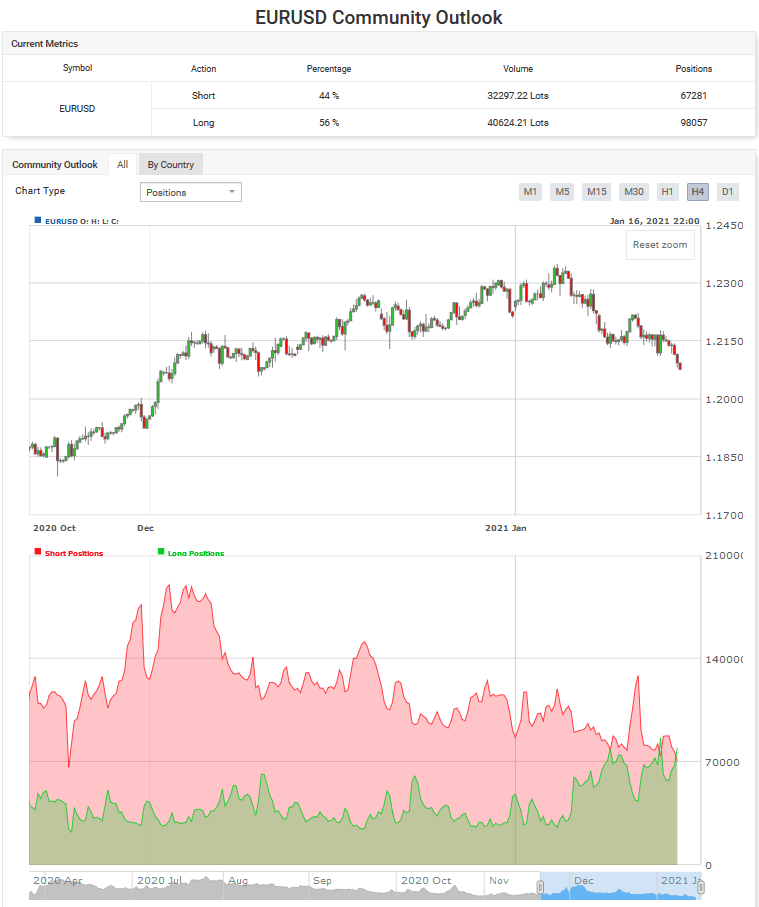
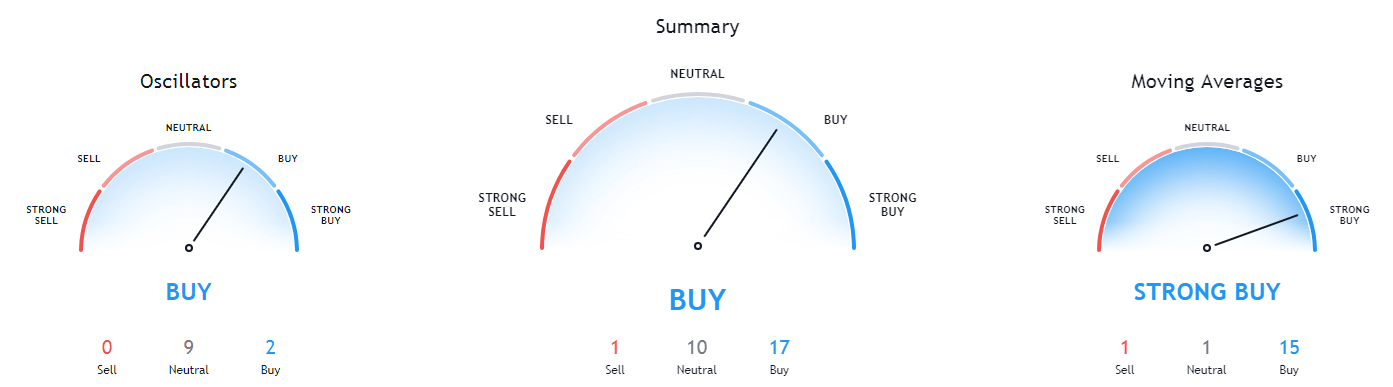
EUR/USD – Daily Analysis
The EUR/USD closed at 1.21595 after placing a high of 1.21756 and a low of 1.21076. The EUR/USD pair edged higher on Tuesday as the U.S. Dollar Index (DXY) dropped and the risk appetite in the market witnessed a major turnaround. After a mixed start on the session, the European equities embarked upon a recovery mode and brought back the market’s risk sentiment. The pan-European benchmark, the Euro Stoxx 50, rallied by 1% and lifted the overall market mood. Whereas, the safe-haven U.S. dollar came under pressure after a rise in European equities and come back of risk sentiment that ultimately added gains in the currency pair EUR/USD on Tuesday.
In the early Asian trading session, the main currency pair EUR/USD extended its previous day’s bearish sentiment and fell below 1.2108, on the back of the U.S. dollar’s strength gathered by the risk-off market mood driven by the deadlock over U.S. fiscal stimulus and the renewed US-China tensions over the South China Sea.
On Tuesday, China said that it would conduct military exercises in the South China Sea this week, just days after complaining that a U.S. aircraft carrier group has sailed through the disputed waters. These rising tensions between the world’s two largest economies raised the safe-haven appeal in early trading hours on Tuesday. They lifted the greenback that ultimately dragged the currency pair EUR/USD on the downside.
However, during early European trading hours, the risk-sentiment started to come back as the positive shift in the tone of the news flow on the coronavirus front. Moderna and Pfizer announced that they were looking into coronavirus booster shots that would specifically target building immunity to variants of the virus, such as that discovered in South Africa a few weeks ago.
Furthermore, Johnson & Johnson’s CFO has said earlier that they expect to release COVID-19 vaccine trial data next week. The company was very optimistic that they will be releasing a very robust data set. The J&J’s vaccine has been advertised as a game-changer in the vaccination race as it would only require one shot to acquire full immunity. This vaccine-related optimism helped risk sentiment in the market and supported riskier assets like EUR/USD pair on Tuesday.
On the data front, there was no macroeconomic data released from the European side. In contrast, from the U.S. side, at 19:00 GMT, the Housing Price Index from the U.S. for November rose to 1.0% against the forecasted 0.9% and supported the U.S. dollar that capped further upside in the EUR/USD pair.
The S&P/CS Composite -20 HPI for the year also rose to 9.1% against the forecasted 8.8% and supported the U.S. dollar. At 19:59 GMT, the Richmond Manufacturing Index for January declined to 14 against the forecasted 18 and weighed on the U.S. dollar that added gains in the EUR/USD pair. At 20:00 GMT, the C.B. Consumer Confidence in January rose to 89.3 against the forecasted 88.9 and supported the U.S. dollar and limited further gains in the EUR/USD pair on Tuesday.
Daily Technical Levels
Support Resistance
1.2108 1.2177
1.2077 1.2215
1.2039 1.2245
Pivot Point: 1.2146
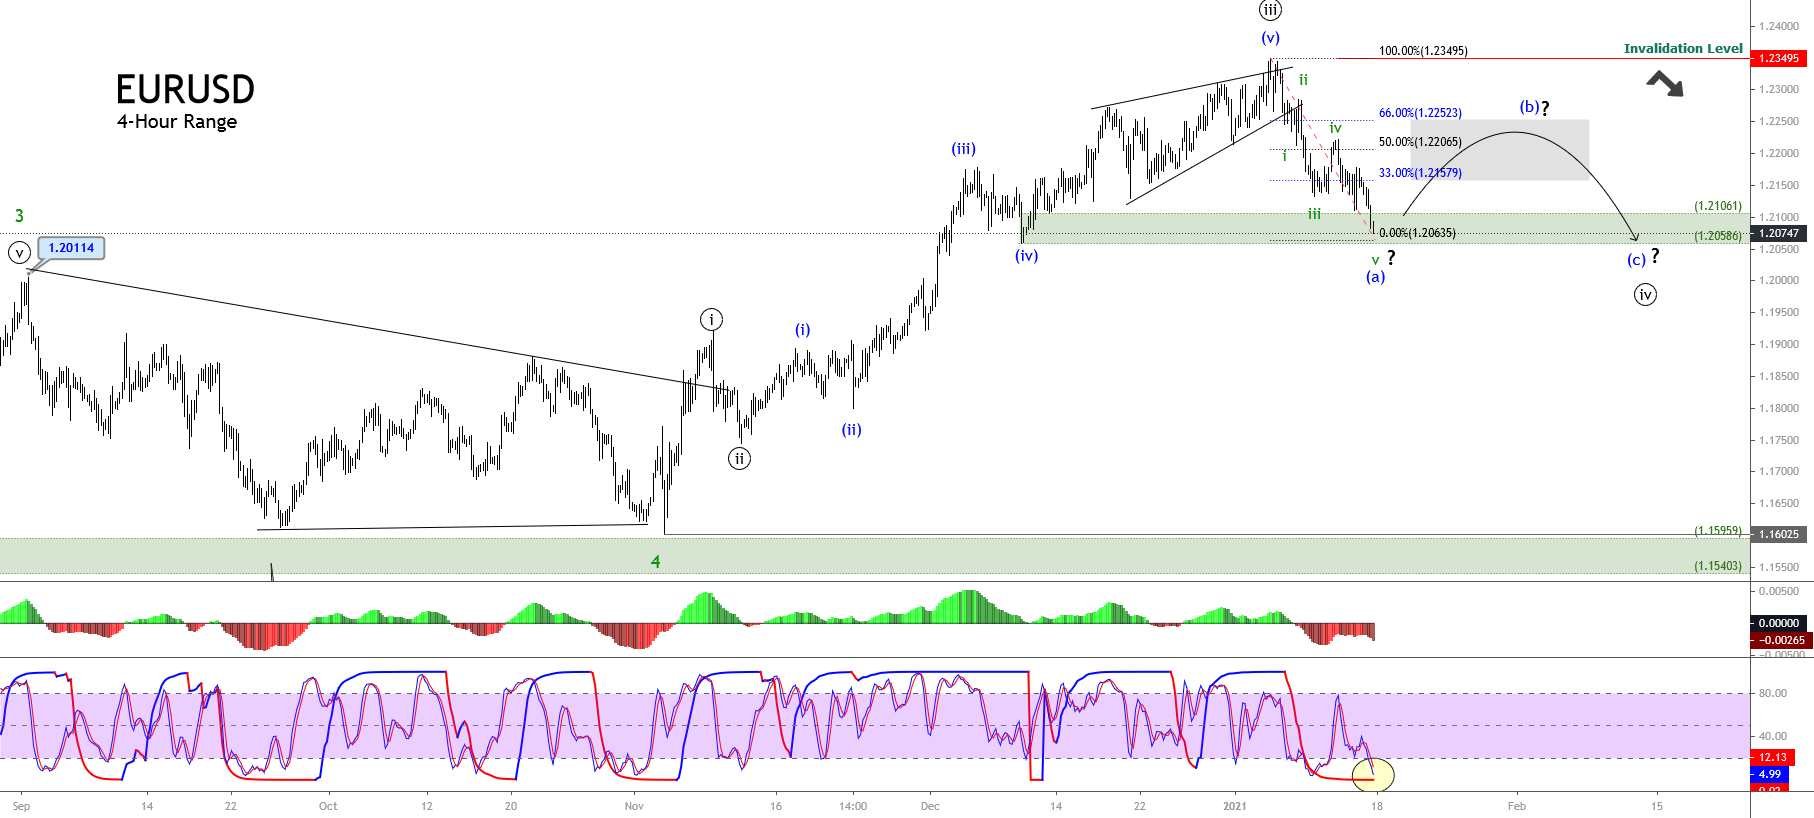
EUR/USD– Trading Tip
The EUR/USD pair is trading at 1.2156, facing immediate resistance at 1.2165 level. The EUR/USD has entered the overbought zone on the hourly timeframe, suggesting odds of bearish correction in the pair. On the lower side, the pair is likely to complete 38.2% Fibonacci retracement at 1.2150 and 61.8% Fibonacci retracement at 1.2134. Selling bias seems strong.
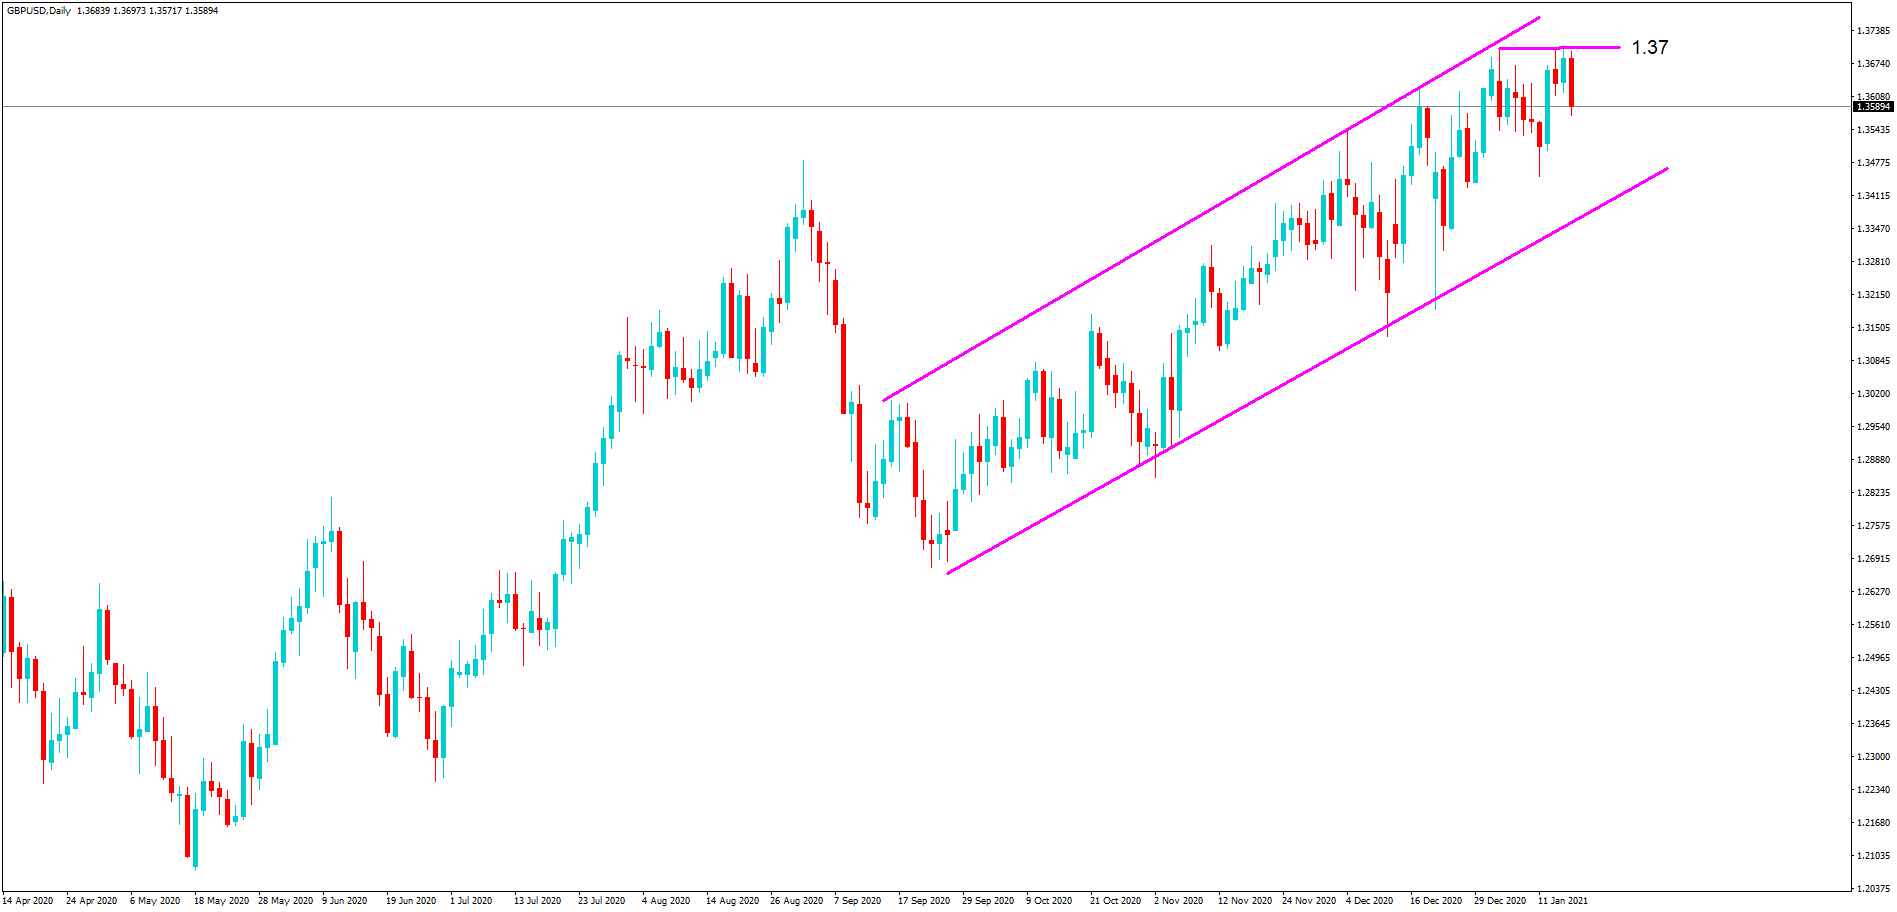
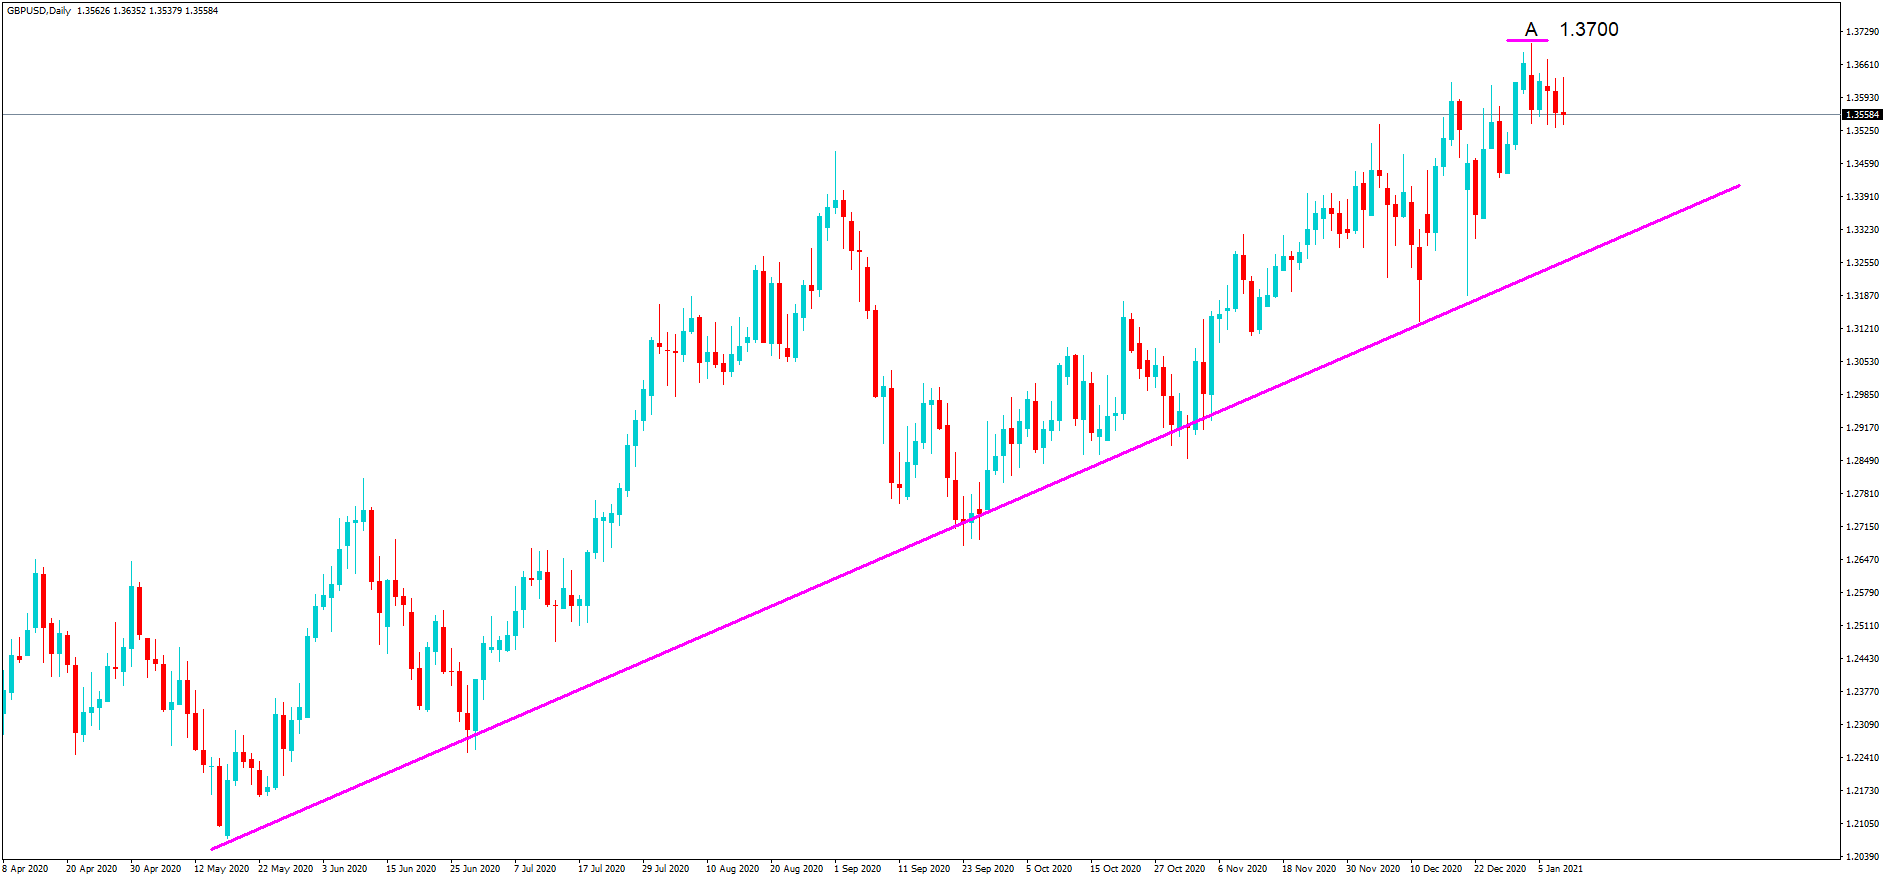
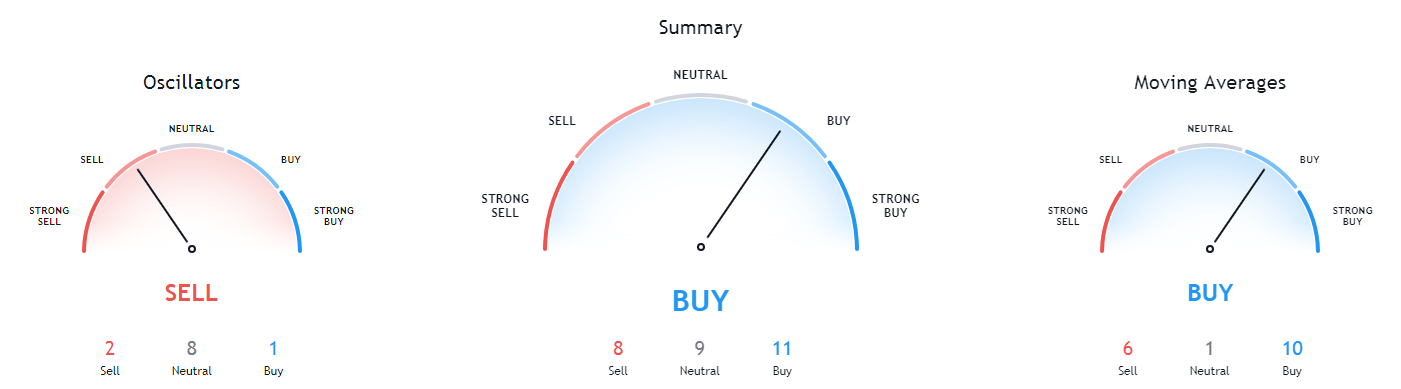
GBP/USD – Daily Analysis
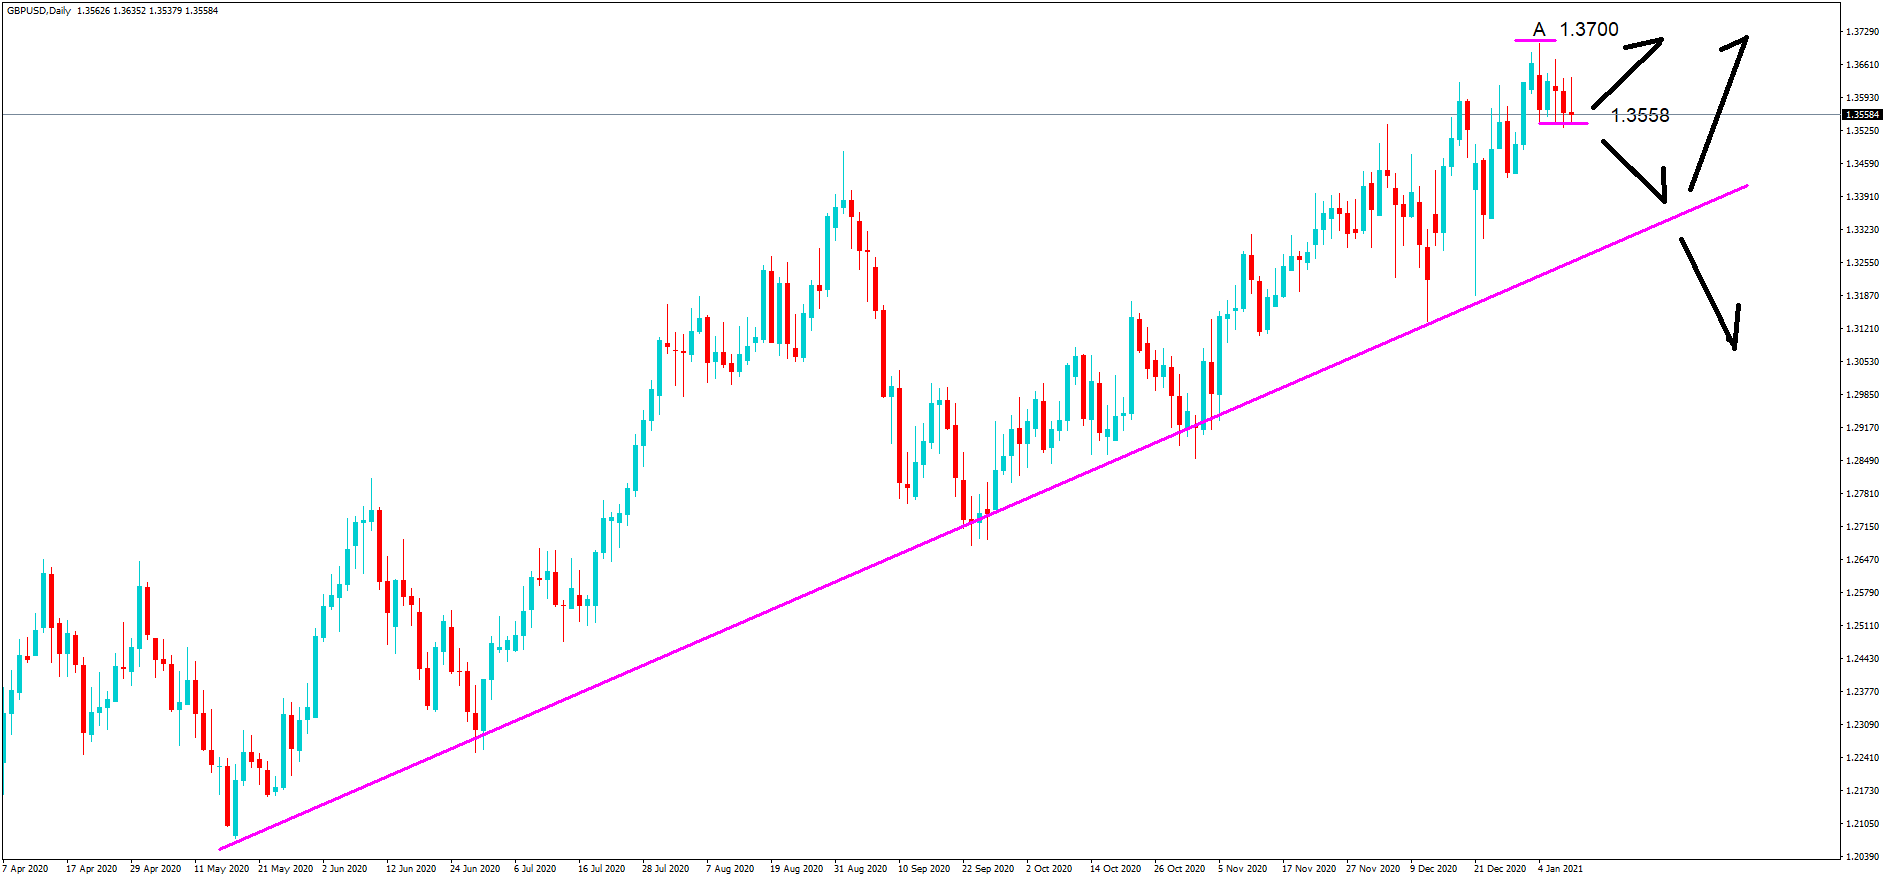
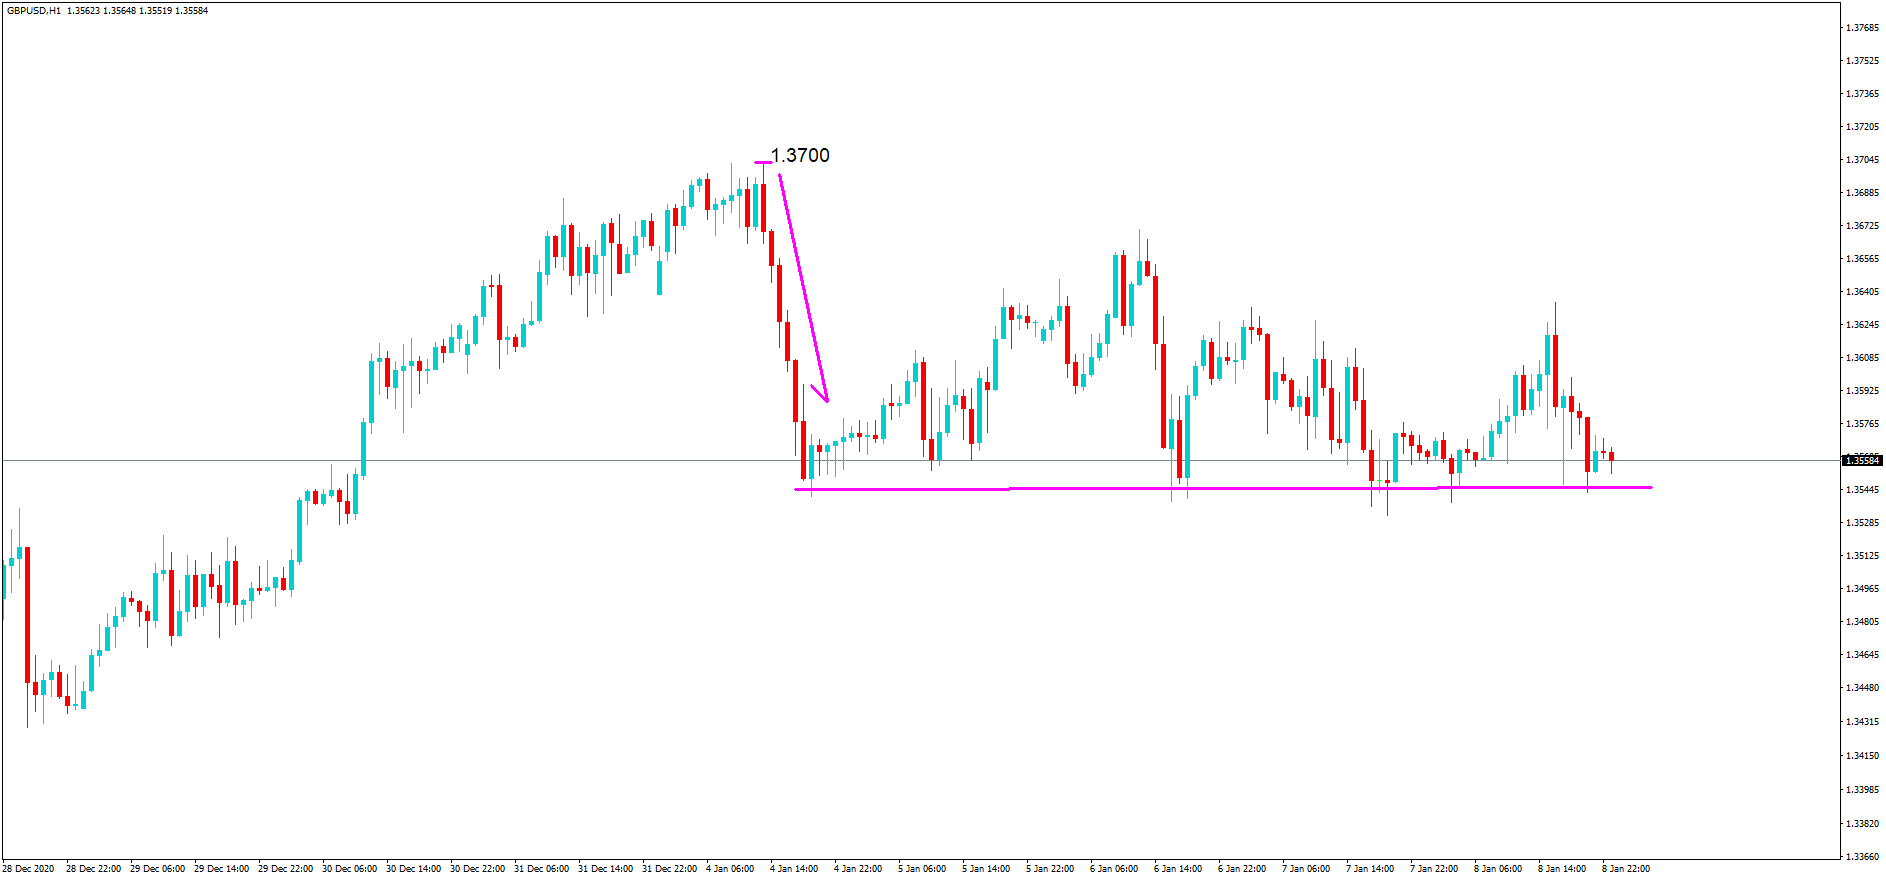
The GBP/USD pair was closed at 1.37363 after placing a high of 1.37443 and a low of 1.36092. GBP/USD pair rebounded on Tuesday during early European trading hours after falling below 1.36100 level. The GBP/USD pair’s comeback was due to the recovered risk appetite in the market and Britain’s strong job report.
However, despite the strong macroeconomic data from Great Britain, the GBP/USD pair benefited from the broad U.S. dollar’s weakness on Tuesday as investors focused more on the U.S. Federal Reserve’s upcoming decision. The risk appetite took a significant turn during the early European trading hours after a downbeat Asa Pacific session. It weighed on the safe-haven U.S. dollar that ultimately lifted the GBP/USD pair on Tuesday. U.S. stocks were high, European equities erased most of Monday’s losses, the crude oil market was also high, and bond yields were rising on both sides of the Atlantic.
The reason behind the turnaround of the risk sentiment was the positive vaccine news, as Moderna and Pfizer announced last night that they were starting investigating a booster vaccine shot that will come between 6-12 months after the second doses and will provide immunity against the new variants of coronavirus like the one emerged in South Africa in the past few days. Meanwhile, the Johnson & Johnson CFO also said on Tuesday that they expect to release the trail data for their coronavirus vaccine next week. They were very optimistic that the data will be robust and have claimed that their vaccine will be a game-changer in the vaccine race as it will provide full immunity in a single shot.
The rising risk sentiment in the market helped the risk perceived GBP/USD currency pair gain traction and rose to post gains for the day. On the data front, at 19:00 GMT, the Housing Price Index from the U.S. for November surged to 1.0% against the projected 0.9% and supported the U.S. dollar, and capped further upside in the GBP/USD pair. The S&P/CS Composite -20 HPI for the year also surged to 9.1% against the projected 8.8% and supported the U.S. dollar. At 19:59 GMT, the Richmond Manufacturing Index for January decreased to 14 against the projected 18 and weighed on the U.S. dollar, which ultimately added more GBP/USD pair gains. At 20:00 GMT, the C.B. Consumer Confidence in January surged to 89.3 against the projected 88.9 and supported the U.S. dollar that capped further bullish momentum in GBP/USD pair.
From the Britain side, at 12:00 GMT, the Average Earnings Index for the quarter raised to 3.6% against the estimated 2.9% and supported the British pound that pushed the pair GBP/USD even higher on board. For December, the Claimant Count Change declined to 7.0K against the forecasted 47.5K and supported Sterling, which ultimately added more GBP/USD pair gains. In December, the Unemployment Rate from Britain also dropped to 5.0%against the forecasted 5.1% and supported British Pound that lifted the bullish sentiment in GBP/USD pair. AT 16:00 GMT, the CBI Realized Sales in January dropped to -50 against the estimated -32 and weighed on British Pound and capped further upside in GBP/USD pair on Tuesday.
Another reason that could also be attributed to the rising prices of GBP/USD pair on Tuesday was UK PM Boris Johnson’s latest announcement about new travel instructions. The incoming passengers in the U.K. will need to self-fund a quarantine for ten days in a hotel. The new policy was a part of a government strategy to prevent foreign strains of the virus from entering the U.K. This also helped British Pound gain strength and support the GBP/USD pair’s upward momentum on Tuesday.
Daily Technical Levels
Support Resistance
1.3641 1.3717
1.3607 1.3759
1.3565 1.3794
Pivot Point: 1.3683
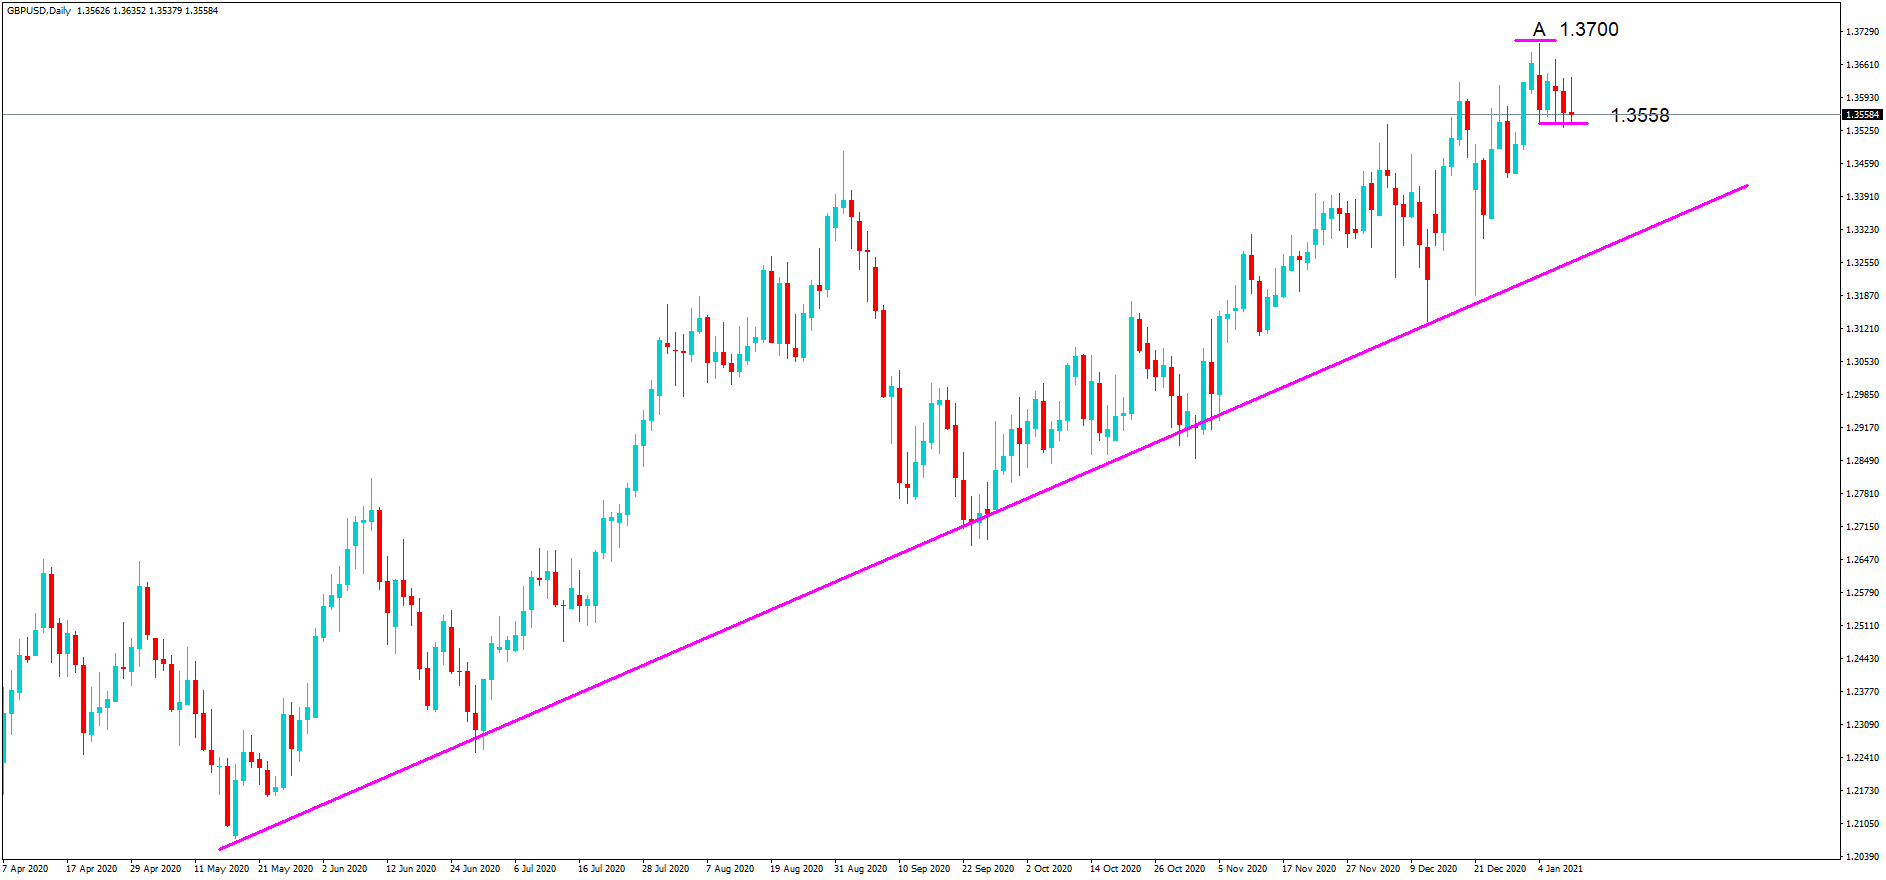
GBP/USD– Trading Tip
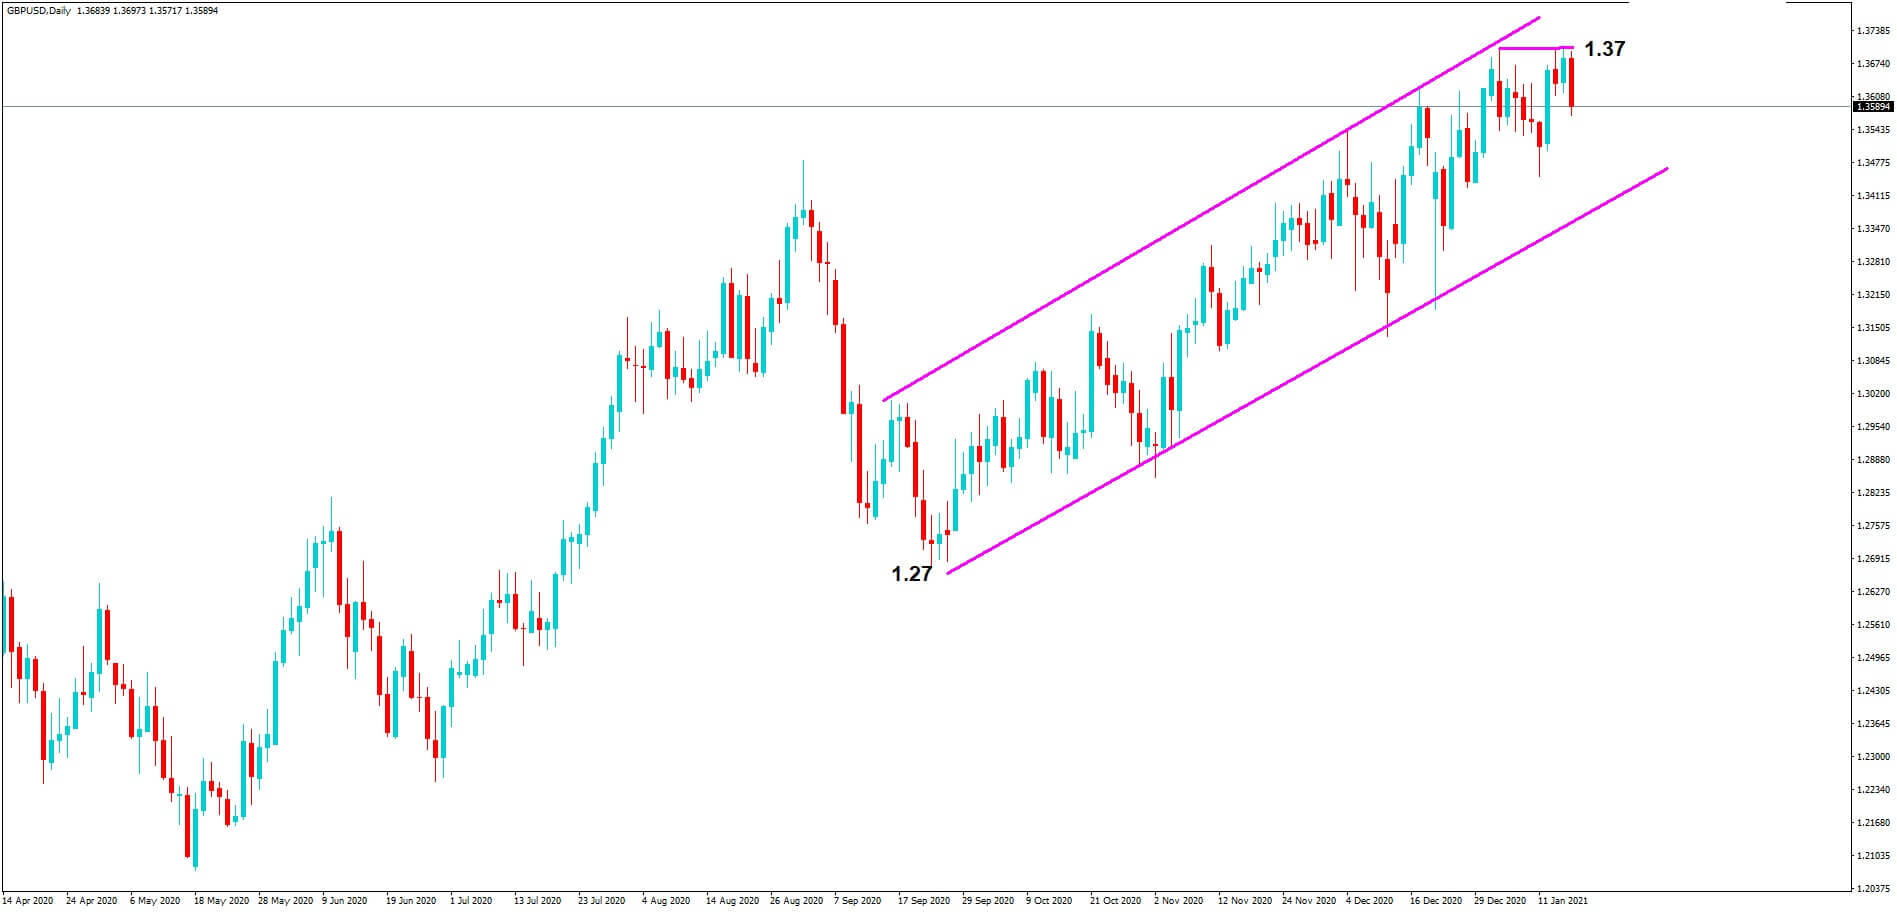
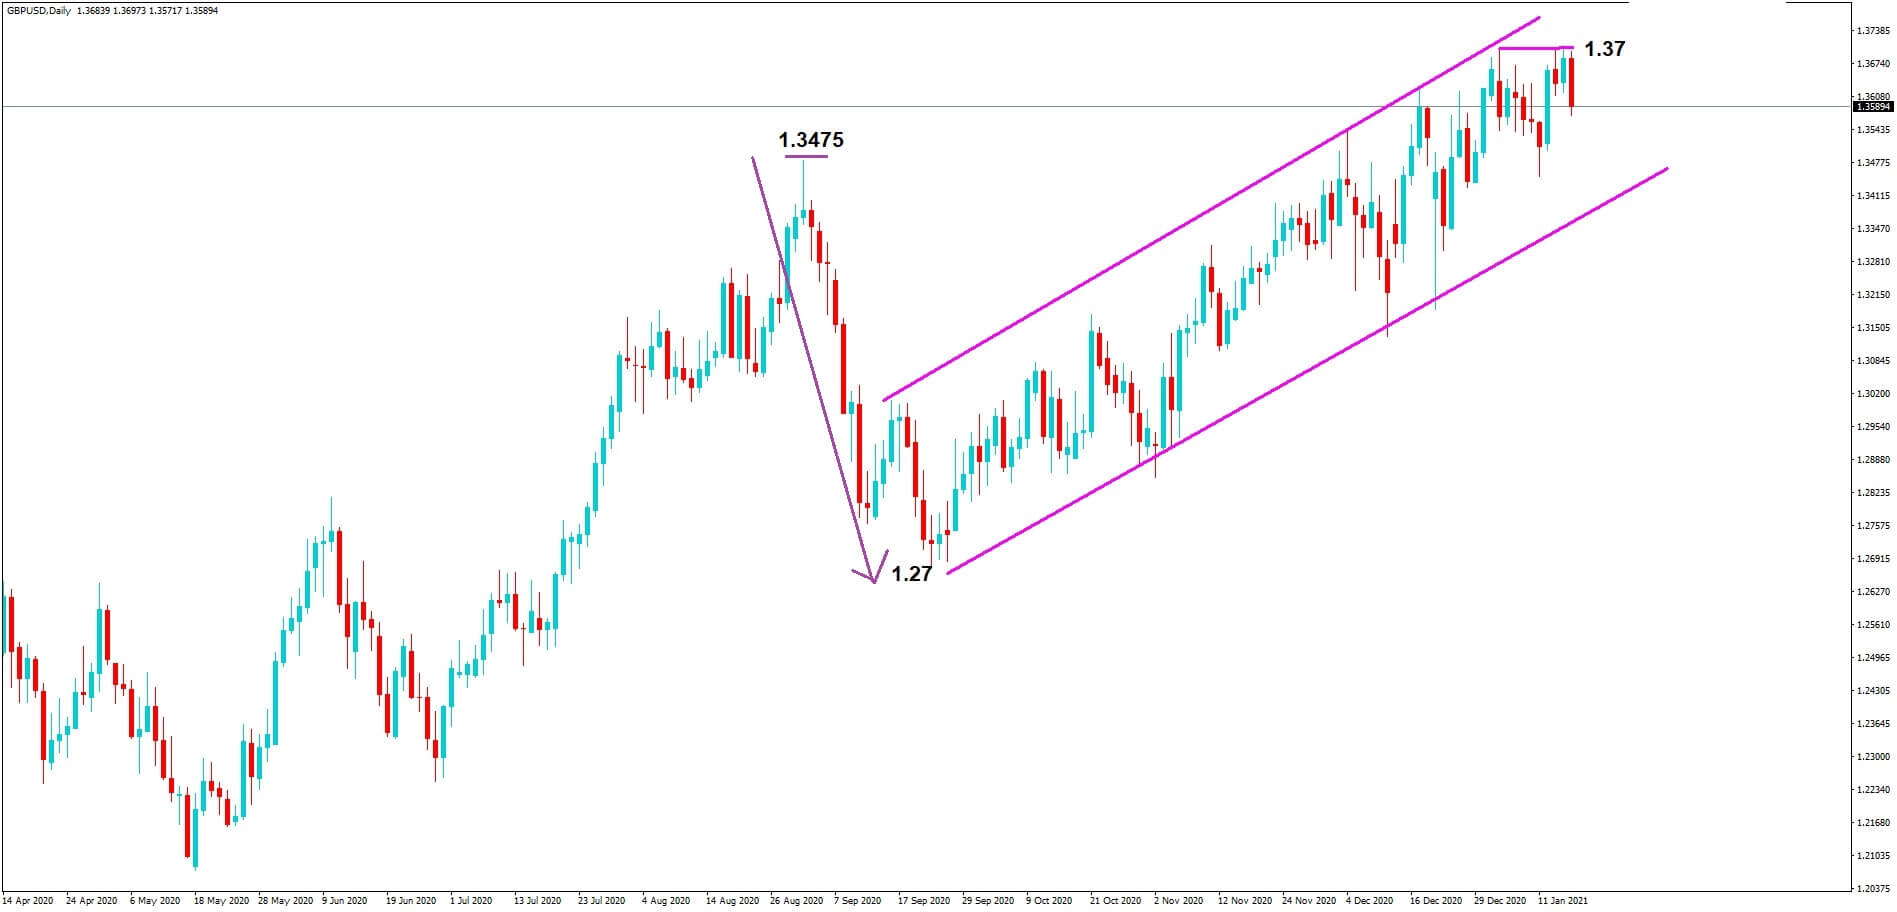
On Wednesday, the GBP/USD pair continues trading with a bullish bias at 1.3733 level after violating the symmetric triangle pattern. The GBP/USD pair is trading with a bullish bias on the two-hourly timeframes, facing immediate resistance at 1.3749 area. A bullish breakout of this level is expected to trigger further buying trends until the 1.3807 mark. Today, we can expect to enter a buy position over 1.3749 and selling below the same.
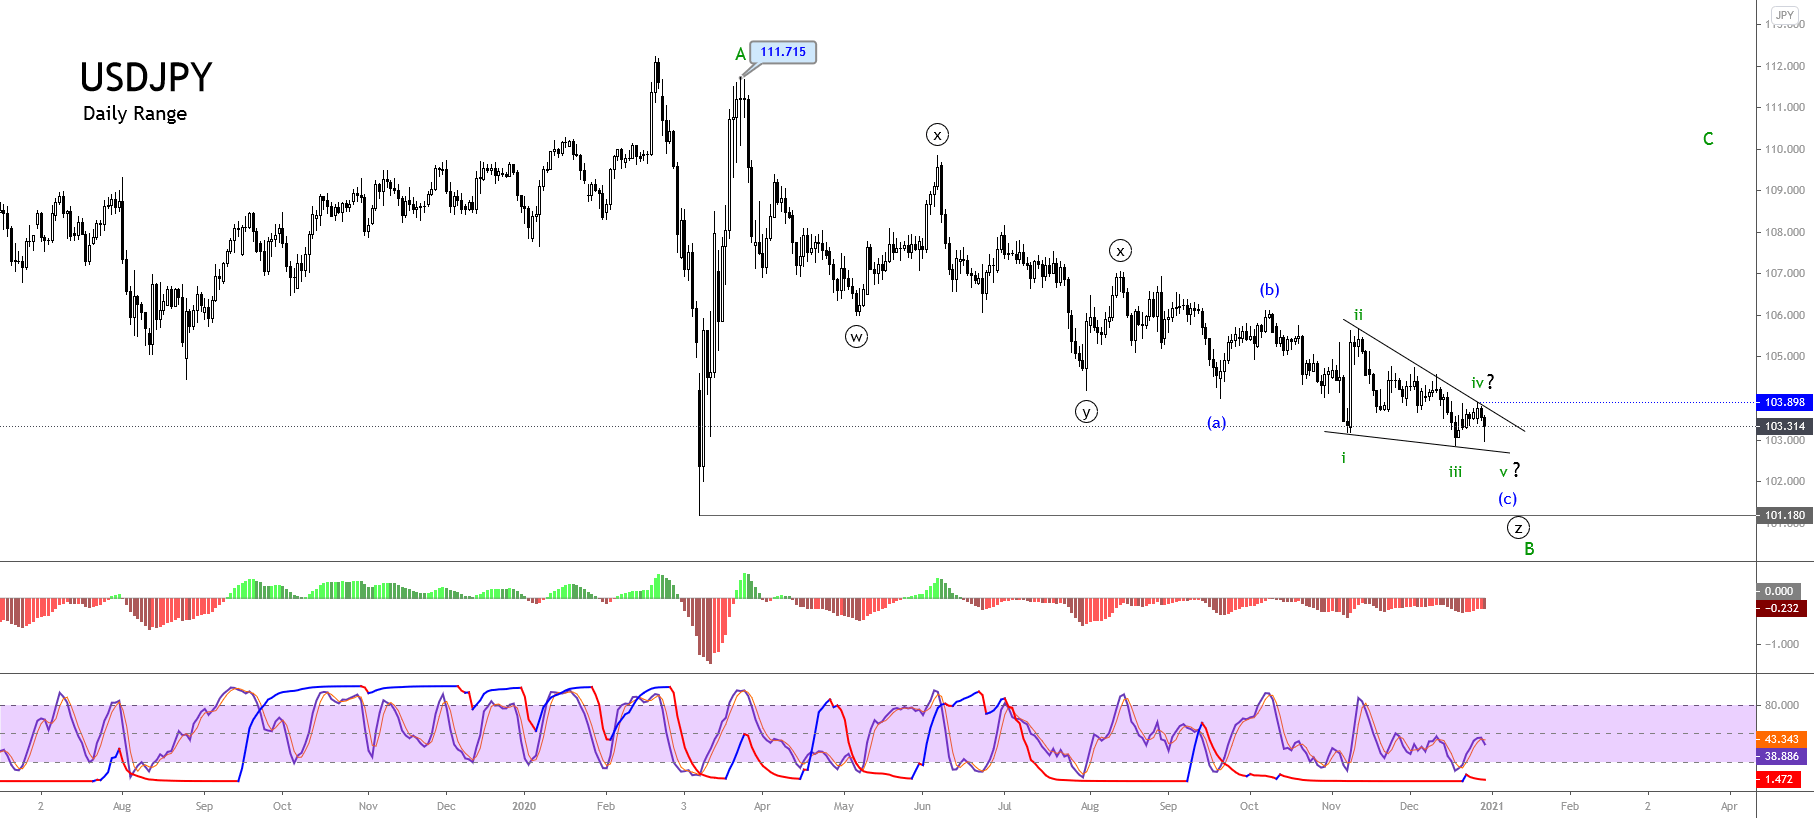
USD/JPY – Daily Analysis
The USD/JPY pair was closed at 103.617 after placing a high of 103.826 and a low of 103.553. After rising for two consecutive sessions, the USD/JPY pair dropped on Tuesday despite the market’s rising risk-on market sentiment. The U.S. Dollar Index (DXY), which measures the value of the greenback against the basket of six major currencies, was up on Tuesday by 0.2% at 90.547 level and supported the U.S. dollar. The safe-haven greenback gained in early trading hours of the day as the rising tensions between the U.S. and China over the South China Sea prompted the risk-off mood.
On Tuesday, China said that it would conduct military exercises in the South China Sea later this week. This announcement came in just days after they had complained that a U.S. aircraft carrier group has sailed through the disputed waters. This helped the Japanese Yen gain traction due to its safe-haven nature and weighed on the USD/JPY pair.
The US-China relation also came under headlines after Chinese President Xi Jinping warned against the new cold war. On Monday, Xi warned global leaders against starting a “new Cold War” and urged unity in the face of the coronavirus pandemic. He said that building small cliques or starting a new Cold War to reject, threaten or intimidate others will only push the world into division.
The words appeared to be aimed at U.S. President Joe Biden’s plans to revitalize global alliances to counter China’s growing influence. These comments added to the tensions between China and the U.S. and raised the need for safe-haven that ultimately supported the safe-haven Japanese Yen and dragged the pair USD/JPY on the downside. However, the market’s risk sentiment came back during early European trading hours after positive news from vaccine makers came into the market. Moderna and Pfizer announced that they have started working on the booster shots of vaccines that will provide full immunity even against the new variants of the coronavirus like the one that emerged in South Africa. Meanwhile, the Johnson & Johnson CFO also announced that they would release their vaccine data next week, and they were very optimistic that it will be robust data. J&J has claimed that their vaccine will provide full immunity in a single shot, and if the data suggested so, it would be a game-changer in the vaccine race so far.
The rising risk sentiment in the market could not lift the USD/JPY pair, and the pair continued moving in the bearish trend for the day.
On the data front, at 19:00 GMT, the Housing Price Index from the U.S. for November advanced to 1.0% against the anticipated 0.9% and supported the U.S. dollar that capped further losses in the USD/JPY pair. The S&P/CS Composite -20 HPI for the year also advanced to 9.1% against the anticipated 8.8% and supported the U.S. dollar. At 19:59 GMT, the Richmond Manufacturing Index for January fell to 14 against the anticipated 18 and weighed on the U.S. dollar, adding more losses in the USD/JPY pair. At 20:00 GMT, the C.B. Consumer Confidence in January advanced to 89.3 against the anticipated 88.9 and supported U.S. dollar.
From the Japanese side, at 04:50 GMT, the SPPI for the year in December came in as -0.4% against the predicted -0.6% and supported Japanese Yen that added further downside momentum in the USD/JPY pair. At 10:00 GMT, the BOJ Core CPI for the year dropped to -0.3% against the expected -0.1% and weighed on the Japanese Yen.
Furthermore, the losses in USD/JPY were also capped after the announcement from the U.S. President Joe Biden on Tuesday. He said that the U.S. would accelerate the delivery of coronavirus vaccines across the country as his administration plans to buy 200 million more doses of the Pfizer-BioNTech and Moderna vaccines. However, Biden also warned that even with more Americans set to be inoculated sooner than previously anticipated due to additional doses, the pandemic would continue to worsen before it gets better.
According to the Johns Hopkins University data, the number of confirmed coronavirus cases worldwide has passed 100 million just over a year since the first cases of the mysterious new illness was reported in the Chinese city of Wuhan. This weighed on market sentiment and supported the safe-haven Japanese Yen that ultimately added the USD/JPY pair’s losses on Tuesday.
Daily Technical Levels
Support Resistance
103.62 103.89
103.50 104.06
103.34 104.17
Pivot point: 103.78
USD/JPY – Trading Tips
On Wednesday, the USD/JPY continues to trade sideways inside a broad trading range of 103.900 – 103.560. The USD/JPY has formed a symmetrical triangle pattern on the 4-hour timeframe, and it has the chance of leading the pair towards the next resistance level of 104.800 upon the breakout of 104.810. The 50 periods EMA supports the bullish trend, and we may have odds of taking a buying trade over the 103.570 level today. Good luck!


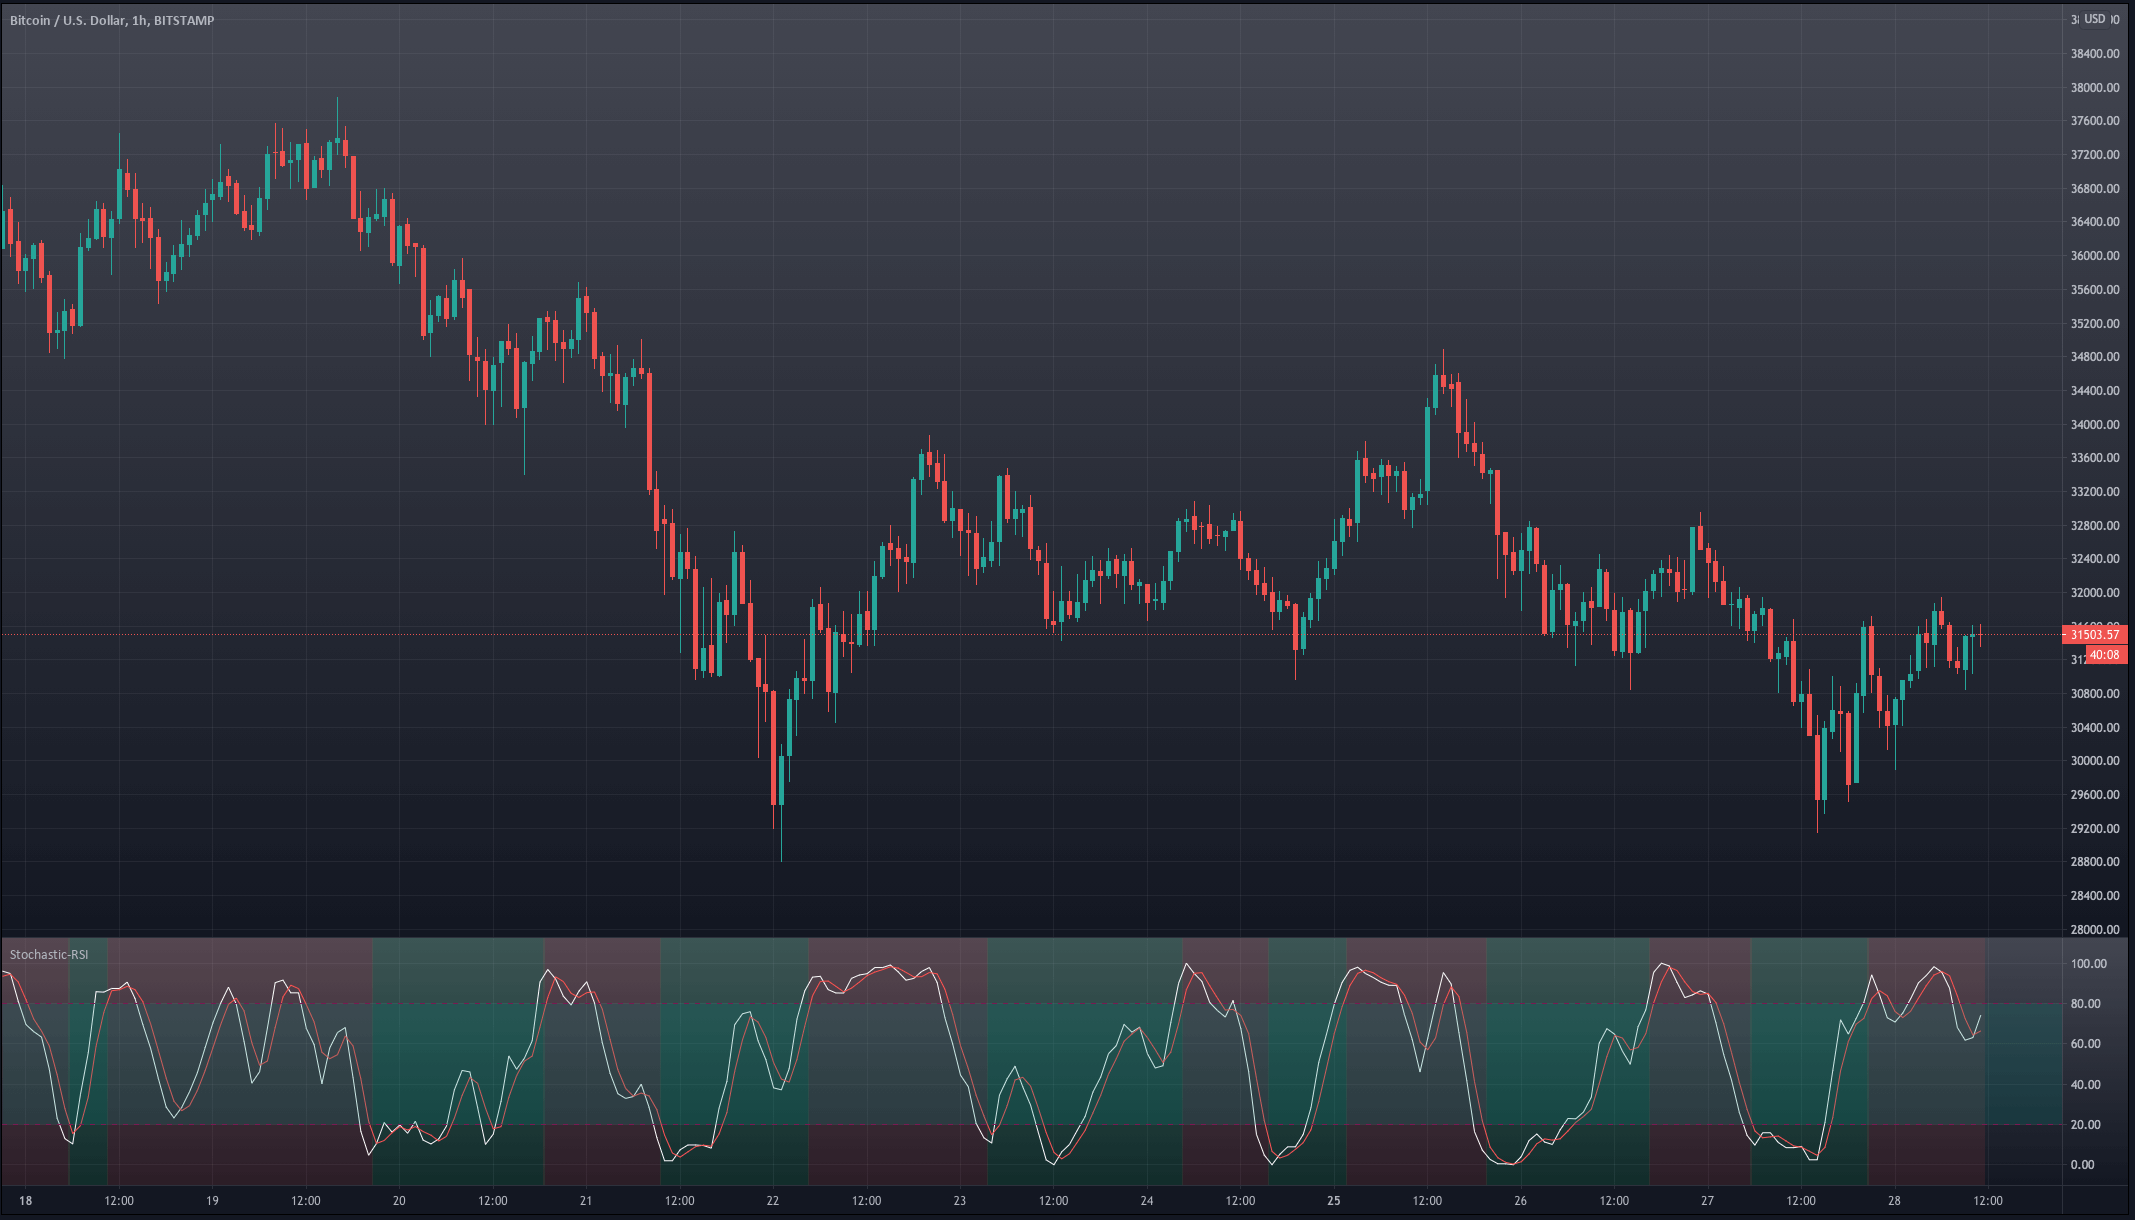
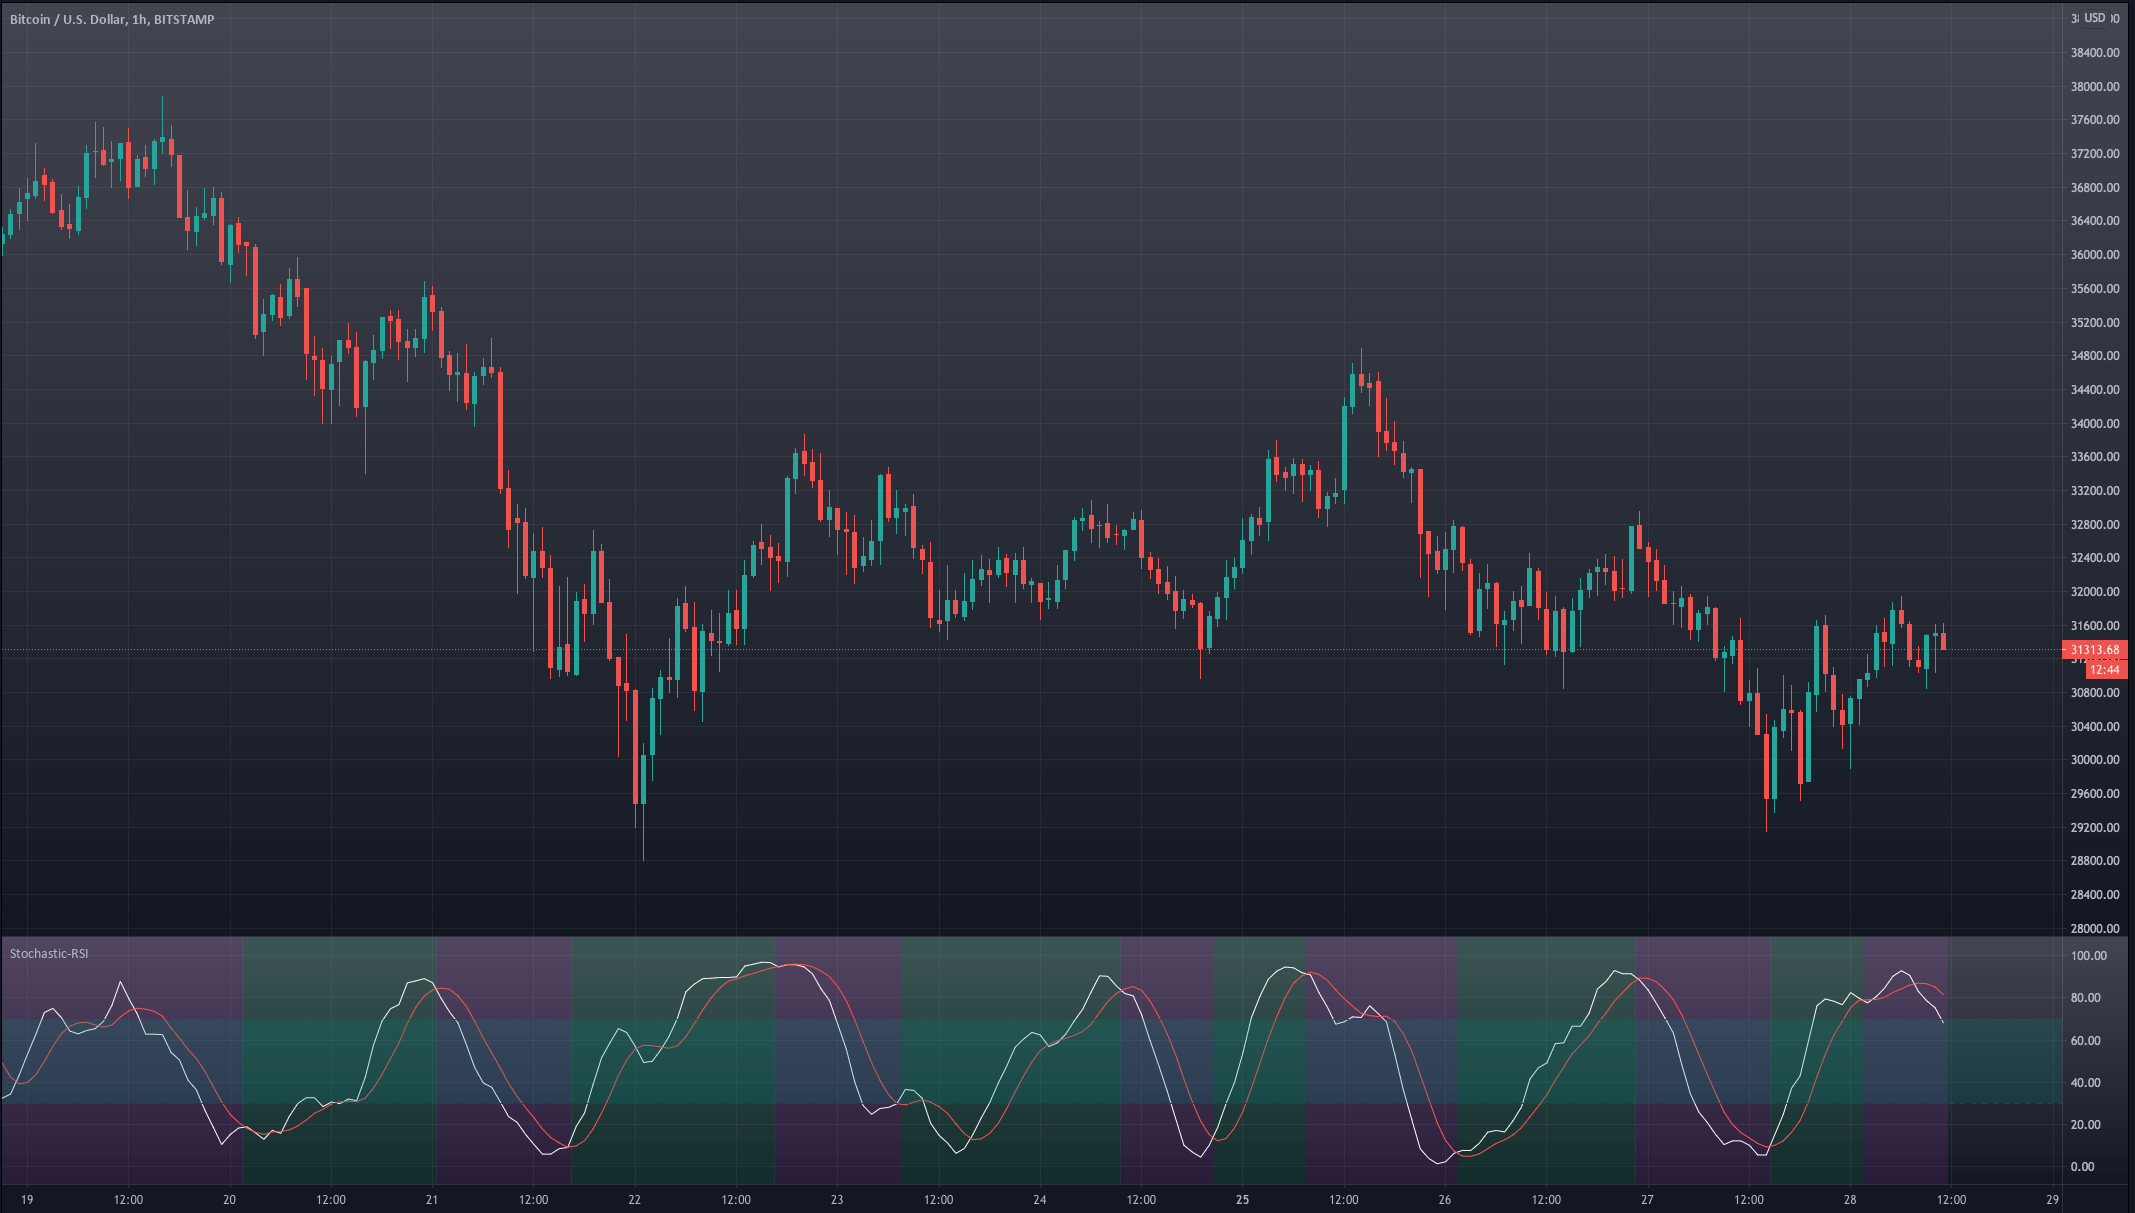
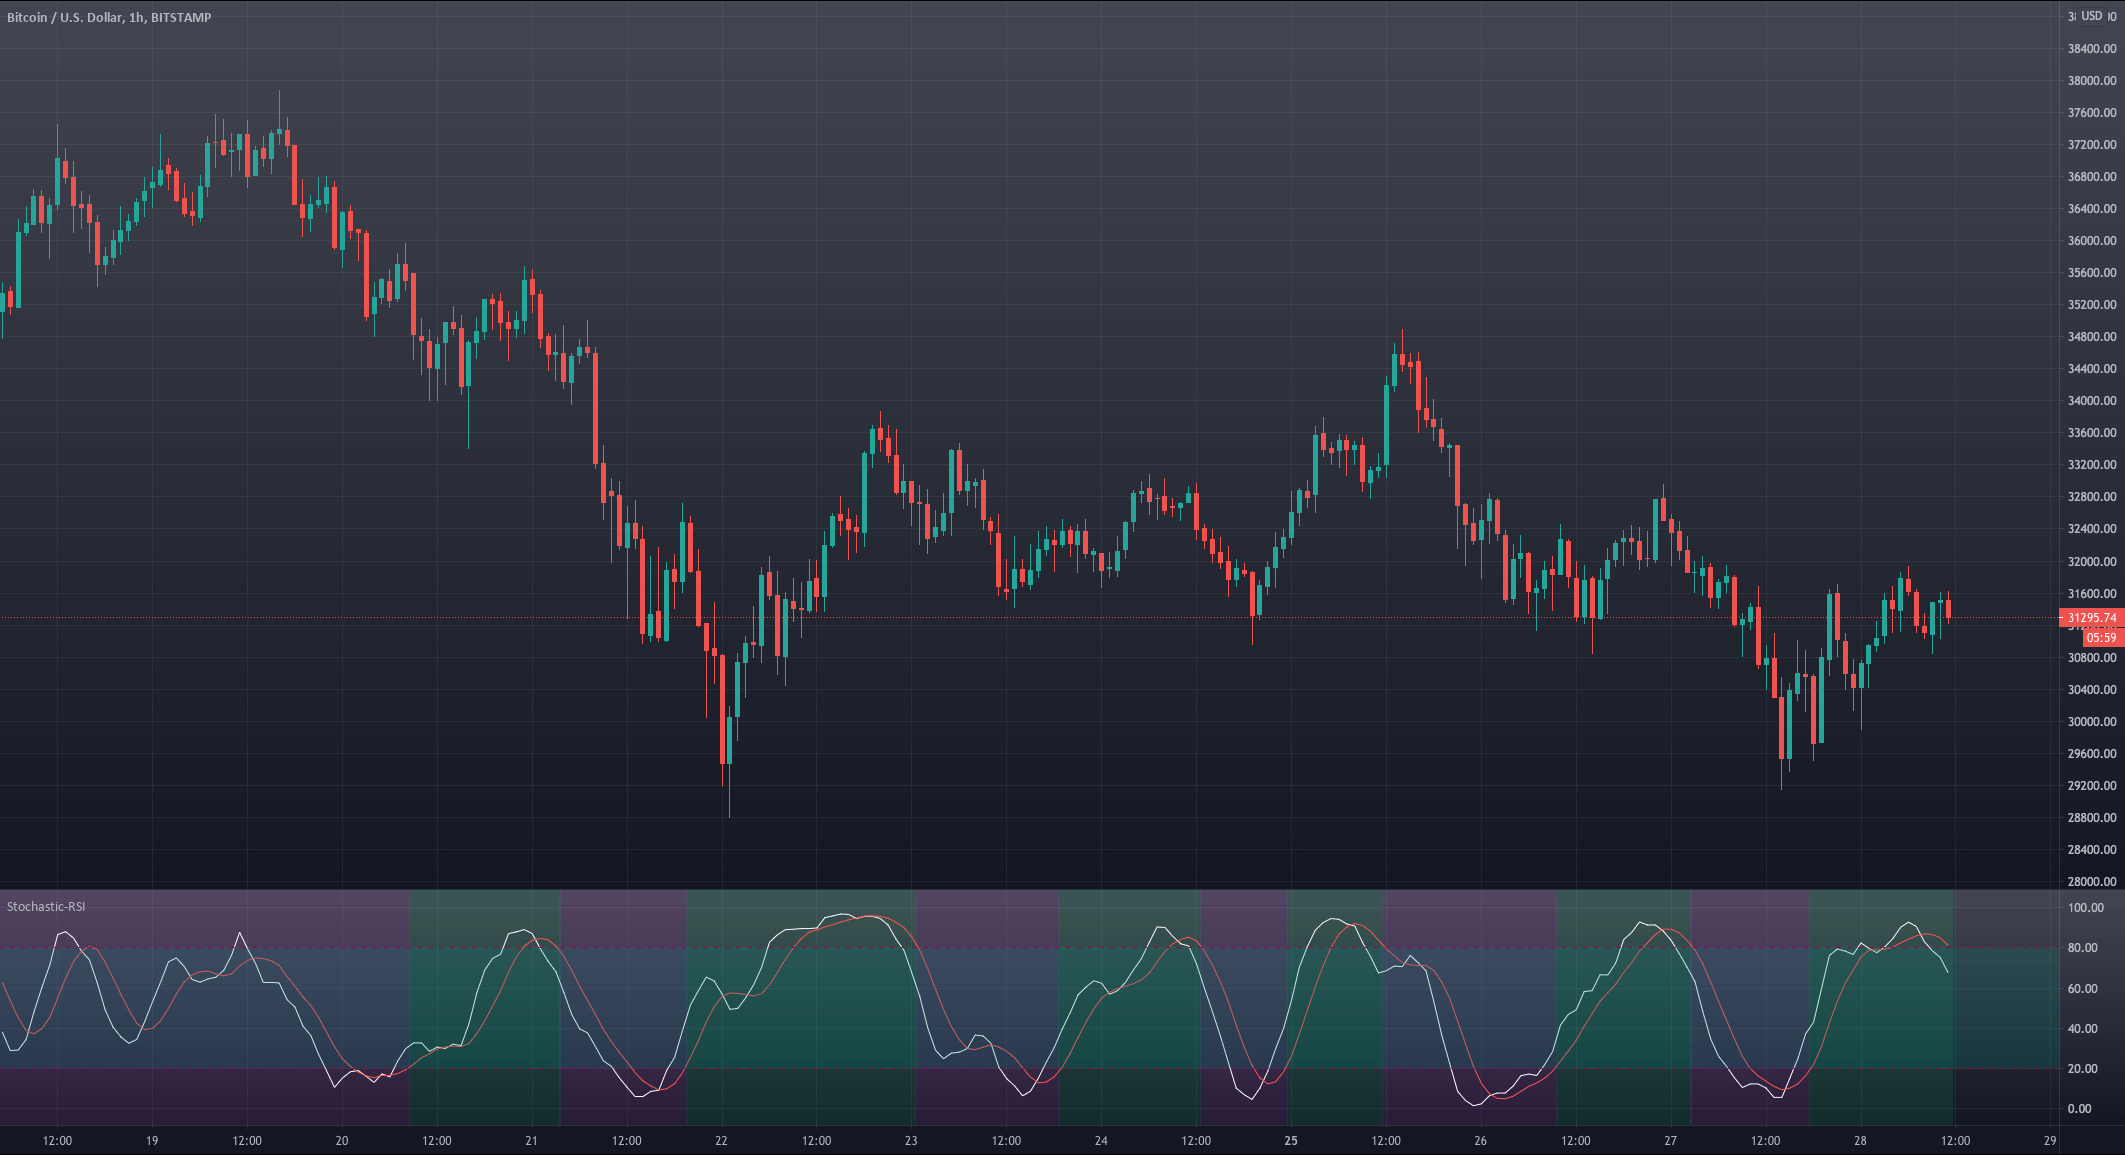


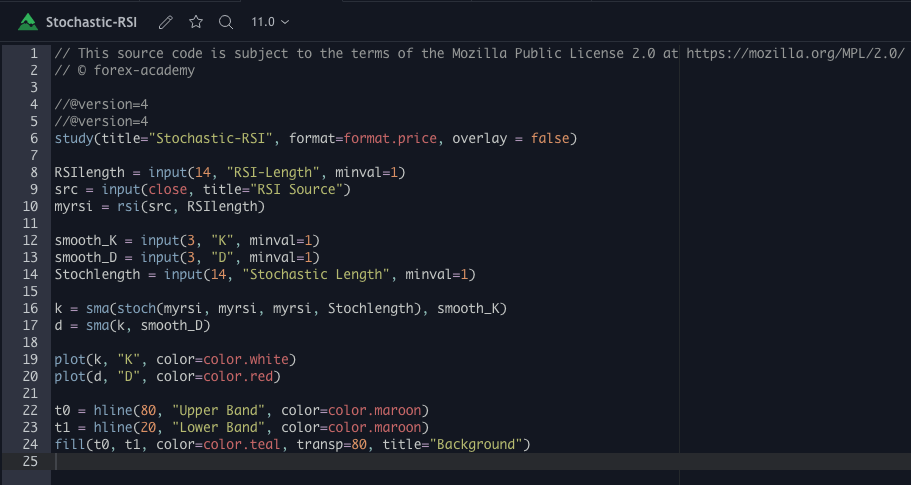
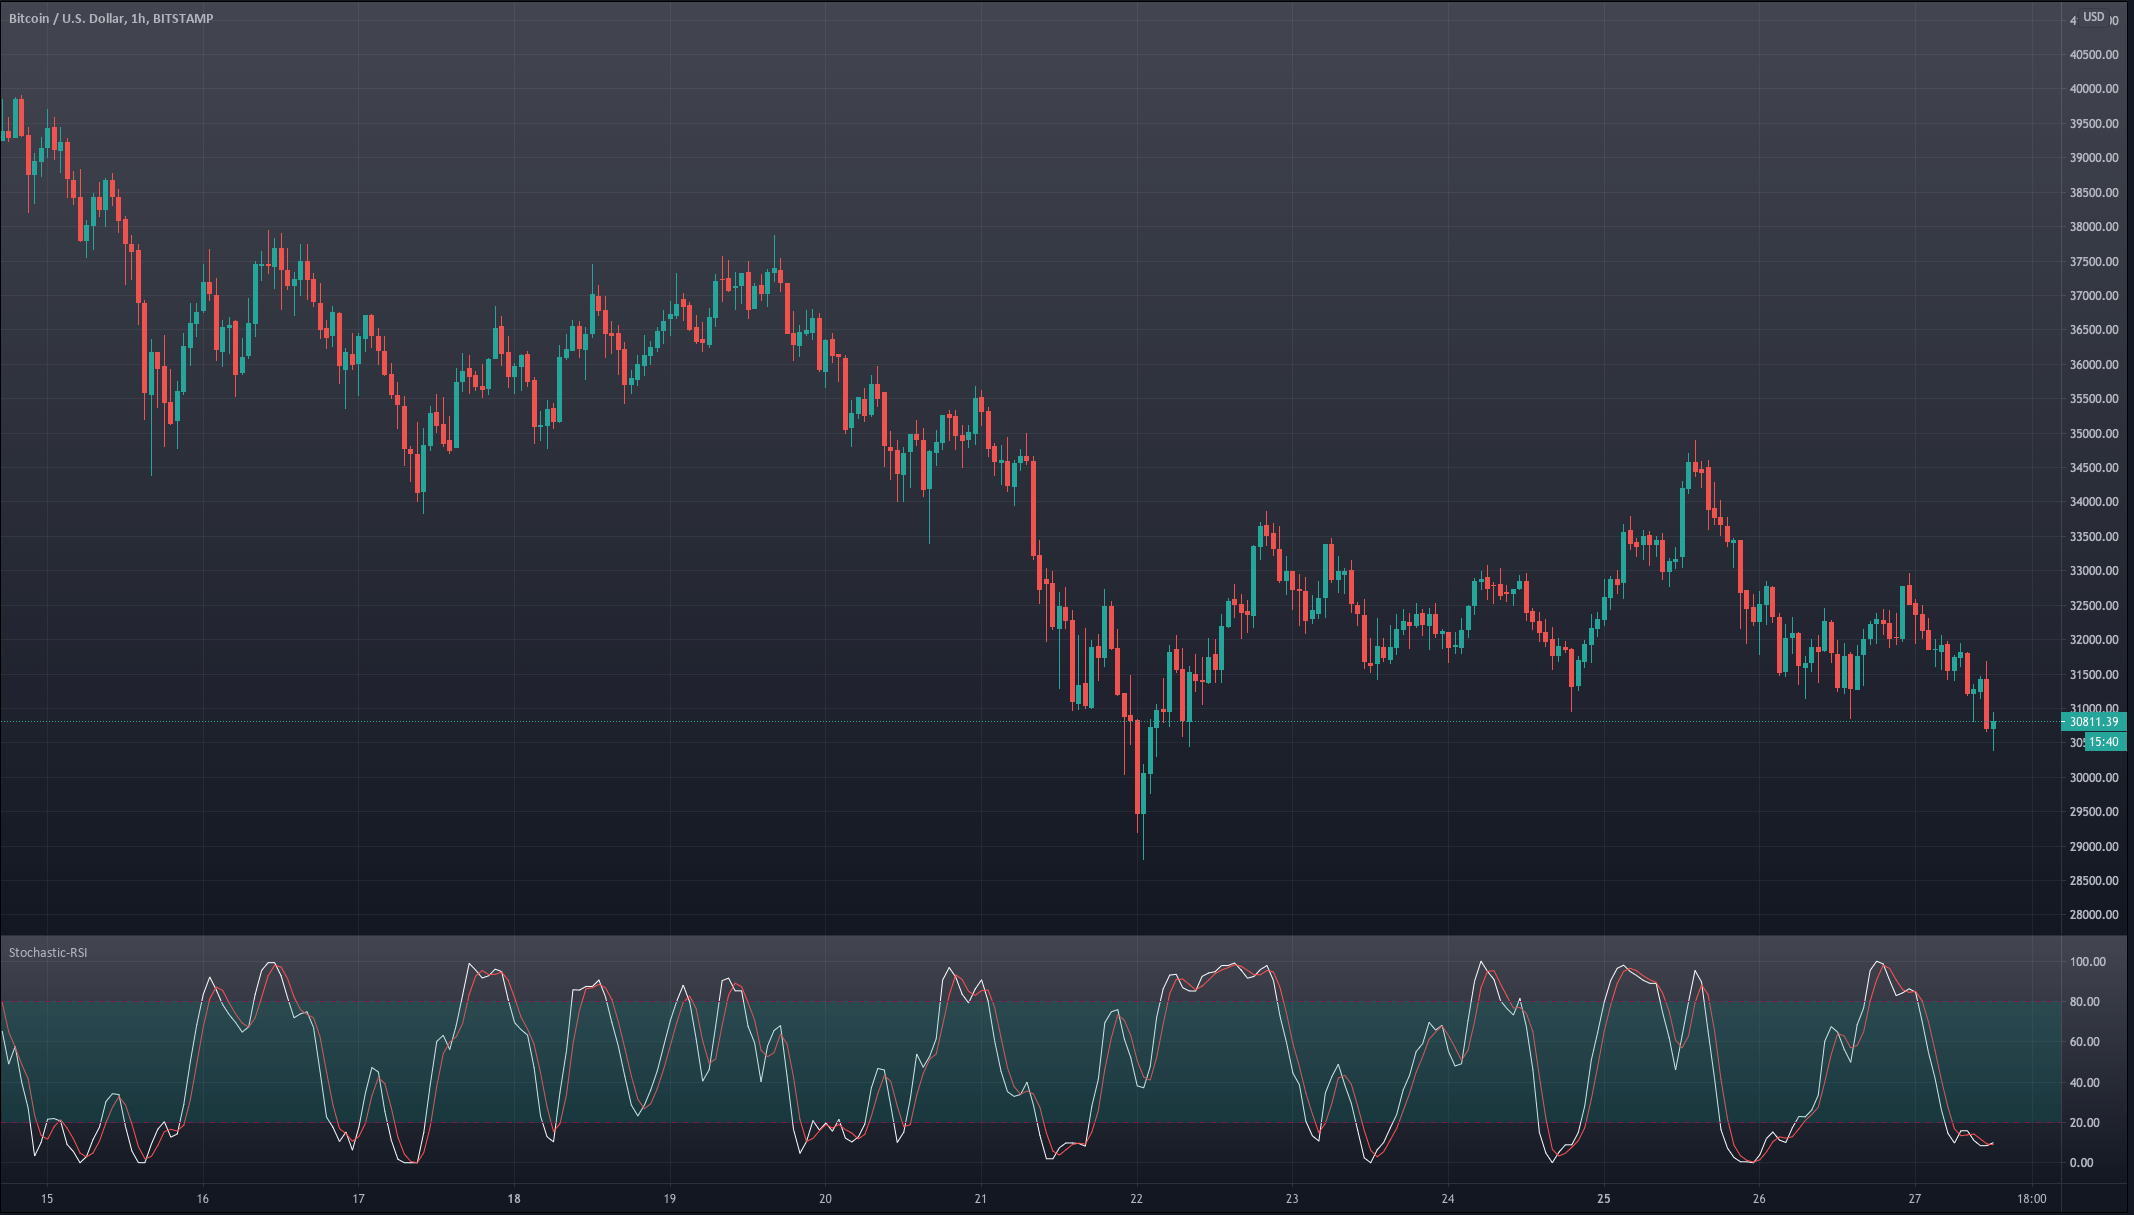
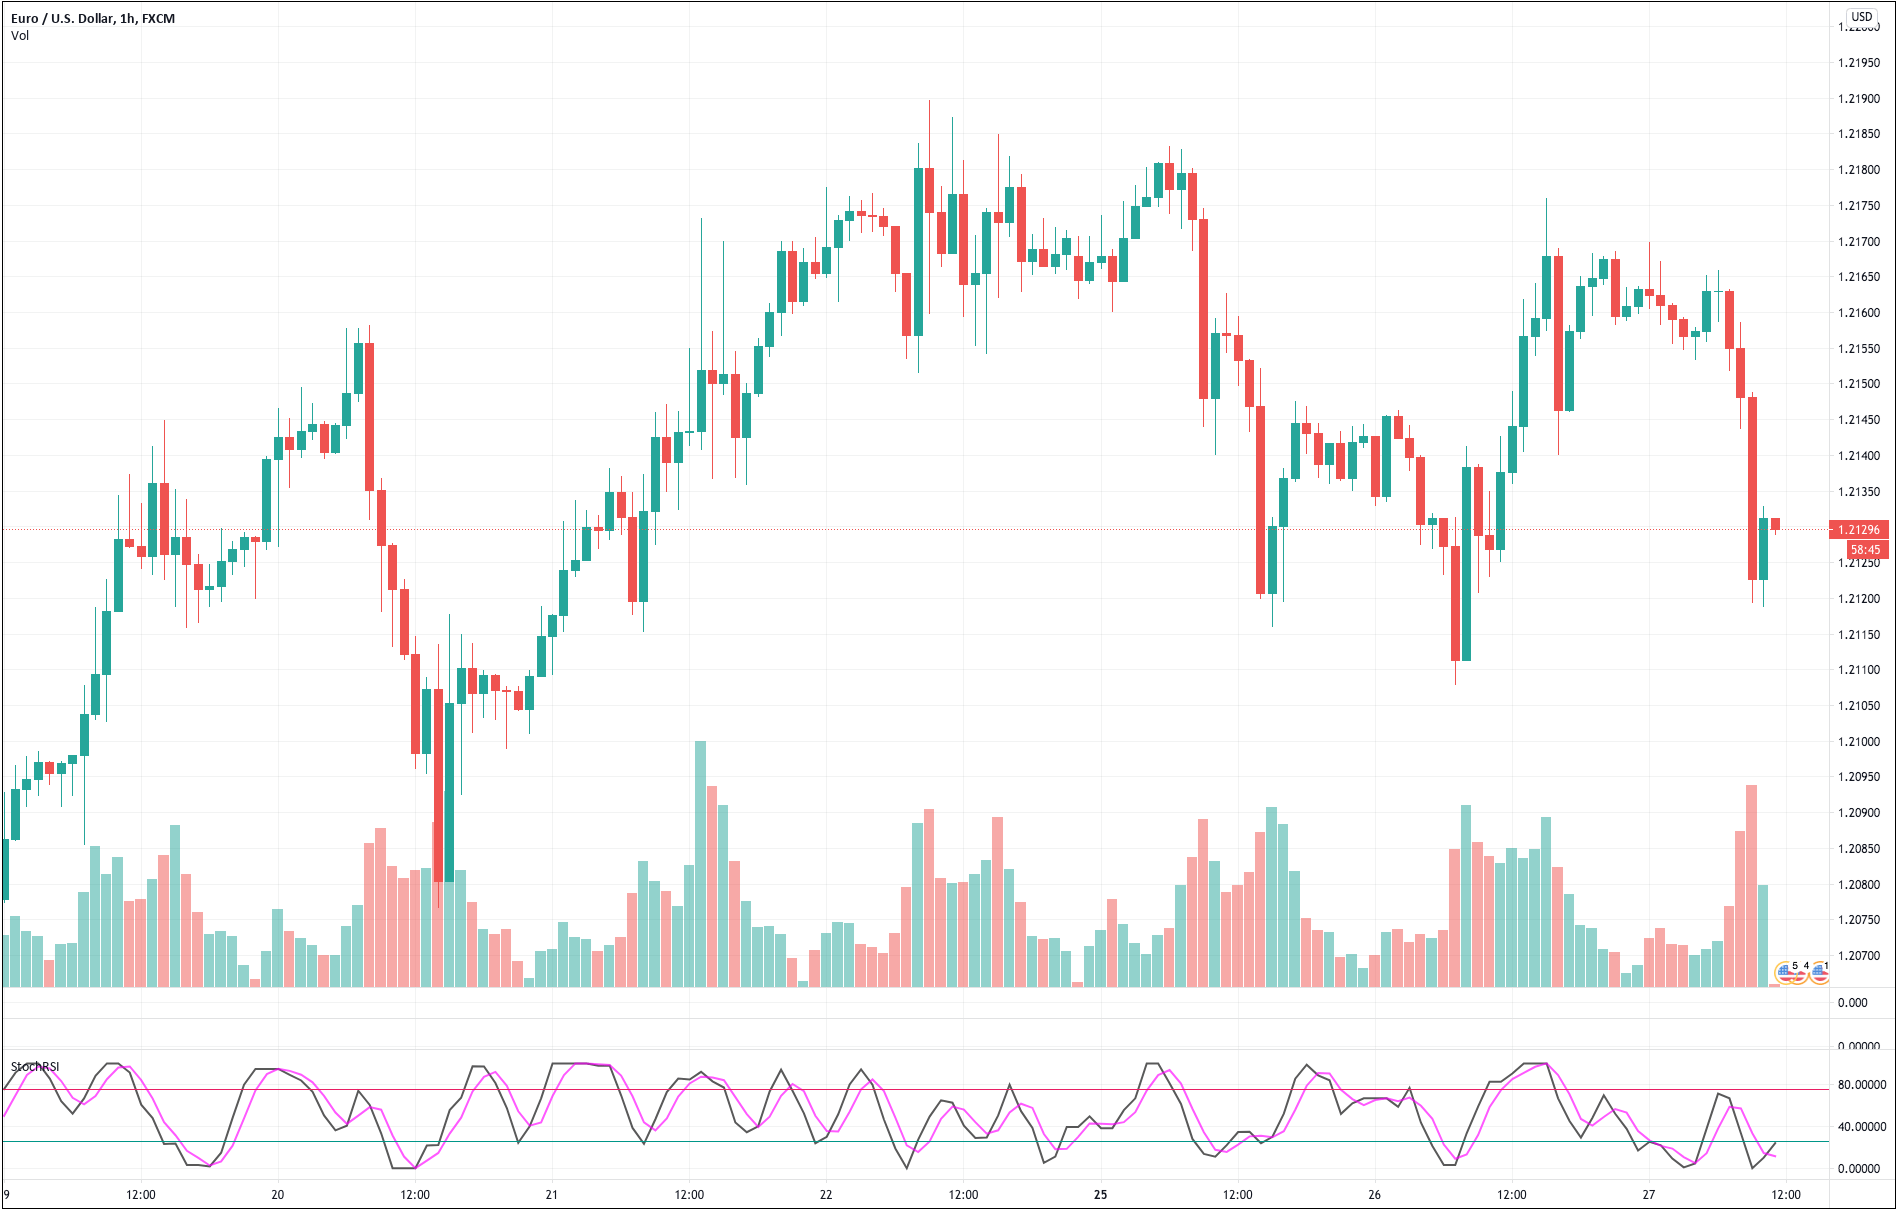 For our example, we will use a simple yet quite exciting indicator called Stochastic RSI, which applies the Stochastic study to the RSI values. This operation smoothes the RSI, and it reveals much better the turning points on mean-reverting markets, such as in Forex. Let’s see how it behaves as a naked strategy.


 Traders, especially novice traders, get emotional and lose money because their emotions interfere and stop making rational decisions in the battle’s heat. Thus, the first thing to avoid is
  The rubber band idea describes the price as if it was a rubber band or spring. When it moves far away from equilibrium, we expect the force to pull it to its center to increase and eventually drive it back to equilibrium.
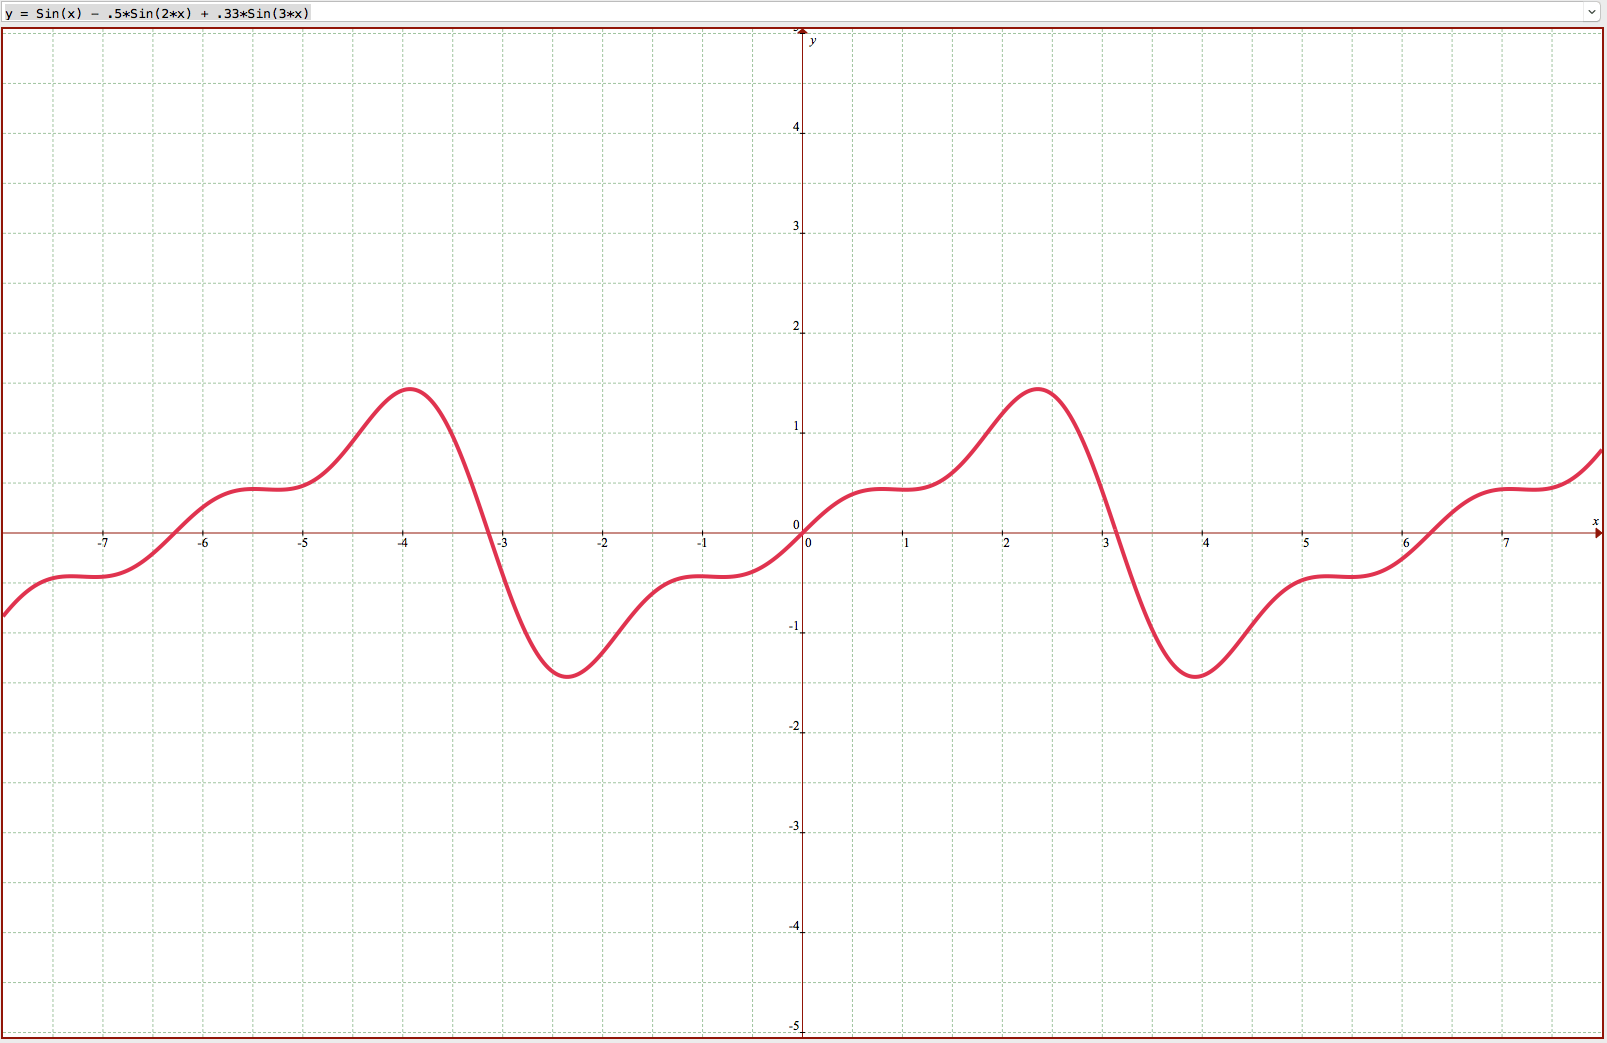 fferent waves are in sync, and chaotic moves occur when waves desync.