Categories
Uncategorised

EUR/USD Breaking Below Upward Channel – ECB Under Spotlight! 

EUR/USD Breaking Below Upward Channel – ECB Under Spotlight! 

The EUR/USD currency pair erased some of its previous day gains and dropped below the 1.1400 level while represented 0.05% losses on the day. However, the modest losses in currency pair could be attributed to the broad-based U.S. dollar strength backed by the renewal of Sino-American tension, which kept the currency pair lower. The hopes that European Union leaders may agree on stimulus and deepen fiscal integration to protect the Eurozone economy from the coronavirus crisis helped the currency pair limit its more profound losses. 

At the moment, the EUR/USD currency pair is currently trading at 1.1406 and consolidating in the range between 1.1393 – 1.1421. However, the traders seemed cautious to place any strong position ahead of European Central Bank’s (ECB) rate decision, scheduled to happen on the day.

As we already mentioned, the European Central Bank’s (ECB) rate decision is scheduled to happen. So, some analysts widely expected that the European Central Bank will keep its policy unchanged as the impact of recent measures loosens, and the economic recovery pace remains uncertain.

However, the actual amount of the economic damage caused by the coronavirus outbreak in the second quarter would become apparent only at the end of the month with the first estimates for GDP growth. Thus, there is little reason for further action from the European Central Bank (ECB) at this moment.

As per the senior analysts, the coming European Central Bank meeting could leave a significant impact on the shared currency. Whereas, the member nations stand divided on the scale and composition of the stimulus package, with the richer northern nations like Germany and the Netherlands opposed taking the long-term step of polling debt with the fiscally-profligate Mediterranean governments. 

The shared currency recently benefitted as investors expect member nations to reach a compromise close to Germany and France’s proposal of a 750-billion euro fund, which will deliver 500 billion euros as grants and guarantees and 250 billion in loans.

At the US-China front, the US-China tussle took a breath earlier after U.S. President Donald Trump personally avoided imposing further sanctions against Chinese entities involved in enacting Hong Kong’s national security law while saying that he does not want to further escalate tensions with China. Despite this, the tensions remain on the cards as China is still threatening to retaliate because the U.S. imposed sanctions on diplomats from Beijing while signing an executive order ending preferential treatment for Hong Kong on Wednesday.

At the USD front, the broad-based U.S. dollar did not give any significant heed to the vaccine success and took bids on the day, possibly due to the worse situation of ever-increasing coronavirus numbers and an ongoing tussle between the US-China which exerted some downside pressure on the S&P 500 futures. However, the gains in the U.S. dollar kept the currency pair lower as the price of oil is inversely related to the U.S. dollar price. Whereas, the U.S. Dollar Index that tracks the greenback against a basket of other currencies gained 0.01% to 96.032 by 10:12 PM ET (3:12 AM GMT).

The market traders keep their eyes on the U.S. economic docket, which will show the release of Retail Sales m/m, Philly Fed Manufacturing Index, Unemployment Claims, and Business Inventories m/m, which could play a key role in influencing the intraday momentum. On the EUR side, all traders keenly awaiting the European Central Bank’s (ECB) rate decision, scheduled to happen on the day.

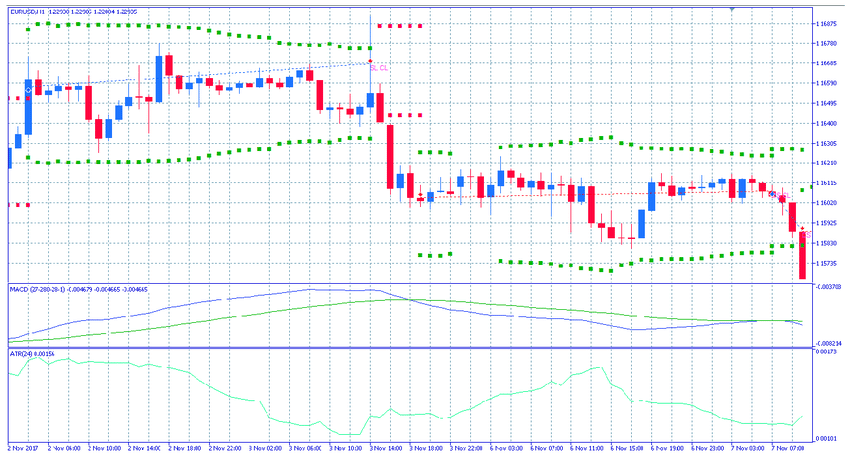
Daily Support and Resistance

S1 1.1297

S2 1.1358

S3 1.1385

Pivot Point 1.1419

R1 1.1446

R2 1.1479

R3 1.154

The EUR/USD is trading with bearish bias after posting a high near 1.1446 mark. Recently, the formation of candles beneath the 1.1446 mark is likely to extend bearishness until the 1.1370 level. While candles closing over 1.1370 can also trigger a bullish bias in the EUR/USD pair. Alternatively, the bearish breakout of 1.1370, the EUR/USD prices may slip further until 1.1305 level. Good luck! 

Categories
Uncategorised

EUR/CHF: The Bear finds its ground to make a move

Categories
Uncategorised

5 Technical Indicator To Built A Trading Tool Kit.

Introduction

Technical analysis is a major part of the trading without it most of the traders cannot think to trade the market, there are different types of indicators available in the market, but most of the indicators exist for one sole purpose, and that is to provide the trading signals. Some of the indicators are the leading one in the industry, and some are the lagging indicators; some provide the divergence; some gauge the momentum of the trend while other indicators follow the trend and provide the buy and sell signals. In this article, we will share with you the five most important technical trading indicators to add to your trading toolkit. You don’t need to use all of them; instead, pick the few of them that suits your trading style.

TRADING INDICATORS.

  1. MACD – MACD stands for Moving Average Convergence and Divergence is a trend following indicator developed by Gerald Appel in the late seventies. MACD Is one of the simplest and most effective trading indicators. The MACD indicator is calculated by subtracting the 26-period exponential moving averages from the 12 period EMA. The result of this calculation is the MACD line. A nine-period EMA is then plotted on top of the MACD line, which gives the buy and sells signals. Traders buy the security when the MACD line crosses above its signal line and take sell when it closes below the signal line. The indicator also fluctuates above and below the zero line which indicates the buying and selling market. Traders can also look for the divergence, overbought and oversold level, and rapid rises and falls.


  1. S.I. –RSI Stands for Relative strength index is a momentum indicator developed by the J. Welles Wilder. The indicator measures the speed and change of price movements, and as a result, it provides us overbought and oversold trading opportunities. The RSI Indicator has three major uses, the indicator moves between the zero to hundred level, and these levels helps to gauge the momentum and the strength of the trend. When the indicator moves above the 70 level, it is considered as an overbought level and soon expects the reversal. When it moves below the 30 level, it is considered an oversold level and expects a buy-side reversal. Some aggressive traders try to buy and sell the security when the prices approach these levels, and some conservative traders wait for the price action and indicator to show some signs of reversal, then they take the trade. The divergence is the second use of the indicator; divergence is when the price action is moving in one direction, and the indicator is moving in another direction; it is also a sign of the trend reversal. The third use is the indicator also provides the support and resistance level. In an uptrend, the security often holds above the 30 level, and most of the time, it reaches the 70 level, and in a downtrend, the security holds below the 70 level, and it often reaches the 30 level.


  1. STOCHASTIC –Stochastic is a momentum indicator developed by George C. Lane in the late 1950s. Most of the traders think the stochastic is follows the price or volume, but it’s not true according to the Lane the indicator follows the speed or momentum of the price. As a rule, the momentum of the price action changes its direction before the trend changes direction, which makes the MACD as a leading indicator in the industry. The indicator is plotted between the 0 to 100 level, and it oscillates the 20 to 80 level. When the price action goes above the 80 level, it is an indication to go short, and when it goes to the level, it’s a sign to go long. In short, values above 80 considered overbought and values below 20 considered oversold. The bullish and bearish divergence is also useful to foreshadow the upcoming reversals.
  2. AROON INDICATORAroon is a technical indicator developed by the Tushar Chande in 1995. The indicator uses to identify the trend changes in an asset as well as the strength of the ongoing trend. The indicator also helps the traders to identify whether the market is trending or range-bound by using its two components, which are Aroon Up and Aroon Down. When the Aroon up crosses above the Aroon down, it is a sign of the possible trend change. When the Aroon up hits the 100 level, and Aroon down goes near to zero level it is a sign of the uptrend in progress. Conversely, If the Aroon down crosses above Aroon up and stays near 100, this is an indication of the downtrend.
  3. KST INDICATOR – When It comes to day trading, the K.S.T. indicator is one of the best, which you can use to make quick bucks from the market. K.S.T. stands for Know Sure Thing is a momentum indicator developed by the Martin Pring. The indicator was first described in the 1992 magazine “Summed Rate of Change.” The indicator is used in the same way as the rest of the momentum indicator is in play. K.S.T. indicator moves above and below the zero level. The trading signal generated when the indicator crosses above and below the signal line. Traders look for the divergence, crossover, and both the lines above and below the zero level to trade the signals. When the indicator goes above the zero level it’s a sign of buying momentum, and when it goes below the zero level, the momentum is in the favors of the sellers. A positive reading indicates the trend is up, and the negative readings indicate the trend is down.

CONCLUSION.

The goal of every trader is to identify the trading signals and use it to trade the short or long term trends. There are hundreds of trading indicators available in the market, and the above five are the most popular A.K.A. celebrity indicators, which widely used by every type of traders in the market. Use these indicators in your everyday trading to trade the high probability trading opportunities.


Categories
Uncategorised

How to Take Profits when Trading.

Introduction

When you start in the trading game, you often heard people tell you to let your winners run and cut your losses immediately. Well, this piece of wisdom is true, but most of the traders failed to do so, and they end up in the losing side in the trading. As per the Wall Street report, nearly 95% of the traders in the market always end up in losing side; this is because they have a habit of booking their profits too early.

First of all, you must accept this fact that the market is random and it can do anything at any given situation, and the trading is a game of probabilities, there is no guarantee that your trade will end up in the winning side. If you genuinely desire to be in the top 5% of the traders, you must have big winners, and the smaller loses. This sound so simple, but in reality, it is so difficult. Remember when you are wrong in the market, you are not only in the losing trade, but you also have to pay commissions. So to be a winner in the game you must develop a healthy and abundant mindset which let you hold your trades for the more extended targets. Most of the traders end up closing their trade for no reason, and this is the number one mistake they made in their trading. From now on, you must promise yourself that you will only close your trade when the market gives you the valid reason to close it and if your purely closing the trade to book the profits, then simply you are missing tons of money in the market. In this article, we will share with you some tips and tricks on how to book your profits.

PROFIT TAKING STRATEGIES.

TREND LINES.

Every trader in the world desire to catch the trend, because that’s where the real money is. A strong trending condition helps you to reap the profits without much headache of the volatility effectively. So there are two ways to trade the trend, the first one is to by using any trading strategy enter in the direction of the trend and the second way is to let the price action pullback little bit and take the counter-trend trade to the most recent support and resistance area. In this way, by following the trend, you can catch the major moves, and by following the counter-trend, you can easily capture the minor moves also.

So by using any trading strategy you can enter in a trade, let’s say in trending conditions you use the trend line to take the buy entry, and when the price action breaks the trend line, it is an indication to close your trade.

The image below represents a couple of buying trades which we took when the prices hit the trend line, and the take profit was purely based on the trend line also. When the trend line failed to hold the price action, it means now the sellers are not strong enough and we can expect the reversal from here. What you need to do is to look for the break and closing below the trend line to close your buying trade.

CHANNEL PROFIT TAKING STRATEGY.

Here we are using the price channel to take an entry and exit in a trade. A price channel when the market is about to finish its trend, and in the channel, both of the parties hold equal power. So we are not going to take the buy-sell entry when the price action hits the channel. It’s a simple approach to trade the market. Instead, follow the market trend and only place the trade with the trend. For example, if the price action prints the buying trend channel then we only going to look for the buy trades and when the price action hits the upper line of the channel it is a sign to close our position.

The image below represents the buying entries and exits in the GBPCAD forex pair. As you can we first draw the price channel and every time prices hit the lower channel, it is a sign to go long, and every time when it hits the upper channel, it is a sign to book the profit. This is one of the easiest and simplest trading approach and keeps in mind the most straightforward approaches works best in the industry.

DIVERGENCE PROFIT TAKING STRATEGY.

Divergence trading is a quite popular and easy way to make entry and exit in a trade. Most of the oscillator shows the divergence on the price action, which is a sign to take trade or exit in a trade. Here we are going to use the divergence to close our trade. Divergence is when the price action going in one direction and the indicator goes in another direction. When they both move in the opposite direction, it means that the indicator does not agree with the price of an asset or we can say the prices are overextended and the correction is mandatory.

In this strategy, we are going to use the RSI indicator to identify the divergence on the price action.

RSI stands for RELATIVE STRENGTH INDEX, and it is an oscillator which moves above and below the 30 to 70 level. When the indicator goes to the 70 level, it means the market is overbought and soon expect the downside reversal. When the indicator approaches the 30 level, it means the market is oversold and expect the buy side reversal.

As you can see the image below it represents our selling entry in the GBPCAD forex pair. The price action kept testing the resistance level, and when the RSI approached the overbought area, it was a sign to go short. Soon after our entry, we witness the brand new lower low.

As you can see in the below image when the price action prints the brand new lower low, it started holding sideways for a couple of candles also at that time RSI indicator signals the buy trade but price action wasn’t moving upward. This was the sign that the indicator knew the price is overextended, and from here, the correction is mandatory. So when we got the divergence, we choose to close our whole selling trade. By using the divergence, you can accurately predict the market reversal; also, you can milk the market to the bottom level or the peak point. Divergence is the easiest most straightforward and most effective way to understand what is going on behind the scene in the market.

CONCLUSION.

Taking profit is the major component of trading; even the new traders always dying to book the profits. In contrast, the professionals always desire to hold their positions for the more extended targets. Your profit taking habits will determine how much amount of money you are going to make or not going to make. Impulsive behaviours often lead to failure in trading, so study yourself find out what triggers you to close the trades and always control yourself to hold for the more extended targets.


Categories
Uncategorised

Simple RSI Trading Strategies.

Introduction

The RSI stands for the Relative Strength Index, and it is one of the most popular indicators in the market. The RSI indicator was developed by J Welles Wilder, and he explained this indicator in his book New Concepts in Technical Trading Systems in June of 1978. The RSI is a momentum indicator that measures the speed and the change of the price movements. The RSI measures how well the underlying asset is performing against itself by comparing the asset strength of the up days versus the down days. The RSI has a range between 0 to 100, and the reading above 70 indicates the overbought conditions, and the readings below 30 indicate the oversold conditions. The RSI indicator is featured in the number of articles, books, and interviews over the year. The RSI signals can be generated by the overbought and oversold conditions, bullish and bearish divergence, centerline crossovers and failure swings. By default, the RSI used the 14-period averages, but this can be lowered to increase the sensitivity of the asset. You can set the parameters according to the asset volatility; the higher the volatility, use the higher average and lower the volatility, use the lower average. The overbought signal at 70 and oversold signals at 30 are also the traditional levels; traders can adjust these setups to better fit the security or analytical requirements. Using the 80 and 20 levels automatically reduces the numbers of overbought and oversold readings.

DEFINING THE CURRENT TREND

RSI indicator provides so many advantages to the traders, which makes it the celebrity indicator. Most of the traders think RSI only provides the buy and sell signals, but it’s not true, the RSI also provides the ability to gauge the primary direction of the trend. So, first of all, we must define the range where the RSI can track the bull and bear markets. For the bull market, we suggest you look out for the 66.66 readings, and the bear market uses the 33.33 readings. I know this is slightly different from the traditional levels of 80/20 and 70/30. These readings of 66.66 and 33.33 provided by John Hayden in his book, titled “RSI: THE COMPLETE GUIDE.” According to the author, he suggests that these numbers measure the true bull and bear trends, not by default readings.

4 Simple RSI Trading Strategies

  1. RSI SWING REJECTION.

This trading approach is a very new RSI trading strategy, this one is not very popular among the traders, but it works very well on all the timeframes and in all types of market conditions. This Technique is called the RSI swing rejection.

FOR BUY

  1. RSI approached the oversold territory.
  2. RSI crosses above the 30 level.
  3. RSI prints another dip without going below into the oversold territory.
  4. RSI breaks its most recent high.

The image below represents the buying trade in the AUDCAD forex pair.


As you can see in the below image point, one shows the price action approached the oversold territory, which means the sellers are exhausted in this pair and soon expect the reversal. So point 2 represents the price action reversed from the oversold territory and the third point showing the sellers tried again but the immediate push from the buyers { point 4 } not accepting the sellers and are ready to go long from here. After our entry price action without any struggle goes higher, and it prints the brand new higher high.

FOR SELL

  1. RSI approached the overbought territory.
  2. RSI crosses below the 70 level.
  3. RSI tries to print another top, but it failed, and it stays below the overbought territory.
  4. RSI breaks its recent low.

The image below represents the selling entry in the AUDCAD forex pair.

As you can see that the point 1 shows the buyers are now weakening and the strong push {point 2} represents how aggressively sellers came into the show and tries to print the brand new higher high, but they failed, and the buyers again try to dominate the game, but they also failed to reach the overbought levels, and the strong buyers at point 4 finally came aggressively, and they printed the brand new lower low. In this pair, we go for the smaller stops, and the take profit was down to the higher timeframe support area.


RSI SUPPORT AND RESISTANCE

The RSI indicator also represents the actual support and resistance levels on the indicator, and these lines come in the form of horizontal zones or as a sloping trend line. Most of the traders do not know this, but they can apply the trend lines on the indicator just the way they apply on the price chart.

BUY ENTRY

The image below represents the buying trade in the AUDCAD forex pair.

The image below the RSI indicator was holding above the trend line, which is an indication for us to go long in this currency. We took buy entry when RSI almost approached the oversold area, with smaller stops, and we choose to exit at the most recent higher high.

SELL ENTRY

The image below represents the selling trade in the AUDCAD forex pair.

The image below shows the selling entry in this forex pair. You can see that the RSI indicator was respecting the trend line, and the price action was printing the brand new higher highs, so when the indicator approached the oversold area, it gave the breakout below the trend line. It was a sign of buyers weakening, and the sellers took control of the show. After entry, price action goes smoothly down and then a correction for sometimes and followed by the brand new lower low.

  1. RSI DOUBLE BOTTOM

BUY ENTRY

The image below represents the Double bottom pattern on the price chart.

The image below represents the double bottom pattern on the AUDCAD forex chart. The double bottom pattern represents the sellers tried twice to print the low, but both of the time, they failed to do so. The aggressive buyers were sits at the oversold areas to eat all the sell orders to print the new higher high. After the double bottom, we took buy entry, and price action smoothly goes north, and it prints the brand new higher high.

  1. RSI + MACD

In this strategy, we pair the RSI indicator with the MACD indicator to identify the trading signals. MACD is one of the simplest and most effective momentum indicators. The MACD fluctuates above and below the zero line, and it gives the trend line crossovers, centerline crossovers, and divergence to trade reliable opportunities. In this strategy, we paired the indicator with the RSI indicator to identify the significant trading opportunities.

The image below represents the buying opportunity in the EURGBP forex pair.


As you can see in the below image, when both of the indicators approached the oversold area, it’ a sign to go long in this forex pair. After our entry price action smoothly goes up, and it prints the brand new higher high. By pairing the one indicator with the other, we can easily filter out the low probability trades in the market.

CONCLUSION

True reversal signals are hard to identify on the price chart, but you can somehow got an idea of the reversals by checking the divergence on the chart. The RSI indicator displays the momentum so the asset can stay at an overbought and oversold area for quite a long time. So it is advisable to use the indicator in the oscillating market where the asset keeps alternating between the bullish and bearish movements. The traditional levels of 70 and 20 work very well in the market you can use them also you can use the John Hayden 66.66 and 33.33 levels to gauge the momentum better. Stop-loss is always recommended when using the RSI, and you can pair it with the other technical tools, or you can use the indicator as it is. The above we explain the four trading strategies which are mentioned below:

  1. RSI SWING REJECTION.
  2. RSI SUPPORT AND RESISTANCE.
  3. RSI DOUBLE BOTTOM.
  4. RSI + MACD.

These four are the best trading approaches we have ever discovered by using the RSI indicator.

Categories
Uncategorised

RELATIVE STRENGTH INDEX VS STOCHASTIC INDICATOR.

Introduction

Relative strength index and the stochastic oscillator both are momentum oscillator which is used to forecast the upcoming price movements. Both of these indicators have different objectives, theories, and methods to trade. RSI and Stochastic are the celebrity indicators in the industry which widely used by the all type of traders in stock and Forex market.

RELATIVE STRENGTH INDEX.{ RSI }

Developed by the J Welles Wilder, the Relative Strength Index is a momentum indicator that measures the speed and the change of the price movements of the underlying trend. Wilder featured this indicator in his book “New Concepts in Technical Trading Systems”. In his book, he also featured the Parabolic SAR, ATR and ADX indicator. RSI is a prevalent momentum indicator that featured in the number of books, articles and magazines over the years. Andrew Cardwell introduced the positive and negative reversals for the RSI indicator, and Constance Brown featured the concept of Bull and Bear market range for RSI in his book Technical Analysis for the Trading Professionals. RSI is an oscillator, and it consists of a single line which oscillates between the 0 to 100 levels. Wilder explains when the indicator goes near the 70 level, it indicates the overbought conditions and expects downside reversal. If the price holds at the 70 level for a more extended period, then it means the uptrend is super strong.

Conversely, when the indicator goes below the 30 level, it indicates the oversold market conditions and soon expects the buy side reversal and if the price action holds near the oversold level than simply means the sellers are desperate to move the price action down. RSI divergence is also a quite popular way to understand the upcoming market trend. Divergence is when the RSI indicator moves to one direction and price action move other direction, divergence shows the market is overextended and expect the reversal.

BULLISH DIVERGENCE.

A bullish divergence occurs when the price action prints the brand new lower low but indicator prints the higher low that matches correspondingly lower low in the price. This indicates the rising bullish momentum and any long trade from the break of the significant resistance area will be a good idea.

The image below represents the bullish divergence in the GBPNZD forex pair.

In the image below, the price action was printing the lower low, but the indicator failed to do so; instead, it starts moving to the upward direction which means the indicator didn’t like he selling anymore and now its buyers turn to lead the market. When the price action breaks the most recent resistance area, we choose to go long in this one.

BEARISH DIVERGENCE.

A bearish divergence occurs when the price action prints the brand new higher high but indicator prints the higher low that matches the correspondingly higher high in the price. This indicates the risking bearish momentum and any short trade from the break for the significant support area will be a good idea.

The image below represents the bearish divergence in the GBPAUD forex pair.

As you can see in the image below the prices was in an overall uptrend, and when the price action prints the bearish divergence, it means the market hit the top level, and now all we need to do is to prepare for reversals. As the price action breaks below the support area, we took sell entry for the brand new lower low.

RSI SWING REJECTIONS.

Another new RSI trading strategy which is not a quite popular but very effective way to trade the market. This strategy is known as swing rejection, and it has four parts:

BUY TRADE.
  1. Make sure RSI is in overbought territory.
  2. RSI reverse below the 70 level.
  3. RSI forms another high without crossing back into the overbought territory.
  4. RSI breaks its most recent low.

The image below represents the selling trade in the GBPNZD forex pair.

As you can see the image below represents our entry, exit and stop loss in this forex pair. So overall the pair was in a downtrend and during the pullback phase when the indicator reached the overbought area it’s a sign to go short, but we wait for the further signals and when the price action confirms all the four points we choose to go short. After the selling trade price action took a little bit of time to drop, and it printed the brand new lower low.

SELL TRADE.
  1. Make sure RSI is in oversold territory.
  2. RSI reverse below the 30 level.
  3. RSI forms another low without crossing back into the oversold territory.
  4. RSI breaks its most recent high.

The image below represents the buying entry in the GBPNZD forex pair.

The image below represents the entry, exit and stop loss in the GBPNZD forex pair. As you can see, the pair was in a pullback phase, when the indicator fulfilled all four points. At point 1, the indicator represents the oversold market, at point 2, it represents some buyers try to take the price high, but at point 3 sellers came back. They tried to print the new lower low but failed, and immediately strong buyers smack back up, and they printed a brand new higher high.

STOCHASTIC OSCILLATOR.

Stochastic is a momentum indicator developed by George Lane in the late 1950s. Stochastic is a celebrity or even the favoured indicator because it is easy to understand, and it also has a higher accuracy to identify the potential trading signals. The indicator measured the relationship between a security closing price and its price range over the predetermined period of time. According to the Lane, Stochastic doesn’t follow the price, or it doesn’t follow the volume or anything instead the indicator follows the speed and the momentum of the price to shows what’s going on in the market. The indicator changes its momentum before the price action, which makes it the leading indicator in the industry. The bullish and bearish divergences are very useful when it comes to trading the upcoming potential reversals. The Stochastic is a range bound indicator scaled between the 0 to 100 level, and the 80 and 20 are the traditional levels which used by the traders to identify the potential trading opportunities when the indicator reaches the 80 level it indicates the overbought market conditions and expects a reversal, and when it reaches the 20 level it is a sign of the oversold conditions and any reversal will be good to go long. In short at overbought conditions, we take to sell, and in oversold conditions, we choose to sell. The indicator consists of two lines: one reflecting the actual value of the indicator and the other one reflecting its three day simple moving average. The intersection of these two lines is considered to be a signal of the upcoming price reversal, as it indicates a large shift in the momentum. Keep in mind that the stochastic can stay at the oversold and overbought conditions for long enough time, so don’t a stochastic sheep who just blindly hit the buy and sell when price action approaches these levels. Instead, use other indicator with the stochastic to filter out the bad trading opportunities.

PAIRING THE STOCHASTIC WITH THE RSI INDICATOR.

FOR BUY.
  1. Look for the trending market.
  2. Check both of the indicators if they both are saying the market is preparing to go long then take buy entry.
  3. Put the stop loss just below the entry.
  4. Go for the brand new higher high.


The image below represents the buying entry in the CHFJPY forex pair.

The image below represents the entry, exit and stop loss in the CHFJPY forex pair. As you can when the prices were turned sideways and when both of the indicators reached the oversold area and gave the sharp reversal, it means that the buyers are now back into the show and brand new higher high has very likely chance to happen.

FOR SELL.
  1. Look for the downtrend.
  2. Check both of the indicators if they both are saying the market is preparing to go short then take sell entry.
  3. Put the stops above the entry.
  4. Go for the brand new lower low.

As you can see in the image below the pair represents the selling trade in the GBPJPY forex pair.

The image below represents the entry, exit and stop loss in the GBPJPY forex pair. On the weekly chart, the price action was in an uptrend, and when both of the oscillators reached the overbought area and the price action prints the strong red candle, it is a sign for us to expect the brand new lower low. As we took the sell entry price action immediately dropped, and we witnessed the drop of 12000+ pips within just nine months.

STOCHASTIC SWING REJECTIONS.

BUY TRADE.
  1. Make sure Stochastic is in overbought territory.
  2. Stochastic reverse below the 80 level.
  3. Stochastic forms another high without crossing back into the overbought territory.
  4. Stochastic breaks its most recent low.

The image below represents the buying entry in the GBPAUD forex pair.

The image below represents the entry, exit and stop loss in the GBPAUD forex pair. As you can see, the sellers having a lot of struggle to go down and also at the same time, price approached the oversold area. So when all the 4 point instruction was followed the stochastic oscillator, we choose to go long in this pair, the stops was just below the entry, and for the take profit, we choose the brand new higher high.

SELL TRADE.

  1. Make sure Stochastic is in oversold territory.
  2. Stochastic reverse below the 20 level.
  3. Stochastic forms another low without crossing back into the oversold territory.
  4. Stochastic breaks its most recent high.

The image below represents the selling entry in the NZDCHF forex pair.

As you can see in the image below, it represents our entry, exit and stops loss in the NZDCHF forex pair. As you can see the pair was in an overall uptrend and the stochastic at overbought area means the reversal is about to happen. Still, we wait for the precision entry only when the indicator followed all the four steps of our strategy. This strategy is the new one in the market, and it often gives the excellent risk to reward ratio trades, and simply expect the fewer trades in the market. Whenever you find all the four points in the market, it’s a sign for you to go big in your trades and always expect the brand new higher high or lower low.

BOTTOM LINE.

Both of the indicators are the celebrity in the industry; both of them worked at different market conditions. RSI is designed to measure the speed of the price movements, and the stochastic oscillator works well in the choppy markets. The RSI consists of one single line which oscillates between the 70 to 30 level, and the stochastic oscillator consists of two lines which move between the 80 and 20 level. Overall, the RSI indicator is useful to trade the trends, whereas to trade the ranges and channels always go for the stochastic oscillator.

Categories
Uncategorised

Top 5 Tools to Market Your DeFi Project

When bitcoins first broke into the finance segment, the world associated pseudo-anonymity with criminal activities. The negative perception caused initial distrust from governments, and major advertising platforms like Facebook and Google Adwords banned the advertising of cryptocurrencies.

Marketing DeFi projects on Facebook’s ad manager or Google Adwords is out of the picture, as these two domineering advertising platforms distance themselves from blockchain assets. In this Mega Big Data era where digital marketing is superlative, innovators face a stiff bottleneck launching and growing their projects.

Interestingly, Facebook and Google allow you to market organically via social media posting and fan engagement. Google also empowers you in gaining significant visibility via high-quality content publishing and SEO.

However, the digital space is bigger than paid-advertising platforms. DeFi startups must leverage every marketing tool available to them, and the insightful application of relevant market data is paramount.

In this article, let’s take marketing tools to mean techniques and SaaS products creating positive brand awareness. We are looking at those that help in coordinating and organizing outreach efforts. The following are the top five tools for marketing your DeFi project.  

WordPress for Blogging

WordPress is one of the most popular publishing SAAS tools in the marketing world. This content management system allows you to create landing pages, educational posts, and lead-capture forms.

The world’s population is vastly ignorant of DeFi products and the benefits of the digital ecosystem. Such ignorance remains the biggest challenge to DeFi startups, and mass education on DeFi could be the secret to making your project successful.

Websites are useful for making educational and commercial advances in popularizing crypto products. WordPress is conducive because it is open-source, free, and offers empowering publishing features. It eliminates the need for writing any code, and savvy web designers can go into development without incurring extra costs.

By taking advantage of WordPress, you can blog about your DeFi project and highlights its use-case benefits to potential consumers and investors. You can also integrate it with eCommerce tools to sell your products onsite.

YouTube for Visual Influence

YouTube yields the same dynamic effect that storefront displays have on shoppers. It can lead to unplanned consumption or cause unintentional audiences to plan for future purchases. This marketing tool is organic, and you shouldn’t couple it with paid Google Ads, lest you lose your entire Google account.

Post engaging and authoritative videos on your niched-down channel. You can even get popular influencers with a grip on your target market to post for you on their established channels.

This tool, compounded with relevant influencers, delivers visual clarity and trust. YouTube vlogging immerses potential clients into the details of your DeFi project, and reviews offer the most effective results. Therefore, targets understand your offers, helping to reduce resistance caused by suspicion and ignorance.

Partner with popular crypto YouTube vloggers to earn trust and capture relevant attention for your DeFi project.

MailChimp for Email Marketing

This email marketing tool is popular among B2B establishments, and it presents significant marketing benefits. MailChimp serves over 12 million customers, which makes its industry-specific access to data vast.

You can gradually collect and segment an email list and send over 12,000 monthly emails for free. You only need to pay if you grow your prospects list to more than 2,000 subscribers.

You don’t have much to lose relying on MailChimp, which grows your project for free until you can afford to pay. Take one step at a time, and develop a community of enthusiastic subscribers.

Facebook-Telegram Funnels for Group Mobilization

Facebook and Telegram are reliable for engaging savvy and novice leads. Facebook offers a relevant audience, and you can find ways to direct them to Telegram groups.

Community building helps collect like minds in groups for coordinated conversion. Creating Facebook groups for crypto discussions, and you should create social media groups for your DeFi project.

The great thing about Facebook-Telegram funnels is that group members generate their content via casual debates. You don’t have to write lots of direct-response; savvy members often answer questions from novice ones.

Group members also invite friends and family who are likely to enjoy particular discussions. Therefore, you can amass a cult-like following that’s likely to market your DeFi project with impressive firepower.

Find a way to attract significant crypto influencers to your groups.

Etherscan for Blockchain Browsing

Facebook and Google are robust ad platforms because of their vast audiences. However, their ad traffic is out of bounds for you because they are against blockchain marketing.

Etherscan is a few of many blockchain-based browsing platforms with quality traffic. Most users appreciate crypto security and DeFi benefits. Therefore, you stand better chances at generating quality leads on this platform than regular browsers.

Posting banner campaigns on Etherscan is straightforward, and you can adjust audience preferences to suit regions, timeframes. It also empowers DeFi startups with detailed, fraud-resistant ad analytics, and you can trust the reported marketing results.

Etherscan is fraud-resistant because it validates transactions via blockchain technology. It exists as an independent entity, and its transactions rely on smart contracts for execution.

Best of all, this marketing tool is free to use, and it doesn’t require users to register for access to premium features.

Parting Shot

DeFi projects are cropping up every day, but the market is still pretty ignorant about DeFi benefits. The crypto space faces uncertainty and negative public perception, which is fast eroding. People are increasingly embracing DeFi projects that they understand, and the trend is making it easier to launch innovative solutions.

The best way to market any DeFi project is to support the mass education of folks. These technologies offer valuable utility, and people just need to know the benefits. Therefore, make sure the target audience gets educated through your marketing efforts.

You have a wide range of tools at your disposal for marketing your DeFi project. Don’t try bypassing rules on Google or Facebook because you don’t want to lose such vast prospecting networks. Take advantage of the tools we’ve just listed, and combine them for the most effective results.

Let us know about your previous experiences marketing your DeFi projects, and share this article with friends looking to grow their DeFi startups.


Categories
Uncategorised

The Bitcoin Bubble: When Will It Ultimately Burst?

In finance, bubbles refer to asset-value. A bubble can be of an asset or an economy, and it’s a cyclic situation through which the market value of assets rapidly increases. Bubbles are unsustainable because commodity prices hike without improving the utilitarian value of consumer products.

Bitcoin’s value grew steadily over its first nine years of existence, despite some major day-trading volatility. It hit an all-time peak in 2017 after an aggressive, bullish streak. Throughout the last half of 2016 and the first half of 2017, investors were in a frenzy to leverage its speculative growth.

The 2017 bubble burst, but it did not grind Bitcoin’s value to zero. The crypto asset depreciated by about 80% in value. It went back up to about 88% of the 2017 peak value after three years.

Investors made fortunes by staking in Bitcoins, but some were unfortunate to buy in during bearish streaks like the 2017 Bitcoin crash. One thing that all crypto investors agree on is that the market is extremely volatile.

In 2020, a similar Bitcoin streak manifested, causing investors to debate if the market was one big bubble waiting to burst. In January, the digital currency cost $7,200, but the value ballooned to $32,700 by the end of December. However, the market conditions of 2017 and 2020 were very different.

In this article, we are establishing whether Bitcoin is an overhyped asset. Is its value inflated, or is it worth all the fuss? We are going to study interesting bits of its financial history. Ultimately, we’ll establish if it’s a safe investing haven or if you are about to lose money on an unsustainable market.

Bitcoin as the Original Cryptocurrency

On the 31st of October 2008, Satoshi Nakamoto unveiled the Bitcoin whitepaper, presenting peer-to-peer cash systems as the ultimate solution to untrustworthy central banks. At the time, the economy was on its knees due to a real-estate bubble that burst, unearthing banking malpractices.

The United States initiated a global financial crisis due to wanting, centralized fiscal policies and caused populations to interrogate financial services with extra scrutiny and discontent.

The 2008 financial crisis was a major reason for Bitcoin’s creation, and widespread adoption stems from a discount on the Fed’s ability to print dollars out of thin air. It channeled the trust needed and betrayed by banks and third-party financial services into a permissionless, peer-to-peer fashion.

The practical value of this blockchain software prevents its price from dropping to zero.

The First Major Bitcoin Bubble Burst

The 22nd of December 2017 saw a one-day, 23% depreciation of Bitcoin’s value and the start of an aggressively bearish trend. The sudden plunge was unprecedented, considering the bullish growth Bitcoin posted throughout the year. 

In January, the digital asset was valued at $998, and the price bulged to $20,000 by the 21st of December.

Many pundits termed the cryptocurrency as a Ponzi scheme at worst or a speculative bubble at best. Before the crash, JPMorgan Chase tipped investors of Bitcoins tripling prices. In response, the CEO, Jamie Dimon, termed the digital assets as fraudulent, worthless tulips.

Bitcoins didn’t go bust after the 2017 crash, like the Silk Road website or Mt. Gox. It stabilized after rampant volatility and picked up a 3-year long bullish streak with some shocks. In 2020, JPMorgan Chase was actively investing in bitcoins and other cryptocurrencies.

The gradual recovery suggests some underlying utilitarian value in Bitcoin. So, why did its value slump so bad in 2017?

Well, cryptocurrencies require liquidity to foster convenient payment services. The entire crypto market relied on ICOs for liquidity, and the ICO craze caused a speculative bubble to engulf Bitcoin and other cryptos.

Fraudulent ICOs were rampant in 2017, and they caused financial regulators to crack the whip on the entire crypto community. As the SEC initiated legislative scrutiny on Bitcoin, scared investors started selling off their crypto assets.

The crash was also catapulted by Goldman Sachs, sidelining plans for a crypto trading desk. These events heightened Bitcoin’s volatility, and the blockchain was also undergoing a hard fork.

Reasons Why Bitcoin Won’t Crash Again

Investor Confidence

Bitcoin survived the 2017 crash, and many investors were adamant about training their cryptocurrencies for the long-term. In fact, the crash attracted seasoned investment experts, who rushed to buy low and are reaping big from the current bullish growth.

Regulatory Progress and Censorship Resistance

The crypto markets proved resistant to the legislative witch-hunt mounted against them. Bitcoin’s greatest threat was always government censorship, but it even survived total bans. It initially attracted users because of its censorship-resistant innovations.

In 2020, we saw regulators finding impressive middle ground with crypto communities. Investors can be confident getting into Bitcoin markets because the ecosystem is now more protective. The biggest indicator of regulatory confidence was risk-averse PayPal integrating Bitcoin payments for American users.

Covid19 Necessitated Digital Currencies

Bitcoins are limited in supply, and politicians cannot manipulate digital currencies via whimsical printing. It means that while fiat currencies keep getting diluted at mining machines, bitcoins appreciate. Digital currencies are valuable because they are pegged on demand and supply forces.

Covid19 exposed the fault of central banks printing money out of thin air to humanity. Moreover, American interest rates at banks have been minimal for years now. These issues accelerate the distrust of banks and fiat currencies.

Investors are looking to secure future relevance through digital commodities like Zoom, Amazon, Microsoft, PayPal, and Bitcoins.

Central banks are aware that cashless payments are the future, and they are developing their cryptocurrencies. While the novel CBDC assets may be considered competitors, they will affect Bitcoin’s adoption positively.

The Evolution of DeFi

DeFi propagates the peer-to-peer value exchanges, and investors can use DeFi to trade commodities, currencies, securities, and services. It relies on smart contracts, which hold monetary value within themselves for escrow purposes.

Blockchain technologies are maturing fast, and investors can now enjoy cross-chain money markets. Ethereum offers composability with numerous dApps, and innovators like Kava.io developed cross-chain interoperability.

Even though Ethereum is behind most DeFi innovations, Bitcoin is a major beneficiary because investors can now trade, lend or borrow bitcoins on decentralized exchanges.

The Halving Event

Bitcoin previously had three halving events, each happening after four years. These events always precipitated bullish trends. As bitcoins continue getting depleted, mining rewards half at every halving event.

In 2012, the mining fees halved from 50BTC to 25BTC. In 2016, the fees went down from 25BTC to 12.5BTC, and in 2020, they dropped to 6.25BTC.

Every having event reduces the supply of bitcoins. On the backdrop, demand increases as the transaction costs drop significantly. The result is often an upward trend in price mobility.

Parting Shot

It’s always embarrassing to make predictions in the crypto markets. The volatility is often too much, but some trends are not going away. While we can forgive traditional financial experts like Jamie Dimon for castigating Bitcoin, they were wrong about its worth.

Bitcoin is an avenue through which decentralized finance is possible. It’s secure, limited, cost-effective, and transparent. Other digital currencies may replicate its practical value, but it remains the first among many equals.

Do you still think that Bitcoin is a mere bubble waiting to bust in speculators’ faces? Well, we’d like to know your reasons, and you can make your predictions in the comments section.

Categories
Uncategorised

Range Trader for Multi-Pair and Multi-Time Frame Indicator Review

Range Trader For Multi Pair And Multi Time Frame can be found within the indicators section of the MQL5 marketplace. The indicator was uploaded by Yossarian Escobedo on the 13th of January 2016, the indicator was uploaded as version 1.7 and it has not received any further updates since it was uploaded to the MQL5 marketplace.

Overview

Range Trader For Multi Pair And Multi Time Frame is an indicator that can be used with the MetaTrader 4 trading platform. The indicator was created to help automatically find high probability range trading opportunities. It will look for pairs that are not trending that have just come off a recent high or low, the indicator uses the RSI and ADX filters to find these opportunities.

Some of the main features of the indicator:

  • Has the power to monitor 28 pairs simultaneously.
  • Can monitor time frames from 1 Minute to 1 Month simultaneously.
  • Automatically triggers an alert when the appropriate pattern is identified.
  • Can monitor any symbol for any asset within the Metatrader platform. 
  • Includes two separate filters (RSI and ADX), which work to identify the best possible trade setups.

The indicator only needs to be placed on a single chart, it will then be able to monitor the entire market. Along with everything else, there are some parameters that can be altered to slightly change the way that indicator works, some of these include the RSI period, the RSI up and down levels, the ADX period, the ADX level, the symbols to use, and which time frames to use.

Service Cost

The indicator will currently cost you $79 to purchase it outright and this will give you unlimited access and no limitations. You are also able to rent the indicator, this can be done on a one-month period which will cost you $59, you can also rent it for three months which will cost you $69 for that time.

There is a free demo version available, the site does not state what the limitations of the free account are, but it is worth downloading just to test it out, regardless of any limitations.

Conclusion

At the time of writing, there are 31 different user reviews giving the indicator an overall rating of 5 out of 5.

The indicator looks good, early days but if it’s anything like the great customer service Mike provided I’m sure it will be a winner. Mike sent me some really valuable information about how real traders operate which I’m sure will be valuable for me in the future. This approach makes me believe these guys are the real deal.” – A 5-star review.
One of my favorite indicators. Mike was great and helped me set up the indicator for optimal usage and time frame. He also gave some guidance as to the best way to trade. I was so impressed I now own 5 of their indicators.” – A 5-star review.
I’ve been trading for over 10 years now without good results, but with this scanner, I’ve finally started making some money. I love Range Trading thanks to the “Range Trader For Multi Pair And Multi Time Frame” Many thanks to the professional team, and not least thanks for the outstanding customer service.” – A 5-star review.

So the reviews are all very positive which is a good sign, there are also a number of different comments, the developer has been replying to each one in a prompt manner which shows that the developer is actively supporting the product and the customers who use it. We would suggest downloading and trying out the free version, also contacting the developer will help you ensure that the indicator is the right one for you.

Categories
Uncategorised

Daily F.X. Analysis, January 29 – Europe’s GDP’s / Consumer Sentiment + Join Forex Academy’s Telegram Signal Channel! 

Dear traders,

We are moving signals from website to telegram channel. If you enjoyed our signals and want to continue to receive ing them, please subscribe to our telegram channel:

The German Prelim GDP q/q, French Flash GDP q/q, and Spanish Flash GDP q/q report will remain in highlights today on the news front. Later Revised UoM Consumer Sentiment and Pending Home Sales m/m can drive market movements today.

Economic Events to Watch Today  


EUR/USD – Daily Analysis

The EUR/USD closed at 1.21220 after placing a high of 1.21422 and a low of 1.20806. The EUR/USD pair remained higher on Thursday amid the broad-based U.S. dollar weakness and the positive macroeconomic data from the European side. Behind the gradual upward momentum in EUR/USD pair was the U.S. dollar’s weakness driven by the improvement in the market’s appetite for risk. The U.S. Dollar Index that measures the greenback’s value against major currencies dropped by 0.3% and weighed on the U.S. dollar, supporting the upward momentum in EUR/USD pair on Thursday.

On the data front, from the U.S. side, at 18:30 GMT, the Advance GDP for the quarter declined to 4.0% against the forecasted 4.2% and weighed on the U.S. dollar that capped further gains in EUR/USD pair. The Unemployment Claims from last week were declined to 847K against the forecasted 880K and supported the U.S. dollar that also limited the upward momentum in EUR/USD pair. The Goods Trade Balance from December declined to -82.58B from the forecasted -83.4B and supported U.S. dollar. For December, the Prelim Wholesale Inventories also fell to 0.1% against the forecasted 0.5% and supported the U.S. dollar.

At 18:32 GMT, the Advance GDP Price Index for the quarter declined to 2.0% against the forecasted 2.2% and weighed on the U.S. dollar hat added further gains in EUR/USD pair. At 20:00 GMT, the C.B. Leading Index for December came in line with a 0.3% forecast. In December from the U.S., the New Home Sales declined to 842K against the forecasted 860K and weighed on U.S. dollar to and pushed the EUR.USD pair are even higher.

From the European side, the German Prelim CPI in January raised to 0.8% against the expected 0.4% and supported Euro that ultimately pushed EUR/USD pair higher. At 13:00 GMT, the Spanish Unemployment Rate dropped to 16.1% against the expected 16.7% and supported Euro to add further gains in EUR/USD pair on Thursday. 

Moreover, Wall Street suffered its biggest one-day percentage decline in three months overnight, with declines accelerated in the wake of the U.S. Federal Reserve’s policy statement. The Fed signaled a worrying slowdown in the pace of recovery of the world’s top economy and sworn continued support until a full economic rebound was in place. This also weighed on the U.S. dollar and supported an upward momentum in EUR/USD pair.


Daily Technical Levels

Support   Resistance

1.2054      1.2167

1.1999     1.2225

1.1940      1.2280

Pivot point: 1.2112

EUR/USD– Trading Tip

The direct currency pair EUR/USD is trading with a bearish bias at 1.2090, facing immediate resistance at 1.2132 level. The EUR/USD is again forming three black crows on the hourly chart, dispensing the selling trend in the EURUSD pair. On the downside, the pair is expected to go after the 1.2090 and 1.2055 level. The 50 periods EMA are signaling the selling trend in Euro today. Violation of 1.2050 will determine long term trend.


GBP/USD – Daily Analysis

The GBP/USD closed at 1.37267 after placing a high of 1.37458 and a low of 1.36299. The U.S. dollar’s fresh weakness and the rise in British Pound against other major currencies lifted the currency pair GBP/USD on Thursday. Prime Minister Boris Johnson announced no schools until 8-March and laid out a lengthy exit strategy from the lockdown this week. However, a detailed plan will be out on the week of February 22. This showed that Johnson may have learned from past promises and was now going wrong on the side of caution. Because people were expecting an earlier exit from the restrictions and this announcement killed their expectations.

In December, Johnson rejected calls for a lockdown and refused to cancel Christmas, only to back down several days later. However, the U.K. has been vaccinating its population rapidly, which should have led to the lifting restrictions not extending them. Despite all these lockdown developments in the U.K., the British Pound remained amongst the top three best performing G10 currencies on Thursday and supported the upward momentum in GBP/USD pair.

On the data front, from the U.S. side, at 18:30 GMT, the Advance GDP for the quarter fell to 4.0% against the anticipated 4.2% and weighed on the U.S. dollar that added more gains in GBP/USD pair. The Unemployment Claims from last week dipped to 847K against the anticipated 880K, supported the U.S. dollar, and capped further GBP/USD pair gains. The Goods Trade Balance fell to -82.58B from the anticipated -83.4B and supported the U.S. dollar from December. The Prelim Wholesale Inventories for December also fell to 0.1% against the anticipated 0.5% and supported the U.S. dollar. 

At 18:32 GMT, the Advance GDP Price Index for the quarter fell to 2.0% against the anticipated 2.2% and weighed on the U.S. dollar that pushed the currency pair GBP/USD higher. At 20:00 GMT, the C.B. Leading Index for December came in line with the anticipation of 0.3%. The New Home Sales in December from the U.S. fell to 842K against the anticipated 860K and weighed on the U.S. dollar and supported the rising prices of the GBP/USD pair.

The declining GDP numbers from the world’s largest economy in the last quarter of 2020 added weight on the local currency U.S. dollar and supported the GBP/USD pair’s rising prices on Thursday. Furthermore, the market’s risk sentiment was somehow supported by the rally in precious metals markets triggered by speculation that retail traders who had been focusing on pumping stocks like GameStop were now turning their focus to silver. The rising risk sentiment in the market also helped the risk perceived GBP/USD pair rise on Thursday.


Daily Technical Levels

Support   Resistance

1.3643      1.3746

1.3600      1.3804

1.3541      1.3848

Pivot point: 1.3702

GBP/USD– Trading Tip

A day before, the GBP/USD pair traded bullish after violating the narrow trading range of 1.3680 – 1.3670. It placed a high of around 1.3753 level, and it later reversed back to trade between the same trading range of 1.3696 – 1.3646. The GBP/USD may find support around the 1.3647 level, and violation of this level can extend selling bias until 1.3610. Approaching the 2-hour timeframe, the GBP/USD is holding below 10 and 20 periods EMA, and it may extend the selling trend today. Let’s consider taking a sell trade until 1.3645 and 1.361 level.  


USD/JPY – Daily Analysis

The USD/JPY pair was closed at 104.259 after placing a high of 104.460 and a low of 104.053. The currency pair USD/JPY extended its gains on Thursday amid the pickup in risk appetite in the market that drove weakness in both the U.S. dollar and Japanese Yen versus most of their major G10 counterparts due to their safe-haven status. 

However, nominal U.S. yields rose on Thursday, with U.S. Treasury yields on the 10-year note up more than 4bps at 1.06%. It drove an increase in U.S./Japanese rate differentials that favor Japanese Yen flows into the U.S. dollar, supporting the currency pair USD/JPY. On the data front, at 04:50 GMT, the Retail Sales from Japan in December dropped to -0.3% against the expected -0.4% and supported Japanese Yen, and capped further upside in the USD/JPY pair.

From the U.S. side, at 18:30 GMT, the Advance GDP for the quarter decreased to 4.0% against the projected 4.2% and weighed on the U.S. dollar and limited further upside momentum in the USD/JPY pair. Last week, the Unemployment Claims decreased to 847K against the projected 880K and supported the U.S. dollar that added further gains in the USD/JPY pair. The Goods Trade Balance from December decreased to -82.58B from the projected -83.4B and supported the U.S. dollar and pushed the currency pair USD/JPY higher.

 For December, the Prelim Wholesale Inventories also decreased to 0.1% against the projected 0.5% and supported the U.S. dollar that extended gains in the USD/JPY pair. At 18:32 GMT, the Advance GDP Price Index for the quarter decreased to 2.0% against the projected 2.2% and weighed on the U.S. dollar and capped further upside in the USD/JPY pair. At 20:00 GMT, the C.B. Leading Index for December came in line with the projection of 0.3%. In December from the U.S., the New Home Sales decreased to 842K against the projected 860K and weighed on the U.S. dollar and capped further gains in the USD/JPY pair.

Risk appetite in the market took a meaningful turn on Thursday, with U.S. equities erasing losses incurred on Wednesday leading up to the FOMC monetary policy decision event. The ultra-dovish tone of the Federal Reserve was actually seen as positive for the risk appetite as Wednesday’s risk-off was a result of overvaluation fears as well as because of the short-selling hedge funds being forced to liquidate profitable large-cap stock long positions as speculative retail trade-driven mania continued in the likes of GameStop. Furthermore, another reason behind the rising USD/JPY pair prices was that the U.S. stimulus package proposed by Joe Biden did not receive approval from Republicans as of yet. This also supported the U.S. dollar that ultimately added gains in the USD/JPY pair.


Daily Technical Levels

Support   Resistance

103.71      104.34

103.33      104.58

103.09      104.96

Pivot point: 103.96

USD/JPY – Trading Tips

On Friday, the USD/JPY pair is trading with a bullish bias at 104.475, and it has violated the resistance level of 104.385. It’s likely to lead the USD/JPY pair until the 104.745 level. On the lower side, the USD/JPY may find support at the 104.300 level. The USD/JPY pair is likely to stay bullish as MACD and EMA suggest bullish bias in the USD/JPY pair on the four hourly timeframes. We can expect USDJPY to bounce off upon 104.300 to continue buying trend today. Good luck! 

Categories
Uncategorised

Traffic Pulse MetaTrader 4 EA Review

Traffic Purse is located within the MQL5 marketplace, it was created by Kenneth Parling and was first uploaded to the marketplace on the 26th of March 2020. I received its most recent update on the 13th of April 2020 and is currently at version 1.3.

Overview

Traffic Pulse was designed to be used with the MetaTrader 4 trading platform, it is advertised as a stable, secure, and 100% automated hybrid scalper. The EA only works for a few hours during the night, market entries are found with a high level of precision, small profit targets are set for each trade. 

The EA comes with a host of features which include automated trade time server adjustments, automatic magic number setting, different order execution modes, weekday managers so you can choose which days to trade, a powerful 3 in 1 risk management system that allows trading fixed or flexible lot sizes, there is also an order swap charge controller which will help avoid triple swaps on Wednesdays.

Some recommendations from the developer of the EA:

  • Use ECN account, stop level 0 required and low spread
  • Use a stable VPS
  • Works with any leverage. Based on the leverage of 1:500 the minimum deposit can be $200 but it’s recommended to start with at least $1000 to get high yield trades.
  • Apply default settings to currency pair EURUSD M15

The EA also comes with some adjustable settings. These include the amount of risk to use, which days to trade on, a virtual mode, slippage allowed, stop losses, target in pips, whether to use dynamic levels, max spread, and more.

Service Cost

The EA will set you back $249 as a single payment, so it is a little on the expensive side, this is a one-time payment and will allow you to activate the EA up to 5 times, unlike many expert advisors on the MQL5 marketplace, there is no option to rent it. There is a free demo version available, this can however only be used with the strategy tester within the MT4 platform

Conclusion

There aren’t any user reviews for Traffic Pulse so it has made it hard for us to know whether those that are using the Ea are finding it useful or profitable. There are two comments in the comment section, these are both from the developer of the EA themselves, the comments were pretty recent which is a good sign as it shows that the developer is still around, due to there being no reviews, and the price being quite high, you should contact the developer with any questions that you may have, this is a great way to ensure that it will work for you and that the creator will be there to offer support should you need it.

Categories
Uncategorised

Forex Vs. Binary Options: Which Carries More Risk?

Risk and profitability always go hand in hand. It is well known that the higher the profit we expect, the higher the risk traders will take. And on this, we will base this article, on the differences in profitability between Forex and Binary Options to determine which investment has more risk.

What is behind these businesses? What are binary options? What is their operation? Why do you hear so much about binary options in currencies? How are binary options different from Forex? Is there a kinship?

What Are Binary Options?

Binary options are a financial derivative that works on underlying assets such as currencies, or commodities… where the potential gain is fixed because it is determined at the time of the purchase of the investment.

To put it more clearly, binary options create a contract in which you as a trader choose a trend as a forecast of the future price on an asset. This forecast can be in three ways: equal, less, or greater than the price chosen by the trader at the time of the investment.

This price is called the strike price. You as a trader are also obliged to choose a maturity date of the investment, so that when that term ends check if the forecast that was made of the price is successful or not.

This is how you work on binary options, with predictions of asset price trends and with a fixed profit value that is set at the time of the investment and with a maturity date to check the result.

How Do Binary Options Work?

The first way is to bet if when the binary option reaches the end of the maturity date its price will be above or below the exercise price, that is, an upward or downward prediction.

The second way to make predictions is to focus on the trader pointing to a price cap that will be reached at least once before the expiration date. These binary options are called One touch.

The third way to make these predictions. A price range is sought that predicts that the value of the underlying asset will remain when it reaches its maturity date. We call these predictions Boundary or Zone.

There is a denomination to be taken into account with regard to increases or decreases, or price increases and decreases. The options called Call are those that claim to be winners potentially linked to the increases of the underlying asset.

If what we do is to predict in reverse, thinking that the trader’s profit will be determined by a drop in quotation values, then we will call it opinions put.

What Are the Differences Between the Two?

Starting, we must make it clear that a market like Forex moves in spot type, which is a market where all the contracts that are executed to buy and sell are carried out at that time and the investor has to make the payment of the market price which at that time reflects the value of the asset. However, this is not at all what happens in Binary Actions. Binary options are not tied to the market value of the assets, this is an advantage.

In binary investments, there is a lower and more controlled risk by the simple fact that you are not buying an asset and paying a price for it. What you’re doing is investing in a prediction in which you determine the direction the price of that underlying asset is going to take in a given time frame with a maturity date.

Binary shares do not acquire assets, they are contracts in which the trend of such assets is determined. These contracts never influence the quotations on the underlying asset. The binary options market does not suffer the comings and goings of the stock market, because for traders it is like a blackboard on which valuations are scored and on which predictions are made up or down.

When we speak then of binary options on currencies, we are not acting on the value of those currencies or affecting their behavior. What we are doing is assessing whether the price of these currencies will tend to rise or fall in their market. So we call binary shares on currencies because we’re working on that underlying, which in this case is currencies. It is noteworthy that there is a very important distinction between binary options and Forex.

We talk about how we value profit calculation or a failed operation. As we said before, the Forex market is a spot market, so when you buy or sell you will do it at the price that marks the market at that moment.

We will then calculate the profits and losses by subtracting the price we paid at the time of closing the transaction from the price we paid at the opening. This is how we get the number of pips. What we do is multiply the value of the pips by the number of pips obtained and thus we reach the end of the profit or loss of this completed operation.

On the other hand, if we talk now about binary investments, the profit or loss result is measured as a fixed percentage value of the capital you have invested. That percentage amount of profit or loss is constant and you will always know it to make your trade. This difference is fundamental to keep in mind because this marks a very serious gap between Forex and Binary options.

While Forex will keep an eye on how the asset market evolves, with binary options you just have to see if the trend is up or down. We talked before the maturity dates of binary transactions. In Forex this maturity period does not exist because what is intended is that your capital is the longer the better in the asset market. While with binary options everything is clearer and more transparent because there is always a time when you know that your investment will end and you will see the results.

“In addition, binary options move in much shorter periods than Forex. This allows you to better control risks and increase profitability in less time.”

While in Forex you will be working with possible results of 50% positive at most, in binary options the positive net result will always be higher than 70%, depending on the type of option and its maturity date.

In binary options, we are making much more accurate investments, with less risk than Forex, with simpler and faster results so we can make decisions before, and with minimal positive results that usually far exceed the best possible result with Forex. However, to date, many countries have banned investment in binary options. Regulators appeal to the complexity of these financial products and their lack of transparency.

For some time, trading binary options has led to large losses for investors, especially among retailers who had less experience in the markets, and who saw their investment being lost beyond repair. The lack of information and transparency on investment vehicles has led to a high percentage of investors who have already lost all of their investment.

But we think that it is not the product itself that is to blame for this, but rather the lack of preparation of certain investors who do not have enough knowledge and who have treated this investment as a mere game of chance.

Categories
Uncategorised

The Martingale Strategy: Usage, Procedures, and Methodology

As you may know, today there are hundreds of different trading strategies and martingale is one of the best known. Is it because it is the most profitable? What is the reason for this fame? Can you really win with a Martingale system?

How Does the Martingale System Work?

This method began to be used in the world of betting with the aim of great profits in exchange for the risk of being able to end up in bankruptcy. It even started to be limited in casinos because customers ended up losing a lot more than they expected to win.

Its creator was Paul Pierre Levi in the 18th century, who made strategy popular in the world of chance since it is basically a matter of doubling the bet after having generated a loss.

Yes, as such, the intention is to keep doubling the bet until a win is generated. In case of a hit, the bettor can recover everything played and add up the win of the initial bet. If this is not the issue and there is no success, the player, having run out of chips, can only withdraw with empty pockets.

I’ll give you a simple example. When you toss a coin in the air, you only have two alternatives: heads or tails. Your initial bet is 10 euros in favor of a face on the next throw. You will be with me here there is both the same chance that the bet will fall on the same side as it will fall on the other side (50%).

Considering, that each throw is independent and after several pitches with a result against your bet, after having doubled the bet 3 or 4 times and only one win, you will recover the loss and gain a win of double with respect to the initial investment. A single victory not to lose everything, this is one of the great attractions of martingale.

Applying the Martingale System to Trading

In trading, this applies in a similar way, as the key to Martingale strategies when you do trading is to go up the size of the position as the price goes in the opposite direction. Trading instead of doubling can increase the bet size by 1.1, 1.2, 1.3 A multitude of variants and scenarios although as we will see below the effects usually have the same end.

One day someone introduces you to a seemingly very winning trading system. It’s December 2012 and it’s been over a year and a half with excellent results. You decide not to listen because you already know what is the martyr strategy and its consequences. Weeks later you decide to review it again and you see an 87% drop. About to lose everything in a few days. When you figure this out, you’ll know where don’t have to put your time and money and how they can end up if you do.

Martingale Forex Strategy

Let’s go with an example of forex martingale. You enter in EUR/USD buying two lots. Your goal is to make a move up to 1.1598. However, the price drops and you add two more lots in 1568. Now the price will only have to reach 1.1583 (the new break-even point) for you to make a profit. The higher the number of lots you enter, the lower the even point (the average entry value between all trades already opened).

We’re talking about one of the reasons why a person with higher capital has a higher level of security to recover after a few losing trades. Although for this method to work you should have infinite money. Why? Because your pocket is always going to be less than the chance that the next operation is a loser or the price goes against you.

Investment and Trading Systems Based on Martingale

One of the most famous systems based on martingale is the grid, which is associated with Forex because it is where it is quite popular. There are many traders who use this technique to do Forex trading, but this does not mean much that it can be considered a winning system.

The idea here is to divide the chart into grids and put purchase and sale orders in each section, with the intention of being able to take advantage of the rise in the market. In the traditional method, you enter a purchase and a sale in each section and you take advantage of the idea that side movements in Forex trading are common. If you look at a 5 or 15-minute chart, you can see how many times the price has been without a clear trend for several days. They are usually rather broad ranges and can provide many operations, the problem that can be found in the price going out of range and generating insurmountable losses.

The only advantage and so it is so common and applied this type of system is because they do not need to predict the trajectory of the market because if it is directed in one direction or another, they always cover the position of the same.

Over time, you can find some of the winning grid systems, usually have a component of preference, in addition to cordon off maximum losses, so as not to get into unsustainable situations. There are many variants of martingales on the Internet, more or less aggressive, but the vast majority have positive negative hope, they are losers.

Martingale Works Best on Forex?

One of the reasons why martingale is so well known in the foreign exchange market with respect to the stock market is because it is almost unlikely that the exchange rate of a currency pair will reach zero. Listed companies can fail, a country’s currency will hardly fail.

Surely there are times when a currency can be devalued, but at times when there is a strong drop, the value of the currency does not reach zero. It is not impossible, but what would be needed for this to happen is very, very extreme.

You may have heard some traders talk about applying martingale in currency pairs with positive swaps. With lots of lots, interest income can be very important and reduce risk. Sounds good, doesn’t it? With a high number of lots the account can go bankrupt with a small move.

Risks in Martingale

If you are willing to implement this strategy, you first need to ask yourself if you are willing to lose most of the account capital in a single transaction. Considering that martingale offers a very high risk-benefit pattern, it is unacceptable in any professional practice, as it is not considered in itself as a strategy that offers strength when properly implemented.

Such strategies are good in theory, but a scam in practice. If you want to develop a professional trade, you must understand that it is necessary to contemplate the loss and assume it within a normal scenario, without in any case supposed to lose all your money.

Martingale Trading Methodology

The vast majority of automatic systems sold on the Internet are martingale-based systems, with a real, short-term account. Then they go bankrupt, they delete that account and they create a new one. It pays to lose that money because their real business is selling the systems.

How can you identify them? They are systems with a high percentage of success and have little volatility, constant earnings. too pretty to be real. They are usually depicted with almost perfect curves. If you don’t see falls and negative operations shut down, there’s a chance it’s a martingale.

This does not mean that all systems sold or all automated systems are like that. But there’s a lot of undercover scam going on about this, and I recommend you be on the lookout for it.

Categories
Forex Signals Uncategorised

EUR/AUD: The Bear Making a Run Again

EUR/AUD has been bearish for the last two days. The pair made a bullish correction on the 15M chart to start its trading day. Then, it made a breakout at yesterday’s lowest low at 1.60920 and had a bounce at 1.60600. The price then consolidated within these two levels. Upon producing a doji candle followed by a bearish engulfing candle the pair made a breakout at the level of 1.60600. An entry has been triggered right after the breakout candle’s closing at 1.60472. The price may make a bearish move up to the level of 1.60472. However, it may find its next support around 1.60080. We may consider taking a partial profit at that level depending on its bearish momentum.

Trade Summary:

Entry: 1.60472

Stop Loss: 1.60872

Take Profit: 1.59372

The risk for the trade per standard lot is $ 300.14, Mini lot $ 30.01 and Micro lot $ 3.00. The risk-reward is 1:2.75. Thus, the reward for the per standard lot is $825.38, Mini lot $ 82.53 and Micro lot $ 8.25.