Categories
Forex Service Review

EasyTrend Pro Indicator Review

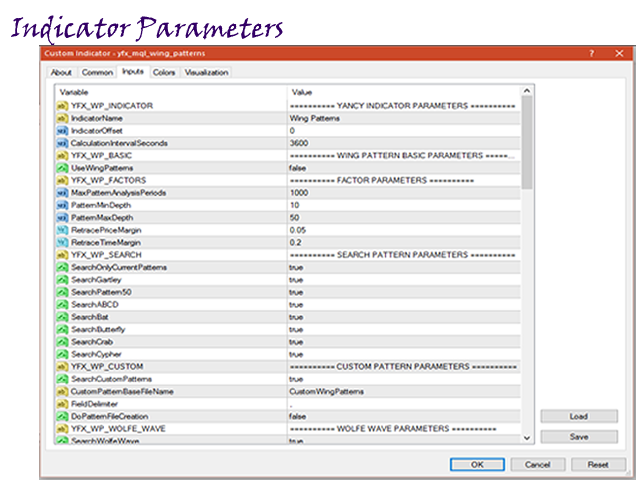
EasyTrend Pro is an indicator created by Denis Glaz in May 2019, although there have been subsequent updates. EasyTrend Pro is a trend indicator with everything you need for trading and is very easy to use. Probably everyone has come across indicators or Expert Advisors that contain numerous input parameters that are difficult to understand. But here, the input parameters are simple and you don’t need to configure anything, the neural network will do everything for you.

Previously the developer created the first version called Easytrend, the differences between the classic version and the Pro are:

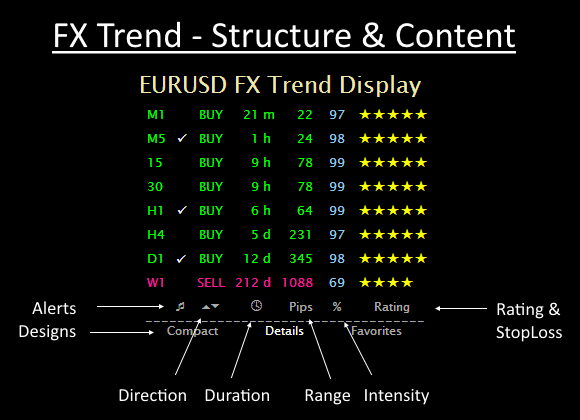
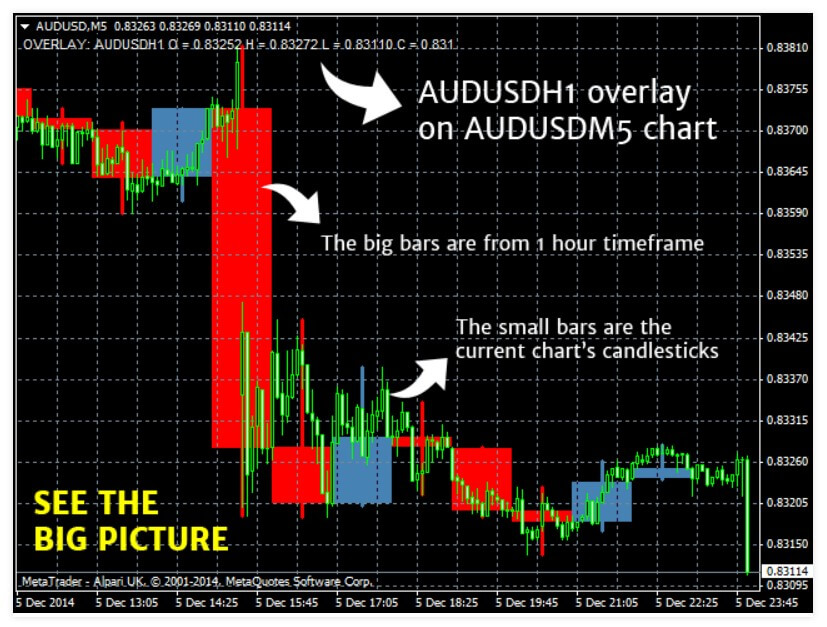
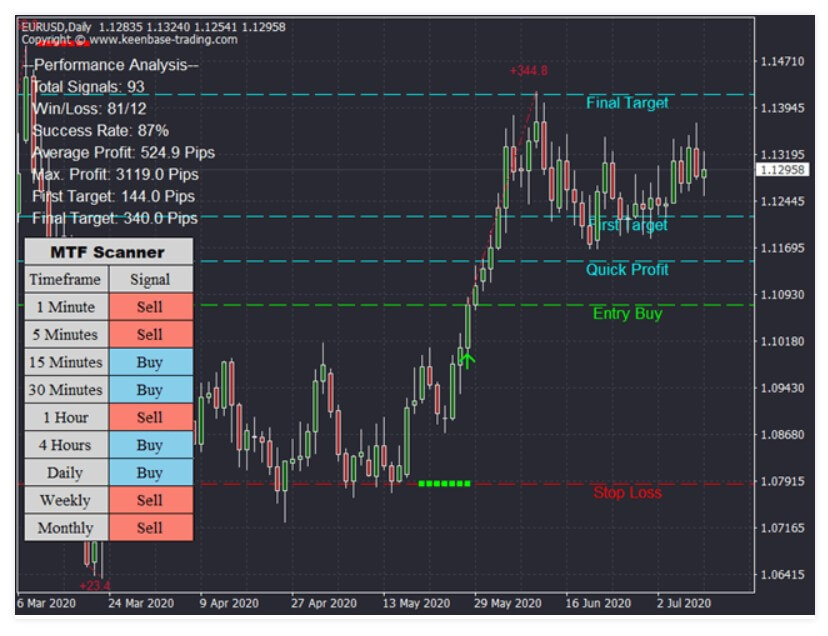
-The multiple-time frame panel is added, so you can check a trend for other time frames without changing the schedule. The panel size is regulated by tuning, and also adapts to the scaling down of the screen in Windows. The data in a renewal panel are in real-time.

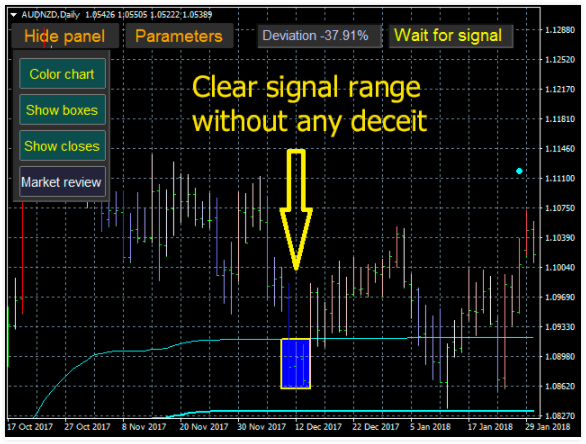
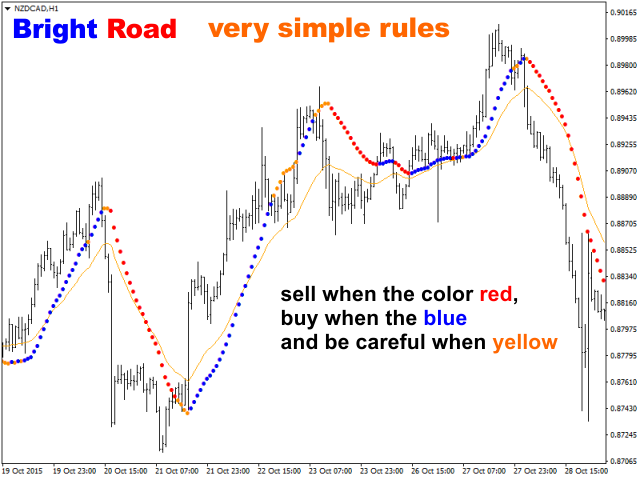
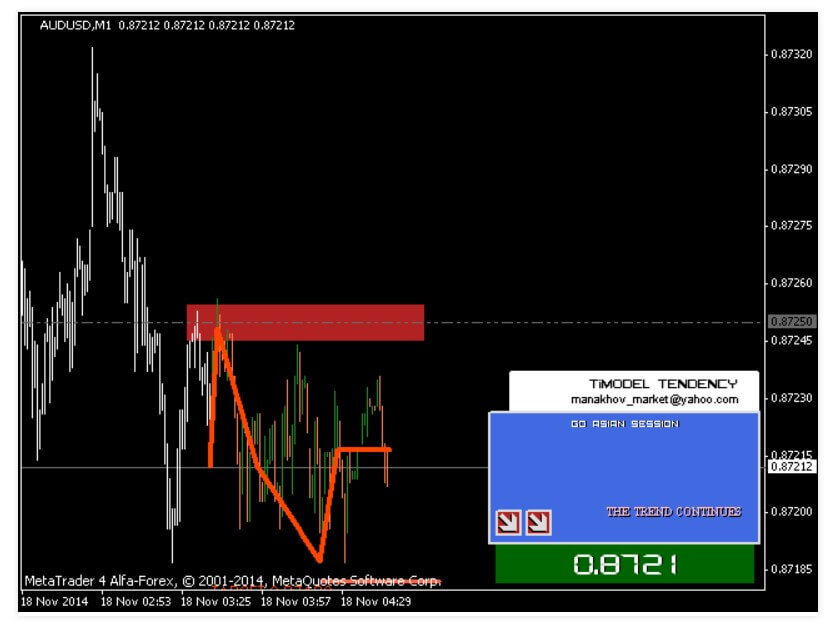
-The purchase-sale zone is added. It now receives purchase and sales signals. The zone adapts to the current volatility of the market.

-The neural network is improved. It works faster and qualitatively the changes are important and affect the entire system.

-The indicator can be used for binary options trading.

-Cryptocurrency support is added.

Features of Easytrend Pro

You don’t draw again.

Suitable for all types of trading, and can also be used in trading binary options.

Easy to configure and use.

Terminal, telephone, and mail notifications.

The buying and selling area is adapted to the current market volatility.

It works on all terms, but the sales and purchase area does not work on W1 and MN1.

Works with the MT4 Trading Platform

It automatically adjusts to all currency pairs, metals, cryptocurrencies, CFDs, and even oil.
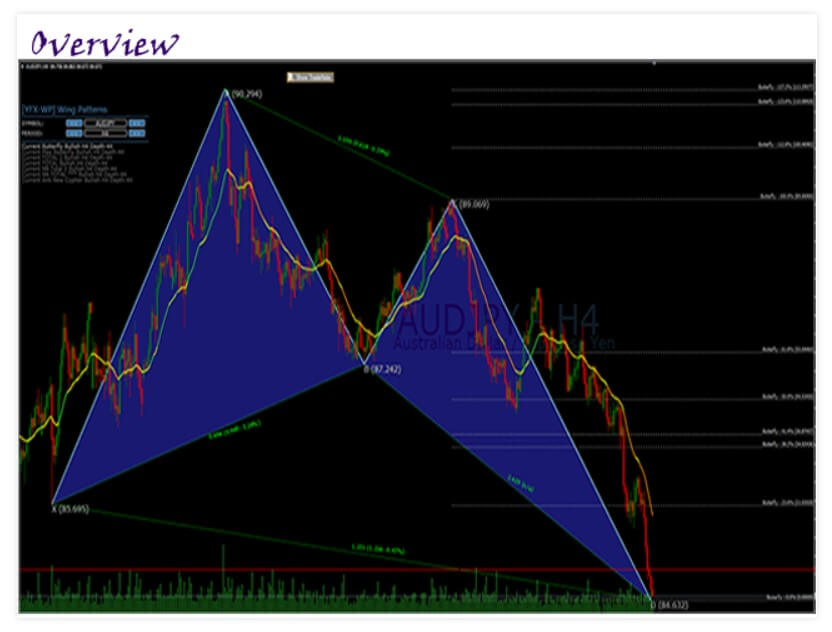
How It Works

Based on the current variation study and analysis of the price deviation from its average value over a given period and the statistical average of the absolute value of this parameter. The results of the analysis are adjusted by sensitivity coefficient and vertical changes, which in turn depend on the current bargaining instrument, time frame, and inclination angle of the trend channel. All parameters of internal variables, values, and automatic adaptation are managed by a neural network.

How to do the trade? It can be done in a classic or scalping way.

-Choose a time frame to trade, suppose M15. Expect a trend change notification.

-Then when you have to wait for a purchase or sale signal to appear. After receiving the signal, you must check the trend at the higher deadlines. When operating on M15, check M30, H1, and H4 – trends must match your signal.

-Open a trade. Set Stop Loss to the same distance from the opening price as the opening price is from the trend line.

-After the price crosses the trend line with confidence, set Stop Loss to the point of balance and gradually move it with the price. You can use the delay.

-You can close the transaction for loss of stop or by crossing the price with a mobile average.

Scalping

-The deadline is M5 or M1.

-You can start a trade either through a buy-sell signal or because there has been a change in trend. Use the final stop.

-Closing a deal by crossing a moving average or behind.

Conclusion

In short, we are talking about an indicator that although it has been in the market for a short time seems to work very well if we take into account the good reviews of its users. The indicator is available for sale on the MQL market at a price of 64 USD, and also has a demo version for free testing.

Categories
Forex Service Review

FX Trend Indicator Review

FX Trend is an application that can be found within the Indicators section of the MQL5 marketplace. The indicator was first uploaded by Daniel Stein on the 6th of May 2016, it has then received a number of updates, the most recent was on the 21st of February 2020 and this brought the indicator up to version 3.13.

Overview

FX Trend is an indicator created to be used with the MetaTrader 4 trading platform, the indicator will display various things such as trend direction, duration, intensity, and a trend rating for all time frames in real-time. This will allow you to quickly see which direction the trends are moving, how long they will last, and how strong they are.

There is a large list of features available from this indicator:

Analytical features:

Graphical features:

General features:

There are also a bunch of settings available that will allow you to change various aspects such as the trend period, deviation, whether to use the indicator in EA mode, to hide the panel, arrows, and other elements, there are also plenty of options for alerts.

Service Cost

The indicator will cost you $49 to purchase it outright, this will give you unlimited access to it. You are also able to rent it, you can rent it for 3 months which will cost you $29 or for 1 year which will cost you $39. There is also a free demo version available, but this will come with some limitations which are unfortunately not known to us.

Conclusion

There are 84 reviews, the overall rating from these reviews is 4.5 out of 5. The creator is offering a free support group for those that provide a review, so this could potentially influence some members to give higher scores, it is not a practice that we like to see.

FX Trend is the tool help me enter the trend on pull back, it really helps me to re-enter the trend if i missed out the ride. Great indicator !!! Thanks Daniel !!! This is a good tools to help traders find entries and trend, i would recommend those who are looking for trend entries. This will be the one.” – A 5-star review.

I have had this for just over two weeks now and it seems promising. I am still trying to understand how to use it properly. I have given it 4 stars because it it’s clear layout, ease of use and potential for profit making if you’ve properly with a good trading plan. I haven’t started making any profits with it yet but hope to make some profit if I get the hang of it.” – A 4-star revew.

just a parabolic sar with fancy snazziness. don’t waste your money, put a parabolic sar on your chart and just use that…” – A 1-star review.

So the majority of reviews are very positive and state that it is working well, even with all this positivity, we would recommend downloading and trying out the free version, this will give you a better understanding of how it works and it will also make sure that you are able to get it set up correctly.

Categories
Forex Service Review

Pro Scalping System Indicator Review

Pro Scalping System can be found within the indicators section of the MQL5 marketplace, it was uploaded by Vitaliy Kryukov on the 24th of June 2019, it has not had any updates so the indicator is still at version 1.0.

Overview

Pro Scalping System is an indicator that was designed for the MetaTrader 4 platform, its main purpose is to allow you to trade the markets during any kind of market conditions on all instruments and timeframes.

The main advantages of the indicator:

Doesn’t repaint closed candles.

Rough entry and exit rules.

Flexible setup of visualization releases from chart overloading.

The system has a dashboard enabling one to look after 28 pairs at time frames from M5 to D1.

You can change the main parameters of the system right from the chart.

The optimization of parameters of the trend determination by pressing the “Find Best Parameters” button.

The visualization of signals by rectangles provides the most accurate information about system efficiency previously. Rectangles clearly indicate the asset price range of signal life, unlike arrows which often point either at the Low or High point of the candle.

There are also a number of different parameters available, these include things like showing the signal boxes, the color of the bars, the bar count, scalping period, different alerts and notifications, colors, sizes, fonts, and more.

Service Cost

The indicator can be purchased with a one-off payment of $150, this will get you up to 10 activations of the software with no other limitations. If you would prefer, there is also the option not to rent it, this can be done on a monthly basis which will cost you $50 per month, or you can rent it for three months which will cost you $90 for the three months.

There is a free demo version available, the limitations are not stated on the site so there is a chance that it can only be used with the strategy tester within MT4.

Conclusion

Unfortunately, there aren’t any user reviews or ratings so it is hard to work out how people are finding it or if it is doing what it is meant to do. There is a comment section with few comments, the developer has replied to some but not the most recent one which is someone with some errors, not having a reply makes it seem that there is not any active support, due to this, we would suggest contacting the developer before purchasing or renting just to make sure that there will be some support should you need it.

Categories
Forex Service Review

Shepherd Harmonic Pattern Indicator Review

Shepherd Harmonic Pattern can be found within the indicators section of the MQL5 marketplace. Abdullah Alrai first uploaded the indicator to the MQL5 marketplace on the 26th of April 2016, it has had a number of updates, it was last updated on the 18th of August 2018 and is now at version 9.2 of the indicator.

Overview

Shepherd Harmonic Pattern is an indicator for the MetaTrader 4 trading platform, it was created to detect harmonic patterns which will then be drawn onto the charts via either a manual or automated method.

Some of the main features:

The indicator has a control panel with presets and it will save every (chart & time frame) setting.
The indicator is simply an interpretation of harmonic trading theory for detecting harmonic patterns on the chart. If you want to learn it you can search for Scott Carney’s book named “Harmonic Trading vol 1 & 2”
The indicator has price and time alert lines.
The indicator will draw Fibonacci fans on your detected patterns.
The indicator will draw Pivots/Camarilla/Patterns Ray.
You can load manually drawn objects from higher time frames into lower time frames.
Reset buttons will clear all saved settings (All/Current) timeframe.
The indicator has an alert/notification system that will provide you with targets/stop/entry points as a signal.
The indicator will detect divergence (yellow and orange arrows) and they serve as good confirmations.
The indicator will calculate the best lot size for every pattern as it is good for your balance with risk value as you insert in settings.
Indicator will also detect price action patterns (Pin Bar, InsideBar, OutSideBar).

A selection of parameters is also available for the indicator, these will alter some of the functions of the indicator. Some of the settings include the indicator theme, candle timers, color of bullish or bearish patterns, font colors, types of alerts, inside and outside bar sensors, historic bars, and more.

Service Cost

The indicator can be purchased for $100 this will give you full access with no limitations, many indicators on the MQL5 marketplace offer you the opportunity to rent them, but the Shepherd Harmonic Pattern indicator is not giving that option. There is a free demo version available, unfortunately, the details of the free version are not known, it is still worth downloading to check it out though.

Conclusion

There are over 40 different user reviews available and it has been given an overall rating of 4.5 out of 5.

Great Indicator, especially when you are patient and wait for the best entry on H1 or H4 seems to get better results. Developer Abdullah helped me out by connecting remotely and resolving my issue. Excellent service, Big thanks.” – A 5-star review.
unresponsive seller” – A 1-star review.
Good indi so far…we know where the candle wants to go..buy or sell..start profit but need to backtest n follow all the sop if u can for the best result..don’t put all your bullets after pattern showed..coz the pattern may be redrawn..put your bullets layer by layer n make sure manage your MM carefully..just my 2cent…” – A 5-star review.

The majority of the reviews are all very positive, there are a few negative ones in there too, both about the developer and the actual indicator. One of the reviews above mentions an unresponsive seller, but when we look at the comment section, we can see the developer replying to the majority of messages so the reviewer may have been an anomaly. We would suggest that you try out the free version, you should also send any queries to the developer to see if they respond and so you can be sure that the indicator will do what you need before you make a purchase.

Categories
Forex Service Review

Trade Copier Global Review

The Trade Copier Global is utility software for MetaTrader 4 that can be found on the MQL5 marketplace. The software was originally released on the 13th of January 2017, it has since been updated to version 7.0 and was last updated on the 28th of November 2019.

Overview

The Trade Copier Global is a utility designed to be used with MetaTrader 4, it aims to do what the title says, to copy trades from one account to another.

Its list of main features include:

Copying trades between MT4 terminals around the world with a short delay.
Automatically recognizes symbol prefixes.
Can connect many Slaves to the same Master.
Supports pending and market orders.
Supports partial order close (with limitations, see below)
Can send messages and notifications to the Slaves from the Master
Several lot calculation methods
The software will be constantly improved based on feedback
Does not affect the trades made by other EAs

There are also a number of settings and parameters that can be updated and changed to suit your requirements. You can select which account is a master or slave, choose what items are copied such as stop losses, take profits, buy orders, sell orders, lot multipliers, and more.

Service Cost

The Trade Copier Global can be purchased for $89, it can also be rented for three months by paying $25, you will need to pay this every three months unless you purchase the full version. There is also a free version available however we are not able to say what the limitations of this free version are.

Conclusion

There are ten written reviews available for this software, each one is giving it 5 stars so the overall score is five out of five.

Very good product, powerful and efficient. Autor is very reactive and listens to feedback to optimize and upgrading. Thank you very much.” – A 5-star review.
This is an excellent product. This EA can help you to copy trades between different trading accounts with different brokers running on different devices/computers. On top of this Laszlo is also providing a 5 start support. He replies to your queries quickly.” – A 5-star review.
However, there is one review that did not give a rating: “Do not buy it. There are limitations on the number of providers. He told me there are no limitations and is not the truth: there are only 10. I contacted the support for a refund and not approved. Poor support.

So there are some mixed feelings on the software, we would recommend checking out the free version just to make sure that it does have the features that you require prior to purchasing anything.

Categories
Forex Service Review

Run Intelligence Trend Indicator Review

Run Intelligence Trend can be located within the indicators section of the MQL5 marketplace, it was first uploaded on the 12th of July 2018 by Marco Solito, it has not had any further updates so the version of the indicator is still version 1.0.

Overview

Run Intelligence Trend is an indicator that was designed to be used with the MetaTrader 4 trading platform, its main purpose is to work with intraday trading and is based on moving averages and CPA. The indicator will look for trends and will then follow the trend and its trend retracements.

It is best used with a low spread ECN broker, you should only use the recommended pairs, but the site states that all pairs are recommended, it can also be used with any timeframe.

In terms of parameters, there are only two:

Apply Price: calculation applied to Open price, Close price, High price, Median price, etc.
Period: the time period for the indicator to calculate

Service Cost

Run Intelligence Trend is available to purchase for $39, purchasing it will get you up to 5 activations of the indicator, it can also be rented on a monthly basis, this will cost you $19 per month. A free demo version is also available, no details are available so it may only be sued with the strategy tester rather than a full-blown demo version.

Conclusion

The indicator currently has three user ratings which are giving it an overall rating of 5 out of 5.

It is a helpful tool, it like the Ichimoku” – A 5-star review.
Good Indicator, easy to use, thanks..” – A 5-star review.

While there aren’t many reviews, those that are there are very positive which is great to see. There are also a few comments, the creator has been replying to them quickly, unfortunately, there have not been any comments since 2018, due to this we would suggest contacting the developer with any questions that you may have in order to ensure that it is still being actively supported before you make a purchase.

Categories
Forex Service Review

Strong Vs. Weak Forex Indicator Review

Strong VS Weak is a piece of software that can be found within the Indicators section of the MQL5 marketplace. The indicator was first uploaded on the 11th of December 2015, there aren’t any updates mentioned on the site, the current version of the indicator is version 1.1, which was created and uploaded by Yossarian Escobedo.

Overview

Strong VS Weak is an indicator designed for the MetaTrader 4 trading platform, it has been designed to help measure the strength of the 8 major currencies (USD, EUR, GBP, JPY, CHF, AUD, NZD, and CAD). The indicator only needs to be placed on one chart and can simultaneously monitor the entire market. 

The main features of this indicator:

Easily monitor the strength of the 8 major currencies and all 28 pairs. USD, EUR, JPY, GBP, CHF, AUD, NZD, and CAD
Unlike most strength meters, this meter measures each currency against a weighted basket of its peers. 
You can select the precise time to begin calculating values. For Example The beginning of the New York trading session or after a news-event.
The indicator can trigger real-time crossovers alerts.
You have full control of the colors and currencies to be displayed.
The plotted graph allows you to analyze when crossovers occurred, as well as anticipate any potential extremes.
A full analysis of up/down percentage values, as well as head-to-head comparisons between currencies.

There are a number of different settings and parameters available to alter, these will help change the way the indicator works to better suit your needs. Some of these inputs include whether to have alerts on or off, the interval of the alerts, the colors of lines and arrows, sizes of the indicator, currency selection, line thickness and, more.

Service Cost

The Strong VS Weak indicator will currency cost $79 to purchase, this will give you unlimited access with no restrictions, if you do not wish to purchase it, then you are able to rent it, you can rent the indicator on a one-month basis which will cost you $59 per month you are also able to rent it on a three-month basis which will cost you $69 every three months. There is a free version available, this does have some limitations, the site does not indicate what the limitations are, however.

Conclusion

At the time of writing, there are 8 different reviews available, each one of the reviews giving the indicator and 5 out of 5 ratings.

Can’t say enough about the quality of this service. The tool provides an instant overview of all currency pairs and their relative strength to each other. Now I can see what is happening in the marketplace in real-time in terms of currency strength. A personal thanks to Mike for all your 5-star help.”
This indicator is fantastic, very good for any business and market analysis … With it you have a quick and accurate analysis on the buying and selling strength of each currency, being fundamental to any trading. I already took the opportunity to purchase other indicators from this seller. I recommend everyone for the great service and quality of products.
This is the best indicator I have ever used. Besides, the seller is awesome. You deserve 5 stars.

So all of the reviews are very positive which is a good sign, There are also a number of comments on the indicator page, Yossarian Escobedo the creator of the indicator is replying to each one in a prompt manner which is a good sign for the possible customer service that you will receive once you purchase or rent the indicator. We would suggest that you try out the free version prior to making a purchase, just to make sure that it suits your requirements and that you are able to get it functioning properly.

Categories
Forex Service Review

Price Action Diver Power Indicator Review

Price Action Diver Power is an indicator that was created in January 2019 by developer Igor Otkidach. Price action diver power is a multi-currency indicator that simultaneously evaluates the entire market basket (all currency pairs available).

Overview

To start the operation of this indicator, it is necessary to:

– Add all currency pairs available in the Market Watch tab.

– Before the first installation of the indicator, it is required to open all the dating tables of the “Market Watch” tab for your trading platform to automatically download all the historical quotes needed for the indicator to work.

– Pay attention to the name of the currency pairs in your trading terminal. Brokers often put a symbol – suffix to the currency pair name. For example – Eurusd X, where the “x” is the suffix.

If the currency pair name on your trading platform is different from the usual name, you must specify this suffix in the manual setting of the indicator.

  • For the auto-optimization of the indicator, it is necessary to:
  • Put the indicator in the quotation table.

For the variable “Automatic optimization algorithm”, select “True” and click “OK” to apply the indicator.

After applying the indicator with the automatic optimization parameter enabled, the optimization will have started. It’ll look like your trading platform is frozen. Don’t worry, it’s optimized. The average optimization time takes about 10-15 seconds. About 10-15 seconds after the indicator is optimized, a message will appear indicating that auto-optimization has been done and the statistics for the parameters already optimised will be seen in the scoreboard.

Many options can be tried to filter the optimization options. The best algorithm works by choosing the asset that has the most benefit amount and a benefit factor of at least 2.0. Therefore, the optimizer of this indicator goes through a lot of possible options (about 10,000 options) and you will have to choose the one that has the most amount of gain, and the gain factor of at least 2.0.

The prompt writes all optimization results to a special file and stores them in the “Files” section in the main directory of your trading platform. This is done with the aim of not carrying out a self-optimization constantly, but to use the parameters that were optimized before. This file will then be continuously updated (each time a planned auto-optimization takes place at a time of your choice).

Once you have already optimized the H1 time frame (or another different time frame) of a particular currency pair and currently want to optimize for H4 time frame (or another time frame), the number of the “Optimization ID” will have to be changed. This unique number helps the indicator filter out previously obtained results and does not allow the same optimization results in different timeframes.

It must be understood that the movement dynamics of the oscillating line of this indicator differ significantly in different time frames. By default, the indicator has optimization in time frame H1. But if you want to optimize the indicator for other time frames, it is better to use the set files to optimize different time frames.

The time of the planned optimization can be any you want. The default is Sunday at 11:30 (platform schedule). For the moment, the markets are closed and self-optimization will not prevent your trade. The planned optimization will be done every week at the time you specify it. The main thing is that at this time your platform was working.

Service Cost

If you are interested in this product anyway, you can find it for sale on the MQL market at a price of 98 USD. You can also rent it for 30 USD per month or try its demo version before deciding to buy it or rent it.

Conclusion

In short, we are talking about an indicator not suitable for beginner traders because of its complexity when it comes to configuration. It is very important to know well how to trade with the action of the price, and this way of trading needs a good time to master it and thus understand the functioning of this indicator. We have found numerous criticisms of this indicator in comments from its users, some positive, and some negative, so there is no clear consensus on its usefulness.

Categories
Uncategorised

Range Trader for Multi-Pair and Multi-Time Frame Indicator Review

Range Trader For Multi Pair And Multi Time Frame can be found within the indicators section of the MQL5 marketplace. The indicator was uploaded by Yossarian Escobedo on the 13th of January 2016, the indicator was uploaded as version 1.7 and it has not received any further updates since it was uploaded to the MQL5 marketplace.

Overview

Range Trader For Multi Pair And Multi Time Frame is an indicator that can be used with the MetaTrader 4 trading platform. The indicator was created to help automatically find high probability range trading opportunities. It will look for pairs that are not trending that have just come off a recent high or low, the indicator uses the RSI and ADX filters to find these opportunities.

Some of the main features of the indicator:

  • Has the power to monitor 28 pairs simultaneously.
  • Can monitor time frames from 1 Minute to 1 Month simultaneously.
  • Automatically triggers an alert when the appropriate pattern is identified.
  • Can monitor any symbol for any asset within the Metatrader platform. 
  • Includes two separate filters (RSI and ADX), which work to identify the best possible trade setups.

The indicator only needs to be placed on a single chart, it will then be able to monitor the entire market. Along with everything else, there are some parameters that can be altered to slightly change the way that indicator works, some of these include the RSI period, the RSI up and down levels, the ADX period, the ADX level, the symbols to use, and which time frames to use.

Service Cost

The indicator will currently cost you $79 to purchase it outright and this will give you unlimited access and no limitations. You are also able to rent the indicator, this can be done on a one-month period which will cost you $59, you can also rent it for three months which will cost you $69 for that time.

There is a free demo version available, the site does not state what the limitations of the free account are, but it is worth downloading just to test it out, regardless of any limitations.

Conclusion

At the time of writing, there are 31 different user reviews giving the indicator an overall rating of 5 out of 5.

The indicator looks good, early days but if it’s anything like the great customer service Mike provided I’m sure it will be a winner. Mike sent me some really valuable information about how real traders operate which I’m sure will be valuable for me in the future. This approach makes me believe these guys are the real deal.” – A 5-star review.
One of my favorite indicators. Mike was great and helped me set up the indicator for optimal usage and time frame. He also gave some guidance as to the best way to trade. I was so impressed I now own 5 of their indicators.” – A 5-star review.
I’ve been trading for over 10 years now without good results, but with this scanner, I’ve finally started making some money. I love Range Trading thanks to the “Range Trader For Multi Pair And Multi Time Frame” Many thanks to the professional team, and not least thanks for the outstanding customer service.” – A 5-star review.

So the reviews are all very positive which is a good sign, there are also a number of different comments, the developer has been replying to each one in a prompt manner which shows that the developer is actively supporting the product and the customers who use it. We would suggest downloading and trying out the free version, also contacting the developer will help you ensure that the indicator is the right one for you.

Categories
Forex Service Review

NRP Harmonic Patterns MA Fractals Indicator Review

NRP Harmonic Patterns MA Fractals Based can be located on the MQL5 marketplace, it was created and uploaded by Sergey Efimenko on the 8th of June 2019, it has had a couple of updates, the most recent of which was on the 7th of March 2020 and it is currently at version 1.4.

Overview

NRP Harmonic Patterns MA Fractals Based is an indicator that can be used with the MetaTrader 4 platform. It is an indicator that was designed to display harmonic patterns on the graphs without redrawing and with a low delay. 

The indicator is able to recognize ABCD, Gartley (Butterfly, Crab, Bat), 3Drives, 5-0, Batman, SHS, One2One, Camel, Triangles, WXY, Fibo, Vibrations patterns.

The main parameters that come with the indicator include the number of bars to analyze, to show up or down arrows, to enable alerts and alert types, used price, using high or low bar values, to limit points on patterns, and more.

Service Cost

The NRP Harmonic Patterns MA Fractals Based can be purchased outright for $50, this comes with up to 5 activations and no other limitations. If you would prefer to rent the indicator, you can do this for a period of six months, it will cost you $25 for that six-month period.

A free demo version is also available, the details are not shown on the site which often means that it can only be used with the strategy tester within the MT4 platform.

Conclusion

There are no reviews, ratings, or comments for the NRP Harmonic Patterns MA Fractals Based indicator. This means that we do not know whether people are finding that it does what it is meant to do or if it is useful at all. Due to the lack of feedback, we would strongly suggest that you contact the developer, you can use that opportunity to ensure that the indicator will do what you need it to do, it is also a way to make sure that the developer is still around and offering support for the indicator.

Categories
Forex Service Review

Pivot Prof MT4 Advanced Support & Resistance Indicator Review

Pivot Prof MT4 can be located on the MQL5 marketplace under the indicators section. It was first uploaded on the 15th of January 2014 by its creator Paul Anscombe, it has received many different updates, the most recent update was on the 28th of November 2019 and it is currently at version 13.3.

Overview

Pivot Prof MT4 is an indicator that was designed to be used with the MetaTrader 4 trading platform. The indicator can work with all asset types including currency pairs, indices, commodities, shares, CFDs, and more.

There are plenty of features available including:

  • Choice of five different popular pivot formulas (Standard, Fibonacci, Camarilla, Woody’s, and DeMark).
  • Hourly, Daily, Weekly, Monthly, Quarterly, and Custom Pivots, as well as Support & Resistance levels.
  • Mid-Pivot levels included.
  • Previous high/low and current open levels shown.
  • Custom starting hours to allow for tuning into the levels to the market.
  • Customize the way Sunday rates are calculated.
  • Select any or all time-frames to be displayed simultaneously.
  • AutoHide feature works to keep your charts organized by hiding levels that are irrelevant to the chart time-frame.
  • Customize the line styles, colors, fonts, and visibility.

There are some additional parameters that come with the indicator, these can be viewed within the manual that comes with a purchase or rental of the indicator.

Service Cost

The indicator will cost you $59 to purchase it outright, there is also an option to rent it on a monthly basis which will cost you $19 per month. Both ways of purchasing the indicator will give you up to 5 activations of it. There is a free demo version that can be used with the strategy tester within the MetaTrader 4 platform.

Conclusion

There are 16 user reviews, they all seem very positive and have given the indicator an overall rating of 5 out of 5.

“10 March 2016 The Windows upgrade needed PivtProf to be reinstalled. This is really no big deal normally. However, instructions on reinstalling PivotProf are not easy to get. “Help” does not respond !! (Very useful indicator indeed)” – A 4-star review.
“Best indicator ever doesn’t matter what strategy you have it works and fits with all methods which will save time” – A 5-star review.
“Excellent, very helpful tool, Thank you” – A 5-star review.

The reviews are all very positive, there are also over 150 comments, the developer has been very active in replying to questions and queries, the last comment was from December 2019 so it has been a few months, we would suggest sending your queries to the creator in order to ensure that it is still being actively supported before you make a purchase or a rental.

Categories
Forex Service Review

Strongest Level Global Indicator Review

The Strongest Level Global is an indicator for MetaTrader 4 that can be found on the MQL5 marketplace. This Forex indicator was originally released on the 16th of June 2014, it has been updated a few times, the most recent update was back on the 24th of October 2014 and is currently at version 1.23.

Overview

The Strongest Levels Global is an indicator that can be used with the MetaTrader 4 trading platform, it works by automatically plotting a system of the nearest levels of strong resistance and support on a separate window based on the users’ choice.

The indicator is compatible with any broker, it doesn’t matter on the instrument name or symbols, the main indicator requires manual execution of trades and it will not do them automatically, however, automated trades can be made if the indicator is combined with an expert advisor that can do this.

There are a number of parameters that can be altered such as the color of lines, graphs, and more. You can also change the calculation method to better suit your individual strategy.

Service Cost

This utility can be purchased for $12.50. There is no way to rent the software so purchasing it outright is the only option available. There is also a free demo version available, the page does not indicate what the limitations of this free version are, but we know what there will be some.

Conclusion

There are unfortunately no reviews available on this bit of software so we do not know whether its users are finding it helpful or if it is, in fact, doing what it is meant to. There are however a few comments about the software from potential clients and the creator has responded to them quickly which is positive.

As always we would suggest downloading and trying out the free version, this will give you an indication as to how the software works and it also allows you to make sure that you are able to get it set up correctly before making a purchase.

Categories
Forex Service Review

TMA Currency Meter FX Indicator Review

TMA Currency Meter is located within the Indicators section of the MQL5 marketplace. Paul Geirnaerdt first uploaded the TMA Currency Meter indicator on the 24th of November 2014, and it was last updated on the 22nd of July 2019. The current version of the indicator is version 2.2.

Overview

TMA Currency Meter is an indicator for the MetaTrader 4 trading platform, the indicator is based on the triangular moving average of the available symbols, it will show you which currency is strong, strengthening, weak, or weakening. 

It is a multi-timeframe indicator and works well to show currency strength on higher timeframes. When attached to a single chart it will give buy and sell signals based on the moving averages. 

The main usage for the indicator include:

  • Find strong and weak currencies
  • Find signals for symbols with strong moving currencies
  • Find signals for the TMA Slope of all symbols
  • Use any timeframe
  • Use any higher timeframe than the chart timeframe
  • Show buy and sell signals
  • Show up and downtrends
  • Show currency crosses
  • Show strong, weak, or normal crosses

The indicator also comes with some settings, these settings allow you to alter the way it functions, some of them include whether to use major symbols from the market watch, which symbols to use, to show the chart for certain symbols only, which timeframe to use, to show CSS values, difference thresholds, signal zone bandwidth, alerts, currency names, colors, and more.

Service Cost

The indicator will currently cost you $69 to purchase it with no limitations attached, you are also able to rent it for a six-month period, this will cost you $9 for the six months. There is a free demo version available, this will come with some limitations but there is no indication on the site as to what the limitations would be, it is still worth downloading to try out though.

Conclusion

The current rating for the TMA Currency Meter is 4 out of 5, this is the average given by the six available user reviews.

I give the indicator a 3 to 4. But I messaged the developer with a question about the indicator and depending on the answer if he could make what would seem like a small minor change or improvement and NO answer at all not even a no I cant or wont do that. Not even an answer to my question, maybe it was my fault and I was doing something wrong, then tell me and let me know. So ZERO stars on customer support !” – A 3-star review.

I attached indicator on chart and it was instantly removed. Tried to contact author twice but no response. I think mql5 should protect us buyers from this. Paid 30$ for something I cant even use. Stay away” – A 1-star review.

It’s one of the best currency meter I have ever seen, and of-course it deserves 5 stars” – A 5-star review.

The majority of the reviews are positive but there are some negative ones in there, they mention not having any support from the developer which is concerning, looking at the comments section, the creator is replying to comments, so we do not know why these reviewers did not receive any support. Due to the negative reviews, we would strongly suggest that you download and try the free demo version before making a purchase, this way you can make sure that it will work for you and suits your needs.

Categories
Forex Service Review

Market Reverse Signal Technical Indicator Review

Market Reverse Signal is an indicator created in March 2018 by developer Evgeny Belyaev. Evgeny Belyaev tells us that this arrow indicator, called Market Reverse Signal, generates input signals in the direction of the trend, without drawing again. Its operating algorithm is based on an original proprietary method that combines multiple tools for technical analysis of the market.

Overview

This technical Forex indicator makes it possible to find potential trend reversal points (when the trend changes direction) and to receive market entry signals when the trend is beginning to form.

The main advantages of this indicator are:

  • Suitable for both scalping and intraday trading.
  • It eliminates the need to draw again.
  • Works in all time frames, ranging from M1 to D1.
  • User-friendly functionality.
  • The indicator has an integrated alert with the possibility of sending messages to the email and the smartphone when a new signal appears.

Market Reverse Signal Usage Recommendations:

Buy sign: Buy when the indicator arrow is directed upwards.

Sell sign: Sell when the indicator arrow is headed downward.

Recommended trading symbols include GBP/USD, AUD/USD, USD/JPY,USD/CHF, EUR/JPY,  and EUR/USD. It can also be used in indices and stocks but has shown better Forex efficiency. The indicator has been shown to be more cost-effective when used in time frames from M5 to H4.

The main parameters of this indicator are:

Period: this will be the primary parameter and is responsible for the period of calculation of the indicator.

Alert: Enable/disable alert. If true – enabled, If false – disabled.

Email: Enable/disable sending emails. If true – enabled, false – disabled.

Push: enables/disables sending messages to the mobile terminal. If true – enabled, false – disabled.

Service Cost

This indicator is available for sale on the MQL market at a price of 34 USD. It is not possible to rent it due to its adjusted price, but the demo version is available for you to test and evaluate if it is useful to your trading style.

Conclusion

Perhaps the main feature of this indicator is that it is extremely simple to use and to understand, therefore it is suitable for all types of traders. Beginner traders will feel very comfortable with this indicator.

As we have commented in other reviews, if you already have a trend indicator, it is advisable to complement it with another different indicator, in order to optimize the input signals and try to make the inputs to the market as successful as possible.

We have not found user ratings about this indicator, we have only been able to observe a series of screenshots that the developer facilitates to visualize in various scenarios how the indicator behaves and in which points he launches the signals of purchase and sale, And the gauge really does it very well.

Categories
Forex Service Review

Megatrend Assistant Indicator Review

Megatrend Assistant is a state-of-the-art indicator, incorporating the experience gained over several years of using the popular Megatrend Monitor SF286. So we can say that this is an improved version of this indicator.

Overview

Megatrend Assistant is a very powerful tool that will be useful for both professional traders and beginner traders in trading. With the Megatrend Assistant indicator you will be able to replace dozens of screens, and “scan” the dynamics of market behavior and the statistics of twenty-eight instruments in six different time frames into a single graph. This makes the task much easier for users.

In addition to the main known features of the Megatrend, Megatrend Assistant allows you to:

  • Change the number of bars in the fractals used in the calculations.
  • Work both on a full bar and using the current price.
  • Control current propagation on all specified instruments in real-time.
  • Move the area boundaries with the mouse.
  • The indicator shows you the areas of consolidation, upward (downward) trend, and investment in different colors, for better recognition.

By simply clicking the mouse button with the name of the desired instrument, you can open yours with the default template in the configuration. By sliding the area boundaries with the mouse, you have the possibility to choose the best levels to open and close the signals, as well as choose the most suitable instruments for trading in your preferred strategies. Custom templates will help you find the best opportunities to get in and out during trading.

For the correct operation of this indicator, and to obtain the best results of it, Megatrend Assistant must be configured in a graph with an M1 time frame.

Megatrend Assistant is a very advisable tool for market analysis, to look for the most active and correlated currency pairs, symbols that are currently the best allies and rivals, as well as to choose a decision for opening and closing positions.

https://youtu.be/xo7Gu6F58m8

The Main Parameters of this Indicator

  • Working symbol – list of symbols
  • TF 1 – TF 6 – directory of time limits
  • The bars count for the calculation – sets the number of bars for the calculations
  • Reversal risk color – color of the signal on the investment risk
  • Linewidth Inside Flat – line width within the consolidation area
  • Linewidth Outside Flat – line thickness after exiting a consolidation area
  • Colour of the investment risk area – the color of the investment area
  • Timer period – timer period in seconds
  • Click open tf – open chart time frame

Service Cost

The price of this indicator is 59 USD, and you can find it in the MQL market in the indicators section. A free demo version is also available for those who wish to test the Megatrend Assistant prior to making a full purchase. 

Conclusion

This indicator was created in March 2017, and since then has accumulated a lot of positive reviews from its users, so we can confirm that it is an excellent instrument to consider. We are talking about a very complete indicator with multiple configurations and customization options. More suitable for experienced traders, although a previous study is also suitable for beginner traders, who are advised to use the free demo version beforehand to become familiar with the indicator.


Categories
Forex Service Review

PipFinite Reversal Pro Indicator Review

The investment of buying the Pipfinite Pro indicator can be a perfect choice, given the positive reviews this tool has. We are talking about a 5-step system that many professional traders use to improve their operation. Pipfinite Reversal Pro combines very effectively the price action, the ideal location, and reliable statistics of an intelligent algorithm. Understanding the market from this perspective allows this indicator to recognize the best trades available in the market.

Overview

The 5 steps of Pipfinite Reversal Pro include:

Step 1: Trade Configuration – The success rate in statistics is at least 60% (success rate of statistics 60%).

Step 2: Check the support and resistance levels.

  • The sign to buy: The price is not close to the resistance (Blue Line).
  • The sign to sell: The price is not close to support (Red Line).

Step 3: Set Stop Loss. It is recommended to use the stop loss calculated by the indicator.

Step 4: Take Profit Set

  • Option 1: Take advantage of TP1.
  • Option 2: Make partial profits on TP1 and close the remaining position on TP2.
  • Option 3: Take advantage of support or resistance levels.
  • Signal to buy: Take advantage of the resistance (Blue Line).
  • Signal to sell: Take advantage of the support (Red Line).

Step 5: An exit strategy. If SL or TP levels are not reached, the trading output will be in a new signal.

Advantages & Perks
  • It professionalizes your trade.
  • It signals entry, exit strategy, stops losses, and takes profit levels.
  • Reliable statistics according to the above criteria.
  • He never repaints, never paints, never recalculates.
  • Signs strictly on the “Bar Lock”.
  • Works on all financial assets and time frames.
  • Integrated pop-up, email, push notification, and sound alerts.
  • Fully compatible with the development of other Expert Advisors (EA).
Indicator Statistics Calculation
  • Win Condition.
  • TP1 Hit – when a signal reaches at least TP1.
  • EXIT Win – when a trade closes in a new signal and resulted in a positive benefit.
  • Condition of the loss.
  • SL Hit – The point when a signal reaches Stop Loss.
  • Exit Losses – When a trade is closed in a new signal and results in negative profit.
  • Success rate.
  • Percentage of signals that qualify for the status of winners.
  • It is used as a reference to find better pairs and deadlines.
Indicator Parameters
  • Signal period – the number of bars used to calculate the signal.
  • Zone Period, the number of bars used to calculate the dynamic S&R levels.
  • Zone Deviation, the factor used to determine the distance of S&R levels.
  • Stop Loss Selection – the stop loss strategy applies automatically.
  • Take Profit Factor – the multiplier used to calculate the gain levels.
  • Maximum history – the maximum number of bars.
  • Display Parameters – controls the visibility of objects drawn on the graph.
  • Graphical parameters – controls the appearance and colors of objects drawn.
  • Dashboard Parameters – controls visibility and colors of the stats found in the chart.
  • Warning Parameters – controls the alert options activated.

Service Cost

You can purchase this indicator for 98 USD, rent it for a period of one month for 58 USD and try it for free in its demo version.

Conclusion

In short, we are talking about a very appreciated indicator in the market of indicators offered by MQL. Created in 2018, it has a multitude of positive user reviews, making it appear an indicator that gives positive returns to its buyers. 

Categories
Forex Service Review

On Balance Volume Surrogate Indicator Review

On Balance Volume Surrogate is an indicator created in March 2015 by developer Stanislav Korotky. This indicator is an edition of the ‘On-Balance Volume’ indicator that is based upon pseudo-real emulated volumes of tick volumes. It calculates an estimate close to the actual distribution of the trading volumes of Forex instruments (where only tick volumes are available) and then applies the conventional OBV formula to them.

Overview

The volumes are calculated by the same algorithm that is used in the True surrogate volume indicator. The indicator itself is not necessary but can be used as a reference. The main parameters of On Balance Volume Surrogate are as follows:

  • Ma fast – mean rapid movement period (EMA), default – 3; if set to 0, the mean is not calculated
  • Ma slow – mean slow movement period (EMA), default – 7; if set to 0, the mean is not calculated

Alert on Macross – alert switch for a crossover of moving stockings, by default – false (alert is disabled); alert is signaled only once per bar; alert message format: “Obvsurrogate [Symbol] [Timeframe] UP/DOWN cross @ [Time]”

Completed bars – an option that controls how the crossover of moving stockings is marked: in the last bar or in the previous bar (Completed bars is true); by default – true, so alerts can be generated at the opening of the bar only; note, that a signal on the downhill turn is not necessarily followed by a signal on the upturn (or vice versa) – in some cases when the moving averages fluctuate near the other, you can get several successive signals (in different bars) in the same direction you should consider this as a signal confirmation.

Visualization

The indicator shows 3 lines:

  • Green thickness – cumulative volumes according to the OBV formula
  • Thin red – fast-moving medium
  • Thin yellow – slow-moving medium

Trading with On Balance Volume Surrogate

The indicator should be used for trade in the same way as conventional OBV is used:

-By means of passing signals of moving averages;

-Divergence/convergence between OBV and price; if their directions contradict – a reversal is expected (the current trend is about to change);

-The constant movement of OBV and price; confirms the current trend.

Service Cost

The On Balance Volume Surrogate indicator is for sale on the MQL market at a price of 12.50 USD, a very affordable price if we really find the indicator useful. Even with the low purchase price, a free demo is available for testing purposes. 

Conclusion

In summary, we are talking about an indicator based on the volume but with the addition of 2 moving average that will also give signals of purchase or sale, in short, a trend indicator that is helped by the values of the volume for the input decisions.

Apparently, from the comments of some users, it is in M15 the time frame that gives the best results to this indicator. It is a simple indicator to use and understand, making it suitable for beginner traders.

The few valuations we have found are positive, so it seems that this indicator can be of help for our trading. Anyway, the best way to find out is to download the demo version to test the indicator and see if it fits our trading style.


Categories
Forex Service Review

PipFinite Trend PRO Trend Trading Indicator Review

Today we will review the PipFinite Trend PRO Forex indicator, which was released on January 15, 2018. This tool was created to help traders identify market trends. In the design of the software, much interest has been given to trying to eliminate noise from the marketplace, while indicating precise signals of inputs and outputs. Improved rules, including statistical calculations, have also been included.

Overview

The developer of this software is Karlo Wilson Vendiola, who is located in the Philippines, and currently has 20 products available on the MQL5 market. The developer himself offers the support service through email or through his Facebook page.

Obviously, the distinctive strategy of Pipfinite Trend PRO is not revealed to the public. The developer has commented on some examples but doesn’t really provide much detail. Regardless of the commercial strategy, the use of the indicator is said to be very simple. In just three steps, traders can already receive signals, establish stop loss and profit-taking. After that, you can only wait for the system to do its job. The system will send you signals with an estimated success rate if the percentage is more than 65% the entry is recommended, while if it is less than that percentage, the trade will not be performed.

The developer wants the user to know that the software comes with a trend detection system based on images and statistics calculation. Signals are provided through pop-ups, email, and sound alerts within MT4.

Breakdown:

  • Type: Forex Forex Indicator
  • Price: 98 USD
  • Strategy: Trend, Support, and resistance.
  • Time Frames: All Time frames
  • Pair list: All Pairs

Certainly, the price of 98 USD is an affordable price, considering how the market is in this type of Indicators. The software is ready to work correctly with all pairs and all time frames. But it is undoubtedly appreciated that developers focus on a system that works well on a few currency pairs and on a specific time frame. This will prevent the user from having to do a lot of tests to determine in which currencies and in which time frames a system works best.

As this is a Forex indicator, the software does not have any real business results. On the developer’s website, there is a video and a few examples of commercial results that cannot be checked because they are not verified.

The truth is that the market for Forex indicators rarely offers verifiable business results. It would really be a lot easier for the user if the creators of Indicators connected their accounts to Myfxbook to verify their findings in a reliable way. Because if the system really is a winner and can be demonstrated reliably, everything will also go much better for the developer and increase their sales.

Service Cost

As mentioned above, the PipFinite Trend PRO indicator can be purchased for $98 USD. There are additional options, however, such as the ability to rent the indicator for a period of one month for the price of $58 USD. A free demo is also on offer.

Conclusion

The reality is that, overall, customer feedback is very positive, and there are almost 1,000 comments. In most cases, users highlight the excellent functioning of the indicator in trends, where it appears to work well and produce good economic results.

We would like to know more about the strategy, but, logically, the developer does not want to give too much detail in this regard. It would be very positive if there were a really verified account on the developer’s website so that we can rely 100% on this product. For the rest, it seems that we are dealing with an indicator that has great potential and which we should include in our list in order to take it into account.

Categories
Forex Service Review

PZ ABCD Retracement Indicator Review

PZ ABCD Retracement is a technical indicator created in 2014 by Arturo López Pérez. Arturo López Pérez is a private investor and speculator, software engineer, and founder of Point Zero Trading Solutions. In this review, we’ll take a look at how this indicator works, as well as how effective it actually is. 

Overview

The PZ ABCD Retracement indicator finds in the markets AB=CD patterns. The pattern AB=CD Retracement is a 4-point price structure in which the initial price segment is partially retracted and followed by a movement equidistant from the end of the pullback. This behavior of the assets in the markets is the basic basis for all harmonic patterns.

The main features of this indicator are:

  • The sizes of the patterns are customizable.
  • AC and BD relationships are customizable.
  • Break-up periods are customizable.
  • Lines, colors, and sizes are also customizable.
  • Displays Stop Loss and Take Profit levels based on CD fiber levels
  • Visual alerts / sound / push / mail for patterns and breaks.

AB=CD Retracements can be expanded and repainted quite a bit. To make things easier this indicator implements a twist: expect a donchian bud in the right direction before signaling a trade. The end result is a repainting indicator with a reasonably reliable trading signal. The Donchian rupture period is introduced as an input.

Bullish setbacks are marked in blue.
Bearish recoveries are marked in red.

Note that price patterns like AB=CD can be expanded and the indicator must be repainted to follow the pattern expansion. If we observe that the pattern repaints more than the ratios AC / BD / AB = CD that have been entered in the parameters, the pattern disappears as it will no longer be valid. To negotiate these patterns, we must resort to the sign of Donchian rupture.

The input parameters are:

  • Amplitude: Size of patterns AB=CD to be found.
  • Rupture period: Donchian period of rupture at time signals.
  • Max History Bars: Number of bars to look back on when the gauge loads.
  • Min AC: Minimum standard AC ratio.
  • Max AC: Maximum pattern AC ratio.
  • AB = CD: Enable or disable condition AB = CD
  • Display options: Displays or hides SL/TP tags, ratios, and levels.
  • Patterns: Select sizes and colors for the lines that form the pattern.
  • Tags: Select colors and sizes from labels A, B, C, D
  • Ratios and SL: Select colors and font size for SL/TP ratios and labels.
  • Outbreak alert: Allows you to receive alerts when a pattern is found
  • Pattern Alert: Allows you to receive alerts when a break occurs and arrows appear

The indicator evaluates each bar, not each tick. The last point of the pattern is repainted as the pattern expands. You can have several indicators on the graph with different amplitudes. An alert is displayed when the pattern is formed and also when the break occurs. A small percentage of trading signals can be repainted. It can increase the breakout period.

Service Cost

PZ ABCD Retracement is available on the MQL market at a price of 49 USD for purchase. It has a demo version so you can try it out and get to know it, so you can make an evaluation before buying it.

Conclusion

We are talking about an indicator that has been on the market for more than 6 years. User ratings are uneven, with positive and negative ratings. We think that this indicator can be a good option for its combination with other indicators, to complement and have more trading signals, but not for solo use. 


Categories
Forex Service Review

Advanced Accumulated Currency Volume Indicator Review

The Advanced Accumulated Currency Volume indicator was launched in March 2017 and is continuously updated. It is an affordable Forex trading tool that has incorporated a number of its own features along with new formulas. In the following review, you will learn more about this indicator and can decide if it may be helpful to you. 

Overview

The Advanced Accumulated Currency Volume Indicator is especially suitable for trading with the 28 major Forex currency pairs and works in all time frames. It is a new formula that in a single graph, extracts the entire foreign exchange volume (C-Volume) of the currencies AUD, CAD, CHF, EUR, GBP, JPY, NZD, and USD. This means a significant advantage in trading. Volume traders know how to use it. If you are a beginner trader, it is convenient that you learn to read the extreme values and add them to your trading routine.

This indicator thinks of C-Volume as a shield, not as a weapon. A warning signal will be displayed on the main graph warning not to go into wrong operations.

This is not the simple volume of a pair. The Forex market is scanned and the volume for each currency is extracted and accumulated to C-Volume. Now we can visualize which currencies have the highest or lowest volume. We can see in a single graph what is happening within the 28 pairs of Forex. If the Euro, for example, has a sharp point, check the EUR pairs for possible operations. If USD has a strong point, then check the USD pairs.

The indicator has been built on new underlying algorithms makes it even easier to identify potential tipping points. This is because it graphically shows peaks of volume C in a coin. These features were designed to help the trader and keep him out of bad trades, while the gauge guides him into pullbacks.

How to Read Volume C

Valuable is C-Volume for the base and the quoted currency of the pair. C-Volume is not a delayed indicator. It gives an instant warning signal and peaks out of range should not be ignored. It is not advisable to negotiate with an extremely high volume C outside the range band. The gauge will keep you out of the bad trades, and look for the pullback.

Do not negotiate with an extremely low volume C outside the range band. Most likely operations: Enter the increase of volume C within the range band. Avoid actions in the drop of volume C. In contrast to the standard volume, this indicator has a unique formula, and C-Volume can be used on a live candle. As long as the sail is open, it will give an approximate value in percentage.

Parameters of the Indicator

Adjustments:

-Baseline width and quotation (make the C-Table volumes thicker)

-Line width other 6 (other volumes C that is not part of the chart)

-Type of line point if width=1 (use the dotted line for the other 6 above), show only the base and the volume of budget (show only the base and the budget line C-Volumes)

-Line width (top and bottom width or range)

-Minimum volume (%-Lower range line level)

-Maximum volume (%-Top range line level)

-Range period (bar period or range lines)

Font size (The size of C-Volumes names) show bars again (how many candles again the indicator prints the currency lines)

Setting up of alerts:

-High Volume C Alert (above top range line)

-Popup Alerts, send alerts by email and send push alerts.

Service Cost

This indicator is only available for rent, and its price is 44 USD for 3 months of use or 58 USD for one year, so it is more advantageous to rent it for one year. It is available in the MQL market indicator store. You also have a free demo version available if you want to use it before you invest your money.

Conclusion

In short, we are talking about a rather valuable indicator, because trading knowing the volume is an advantage over the rest of traders who do not know this fact. There are many comments about this indicator, and most are positive, users are happy with using this tool.

Categories
Forex Service Review

YFX Wing Patterns Indicator Review

The Wing Patterns indicator will look for many different pattern types using a structure called XABCD. When we speak of “Wing Pattern” we use this term to refer to all kinds of patterns based on a general XABCD structure, which is drawn in an extreme high-low alternative form.

In other words, let’s assume that point X starts at a low point in the table. Point A is drawn at the next highest score within a certain number of bars. This specific number of bars is called the depth level. Point B would be drawn at the next lowest point for a particular depth. Following the flow, point C is the next high, and point D is the next low. If we connect these points in a graph, it usually looks like the wings of a butterfly, that’s why we call it “Wing Pattern”.

The harmonious wing pattern strategy will teach you how to negotiate such a pattern and start making money with an exciting new approach to technical analysis. The market strategy of the wing pattern is part of the harmonic pattern trading system. You need to read introductory articles on harmonic patterns as this will give you a better understanding of how to negotiate the wing pattern.

The wing pattern is similar to the Cypher harmonic pattern but follows different Fibonacci relationships. One of the most accurate ways to differentiate a wing structure from a cypher pattern is the B point, which, if it does not go beyond 50% Fibonacci leg XA recoil, then is a wing. Otherwise, it can become a Cypher structure, which is a different indicator.

The market strategy of the wing pattern is suitable for all time frames and for all markets, but we have to take into account that in the lower time frames if we use the wing pattern strategy, we will see how the market comes with its own challenges because the wing pattern has the tendency to appear less frequently in the lower time frames.

Before we dive deeper into the harmonic wing pattern strategy, let’s see what indicators we need to negotiate this strategy successfully. The setback and relations of Fibonacci are at the center of harmonious trade. Thanks to the rapid progress in the field of technical analysis we can find some very useful indicators to really help us plot the harmonic patterns and these Fibonacci ratios.

You can find the harmonic wing pattern indicator in the most popular Forex trading platforms, such as Tradingview and MT4 in the indicators section. Its price is 30 USD, although you can get a free trial version, or if you don’t want to buy it, you can rent it for 3 months at a price of only 10 USD. We recommend this indicator to advanced traders as strategies with harmonic patterns are not easy to understand for a beginner, who should read about this topic to understand it well.

Categories
Forex Service Review

Bright Road Indicator Review

Bright Road is an indicator that shows the direction and sustainability of trends, and also shows their possible reversals. The indicator should be used to look for successful entries, performance bottlenecks to minimize risk, and time to exit the executed trades. One of the characteristics is that the indicator is never drawn again. We are talking about a straightforward visual tool to set up for both beginner traders and more experienced traders. Bright Road fits any style of trade.

The indicator is immediately displayed on our screen in an open chandelier with two lines, called Way and Bright. It’s a smooth movement, and it’s drawn like a solid orange line. It also shows the direction of the primary trend and strength. It appears as a line of circles, of red, blue, or yellow colors.

How to Use the Bright Road Indicator

BUY – the BRIGHT line must always be below the price and its color changes to blue.

SELL – the bright-line should always be above the price, and its color changes to red.

REVERSAL – we will see on the screen various yellow circles in a row.

TOP TREND CONFIRMATION – A chandelier opens above the road when a blue circle is below the road.

TREND DOWN CONFIRMATION – A chandelier opens below the road when a red circle is located above the road.

For additional indications, you can use the line intersection – ROAD line crosses the growing BRIGHT line, this means that we are on a long-term trend.

It is recommended to use 2 screens to make the most of this indicator. When your trade is based on the indicator: you have to identify the trend changes in a higher time frame, and then enter the market following the trend in a lower time frame.

Configuration of the Bright Road Indicator

This indicator has only one configurable parameter, which is Depth:

DEPTH – the depth of analysis of historical data. The indicator requires a substantial depth for analysis, at least 30 bars are recommended. Although by default there will be 54 bars.

Warning

Bright Road is a trend indicator and can possibly produce false signals during a long flat and lateral movement or in case of sudden market movements (for example, sliding movements caused by relevant news). This indicator is not, of course, a complete trading system. The developer recommends using it along with other indicators as well as checking the fundamental analysis.

This is one of the many trend indicators that exist in the market. Bright Road has been running since 2016 and yet few users seem to have been encouraged to use it. The indicator can be found in the MQL market where the developer, Maxim Kuznetsov, appears very active in the comments showing the benefits of its indicator.

We believe that there are other indicators on the market that are easier to use and even more comprehensive. Anyway, if you are interested in this indicator, you can buy it in the MQL market for 45 USD, which will give you the right to use it for a year. You also have a free demo to familiarize yourself with the indicator before buying it.

Categories
Forex Service Review

TIL Timeframe Overlay Indicator Review

TIL Timeframe Overlay is an indicator that was created by Viktor Macariola in 2014. The TIL Timeframe Overlay indicator is the tool that is designed and developed for multi-time analysis. It makes the task simpler but at the same time powerful to overlay a table of candles from several different time frames over another that allows you to see the bigger picture and see the underlying trend in the midst of noise and volatile price action.

The main features of this indicator are:

The indicator is compatible in all time frames, being able to work in M5, M15, M1h, M4h, and more. It works on any asset market instrument or symbol, be it currency pairs, indices, commodities, or stocks. Further, it displays the entire candlestick (body and wick) of other terms, including open, high, low, and closing prices.

The end-user can choose any time frame to overlap. Of course, the indicator does not repaint. It shows a new candlestick as the new fence (in real-time), depending on the time frame chosen. The colours of the candlesticks can be customized by the user.

A couple of important notes:

-Make sure that the time frame you choose to overlap is greater than the graph you are attaching it to.

-Given the limitations you have on MQL objects, you can only use one instance of this indicator at a time.

-The indicator displays the candles only when the candles have closed.

It seems an interesting indicator, which seems ideal to complement a clear trend indicator. The fact of superimposing chandeliers of several temporary spaces will be very useful to us to make the decision to make a trade or not, a 5-minute candle may give us a purchase and a 4-hour candle provides us with a sale and thus debug the trades we make.

This indicator is available on the MQL market for a price of 97 USD. You can also try it for one month for only 15 USD or try your free demo. We would have liked to have heard user opinions about this indicator, but there are no opinions about it, even though almost 60 people have tried at least the Demo version.

Categories
Forex Service Review

PZ Stretch Indicator Review

The PZ Stretch is a pattern by Toby Crabelprice that represents the movement or deviation of the minimum average price of the open price over a while and is used to calculate two break levels for each trading day. It is calculated by taking the period of 10 GHS of the absolute difference between the open, either high or low, and the smallest difference. This value is used to calculate the break-down thresholds for the current trading session, which are shown in the indicator as two lines.

Arturo Lopez Perez created this indicator in June 2015. This developer of indicators and EA’s is very active in the MQL community, where he has created many systems to help traders trade.

Who is Toby Crabel?

Toby Crabel is a self-made millionaire commodity trader who has avoided having a losing year from 1991 to 2002. Among other achievements, he wrote a major negotiating book entitled Trading Day with Short-Term Price Patterns. Reading this book is highly recommended, before operating with this indicator.

The Range Opening Trading Strategy (ORB)

Using this strategy, the trader places a purchase stop just above the open price plus stretching and a stop just below the open price minus stretching. The first triggered stop between the trade and the other stop becomes the stop of protection.

Crabel’s research shows that the sooner in the negotiation session the entry stop is hit, the more likely it is that trade will be profitable at close. A market movement that starts a trend quickly in the current trading session could add a significant benefit to a trader´s position by closing and should be considered for multi-day trading.

Extending the results of Crabel’s research it is evident that as time passes and we do not fill up early, then the risk increases and becomes prudent to reduce the size of the position during the day. The full trades by the end of the day carry the most significant risk and later on the day the trade is filled, the less likely the trader will want to carry out that trade overnight.

Opening Preference Trading Strategy (ORBP)

An ORBP operation is a unilateral Opening Range Breakout (ORB) operation. If the technical indicators show a strong trend in the same direction, then the trader will have a preference for the direction in which the ORB trade. A signal to open a position shall be placed on the side of the trend only and a protective stop shall be placed at that time.

To calculate where to place the “stop to open” will apply the same criteria as for ORB trading: For the lengths, the price Open plus the Stretch, and for the shorts the price Open minus the Stretch.

Parameters

-The main functional parameters of this indicator are as follows.

-Stretch Timeframe: The term from which the stretch is calculated (the default is D1).

-Stretch period: The period for the SMA used to calculate the stretch (the default value is 10).

-Rolling average period: period used to calculate the average tranche.

-Maximum History bars: Amount of bars passed to evaluate. Decrease to accelerate the indicator.

Despite being an indicator with almost 5 years in the market, it lacks many reviews, but the few that there speak well of the system. The developer makes constant improvements to it. This indicator, friend of the trend too, you can find it in the MQL market for a price of 30 USD, although you have a free demo version to try it out before buying.

Categories
Forex Service Review

FX Sniper Yellow Indicator Review

FX Sniper Yellow is an indicator that can be used exclusively to trade with Forex on your Metatrader trading platform. The main feature of FX Sniper Yellow is that it is able to analyze the behavior of market participants and predict changes in price direction even before the movement begins. Something that seems incredible.

Most indicators are delayed indicators and are quite useless. FX Sniper Yellow is an indicator that promises to anticipate market changes, calling itself a leading Indicator. FX Sniper Yellow displays the arrows in its chart showing the most likely direction of price action. FX Sniper Yellow never repaints and once the candle is closed the signal is confirmed, and the arrow will never disappear.

Indicator Entries

  • Use alerts (true/false): to activate alerts
  • Pops alerts (true/false): to activate popup alerts
  • Email alerts (true/false): to enable email alerts
  • Pushers (true/false): to activate Push Notification alerts
  • Sound alerts (true/false) to activate Sound alerts
  • Soundfile: is the file to be used for sound alerts

The size and color of the arrows can be set manually in the Color tab of the indicator.

Trading Rules

  1. You have to enter the trade at the opening of the next candle in the direction of the signal (SELL/BUY)
  2. Place the stop loss at the top (SELL) or bottom (BUY) of the ATR-based signal or stop candle.
  3. Take reward benefit/ the risk will be 2:1 or 3:1
  4. You can filter the input signals to go with the trend only. Therefore, we recommend using an additional trend indicator to your liking.
  5. Filtering signals with a trend is optional. This is not mandatory.
  6. This indicator can be used with any time frame.
  7. This indicator can be used for trading Forex, binary options, and also raw materials, stocks, futures, etc…

Free Version

You can download the free version of the indicator on the MQL5 market. This free version only works with Metatrader’s Strategy Tester. Or if you want to buy the full version, its price is 197 USD, or 27 USD monthly. You can find it in the MQL market, in the indicators section. Despite being a product that has been in the market for years, we have not found reviews from users who have tried it

Categories
Forex Service Review

TiModel Tendency Indicator Review

The “Thymus Trend” indicator is a ready-to-use semi-automatic trading system. This is one of the many trend indicators that exist in the market. The developer Egor Manakhov, very active in the comments of MQL5, offers a demo version, so you can know the indicator before buying it. The price of this indicator in the MQL market is 30 USD.

Main Features

  • Considers changes in the market
  • Only one input parameter
  • A pattern recognition algorithm is used
  • “Objective” and “supporting” levels of trends are calculated
  • The intensity of the trend is calculated
  • Comments on the terms of trade
  • Contains a separate information menu
  • Offers a good color scheme
  • Works in all markets and on all instruments

The Strategy of TiModel Tendency

This indicator recognizes the “Reversal-Impulse-Correction” pattern. In terms of support levels, these are calculated and fixed on the basis of the “Reversal” and “Correction” analysis. Target levels are calculated and set on the basis of the “Momentum” analysis.

Principle of Operation

As we have said, the indicator recognizes the “Reverse-Impulse-Correction” pattern. In the strategy, this pattern will be the starting point for trend formation. Then the indicator draws the trend as continuous dashed lines, shows “support” lines, and “target” lines. The indicator follows the evolution of the primary trend, reflecting the dynamics and drawing new lines and levels. The Indicator Information menu shows which trends are present in the market at present, and the force of the momentum of the corresponding trend, as well as its current state.

Other Parameters

  • Sample length, bars – length of historical data (sample)
  • Language (1 – Russian, 0 – English)
  • Scale low 0 high 1 – scale information menu (1 – large, 0 – small)

In conclusion, and in the absence of comments from users, who can tell us how their experience has been using this indicator, It seems quite complete and could be one of the trend indicators to take into account in order to start us in the world of advanced indicators for our trading platform.

Categories
Forex Service Review

Profile Volumes Market Indicator Review

Profile Volumes Market is an indicator that was created in May 2015 by developer Sergey Zhukov. The Profile volumes market indicator calculates the volume of ticks at each price level in a selected range. Volume is vital for determining the strength and therefore the importance of price levels.

The calculation range is established by the trader by scrolling two vertical lines. Thus the indicator allows following of the important levels in the different steps of the formation of the price of the symbol. A histogram of the volume profile can be displayed in the table (or removed from the table) by pressing the “ON” – “OFF” button. When the chart period is changed, the range of calculation of the indicator also changes, which is ideal when estimating the accuracy of the levels in lower time frames. The “||” button limits the calculation of the indicator to the visible area of the current graph. The color of the histogram is determined by the current price position relatively at the maximum level.

The parameters of change and relation allow customizing of the histogram. There are two modes of calculation of indicators. In Modetimer mode, the calculation of the indicator is based on the signal generated by the system’s internal timer, which allows you to work with it even when the market is closed.

In Modetick mode, the indicator is recalculated every minute, allowing you to track current changes in volume and check the operation of the indicator in test mode. The prompt automatically checks for “holes” in the quotation history and selects the smallest time frame with the full history as the basis, while the corresponding information is displayed in the comment.

Inputs from the Profile Volumes Market indicator:

  • Set mode – select indicator calculation mode.
  • Color level non – histogram color if the current price is equal to the maximum.
  • Color level bull – histogram color if the current price is above the maximum volume.
  • Color level bear – histogram color if the current price is below the maximum volume.
  • Color line from – color of the vertical line of the calculation range.
  • Color line to – color of the vertical line at the end of the indicator’s calculation range.
  • Coeff – coefficient of histogram display configuration.
  • Shift bars – the number of bars to move the histogram to the left.
  • Show comment – show the comment if there are “holes” in the dating history of the smallest time frame.

In short, we are talking about an indicator that sets average price levels over a given period of time. This indicator can be useful for all traders trading with the stock price. It is a useful tool to establish the price levels where the volume is concentrated, and that can therefore act as supports or resistors.

The opinions of users who have tried this indicator are quite positive, and this is because they value the tool as useful for their trading systems. On the other hand, Sergey Zhukov, the developer of this indicator, is very active in the forums of the market MQL and helps all users of its tool answering all series of doubts or questions.

This indicator is available on the MQL market at a price of 40 USD. It is not available for rent, but there is a demo version so you can test the tool and see how valuable it can be for your trading style.

Categories
Forex Service Review

ACB Breakout Arrows Technical Indicator Review

ACB Breakout Arrows EA is an automated system created in February 2019 by developer Nitin Raj. This is a 100% automated expert advisor based on the indicator called “ACB Breakout Arrows”. The inputs are based on a rupture pattern that occurs constantly in a two-way manner. The intensity of the input signals can be manipulated using the external input called “Signal Sensitivity”.

Confirmation from the Trades

ACB Breakout Arrows EA provides the ability to filter inputs using the indicator called ACB Trade Filter.

  • Strong purchase: Up arrow + green histogram + bullish trend.
  • Strong sale: down arrow + red histogram + bearish trend.
  • The EA avoids a trade if the histogram is gray and the trend is sideways.

The EA loads all indicators and dependencies in the background. Indicators will not be visible in the graph.

Main Features of ACB Breakout Arrows EA

Planned for a long time now, it can now be fully automated with our ACB breakout arrows indicator. The ACB Trade Filter indicator also incorporated in EA to simulate the entire trading system. No additional download is required. Indicators and dependencies are integrated into EA. The ability to achieve profit and loss objectives directly from the indicator.

Increase the EA’s performance using built-in filters such as Session-Filter, MMI, Vortex, Volatility, Market Regime, and more. Three stages of partial shutdown work to capture the available benefits in the table at the right time. Loss of flexible stop help to prevent winners from becoming losses. while protection against black swan events is provided using a maximum loss function.

Parameters of the input:

  • Set up Trade Preferences.
  • Batch Size Method: Fixed Lot Size | Auto Lot Size
  • Risk per operation: Percentage of risk per transaction.

Set of indicator parameters:

  • Signal sensitivity: A value between 20 and 100 that decides the intensity of the break arrows.
  • Bars for SL: Number of bars that decide the line of stop-loss placed by the indicator.

Choose the Output Settings:

  • Use Stop-loss: true | false
  • Stop-loss Method: Pips | Volatility | Indicator
  • Use Take Profit: real | fake
  • Take the Profit Method: Pips | Volatility | Quick Profit | First Target | Final Goal
  • Using SL Trailing: true | false
  • Method SL Trailing: Pips | Volatility

Set up the filters:

  • Business Sessions: All
  • ACB Trading Filter: True | False
  • Trend Filter: True | False
  • Volatility Filter: True | False
  • Vortex Filter: True | False
  • MMI filter: True | False

Various adjustments.

  • Maximum Loss Protection: True | False
  • Registration: True | False (EA records your entire operation in the Journal tab)

Conclusion

In short, we are talking about an EA that has only been on the market for a short time and has no user opinions that could have tested this tool. This EA looks for trend breaks, and that’s what its strategy is based on. It is a robot that we think is suitable for all types of traders, beginners and advanced, since it is easy to understand and does not require great knowledge for its configuration.

The price of this robot on the MQL market is 180 USD. There is no rental option, but it has a demo version so you can test it and evaluate if it is a tool that can help you or not to your trading.

Categories
Forex Service Review

Harmonic Pattern Scenario Planner Indicator Review

20Harmonic Pattern Scenario Planner MT4 can be found within the indicators section of the MQL5 marketplace. It was created by Young Ho Seo and was first uploaded on the 1st of October 2014. It has had a large number of updates, the most recent update was on the 4th of February 2020 and this brought the indicator up to version 11.2.

Overview

Harmonic Pattern Scenario Planner MT4 is an indicator for the MetaTrader 4 trading platform, it was designed as a tool to help you plan your trades and is claiming to be the first predictive Harmonic Pattern Tool available.

Some of the main features of the indicator:

  • Predicting future patterns for scenario analysis
  • 11 Harmonic Pattern Detection
  • Automatic stop loss and take profit recognition for excellent risk management
  • Pattern Completion Interval (PCI) for precision trading
  • Potential Continuation Zone (PCZ) detection for future price movement prediction
  • Potential Reversal Zone (PRZ) detection for Point D detection
  • Automatic Channel Detection to go with Harmonic Pattern (Optional)
  • Multiple timeframe Pattern Analysis
  • Multiple timeframe Pattern Detection
  • Guided Trading Instruction for professional traders
  • Pattern Locking and Unlocking feature in your chart

While using the indicator, there are also a number of different parameters that can be altered, some of these include the timeframes to use, the maximum number of patterns to display, whether to enable sound alerts, the Fibonacci retracement length and color, the number of bars to scan, the pattern update frequency, and more.

Service Cost

The indicator can be purchased outright with a one-time payment of $150, this will get you up to 5 activations of the software and it will have no further limitations. If you prefer, there is also the option to rent the indicator on a monthly basis, this will cost you $35 per month to do so.

A free demo version is available, however, there are no details of it on the site, this often means that it can only be used with the strategy tester but we do not know this for sure.

Conclusion

The Harmonic Pattern Scenario Planner MT4 indicator currently has four user reviews giving it an overall rating of 4 out of 5.

“I much prefer this one instead of Harmonic Pattern Plus by the same author. You can place pending orders in the entry zones for future patterns. You get much better risk-reward ratios this way because your entry will be right on target for the pattern.” – A 5-star review.

“Repaints a lot!!” – A 1-star review.

“Scenario mode is amazing, I recommend” – A 5-Star review.

So a mix of opinions but the majority are positive. There are also plenty of comments, the majority are from the developer themselves, however, when a user does post a comment they are often quick to respond which shows that they are still updating it, and as it has a recent version update, it is clearly still ign supported by the developer which is good to see.

This Forex Indicator is currently available in the MQL5 marketplace: https://www.mql5.com/en/market/product/6240