Profile Volumes Market is an indicator that was created in May 2015 by developer Sergey Zhukov. The Profile volumes market indicator calculates the volume of ticks at each price level in a selected range. Volume is vital for determining the strength and therefore the importance of price levels.
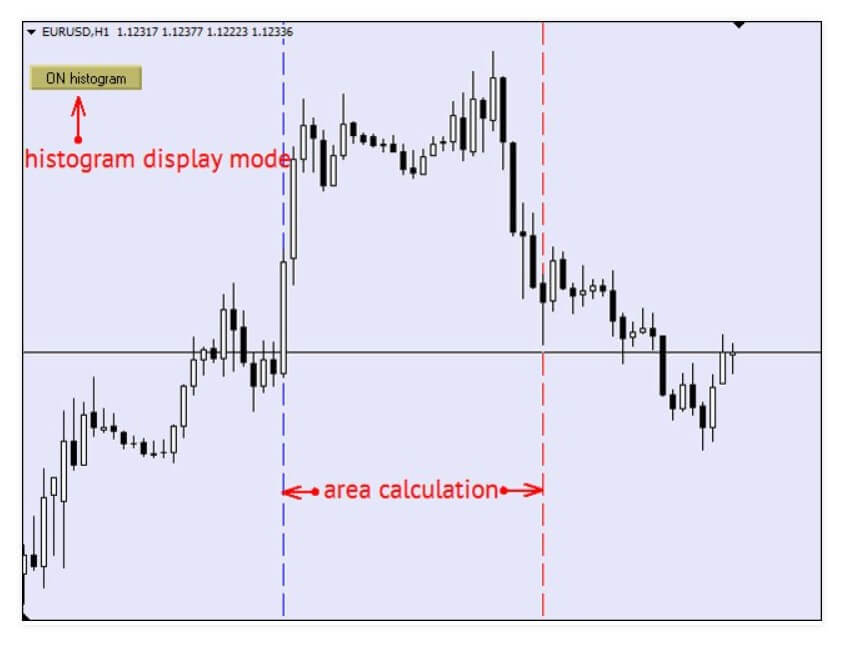
The calculation range is established by the trader by scrolling two vertical lines. Thus the indicator allows following of the important levels in the different steps of the formation of the price of the symbol. A histogram of the volume profile can be displayed in the table (or removed from the table) by pressing the “ON” – “OFF” button. When the chart period is changed, the range of calculation of the indicator also changes, which is ideal when estimating the accuracy of the levels in lower time frames. The “||” button limits the calculation of the indicator to the visible area of the current graph. The color of the histogram is determined by the current price position relatively at the maximum level.
The parameters of change and relation allow customizing of the histogram. There are two modes of calculation of indicators. In Modetimer mode, the calculation of the indicator is based on the signal generated by the system’s internal timer, which allows you to work with it even when the market is closed.
In Modetick mode, the indicator is recalculated every minute, allowing you to track current changes in volume and check the operation of the indicator in test mode. The prompt automatically checks for “holes” in the quotation history and selects the smallest time frame with the full history as the basis, while the corresponding information is displayed in the comment.
Inputs from the Profile Volumes Market indicator:
- Set mode – select indicator calculation mode.
- Color level non – histogram color if the current price is equal to the maximum.
- Color level bull – histogram color if the current price is above the maximum volume.
- Color level bear – histogram color if the current price is below the maximum volume.
- Color line from – color of the vertical line of the calculation range.
- Color line to – color of the vertical line at the end of the indicator’s calculation range.
- Coeff – coefficient of histogram display configuration.
- Shift bars – the number of bars to move the histogram to the left.
- Show comment – show the comment if there are “holes” in the dating history of the smallest time frame.
In short, we are talking about an indicator that sets average price levels over a given period of time. This indicator can be useful for all traders trading with the stock price. It is a useful tool to establish the price levels where the volume is concentrated, and that can therefore act as supports or resistors.
The opinions of users who have tried this indicator are quite positive, and this is because they value the tool as useful for their trading systems. On the other hand, Sergey Zhukov, the developer of this indicator, is very active in the forums of the market MQL and helps all users of its tool answering all series of doubts or questions.
This indicator is available on the MQL market at a price of 40 USD. It is not available for rent, but there is a demo version so you can test the tool and see how valuable it can be for your trading style.