Categories
Forex Indicators

Everything You Need to Know About Using MACD (Moving Average Convergence Divergence)

Moving averages identify trends when filtering price fluctuations. Under this idea, Gerald Appel, an analyst and portfolio manager from New York, developed a more advanced indicator. He called it Moving Average Convergence Divergence indicator MACD, which consists of not one but three exponential moving averages. It is seen in the graphs as two lines, whose intersections between them provide trading signals. One is called a MACD line and the other is called a signal line.

This oscillator has been involved in some controversy as to its classification. Mainly because there are analysts who classify it as a trend tracking indicator and others who consider it a follower of the cycle. We can be sure of the following: we are talking about the most effective oscillator after long-term cycles, hence the fact that it can be considered a follower of short- and medium-term trends.

Creating MACD

The MACD indicator originally consists of two lines: a solid line (called a MACD line) and a “strokes” line (called a signal line or signal). The MACD line develops from two exponential moving averages. It responds to price changes quite quickly. The signal line is developed from the MACD line, smoothed with another exponential moving average that responds to price changes in a slower way.

Buying and selling signals are given when the MACD line crosses above or below the signal line. The MACD indicator is included in most technical analysis software and is also on the DIF platform. Nowadays, no analyst needs to calculate it by hand as did its creator, Gerard Appel, because computers do this work faster and with greater precision. The MACD indicator is included in most technical analysis software.

Creation of the MACD:

  1. Calculate an exponential 12-day moving average at closing prices.
  2. Calculate an exponential moving average of 26 days of closing prices.
  3. Subtract the 26-day MME from the 12-day MME and draw its difference, as a continuous line. This is the MACD line.
  4. Calculate an exponential 9-day moving average of the MACD hotline and draw the result as a dashed line. This is the signal line.

Additional MACD Applications

Many operators try to optimize MACD by using other moving averages instead of the more commonly used MME for 12-26 and 9 days. Another option is to use MME 5-37 and 7 days. Some traders try to establish MACD links with market cycles. In the case of using cycles, the first MME should be one-quarter of the duration of the dominant cycle and the second MME should be half of the cycle. The third MME is a smoothing instrument, the length of which does not need to be connected to a cycle.

MACD Trading Rules

The intersections or intersections between the MACD and the signal lines identify changes in the market trend. Trading in the direction of crossing these lines means following the flow of the market. This system generates fewer operations and signal investments than an automatic system, based on an MMS.

  • When the MACD indicator passes the signal line, it gives a buy sign. Enter long and place a stop loss below the last minimum.
  • When the MACD indicator passes below the signal line, it gives a sell signal. Enter short and place a stop loss above the last maximum.

This type of oscillator has two uses. It helps to point out divergences. It also helps to identify short- and long-term variations, not only when the short average moves far above or below the larger average, but also by crossing the two.

MACD Histogram

The MACD histogram offers a deeper understanding of the balance of power between buyers and sellers than the original MACD. It shows not only who controls the market, buyers or sellers, but also whether they are strong or weak.

MACD histogram = MACD line – Signal line

The histogram of the MACD indicator shows the difference between the signal line and the MACD line. It graphically represents that difference as a histogram, a series of vertical bars.

When the MACD fast line is above the slow signal line, the MACD histogram is positive and is represented above the zero line. When the MACD fast line is below the slow signal line, the MACD histogram is negative and is represented below the zero line. When the two lines are touched, the MACD histogram is equal to zero.

Each time the distance between MACD and the signal lines increases, the MACD histogram expands. Each time the two lines join, the MACD histogram is shortened. The slope of the MACD histogram identifies the dominant market group. A growing MACD histogram shows that buyers are starting to strengthen. A decreasing MACD histogram shows that vendors are starting to strengthen.

The slope of the MACD histogram is more important than its position above or below the center line. The best-selling signals are when the MACD histogram is above zero but its address is bearish, showing that buyers are starting to sell out. The best buy signals occur when the MACD histogram is below the zero center line and its slope is bullish, showing that vendors are starting to tire.

However, there are systems that consider buying and selling signals at points where the MACD histogram cuts the zero line. In this case, the buy signal is given when the oscillator crosses from the bottom up, while the sell signal is given when the oscillator crosses the reference line from the top down.

Categories
Forex Indicators

How To Use the ADX for Forex Day Trading

All that glitters is not gold, they say. The same often applies to everything that is popular. And, if nothing else, ADX is one of the more popular indicators on the market.

Still, is there a way for us to use this tool effectively?

Traditional ADX Indicator

The average directional index (ADX) was developed more than 40 years ago. Nowadays, this tool is typically used by technical traders to measure volume. 

ADX consists of two main components – the ADX line and Directional Index (DI). The indicator aims to show trend strength and trend direction.

ADX line

The ADX line is a single line with a range of 0—100.

As this line is non-directional, it can only show trend strength. Therefore, while it measures the strength of the trend, it cannot distinguish between uptrends and downtrends.

So, the ADX line will rise during both a strong uptrend and a strong downtrend.

When the ADX is above 25 (like in the image below), the trend is strong enough to apply trend following strategies. However, traders who want to get faster signals often use the 20 ADX threshold as well.

When ADX is below 25, the market is in the consolidation stage. The image below portrays this well and, as we can see, there is a lack of a trend. With trends involving ADX below 25, we can no longer apply trend trading strategies but the strategies for ranging markets.

Directional Index

When the ADX is above 25 and the positive directional indicator (+DI) is above the negative one (-DI), the ADX measures the strength of an uptrend. The cross between the two DIs, together with the ADX line that is higher than 25, resulted in an excellent bullish move.

When the ADX is above 25 and +DI is below -DI, the ADX measures the strength of a downtrend. 

Values higher than 50 ADX indicate a very strong trend.

Important Facts

ADX should only be used with higher time frames because it tends to give false information on lower time frames. 

The ADX has a tendency to lag and the volume meter is generally very slow, which can lead you to enter the market too late.

The strategies used with the traditional ADX alone are insufficient and can offer a lot of false signals, but the ADX indicator can be used with other tools to obtain better signals.

Alternative ADX Uses

ADX + MA

ADX can serve as an example of how you can apply the moving average (MA) to a volume indicator

In the example below, we removed the ADX line (25) and added the MA, keeping the period at 10.

As ADX does not perform well during market consolidation, it would take a lot of time to go below that line and inform the trader that it is not a good time to trade. That is why traders take many losses with ADX alone when the market goes sideways.

Although this combination is not the best tool you can use, ADX has proved to perform better after the changes have been made.

ADX DMI + OBV + MA (100)

OBV (on-balance volume) shows whether the volume in the market is flowing in or out of the instrument.

The moving average (MA) of 100 is applied to determine is the momentum in the market is bullish or bearish.

A signal to enter appears when the two indicators indicate the same thing.

This strategy, however, always requires higher time frames as well as an instrument with some volatility and a high ATR.

Needless to say, traders must always use risk and money management skills to protect their trades from false signals and limit any potential losses.

ADX + RSI

Wait for the reading to get the ADX of 25 to know you are in a strong trend and that the trend is likely to develop. 

Use the last 50 candlesticks to determine the trend. Therefore, if the price is heading lower during the last 50 candlesticks, you are in a bearish trend. 

We will ignore the typical rule for using the Relative Strength Index (RSI) as we normally interpret the RSI reading below 30 as an oversold market and a reversal zone. To get an entry signal, use the same settings for both RSI and ADX.

Sell when the RSI indicator breaks, showing a reading below 30.

We will also add a stop loss for maximum protection. To determine the best location for your stop loss, find the last high of ADX before the entry. Then, identify the corresponding high on the price chart from the ADX high and place your stop-loss point there.

We will take profit after the ADX indicator breaks back below 25, which tells us that the strength of the prevailing trend is decreasing. You can also consider RSI going back into the normal zone as the exit point.

For a buy strategy, apply the exact opposite.

Non-Traditional ADX Indicators

ADXm

Unlike the traditional ADX indicator, which makes it hard to see where the market is headed, ADXm clearly shows both positive and negative ADX half-waves (colored parts of the line in the chart below).

ADXm uses the same method as the traditional ADX. We will use a reading of 20 to 25, depending on the time frame.

The original and this improved version differ with regard to price options. While the traditional ADX offers no price options (i.e. it uses fixed close, high, and low for circulation), ADXm allows traders to use three prices – the price for close, high, and low. 

Still, there are also many similarities between the two (e.g. the results, if default parameters are used).

DMI Oscillator

The original ADX uses SMMA (i.e. running MA or Wilders EMA), while DMI Oscillator allows traders to experiment with the other types of averages as well. 

The improved version also lets traders smooth the results of the oscillator. Moreover, it offers three different color options – on levels cross, zero cross, and slope. Change alerts are triggered according to the trader’s choice of color.

Traders seem to love DMI Oscillator because they can apply different strategies (scalping, swing trading, short term trading, binary trading, etc.) on different time frames and regardless of candle behavior.

Conclusion

The ADX indicator is great for determining trend strength – both bulls and bears at the same time. 

While it is good for identifying trending conditions, the traditional version of this tool may lag quite a lot. Not only does it often cause traders to enter trades too late but it also gives too many false signals, which then result in losses.

The daily time frame is the best option for using the ADX because it offers the least amount of inconsistency and incorrectness. 

The best profits come from catching strong trends and, with the right ADX strategy, you can accomplish your trading goals.

Since the standard version of ADX does not contain all data for the analysis of price action, it must be either used with other tools/indicators or simply replaced by a more recent, modified version.

It is extremely important to note that ADX (in particular) requires traders to rely on money management and risk management – especially with the original version. As Peter Borish says, we want to perceive ourselves as winners, but successful traders are always focusing on their losses. We cannot let the possibility of getting a false trend stand in the way of our (and our account’s) growth.

Finally, all indicators are just tools. We should use them only if they benefit us. Test ADX as well as all other ADX versions and tool combinations, and leave out anything that you feel you cannot use optimally.


Categories
Forex Indicators

Using Parabolic SAR With Dynamic Stops Losses

One of the best-known indicators in the Forex market is the Parabolic SAR indicator. This is because it tells us when the momentum is changing, arriving early when the momentum changes can give you a winning advantage. SAR means to “stop and reverse” by definition. However, there is another way to use the Parabolic SAR, apart from trying to identify trend changes, either in the short or long term, and it is intended to use the indicator as a form of use of dynamic stops loss, either for a partial or total output.

What is the Parabolic SAR?

The Parabolic SAR formula was developed during the boom days of technical analysis in the 70s by Welles Wilder, who is the person who also designed the Relative Force Index (RSI). The relative strength index is pretty much the only Forex indicator that can produce a winning advantage on its own, so it’s worth taking a look at anything written by Welles Wilder.

The algebraic mathematical formula used to calculate the value of the indicator in each candle is complex, so I’m going to explain it in very simple conceptual terms, using for this a long example. When a candle makes a new maximum, the indicator sets a value below that candle. If the candles keep making new maxima, the value of the indicator rises along with the price but is increased proportionally by a factor selected by the user (0.02 is the most common).

The idea is that “time is our enemy” and that the best of any directional movement where we can be is in the part where the momentum keeps increasing. Thus, it is better to use this indicator in commercial trends or in strong directional movements. In fact, Wilder recommends using the Parabolic SAR indicator along with its ADX (Average Directional Index), which is also recognized as probably the best and most useful Forex indicator.

Parabolic SAR and Technical Analysis

Parabolic SAR is an extremely simple “binary” indicator and is often used in forecasting and trading strategies in the following ways:

-Determination of the trend. When a new candle is opened and the indicator prints its point on the other side of the candle from where it was on the previous candle, this indicates a change of trend and a possibility of entry into a trade.

-In determining the trend as indicated above, use the ADX indicator to determine whether the trend is powerful enough to have a justification for a new commercial entry, always in the direction of the trend.

-When a certain number of candles have been making new lows or highs with the indicator point always remaining above or below each candle, use the point price (or one near it) as a manually adjusted stop-loss (i.e., a dynamic stop loss) to signal an exit from a trade.

The Best Way to Use the Parabolic SAR

I think the best use of the Parabolic SAR indicator is like a trailing stop when it comes to operating in a strong directional movement. I don’t think it has a great value to determine when to enter: entering the trend direction in Forex is best determined by the break or, usually, better yet, by moving the signals from triple moving average crosses.

Normally, when operating in strong directional movements, the best benefit profile comes when trying to capture two different movements:

  • The initial short-term momentum movement; and
  • The long-term directional movement that begins at 1.

Trying to capture only movement 1 is usually not very profitable in the long run. A better trading strategy is to take partial gains when movement 1 ends, letting the rest of the position run in the hope that movement 2 will take place. Successfully capturing movement at 1 can give you the “take off” necessary to enter the trade at a good entry price that is sufficient to capture movement 2.

Understanding the Parabolic SAR Formula

You don’t really need to know the actual formula of any technical indicator in order to build a trading strategy, but it’s worth understanding why SAR parabolic points appear. In addition, if you want to create an Excel Parabolic SAR calculation file to build a decision support system for your daily transaction, you would need to know the parabolic SAR formula. However, here is the formula used to calculate the parabolic SAR values:

Sarn + 1 = Sarn + α (EP – Sarn)

In the formula Parabolic SAR, the Sarn is the current period and as +1 indicates, the Sarn + 1 is the value SAR of the next period. During an upward trend, the PE is the highest price on the trend, which would be the highest of most candles or bars on the trend. On the other hand, you can be quite sure that the EP would represent the lowest candle or bar in a downward trend. Since parabolic SAR points only appear above or below the price, it is not a difficult task for you to identify what the PE value represents.

The most important variable in parabolic SAR adjustments is α, which represents the acceleration factor in the formula. When you try to add the parabolic SAR indicator in the graph, your graphics package would normally set the value of α to 0.02.

You see, during an upward or downward trend when the price makes a new high or low, the acceleration factor increases by 0.02. This is why the gaps between the parabolic SAR points become larger during a strong trend and the size of the gaps shrink during a price consolidation. Although the default acceleration factor is set to 0.02, most graphics packages would allow you to change it. Maybe you’re wondering why you need it with the acceleration factor. Well, some stock prices are more volatile than others, and depending on the length of time you choose, optimizing the acceleration factor can actually improve your commercial performance.

For example, in the Tradingsim, it can reproduce the price action with different SAR acceleration factors to find the optimal value and test the market to see if the new value makes a major difference in the generation of parabolic SAR buy signals or Parabolic SAR Sell signals. If you see a positive result, you must customize the SAR formula to fit the share price feature of the share.

Using Parabolic SAR as Trailing Stop

One of the best things about this indicator is that it is extremely easy to use and does not really require any concern on the part of the user with regard to input values. The default values are perfect. One method is simply to manually adjust the stop-loss price to place it a few pips just beyond the indicator point as each new sail opens. A second option may be to wait for the candle to reverse and close beyond the point. This will most likely contribute to you getting better results in the long run.

Remember that your own calculations on any strategy you are using should be moved to the image. Let’s take an example, if you what you expect make a 50% commercial exit at a risk-reward ratio of approximately 2:1, and get an output signal at 0.5:1, which is far from that desired target, you would best ignore the output signal, or maybe move the stop loss to the balance point.

Warning: Only Use With Trending Markets

There are different ways to know for sure if a market is on a trend, but the Parabolic SAR indicator provides good visual aid. If the graph shows that the indicator is changing the point only occasionally, and fairly long chains of consecutive candles with all the points on the same side, then the market is “swinging” enough to give your operation a good chance of making a profit. If the dots are not in a series and are all displayed mixed, then it is a hectic market and it is probably best to avoid it.

Categories
Forex Indicators

RSI: The Best Forex Indicator?

Far from being something that will help you operate profitably, the usual use of Forex indicators really causes more losses than gains among inexperienced traders. However, if you are going to use them, then you should know that the best Forex indicator is the RSI (Relative Strength Index).

What is the RSI (Relative Strength Index)?

The RSI reflects the momentum and it is well known that following the momentum in the foreign exchange market increases the chances of profits. The RSI is an indicator of momentum in the Forex market and, in fact, it is the best indicator of momentum. If you are willing to use the RSI, probably the best way to use it is to go long when it is above 50 in all time frames, and operate short if it is below 50 in all time frames. It is best to always operate with the trend of the last 10 weeks or so. The formula of the relative strength index was created in the 70s, as were many other concepts of technical analysis. 

Relative Strength Index – Forex Indicators

The calculation of the relative force is performed by calculating the ratio of upward changes per unit of time to downward changes per unit of time during the review period. The actual calculation of the indicator, however, is more complex than we need to know here. What is important to know is that if we look back over a period of, say, 10 units of time and each of those 10 candles closed upwards, the RSI will show a number very close to 100. If each and every one of those 10 closed candles, the number will always be very close to 0. If the financial asset is fairly balanced between drops and raises, the RSI will show 50. The relative force index is defined as a pulse oscillator. Shows whether bulls or bears are winning in the review period, and this period can be adjusted by the trader.

Technical Analysis of the Relative Force Index

The RSI indicator is normally used in forex trading strategies in the following ways:

  1. When the RSI is above 70, a price drop should be expected. A drop below 70 after having been above 70 is taken as confirmation that the price is starting a downward movement.
  2. When the RSI is below 30, a price increase should be expected. A rise above the level of 30 after having been below 30 is taken as confirmation that the price is starting an upward movement.
  3. When the RSI crosses above 50 after being below 50, it is taken as a sign that the price is beginning a bullish movement.
  4. When the RSI crosses below 50 after being above 50, it is taken as a sign that the price is beginning a bearish movement.

Methods 3 and 4 described above in relation to crossing the level of 50 are generally higher than the first and second methods concerning 30 and 70. That’s because more long-term Forex earnings can be achieved by following trends instead of always expecting prices to bounce back to where they were: just be careful not to move the stop loss to the break-even point too quickly.

Forex Indicators

This is a point where we will pay more attention – if it is better to follow trends, or “diminish” them by doing trades against them. There are many outdated tips on this subject, most of which were in the years prior to 1971, at a time when exchange rates, although they were fixed at the price of gold or other currencies. In this era, trading was mainly in shares or, to a lesser extent, in raw materials. It is a reality that commodities and stocks tend to show markedly different pricing behaviour from the exchange rates of Forex currency pairs – stocks and commodities show trends more often, are more volatile, and follow longer and stronger trends than Forex currency pairs, which show a stronger tendency to return to average.

This means that when making Forex trades, most of the time, using the RSI to trades against directional moves using methods 1 and 2 described above, will work more often, but it will generate less utility than the use of Methods 3 and 4 to track trading trends in the direction of the strong prevailing trend, where such a trend exists. Although it may seem attractive to try to earn smaller amounts more often and use money management to increase profits quickly, It is much more difficult to build a cost-effective medium-reversion model than to build a cost-effective trend tracking model, even when trading with Forex currency pairs. The best way to operate at RSI 50 level crossings is to use the indicator in multiple time frames for the same currency pair.

Crossing The 50 Level In Various Time Frames

Open several charts of the same currency pair in several time frames: weekly, daily, H4, up to the minute. Open the RSI flag in all charts and make sure the 50 level is checked. Virtually all forex graphics programs or software include the RSI, so it should not be difficult to use it. A good period to use in this indicator is 10. It is also important that the market review period is the same in all different time frames.

If you can find a currency pair that in all the higher time frames is above or below 50, and in the lower time frames is on the other side of 50, then you can expect the lower time frame to cross again above 50 and should accordingly open an operation in the direction of the long-term trend.

The higher or lower the RSI, the better the operation. In the forex markets, it is a universal law: strong trends are more likely to continue and a reversal that then turns tends to move very well in the direction of the trend. This method is a smart way to use a forex indicator because it identifies setbacks within strong trends and tells you when the setback is likely to end.

Categories
Forex Economic Indicators

What Are Forex Boost/Impulse Indicators?

Impulse indicators measure the rate of change in closing prices and are used to detect weakness in trends and potential points of turn. Often not taken into account for their simplicity, but the importance of the boost in the forex market should not be overlooked. They can be a great way to make a profit by identifying a strong movement that is already underway.

In this lesson we will learn some valuable additional tips that will be useful when using impulse indicators: momentum trading can be as profitable as S/R trading (support and resistance).

What Are Impulse Indicators Used For?

Impulse indicators are useful to solve the following types of common traders dilemmas that S/R indicators cannot answer. For example:

A currency pair has broken past all previous S/R points and is making new historical highs or lows, so there are no S/R levels telling us if it is a good time to place or withdraw a position. Is it worth getting on the ride, or would it be better to get out of the way?

He didn’t place positions in time on a trend that’s been working for a while. How can you tell if there is still time to follow the trend? How can you reduce or eliminate the risk of buying at maximum or selling at the minimum? It could expect a setback, but while it waits, it risks losing even more of the movement. This is a natural human error, to assume that one is too late when in fact some of the safest benefits you can take on the market are at this time of apparent “over-buying”.

You have a winning operation open and want to keep it as long as possible, but you don’t want to risk staying too long and losing part of your winnings. Or it’s approaching the resistance and its intended point of exit. Do you take profits or leave part or all of the position in the hope of letting the profits run with a trailing stop?

If we look at what happened to gold from May 2009 to August 2011, from May 2009 to August 2011 it was making new historical highs and showed only 8 months down from a total of 27, rarely regressing to anything but very short-term levels of support.

Those who expected significant setbacks never saw them arrive and missed the biggest trend of the year, while gold consistently reached new historical highs. Expecting a setback in the upward trend here was not a good idea!

We, traders and investors, earn our living by correctly predicting what will happen in the future, even though we don’t have to be exactly right to make money – we just have to be roughly right. However, the S/R indicators we have covered so far tell us about what happened in the past. While that’s helpful in predicting the future price action, S/R indicators can only tell us about the strength of S/R levels. The other half of the image is lost as they cannot tell us if a trend is strong enough to break beyond a certain level of S/R. In addition, cannot tell us anything about future price movements when a currency pair or other assets have broken beyond all levels of S/R to new historical highs or lows. Fortunately, there is a way around this, apparently, very difficult problem.

What should traders do? Employ a style of impulse trading using impulse indicators.

The Advantages of Impulse Indicators

These indicators can give us a better idea of future price movements because:

  • Show whether a trend is strengthening or weakening.
  • They can tell you if an asset is overbought or oversold according to the price range for a certain prior period.

That helps us decide whether the trend is likely to continue or change direction. Knowing this can help us predict changes and have greater profitability. In short, impulse trading with impulse indicators can offer additional clues to assess the odds of hitting even more in your favor.

There are many indicators of momentum, but at the moment we will present you with only a few of the most effective and easiest to use indicators:

  • Double Bollinger Bands.
  • Mobile Stocking Crosses (MA).
  • Three types of basic oscillators: Convergence/Divergence of Moving Mean (MACD), Relative Force Index (RSI), and Stochastics.

Why the Gold Chart? Brief Introduction to Market Relations

Are you wondering why we use a gold chart in a foreign exchange article? The reason for this is that, for a number of reasons, currencies and raw materials are often related to each other and are therefore sometimes traded as substitutes for each other.

For example, because Canada is a major oil producer, the DAC often moves with the price of oil. Under certain conditions, it’s more sensible to negotiate a DAC currency pair than oil and vice versa.

Although different types of goods, such as stocks, commodities, and currencies have some notable differences in their behaviour – for example, Forex currency pairs tend to fluctuate in value in relatively small amounts compared to commodities, that tend to be more volatile – can illustrate truths about successful trading methods by using them all interchangeably.

Gold is a special case because it is considered the main hedge against currency devaluation. When investors are concerned about the decline in the value of one of the most widely held currencies (especially the USD and the EUR), gold can rise.

Therefore, at a time when the fundamentals for both the EUR and the USD are not good, but it is not clear whether to go long or short with the USD, the traders play it safe and just have to go long with the gold. We will see that happen at a time when there is a great deal of anxiety about the stability of large parts of the global financial system. For example, gold has tended to rise during episodes of great concern over the EU’s sovereign and bank debt crisis. At times like these, traders often buy gold en masse because:

  • It seems that the EUR might not even survive.
  • The Fed may be printing massive dollars in order to help Europe and steer the US economy away from the possible consequences of an economic crisis in the EU.

In fact, if you compare a timeline of the EU crisis and a weekly gold chart covering those years, you will notice that gold often rose to new highs. Later we will cover this and other relationships between markets and know how to use them.

How Do Impulse Indicators Work?

As its name indicates, the impulse indicators focus on the price exchange rate, that is, if the price goes up or down by more than it used to. While exact mathematical calculations and emphasis vary between different impulse indicators, they all attempt to provide some perspective on:

  • If the price is changing at a faster or slower pace
  • If the exchange rate indicates the strength or weakness of the trend

For example:

  • A steady increase in the speed at which price goes up or down suggests trend strength
  • However, too rapid acceleration is often interpreted as a sign of “trend exhaustion” or a maximum turn (or minimum turn in bearish trends) suggesting a final drastic increase in optimism (or pessimism in bearish tendencies) that drains the remaining buyers (or sellers in the downward trends) and prepares the end of a trend and turn of it.

When this happens, you will hear analysts saying that the pair is:

  • “Overdrawn”, if the price has gone up too fast or for too long, and therefore is expected to turn and start to fall.
  • “Overwritten” if the price has fallen too fast or for too long, so it is expected to rise.

It is important to be careful, however, because sometimes these terms are used too easily. ” Over-buying” and “over-buying” are sometimes used when the price has just gone up or down a lot, when it is really the speed with which the movement has occurred that is the crucial factor.

Categories
Forex Service Review

Advanced Accumulated Currency Volume Indicator Review

The Advanced Accumulated Currency Volume indicator was launched in March 2017 and is continuously updated. It is an affordable Forex trading tool that has incorporated a number of its own features along with new formulas. In the following review, you will learn more about this indicator and can decide if it may be helpful to you. 

Overview

The Advanced Accumulated Currency Volume Indicator is especially suitable for trading with the 28 major Forex currency pairs and works in all time frames. It is a new formula that in a single graph, extracts the entire foreign exchange volume (C-Volume) of the currencies AUD, CAD, CHF, EUR, GBP, JPY, NZD, and USD. This means a significant advantage in trading. Volume traders know how to use it. If you are a beginner trader, it is convenient that you learn to read the extreme values and add them to your trading routine.

This indicator thinks of C-Volume as a shield, not as a weapon. A warning signal will be displayed on the main graph warning not to go into wrong operations.

This is not the simple volume of a pair. The Forex market is scanned and the volume for each currency is extracted and accumulated to C-Volume. Now we can visualize which currencies have the highest or lowest volume. We can see in a single graph what is happening within the 28 pairs of Forex. If the Euro, for example, has a sharp point, check the EUR pairs for possible operations. If USD has a strong point, then check the USD pairs.

The indicator has been built on new underlying algorithms makes it even easier to identify potential tipping points. This is because it graphically shows peaks of volume C in a coin. These features were designed to help the trader and keep him out of bad trades, while the gauge guides him into pullbacks.

How to Read Volume C

Valuable is C-Volume for the base and the quoted currency of the pair. C-Volume is not a delayed indicator. It gives an instant warning signal and peaks out of range should not be ignored. It is not advisable to negotiate with an extremely high volume C outside the range band. The gauge will keep you out of the bad trades, and look for the pullback.

Do not negotiate with an extremely low volume C outside the range band. Most likely operations: Enter the increase of volume C within the range band. Avoid actions in the drop of volume C. In contrast to the standard volume, this indicator has a unique formula, and C-Volume can be used on a live candle. As long as the sail is open, it will give an approximate value in percentage.

Parameters of the Indicator

Adjustments:

-Baseline width and quotation (make the C-Table volumes thicker)

-Line width other 6 (other volumes C that is not part of the chart)

-Type of line point if width=1 (use the dotted line for the other 6 above), show only the base and the volume of budget (show only the base and the budget line C-Volumes)

-Line width (top and bottom width or range)

-Minimum volume (%-Lower range line level)

-Maximum volume (%-Top range line level)

-Range period (bar period or range lines)

Font size (The size of C-Volumes names) show bars again (how many candles again the indicator prints the currency lines)

Setting up of alerts:

-High Volume C Alert (above top range line)

-Popup Alerts, send alerts by email and send push alerts.

Service Cost

This indicator is only available for rent, and its price is 44 USD for 3 months of use or 58 USD for one year, so it is more advantageous to rent it for one year. It is available in the MQL market indicator store. You also have a free demo version available if you want to use it before you invest your money.

Conclusion

In short, we are talking about a rather valuable indicator, because trading knowing the volume is an advantage over the rest of traders who do not know this fact. There are many comments about this indicator, and most are positive, users are happy with using this tool.

Categories
Forex Indicators

The Williams %R Indicator: Winning Custom Interpretation Twists

There are special ways we can take signals out of an indicator, ways not described by default. In many cases we find an indicator that is not very good for its role in our system, we have better-performing ones. We try different settings to improve it and this may take a lot of time when we backtest, especially if there are many settings. 

Now, if you are a veteran in technical analysis, you probably have tested many indicators and know about adding Moving Averages on top of indicator data. If not, we have done an article about this customization that could generate very accurate signals out of simple, mediocre indicators we have scratched as bad on our top list before. Whatsmore, even indicators that have a different role by default can be converted to other roles just by adding MAs. 

The Williams %R is a reversal type indicator, an oscillator with overbought and oversold signals. In theory, it does not fit into the trend following method of trading and we might just skip it because our system is designed and needs trend confirmations. When we discuss exit indicators, the reversal type indicators fit very well into this exit signal role. Yet Williams %R is probably not good enough even as an exit indicator for your trend following system. Thorough analysts do not move on until they exhaust all possibilities out of an indicator, be it by adding MA if possible, changing settings, or interpreting signals for other, unorthodox uses. In this article, we will tackle how a mediocre indicator in all categories can become our top indicator just by having a different view of its signals. 

Very few reversal indicators can be made a good trend indicator. They are simply not made for that role. Williams %R is a rare diamond by accident that can be made useful. Williams %R is not in the Bill Williams indicator family where you can find Awesome, Alligator, Fractals, MFI, and others, which are generally not great for trend following algorithms according to professional prop traders. Williams %R is made by Larry Willaims and it is already integrated into the MT4 platform so you do not need to look for it. The settings by default are not optimal if you want to trade it using our algorithm structure but you can try and test different settings, every system is unique. As our traders say, typically they do not test indicators with lower period settings than by default. It is usually done with defaults or a bit longer to smooth the indicator, but Williams %R is another exception.

According to our tests and testimonies from professional technical traders, the daily timeframe is the best choice for many reasons, not only performance-wise. However, Willimas %R seems to be better at lower frames than the daily. This does not mean that if you trade on a daily only Williams %R is not useful. You will need to test. Lower timeframes, even 4 hour is good enough just do not go lower than 15 minutes. Williams %R is a confirmation indicator with the way we use it, but it is not great for continuation trades. The way we use it is completely the opposite of what it is made for. Let’s get into more detail.

In the picture below we have already included Williams %R with a modified period setting to 8, the Kijun-Sen from the Ichimoku indicator on default settings as our baseline and we are on the 4-hour timeframe. Williams %R has another interesting fact – it has a scale from 0 level and below. The area from 0 to -20 is regarded as the overbought area and the area from -80 to -100 is the oversold area. It is rare to see indicators with these values but do not be confused, if you want to add the “zero” line to experiment just add a horizontal at -50. Similarly to the popular RSI indicator, Williams %R generates a signal once the oscillator line crosses the overbought and oversold levels into the middle range. 

When applied on the BTC/EUR chart above we see a lot of signals that didn’t end well, most likely in a loss when interpreted in a classic way. On certain occasions, the signals were very good, as the bullish trend on the left side of the picture. False signals frequency is hard to eliminate here, even if we add the volume filter. Simply, Williams %R has a choppy behavior by default so we need something to counter this issue.

When we observe how and when trends start, it is noticeable every trend starts when the line enters either the oversold or overbought area of the indicator. In the picture below we have marked all entries allowed by the baseline. Out of 6, only one was a losing trade, and that one was a small loss compared to the trends captured. This way gives out interesting and consistent results, even though the indicator was never designed for it. For those not familiar with the baseline element in our analysis, only when the price crosses and closes above or below it we look at the Williams %R for a trade entry signal. If you go to lower timeframes such as H1, 30M, and 15M, this way continues to give you good signals. Beginner traders that like trading on lower timeframes deviate from our algorithm principles, however, Williams %R is a good to go indicator which will likely outperform their current confirmation indicators. When the market is ranging, this indicator will rarely give you a signal, often the line will stay in the normal range, making it a great loss eliminator. When you par it up with the volume filter, you can scratch almost every fake signal in a ranging market

To conclude, we flip the original signal interpretation. A classic way of trading this indicator is going long when the Williams %R line exits the oversold range into the normal -20 to -80 area and going short when the line exits the overbought, upper area. Now we flip this into going long when the line enters the oversold and overbought areas. This is similar to the CCI, and some momentum oscillators, but Willimas %R does the job better according to our testing. As for exit signals and continuations, it does not prove to be as efficient, however, we encourage you to test this out. Finds like this are not so rare if you try to research and test every interesting indicator. When you see it is very bad at its first intention, a small twist in settings, Moving Average addon, or another signal interpretation can flip it into a top indicator. Adding Moving Averages on this indicator is possible which brings a whole new area for interpretations across different roles. Note you need to select Apply to “First Indicator Data” first so the MA is on top of the indicator window.  

Categories
Forex Indicators

A Detailed Look at the CCI Indicator, Warts and All

Some market indicators are single-purpose juggernauts that resemble something designed in a Soviet tractor factory to inflexibly do one job and one job only and others look on the surface like sleek, adaptable, multi-function jet fighters that can serve a number of purposes and be used across different markets. But does that make them better? Or even good? Is it good as a confirmation or trade exit indicator? Read on to find out.

What is the CCI?

It’ll take you no time at all to figure out that the Commodity Channel Index – popularly known as the CCI – was originally developed for commodity trading. It was developed back in the 1980s, at a time when spot forex trading wasn’t even a thing, to help commodities traders identify changes in long-term market trends. However, as anyone and everyone in the social media forex sphere (and beyond) will tell you, it isn’t used just for trading in commodities and forex traders regularly make use of its adaptability to hammer it into several different roles. 

Indeed, one of the praise-worthy things about the CCI is how it can be adapted to perform various tasks and how you can use it in different ways. This is partly a result of how it was designed. In short, the CCI takes the current price of a stock or currency and compares it to an average price for that stock or currency over a period that you can adjust. This means that what it’s ultimately telling you is how much from the mean the price is deviating at the moment. Coupled with lines offset at deviations of +100, +200, +300 and -100, -200 and -300 and with the fact that it is used across different timeframes and scooping up different periods to generate the average (typically 14, 20, 30, or 50), which means it can suit numerous different applications.

Common CCI Strategies

If you go online and search CCI strategies or how to use the CCI you will easily find a plethora of different approaches. There are probably about five or six main ways The CCI gets packaged but of those, there are three dominant categories that will crop up again and again – which is why these three merit a closer look.

Before we get started, however, it is worth pointing out a few basics. As mentioned, the CCI is pretty flexible – meaning that adjusting its settings allows you to use it in different ways and with different outcomes. One aspect of this is that the strategies below often rely on the CCI to be set up differently and to be used in different approaches to trading, including different timeframes and trading styles.

A crucial setting of the CCI that you need to adapt to the way you are using the CCI is the period it covers. It is important here that you are aware of the trade-off you are making when adjusting the indicator’s period. The CCI uses the period to generate the average price from which the actual price of the currency is deviating. It is fundamental to how the CCI works. A short period (for example, 14 or 20 – both of which are common CCI defaults) will give you more signals and they will appear earlier in the price movement but they will contain more inaccuracies. And inaccuracies here could spell more failed signals so that’s something to really watch out for.

Increasing the time period the CCI scoops up to generate its average price will result in more accurate signals but the downside is that they will often appear late when the price movement is already well underway. So while this might mean you are getting more reliable trade signals, you are not necessarily getting them on time to make the most of your trades. It’s a trade-off you will need to play around with to get the hang of it but it is also something that affects how you will end up using the CCI in your trading. 

Another thing to bear in mind is that CCI trading signals usually come in the form of it crossing the +100 line into “overbought” territory or the -100 line into “oversold” territory. In forex trading, currencies can’t be overbought or oversold in the same way as commodities but these signals nonetheless remain the crux of using the CCI to trade forex. It is worth remembering that some strategies will rely on an even more cautious approach where the trade signal is defined as the CCI crossing the +200 or -200 line and that some traders also use a zero-line cross strategy.

By covering some of the more popular strategies here it is not our intention to recommend any of them – they are here to give you a basic overview of how the CCI is commonly used and what it can potentially do. It should go without saying that you are not advised to start using the CCI – or any other indicator, for that matter – without first taking it through a rigorous testing phase (including both back and forward testing) where you will check and double-check both that it works as you need it to and that it suits your own personal trading style.
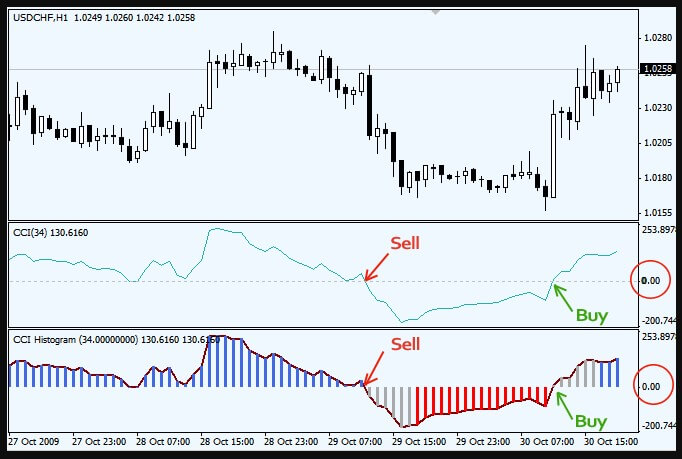
The Zero-Line Cross

In most cases, the zero-line cross strategy with the CCI is used on short or very short timeframes to catch price movements that develop into small mini-trends. This approach gives better results during those times when the market is particularly active and are also better at catching trends on short timeframes than they are on longer timeframes.

A popular version of this approach would be to combine two CCI indicators operating on different periods (for example, 20 and 50) with an exponential moving average on a short timeframe – say, the one-minute chart. An entry signal would then be generated when the 50 period CCI crosses the zero-line and is confirmed by the shorter-period CCI and the moving average. If the price movement is long and the 50 CCI crosses the zero-line, the confirmation should come in the form of the 20 CCI line remaining below the zero-line and the price is above the moving average. If either one of these confirmations fails to occur, the trade signal is false and you should not enter the trade.

This same set-up will also generate a handy exit signal. If you entered a long trade, like in the above example, and you are still in the trade when the indicators line up again to give you a short trade signal, this is your cue to close the trade. The kicker is that this will sometimes happen before your trade has had a chance to become a winner. To mitigate against this, you should be particularly careful about the market conditions when entering into short-term trades. It will take a great deal of backtesting and time spent on your demo account before you be comfortable about when this approach is likely to reliably and consistently give you winners.

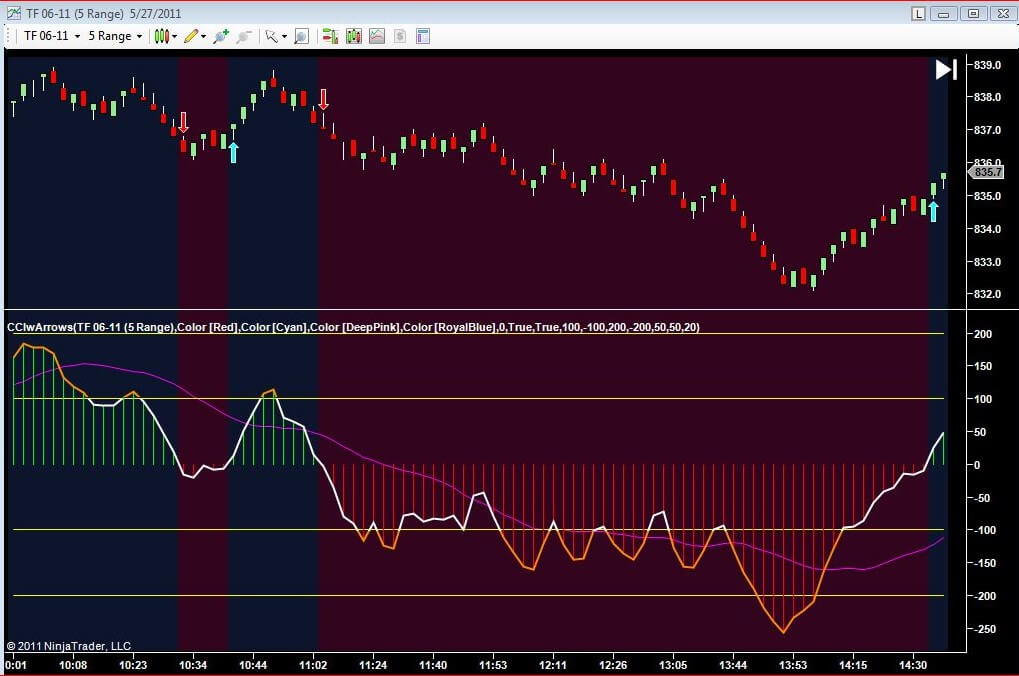
Reversal Hunting with the CCI

Another popular trading strategy that is advertised for the CCI across online trading guides is its use in reversal trading. Reversal trading is an inherently risky business and should not be entered into lightly. Whether the CCI is the right tool for this approach or not is something that is hotly debated and only those who have thoroughly tested a reversal strategy to the point at which they are happy with its results should attempt it. That said, there are a huge number of reversal strategies out there relying on the CCI so it is worth looking at what a typical one might involve, even just for completeness sake.

In most of these strategies, you are waiting for the CCI line to cross the +100 line or the -100 line and then cross back. As you can already guess, this will throw up a lot of failed trades so most strategies seek to limit those by adding in more lines for the CCI to cross. If you do this your trade signal will be generated when the CCI crosses one of these outlying lines (say the +250, for a short trade) and then drops back down to cross the +100 line as well. Reverse this for a long trade, where the line crosses the -250 line, crosses back, and then also crosses the -100 line. Adding in that extra line will, of course, drastically reduce the number of trade signals you get out of this thing but the hope is that it will also drastically cut down the number of false reversals it leads you into. Combine this approach with a filter indicator, such as a good volume indicator to further reduce the number of false signals.

Whether an approach such as this is viable is something you will have to figure out yourself through a robust testing regimen, which will also give you an opportunity to try out tweaks to the approach, such as the distance between the overbought and oversold lines or the period of the CCI.

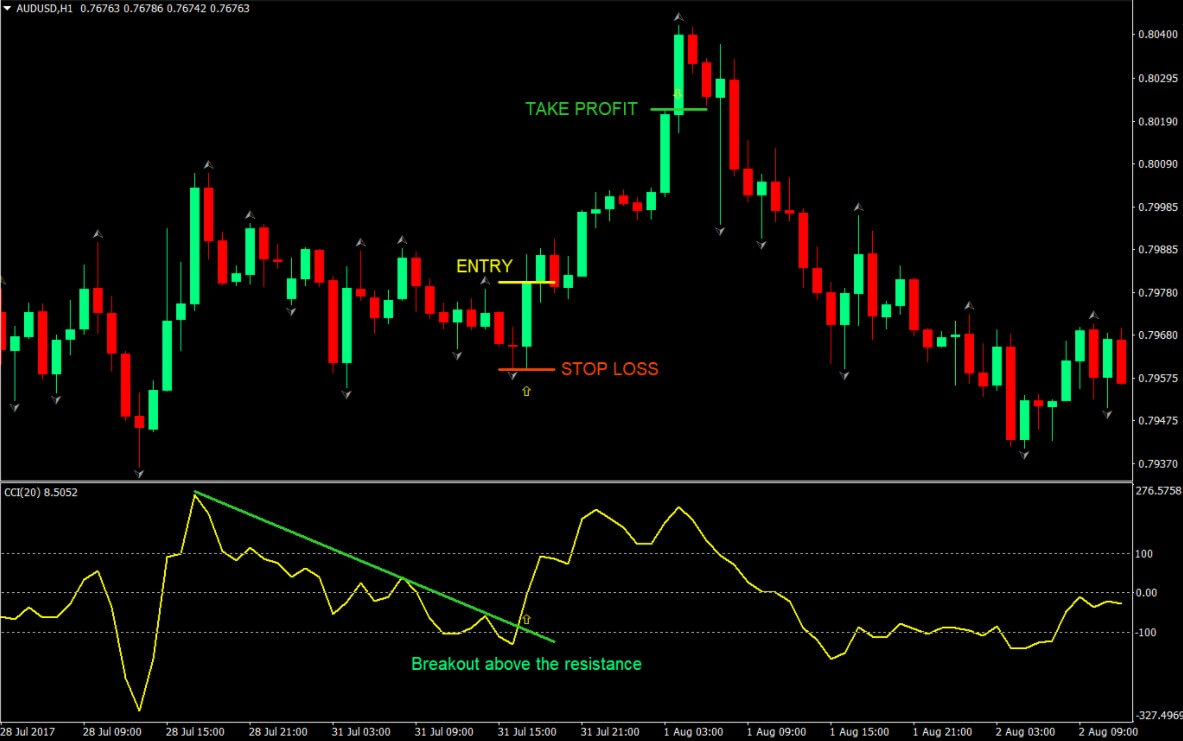
Breakouts with the CCI

Of the three most common uses for the CCI, hunting down breakouts from low or high bases is probably the most workable. The neat thing about this approach is that it works on a greater variety of timeframes, making it more appealing to a broader range of traders. The crux of the strategy is to wait until the market enters a high or low base (i.e. it goes sideways and forms a base after a strong movement upwards or downwards). Here the hope is that a signal from the CCI will confirm that the price is about to break out of the base and continue its previous movement. 

As with most other strategies using the CCI, this one also relies on the overbought and oversold lines at +100 and -100 but here the market conditions and how the price has been moving before the signal are critical. To enter a trade using this strategy, wait until the price forms a base after a strong movement in one direction or the other. In this example, let’s assume the market has gone to a high base after it has trended upwards for a while. If that’s the case, you are looking for the CCI to cross the +100 overbought line – and that’s your trade entry signal. To catch low bases, you are simply looking for the mirror image of this to occur, where the CCI crosses the -100 line after a low base has formed. Again, this is your signal that a breakdown from here is likely. 

As with anything in forex trading, there are a couple of problems with this approach. The first of these is that you are relying on the market to provide you with the right conditions for entry and that might leave you hanging around and waiting for quite a while. This is because in a market where there isn’t a clear trend, you will still get these signals but they will burn you if you use them outside of the price movement pattern described above. This makes the CCI a potentially useful indicator to have as a backup. You can use your usual setup to trade in more varied market conditions and then only pull the CCI out for those occasions when you feel you can really put it to work. Getting this right will, of course, take a lot of testing and long sessions in a demo account, making sure that this approach fits with the system you have in place and with the way you like to trade. 

The second serious problem is that even if you wait until the ideal conditions are in place, the CCI will still throw up false signals that will lead you into losing trades. You can mitigate this somewhat by waiting for it to cross the +200 or -200 line (depending on whether you’re looking at a high or low base). But this is a trade-off where what you gain in risk reduction, you lose in responsiveness. So, if you’re waiting for it to cut across an overbought or oversold line that’s further out, you might miss trades that would have been winners and you also might enter winning trades later, which could cut into your profits.

A third problem with using the CCI in this way is that it will cause you serious angst once you are already in a trade. Let’s say you followed all the rules, waited for a high base to form, waited for the CCI to give you your trade entry signal, and pulled the trigger on that trade. Now you’re in it, wondering how long you should stay in to maximise gains. Well, this is where the CCI can easily trip you up by tumbling in the other direction and crashing through that oversold line. This will look like a pretty hefty exit signal and many traders would take that as a sign that it’s time to bug out. But even if you do get out when it looks like the CCI is telling you, you could easily end up watching the price simply carry on in the same direction it was already going as though the CCI wasn’t even there. Well, that’s not a happy sight for any trader, you feel like you’re watching money you could have made simply sailing away. The trouble is these exit signals are often false. The upshot is that if you used the CCI to get you into a trade from a high or low base breakout, you shouldn’t also use it as an exit indicator. It simply won’t give you reliable enough signals for that.

Troublesome Hurdles or Insurmountable Problems?

So as you can see from these preferred strategies for using the CCI in forex trading there are different things you can use it for. It’s clearly easy enough to adapt to a variety of trading strategies and the sheer volume of suggested strategies out there on the forex internet tells you that this thing is popular. But, here’s the catch, just because something is flexible and popular doesn’t automatically mean it’s any good.

The first red flag that should pop up in your head when you look at the CCI is that it was designed well over a decade before the spot trading of forex was even a thing. Now, on its own, that doesn’t necessarily have to translate into a major problem for the indicator itself. You might even wonder whether the fact that it was designed so long ago doesn’t lend it a certain kind of venerability. Like, if it was designed so long ago and is still used today, doesn’t that mean it has survived the test of time? Well, let’s put it like this, how many items of technology do you use on a regular basis that are from the 1980s? Are you still using an 80s cell phone? Are you watching shows on an 80s TV? You might still have an 80s car in the garage and you might even love it but you know that it is by now a classic car and that if you really needed a car to do a job – because ultimately that’s what you need from an indicator – you’re going to want something more up to date. At the end of the day, the age of this thing should at the very least make you think, “Hey, I wonder if there are more recent, better indicators out there that are designed for what I need?” And, of course, there are.

That’s another thing about the CCI – not only was it designed in the early nineteen eighties but it was also designed with commodity trading in mind. At its most basic level, measures whether a security is overbought or oversold and that alone should make you think twice. Because, while it’s important to know if stocks or commodities are overbought and oversold since they have intrinsic value, this isn’t particularly useful for forex. That isn’t to say that there are no limits on the price of a currency, that the price can go as high or low as it wants with nothing holding it back. If the price movement in either direction is drastic enough, then a government or national financial institution is going to step in and try to rein it in. But that isn’t the same kind of thing as the limits of supply and demand that perform the role of, let’s say, natural checks and balances in the equity and commodity worlds. Moreover, that intervention might take a long time to get agreed upon and could come many thousands of pips down the line and even when it comes, it will bear no relationship to the overbought and oversold lines on your indicator. 

Now, these are pretty fundamental problems with the CCI but if its age and the fact that the way it functions is basically completely divorced from the way forex markets work aren’t enough to give you pause, there’s another thing for you to think about.

Circular Popularity

Reading all of this, you might be wondering, if it’s old and designed for different markets, why in the world would the CCI continue to be popular. There are a couple of main reasons for this. The first is that it is pretty popular in commodity trading where it is used pretty commonly and is more suited to doing a good job. What then happens is that traders who come over to forex trading from commodities are familiar with it and want to go on using it. So they try to make it work by bashing what is basically a square peg into a round hole. But they don’t just stop there, in addition to carrying on trying to use it for forex trading, they also make tutorials about it for youtube and sing its praises on forex social media.

The second reason it’s popular is simply because it’s popular. The forex internet can sometimes become its own little group-think bubble. Not only do people happily regurgitate what they’ve heard without actually giving it a try but they also often tell each other what they want to hear. Now, the first part of this is a big enough problem on its own because when lots of people – even people with a certain standing in the community, for want of a better term – talk about a thing as though its good they can amplify it to the point where the voices of those people who’ve tried it and might have something critical to say get drowned out.

Add to that the fact that there are people out there trying to get likes and views and follows and that they can do this by telling you what you want to hear and you’ve got a much more serious problem on your hands. There are no magic bullets in forex trading and no one indicator can solve all of your problems but if you put out a video or blog saying, “Hey, this indicator is a magic bullet that solves all your problems” then people are going to tune in. And not just that but you’re going to get way more viewers or readers than the guy saying, “you know what, this indicator doesn’t work too well”.

Lastly, this vicious popularity circle gets compounded by the fact that people are not too willing, generally speaking, to own up to their own mistakes and failings. So even in the comments under a blog piece or video or social media post you won’t get too many people saying, “Hey, I tried this and it didn’t work at all for me, in fact, I lost money using it.” This is pretty understandable since most forex traders are more likely to assume they were doing something wrong with the tool they were using than that the tool itself was the problem. That and no one likes shouting from the hilltops about something that went wrong – we’d all much rather boast about the things that went right.

But it goes further than that even because sometimes you will see people skating over the losses the CCI generates even in the videos and posts they put out to sing its praises. Sometimes you can see these on the very chart they’ve pulled up to show you how well it works but they’ll just mention them in passing or not mention them at all. Now, this is kind of cherry-picking is downright misleading – especially for people who are new to trading and who might not spot those losses because they’re working so hard to understand the wins properly. As disingenuous as this is, it still contributes to an indicator’s popularity because it gets people talking about it.

Okay, so it’s popular but not necessarily because it’s genuinely good – you’ve got that by now. But, in this case, popularity is a problem all on its own. You see when an indicator is as popular as the CCI (or a few others out there that also seem to draw a crowd even though they aren’t very useful) then people coming into trading see it and get it into their heads that this is all there is out there. If you’re just starting out as a forex trader and you see thousands of people out there talking about the CCI, you’re going to start to think that there aren’t other indicators that can fill this role. But nothing could be further from the truth.

So What Now?

First thing’s first. There is no harm in trying to understand how the CCI works and how you might use it in its optimal role. By trying it out harmlessly and at no risk to yourself or others in a backtesting/forward testing trial, you can view the whole process as an incredibly useful learning experience. Not only will you see what it can and can’t do but you will also learn something more about your own trading habits and the system you use will naturally evolve as you become more experienced.

That said, by testing this thing thoroughly, you will also be able to evaluate whether it can be put to use in some limited scenarios and in specific market conditions – such as, for breakouts from high and low bases as described above. Ultimately, however, the best thing to do would be to take the contents of this piece and use them as a springboard from which you can embark on a search for newer, better indicators. Rest assured, there are indicators out there that perform similar roles to the CCI but are specifically designed for forex trading and for integration with the kinds of platforms forex traders use.

All you need to do is get out there, search around, and do your own research and testing. After all, why would you use an old jack of all trades indicator designed for the commodities markets at a time when personal computers were barely a thing when you could instead find more modern, better tools out there for free on the internet. You will have to put in the work, of course, but the rewards are out there for the taking. 

Categories
Forex Service Review

Trend Improvement Indicator Review

We are talking again about another indicator designed for trend trading. The Trend Improvement indicator shows entry points and shows the levels of Takeprofit and Stoploss in the graph, as well as calculates the overall result of our trades. Trend Improvement is a good tool for testing input parameters, and it will also allow you to find the most cost-effective options based upon input parameters quickly.

Overview

It is clear that among thousands of indicators there is no universal indicator that is cost-effective across all currency pairs and long-term time frames. All universal indicators usually generate little profit on a few currency pairs or do not make any profit on other currency pairs in the long run.

Furthermore, it is common that indicators cannot function without long-term changes. Indicators need to be constantly adapted to new market behavior. After some time, all indicators need to be optimized for greater benefits. The concept of the idea is to let the trader find the best parameters for each pair and time frame by themselves. This clearly takes a long time, but the trading community can share the results in a public environment like MQL. In addition, traders do not have to buy an indicator, all this can be done preliminarily in a demo trial version.

Parameter & Proofs

In order to find the optimal parameters, it is best to perform tests. The developer of this indicator has performed various tests of the system parameters obtained during optimization on a sample of historical data other than optimization. The recommendation is to use data from the last two months. In the first month, you can find some of the best parameters. In the second month, you can check if these settings are appropriate or if they are already obsolete.

-When opening the strategy tester, select the start date and last date of last month. Periods of 1H and set the display speed to 1.

-Then you open the indicator property and set the maximum history bars = 528 (approximate number of bars in a month).

-The tests begin, if the results are not satisfactory, you can stop the tests, change the parameters, and start the tests again.

-If the results are good, you will need to adjust the display speed to the maximum and check the result in the last few months.

-If the results of the last month are good, then it can already be considered that these parameters can be used in real trade.

Service Cost

Trend Improvement Pro can be purchased for a single month for the price of $19 USD. This will provide you with a full month for testing. Should you like the indicator and wish to continue using it, three months of service can be purchased for the price of $39, saving you 32% off the price of a single month. For even more savings, consider purchasing a one-year service membership for the cost of $79 USD.

Conclusion

In short, we are talking about a very simple indicator, which we can configure to our liking and according to our trading preferences. There are many trend indicators in the market, so there is a lot of competition between them in the MQL market. With regard to this indicator, we recommend using the free version first and modifying parameters such as those mentioned in this analysis. If you want to rent it later, it can be done for 39 USD per year or 10 USD per month. This indicator is not available for sale.

Categories
Forex Service Review

True Currency Strength Meter Indicator Review

The True Currency Strength meter can be found in the Indicator section of the MQL5 marketplace. The indicator was first uploaded on the 15th of August 2017 by its creator Emir Revolledo, there have been a number of updates since its release, the most recent update was on the 13th of April 2018, which brought the indicator up to version 1.9.

Overview

The True Currency Meter is an indicator designed to be used with the MetaTrader 4 trading platform, it does not appear to be available for any other platforms. This indicator claims to be different from any other currency strength indicator as it looks at the currencies’ true strength.

The majority of strength indicators out there will look at the currency strength based on its pip movements, however, the True Currency Strength Indicator Meter understands that different currency pairs have different value pips, so it uses additional calculations to work out the strength based on the movements, but also the pip values, so a movement of 100 pips on a high-value pip pair will be stronger than a 100 pip movement on a lower value pip pair.

There is also an addition of both SMS and Email alerts available with this indicator. The indicator comes with a whole host of parameters that can be altered to change the way the indicator functions, this allows you to adapt it to more suit your own trading style and requirements. Some of these parameters include the time frame, the color of the currencies, fonts, sounds for alerts, whether to use email or SMS alerts, alert intervals, alert levels, and many more.

Service Cost

The True Currency Strength Meter will cost you $35 to purchase, this will give you full access and unlimited usage of the indicator. If you do not wish to buy it, you are also able to rent it, there is a monthly rental of $19 that you will need to pay for each month that you wish to use the indicator. There is a free demo version available, this will have some limitations but they are not stated on the page, we believe that the free version of the indicator may only be able to be used on a demo account and not a live trading account.

Conclusion

There are 25 reviews at the time of our writing, these reviews have given the indicator an overall rating of 4 out of 5 stars. 

Great product and great seller. Seller will go out of his way to reply. Support is 1st class, A++++++++++” – A 5-star review.

Indicator is very good but the Author doesn’t answer me on message. I asked several times to make one alert push alert system not only interval alert… but he doesn’t want to make it… I have been asked him for a long time ago! Pretty bad support.” – A 1-star review.

Very good signal and easy to use. Just put a little logic to it and can be used on a wide range. Can be used either as a fast signal for scalping or can do for long signals for day trading. User-friendly indicator. Very good support too. And usually replies in less than an hour. (I actually wonder why it got a bad review. lol) Overall, it’s a good job!” – A 5-star review.

So there is a mix of ratings, however, even the lower score ones are stating that the indicator works, it’s more the support from the creator that is lacking. There are 151 comments for the indicator, the creator does seem to be replying to them quite quickly which is, of course, a positive sign and goes against what the 1-star review mentioned. Even with so many positive reviews, we would highly recommend that you download and try out the free version, at least then you can make sure that it works for you and that it provides you with what you need prior to making a purchase or rental.

Categories
Forex Service Review

True Points Pro FX Indicator Review

True Points PRO can currently be found on the MQL5 marketplace under the Indictors section. It was created by Evgenii Aksenov and was first uploaded to the marketplace on the 21st of October 2019, it had its most recent update on the 13th of March 2020 and is currently on version 2.7 of the indicator.

Overview

True Points PRO can be used with the MetaTrader 4 trading platform, its main purpose is to determine the true pivot points of the markets. The indicator comes with built-in take-profit levels and will display profit information for the signals.

The indicator is usable with all currency pairs and different assets including indices, crypto, commodities, and more. 

The main parameters of the indicator:

  • Amplitude – affects the frequency of signals it is recommended to use 150
  • Calculation period (bars) – calculation period of the indicator on the history
  • Open/Close value level – the main parameter of the indicator to determine the frequency of signals
  • TakeProfit #1- profit level by a given value
  • Use TakeProfit #2 – a flag to switch on/off TP2
  • StopLoss -sets the loss level for TP1 and TP2
  • Multiple orders (Max number) – sets the max number of orders in a series
  • Step signal bars (to the next signal) -parameter to steps between entering points (triggers) “no closer than”

Service Cost

The indicator can currently be purchased for $75 which will give you limitation free access to it and it can be activated up to 5 times. Unlike many indicators on the MQL5 marketplace, there is no option to rent the indicator, the only option is the one-off payment.

There is a free demo version stated on the site, however, the details of it are not given so we are not entirely sure what the limitations are. It may only be used within the strategy tester.

Conclusion

There are 22 reviews for True Points PRO, these reviews have given the indicator an overall rating of 4.5 out of 5.

I have been testing this since early versions and I have to say the entries are great. Especially in higher timeframes H1+. Works very well and now without repainting.” – A 5-star review.

Terrible indicator, gives a bunch of wrong signals, trust me I tested many indicators and this one is out of scope, looks nice on a chart, the author not providing any help, don’t respond to messages…stay away.” – A 1-star review.

This is the very first indicator I’ve ever bought. It’s a great indicator and very profitable! Pair this with True Points Histogram for even better entries and exits!” – A 5-star review.

The majority of the reviews are every positive showing that the indicator is doing what it is meant to do, the main negative reviews are stating that the signals provided did not go the right way, no indicator or expert advisor will be right 100% of the time. In terms of comments, the developer of the indicator has been replying to the majority of the comments, showing that they are still supporting both the indicator and the customers.

While things are looking quite positive, we would still recommend that you download and try out the free version just to make sure that it is right for you before you make a purchase.

Categories
Forex Service Review

Ultimate Double Top Bottom Reversal Scanner Review

The Ultimate Double Top Bottom Reversal Scanner is an indicator that can be found within the indicators section of the MQL5 marketplace. The indicator was uploaded to the MQL5 marketplace on the 13th of February 2018 by FXsolutions, it was most recently updated on the 6th of October 2019 and is currently at version 1.11.

Overview

The Ultimate Double Top Bottom Reversal Scanner is an indicator, it can be used with the MetaTrader 4 trading platform and has been designed to scan up to 30 trading instruments over 8 different timeframes for the probabilities of reversal patterns.

The indicator only needs to be placed on one chart and it will function over the 30 different currencies, the indicator will send you alerts that you can customize whenever a signal is created. The indicator will use the Double Top/Bottom formation to create its signals.

There are a number of parameters that you can change, these will slightly alter the functions and display of the indicator. Some of the settings include alerts for various things such as for long or short signals, how the alert will be given (MT4, email or push), which timeframe to use, the template name, how often to check, and a few other options are also included.

Service Cost

The Ultimate Double Top Bottom Reversal Scanner can be purchased outright for $199, this will give you unlimited and unrestricted access to the indicator. There is also an option to rent the indicator, you can do this on a monthly basis which will cost you $49 per month, you are also able to rent it for a three month period that will cost you $89 for that timeframe.

There is a free demo version available, this will come with some limitations, unfortunately, the site does not indicate what the limitations are, we just know there will be some. It is always worth downloading and trying out the free version of the indicator or expert advisor.

Conclusion

At the time of writing, there were 8 user reviews, they have given the indicator an overall rating of 5 out of 5.

The scanner is very accurate and it is better to couple it with the Ultimate Top and Bottom Indicator.But where the scanner is incredible is that you can have until 30 custom pairs to be scan, on 8 timeframes !! No lag and easy to configure. Good good.“ – A 5-star review.

No repaint. And when used properly, this Double Top/Bottom Scanner proves itself to be a very effective and most helpful tool! Takes away the need to be glued to the monitor, flipping charts around different pairs and time frames hunting and waiting for Double Top/Bottom signals to appear. Great job!” – A 5-star review.

Points out exactly what it says it will. Masterfully done. Don’t think twice, the effort put in shows.” – A 5-star review.

The reviews are all very positive which is a great sign, there are also over 50 comments, the developer of the indicator is replying to the majority of them in a friendly manner and within a short period of time, this is a great sign as to the sort of customer support that you will receive should you purchase it. Even with all of these positives, we would suggest that you download and try out the free version, this will allow you to test it out and make sure that it functions the way that it is meant to and that you are able to get it set up and working before you make a purchase or rental.

Categories
Forex Service Review

Wolfe Waves Builder Indicator Review

Wolfe Waves Builder is currently located within the indicators section of the MQL5 marketplace. It was created by Mihail Moroz and was first uploaded on the 10th of April 2015. It has had a number of updates, the most recent update was completed on the 18th of February 2020 and is currently at version 3.2.

Overview

Wolfe Waves Builder is an indicator that can be used with the MetaTrader 4 trading platform, it will automatically plot Wolfe Waves onto the charts which will help to show trend reversals.

Some of the main features of the indicator:

  • It shows trend reversals, as well as the overbought and oversold zones on wave 5.
  • Automatically plots models and finds the Wolfe waves.
  • Price movement forecast.
  • Arrow and alert on wave 5 for novices, which prevents missing entries.
  • Efficient trading strategy.
  • Easy to use.
  • ZigZag is not used.
  • No redraws, no lags.
  • At the moment, this is the most perfect indicator of that sort.

There are also a bunch of settings and parameters available to alter, these include things like forex cleanup, enabling alerts, high and low periods, the draw channels, maximum bars to count, pivot points, and more.

Service Cost

Wolfe Waves Builder can be purchased with a single payment of $30, this will get you 5 software activations and no other limitations, If you would prefer to rent the indicator, this can be done on a monthly basis for $10 per month, or there is a three month period which will cost you $20 for the three months.

There is a free demo version available, the MQL5 site does not indicate what the free version offers, this normally means that it is only usable with the strategy tester but we cannot say that for sure.

Conclusion

The Wolfe Waves Builder currently has five reviews, these reviews have given the indicator an overall rating of 4.5 out of 5.

“An email alert on the formation of the 3rd point on the wave would make it a five-star product” – A 4-star review.

“This is a good indicator, does the job well.” – A 5-star review.

“This tool is undervalued!! must have” – A 5-star review.

The reviews are all very positive, which shows that the indicator is functioning the way it is meant to. There are also a number of comments, the developer has been putting their own information as well as replying to comments from people who have purchased or rented the indicator which is a great sign as to the kind of support you would receive should you decide to purchase or rent the indicator.

Categories
Forex Indicators

Parabolic Sar Need Not be Complicated – Read these Best Practices Today!

In forex trading, some indicators are a case study in making sure you’re using the right tool for the right job and what can go wrong when you take something at face value without doing your own research.

The Parabolic SAR is a great example of an indicator that absolutely crushes some traders – particularly beginners and traders who aren’t properly testing their tools. Like a lot of forex trading tools out there, the SAR is advertised as being good at one thing but it turns out that this superficial understanding of it leads you down a dead-end and can cause your portfolio serious harm if you use it wrong. And, just like a lot of other indicators out there, there may well be legitimate and effective uses for it that lurk beneath the surface but that you will never discover if you just use it out of the box, without taking the time to examine it properly.

This is precisely why the parabolic SAR merits a closer look. That means both that we’re going to talk about it here but also that you should put in the work and properly test how it can fit in with your trading setup.

What is it and Why is it?

There’s a recurring theme in the forex world and the world of trading in any kind of securities more broadly and that’s that the people who dream up and develop indicators and tools are just downright bad at naming them. So many times you’ll come across a tool or method or indicator and you’ll think it’s good at doing one thing because of what it’s called but, on further examination, you’ll realize that it’s actually no good at that thing and you end up using it for something completely different – sometimes you’ll straight up use it for the opposite of its intended application.

That’s kind of the case with the parabolic SAR, which is an acronym of Stop and Reverse. The indicator was the brainchild of pretty much the daddy of a whole host of technical trading indicators – you may have run into him before but if you haven’t, his name will still crop up often enough that you’ll end up remembering it anyway: Welles Wilder Junior. He came up with some of the most-used indicators out there, the Relative Strength Index (RSI), the Average True Range (ATR), the Average Directional Index, and, among them, the Parabolic SAR.

Now, it’s true that he came up with a lot of these indicators to assist equities traders rather than forex traders – they were mostly developed in the 1970s and 80s, well before spot forex trading was even a thing – but the fact that they are still so familiar to us today speaks to the fact that there is often still some value in them. And there is potentially some value in the parabolic SAR, it’s just that it may not be in using it as it was originally intended.

Wilder developed the SAR because he was looking for a way to measure an asset’s momentum in such a way that it would be possible to calculate the point at which it becomes more likely than not that the momentum would switch direction. The idea he had was that a strong movement in the momentum takes on the shape of part of a parabolic curve. A parabolic curve looks a little like a graph of exponential growth and traces a gentle arc from the near horizontal to the near-vertical. In the SAR, the momentum doesn’t always follow through the whole curve and might only mark out a section of it – nonetheless, that’s where the first part of its name comes from.

Wilder also noticed that when the price catches up to the curve mapped out by the momentum, the odds that it would change direction became higher than the chance of it continuing in the same direction. This meeting point of the momentum arc and the price is then the stop point and a reversal here becomes likely – hence stop and reverse.

Reversal Hunting

There’s one great thing about the Parabolic SAR that’s immediately obvious to everyone who comes across this thing and that draws traders into actually using it and that is that it’s almost ridiculously easy to read.

Now, to the more seasoned traders out there that might seem like a bit of a nonsensical thing to say, they would immediately see that as a red flag and be like, “well, you know what, just because something is easy to read doesn’t automatically mean that it’ll actually work the way it’s intended”. And they’d be right of course but once you’ve been trading a while it becomes kind of difficult to take yourself back in time and put yourself in the mindset of someone who’s just starting out.

Traders who have never seen anything like the SAR before will be immediately impressed with how clear and simple it is and how straightforward the signals it sends you are. And that’s its initial appeal – it looks like it does exactly what it was advertised to do and there’s zero input required from you the trader. You just plug it in and it’s ready to go.

On the surface of it, the SAR was developed as a reversal indicator that tracks momentum and then tells you, “hey, momentum has bumped up against price here, there’s a reversal unfolding”. And if you don’t look at it in any greater depth than that, this superficial approach to it is going to lead you down a blind alley where you could find yourself embroiled in some very serious losses.

The first thing to point out here is that reversal trading is a very dangerous, high-risk business and if you’re not 100% sure of what you’re doing, it is very hard to be in the small, elite club of traders that can make it reliably and sustainably work for them. If you are new to trading or even if you have a couple of years of experience under your belt and you decide to go hunting reversals using the parabolic SAR, you are doubly in trouble. Not only will you almost certainly run into big losses running reversal trading without an array of measures and systems (such as risk assessment, money management, and a thoroughly tested and evaluated toolkit of indicators and strategies) designed to cut back on bad trades, you will also be applying the wrong tool to the wrong job.

Reversal trading is not for the faint-hearted and it most definitely is not for beginner traders. But more than that, the parabolic SAR just isn’t a good indicator for the job. It will, almost without fail, call out reversals that are immediately followed by retracements – go test it out, it’s almost uncanny.

Alternative Uses

So if it sucks at doing what its name says it’s good at, what is the SAR actually good for? Well, those of you who have by now become accustomed to taking indicators for a spin around the testing range will be familiar with this one phenomenon that crops up all the time.

What happens, even with quite experienced traders, is that you’ll take a tool or an indicator and start backtesting it, and when you see it takes you into a trade, you’ll measure out how much of a win that trade would have been. So, if you see it take you into a trade that runs for, say 600 pips, you’ll say to yourself, “awesome, this thing is great, I just took home 600 pips!” Well, no, no you didn’t. If you were really making that trade in real-time, there’s no way that you would have taken all 600 pips of that run. Your trade entry and exit just cannot be that perfect in the real world. If you’re lucky, you might have grabbed half of it and taken a 300 pip win but more likely you’ll only have been able to realize something like a third of the whole movement and taken 200 pips.

Now, of course, the reverse is also true and you might have seen that move switchback early on just far enough to blow out your stops so you would have to count it as a loss. One would hope that you have the right money management approach to cut down on that loss by ensuring that you are going into the trade with the right stake that allows you to set your stops at a point that allows a bit of leeway in the price movement. The other thing that you can do here to maximize your win is to apply the right technical trading tools to ensure that you can reap as much of the reward as possible.

This is where the SAR comes in. Not, probably, as your primary entry indicator but more as a secondary, confirmation indicator that helps you to see out a trade to the maximum possible point. In short, you can use it as a trailing stop.

On your chart, the SAR will appear as a series of dots above and below the price that appears as lines – those are the sections of the parabolic curve that we talked about before. When the lines of dots cross the price line, they will flip across to the other side. In reversal trading, this is supposed to be a signal that a reversal is happening but – as we saw – that’s not the best way to use these things.

Context

It’s important to know when to use the SAR because, like a lot of other indicators, it only works in certain market conditions. The main thing to remember is to absolutely never use the SAR when the market is choppy. If you see that the market is ranging or heading sideways or even if there’s a weak trend then you are not going to want to use SAR because it will throw up lots of little false signals that will make it impossible for you to make any money out of the trades it leads you into.

So, the best way to approach the SAR is to use it once you have already identified a strong trend in the market and in conjunction with a primary indicator (or set of indicators) that will lead you into a trade. Under these conditions, the SAW can really shine.

When your system identifies a trade entry on a strong trend and you make the decision to pull the trigger, you can use the SAR as a continuation indicator to lead you down the movement to the point at which you can exit and still walk away with as many pips as possible.

To get accustomed to how this might actually function out in the real world, you will have to put in the work and try this thing out on your historical charts and through a demo account – making sure you combine it carefully with the tools you already use.

Round-Up

In short, the main things to take away from the SAR are that you should never ever use it in either of the following scenarios: a) as any kind of reversal indicator – it does not do this job well and it will lose you money; b) in any way shape or form if the market is not in a clear, strong trend – if there is any fuzziness to the market or even a weak, watered-down trend, don’t use the SAR.

But in its capacity as a secondary or confirmation indicator that you use as a trailing stop or continuation indicator that leads you through a trade you are entering (when the market is already in a strong trend), it has the potential to help maximize your wins.

Finally, make sure you test it for yourself and that it works in the system you have set up to suit your trading needs and preferences. If it doesn’t fit into this, never fear, there are plenty of other trend indicators out there that will do a similar or better job and all you have to do is get out there and find them.


Categories
Forex Service Review

PZ Lopez Trend Indicator Review

PZ Lopez Trend is an indicator that was created in December 2013 by developer Arturo López Pérez. Arturo López Pérez is a private investor and speculator, software engineer, and founder of Point Zero Trading Solutions. This creator has developed for the MQL market several trading tools, both paid and free.

This indicator follows the market trend fairly reliably, ignoring sudden fluctuations and market noise. It has been designed to trade trends in smaller intraday strategies and time frames (M1, M5, M15, and M30). His profit ratio is about 85%.

Main Features of the PZ Lopez Trend Indicator
  • It’s an incredibly easy tool to negotiate.
  • Its basic principle is to find situations of oversold or oversold.
  • It is prepared for noise-free trade at all times.
  • Avoid being whipped in intraday letters.
  • The indicator analyses its own quality and performance.
  • Implements a dashboard of several times.

The indicator is suitable for low-term trading, as it ignores sudden price increases or corrections by reducing market noise around an average price. The indicator does not need any optimization, as it is already optimized after multiple upgrades. It implements a multi-time dashboard. Implement email alerts – sound – push. The indicator is no painting and no repainting.

This indicator implements a trend tracking orientation suitable for small time frames that can penetrate very long trends in higher time frames, amplifying their gains.

Anatomy of PZ Lopez Trend indicator

This indicator shows a color line surrounded by a price band. The color line is the average price of security, and the price band represents the levels of oversold and oversold. If the average price is blue you should be looking for long trades (buyers) when the market is not overbought, and if the average price is red, you should be looking for short trades (sellers) when the market is not oversold.

A change in trend in the indicator is not a signal to negotiate or close opposing transactions immediately. The bands are used for this, for synchronization.

Technical Information:

  • The indicator evaluates each bar, not each tick.
  • The indicator has only one dropdown parameter with four possible values.
  • Implement visual, audio, email, and push alerts.
Conclusion

In short, we are talking about an EA that works by looking for trends, but with filters to avoid market noise and sudden price fluctuations. It works on all time frames, although its behavior is better in intraday operating time frames.

We have detected that the robot does not have good ratings from the users, so we cannot recommend this EA, due to this and the lack of a little more detailed information about the robot.

This robot is for sale on the MQL market at a price of 149 USD. You can also rent 1 month for 49 USD and 3 months for 99 USD. It is advisable to download the demo version available for free in order to know the behavior of this EA better and to be able to make a purchase decision or not.

Categories
Forex Service Review

Profile Volumes Market Indicator Review

Profile Volumes Market is an indicator that was created in May 2015 by developer Sergey Zhukov. The Profile volumes market indicator calculates the volume of ticks at each price level in a selected range. Volume is vital for determining the strength and therefore the importance of price levels.

The calculation range is established by the trader by scrolling two vertical lines. Thus the indicator allows following of the important levels in the different steps of the formation of the price of the symbol. A histogram of the volume profile can be displayed in the table (or removed from the table) by pressing the “ON” – “OFF” button. When the chart period is changed, the range of calculation of the indicator also changes, which is ideal when estimating the accuracy of the levels in lower time frames. The “||” button limits the calculation of the indicator to the visible area of the current graph. The color of the histogram is determined by the current price position relatively at the maximum level.

The parameters of change and relation allow customizing of the histogram. There are two modes of calculation of indicators. In Modetimer mode, the calculation of the indicator is based on the signal generated by the system’s internal timer, which allows you to work with it even when the market is closed.

In Modetick mode, the indicator is recalculated every minute, allowing you to track current changes in volume and check the operation of the indicator in test mode. The prompt automatically checks for “holes” in the quotation history and selects the smallest time frame with the full history as the basis, while the corresponding information is displayed in the comment.

Inputs from the Profile Volumes Market indicator:

  • Set mode – select indicator calculation mode.
  • Color level non – histogram color if the current price is equal to the maximum.
  • Color level bull – histogram color if the current price is above the maximum volume.
  • Color level bear – histogram color if the current price is below the maximum volume.
  • Color line from – color of the vertical line of the calculation range.
  • Color line to – color of the vertical line at the end of the indicator’s calculation range.
  • Coeff – coefficient of histogram display configuration.
  • Shift bars – the number of bars to move the histogram to the left.
  • Show comment – show the comment if there are “holes” in the dating history of the smallest time frame.

In short, we are talking about an indicator that sets average price levels over a given period of time. This indicator can be useful for all traders trading with the stock price. It is a useful tool to establish the price levels where the volume is concentrated, and that can therefore act as supports or resistors.

The opinions of users who have tried this indicator are quite positive, and this is because they value the tool as useful for their trading systems. On the other hand, Sergey Zhukov, the developer of this indicator, is very active in the forums of the market MQL and helps all users of its tool answering all series of doubts or questions.

This indicator is available on the MQL market at a price of 40 USD. It is not available for rent, but there is a demo version so you can test the tool and see how valuable it can be for your trading style.

Categories
Forex Service Review

RSI Trend Line Alert Indicator Review

Before talking about the indicator, it is important to remember that it is the RSI. The RSI measures the ratio of upward movements to downward movements and makes the calculation so that the index develops in a range of 0-100. It was developed by J.Welles Wilder. If the RSI is equal to or greater than 70, the instrument is assumed to be over-bought (a situation in which prices have risen more than expected on the market). An RSI equal to or less than 30 is considered to be a sign of asset overbooking (a time when prices have fallen more than expected on the market).

Contrary to popular opinion, the RSI is a primary indicator. The formula for the RSI indicator takes two equations that are involved in the formula solution. The first equation of the component obtains the initial value of the Relative Strength (RS), which is the ratio of the mean ‘Up’, is closed to the mean of ‘Down’, is closed during the periods ‘N’ represented in the following formula:

RS = Average of day closures ‘N’/ Average of day closures ‘N’

The real value of RSI is calculated by indexing the indicator to 100, using the following formula:

RSI = 100 – (100 /1 + RS)

After reviewing the operation of the RSI, we will say that this indicator is a traditional RSI update in MT4. You can alert and send notifications (if configured) when :

-RSI line crosses its MA line

-RSI Enter and Exit Overbought and Oversold Zone. These zones can be set by the entrance.

-RSI cross line for trend line and horizontal line.

It has two working modes: in Closed candle and Running candle. With Closed candle mode, it only alerts when a candle is closed. The trader will only have to draw a line (trend line) in the RSI indicator window, and the indicator will automatically find that line and check if it is crossed.

It is a straightforward and useful indicator. The line alert (trend line and horizontal line) is activated by default. The trader only decides to use or not the alert for MA cross or Overbought/Oversold zone enter/exit. It is so simple to jump to trading using the Forex RSI indicator, that novice traders often start trading without trying other parameters, or educate themselves on the proper interpretation of an indicator, due to the desire to earn money quickly.

As a result, the RSI has become one of the most poorly used MT4 indicators. Once correctly understood and applied, the RSI has the ability to indicate whether prices are trending, when a market is over-bought or oversold, and the best price to enter or exit a transaction.

It can also indicate which trading period is most active, and provides information to determine key price levels for support and endurance. The RSI can provide you with trend technical information as well as RSI buying and selling signals. It is crucial that you practice RSI trading strategies in a demo account first, and then apply them to a live account. In addition, RSI strategies can complement any Forex trading strategy you have already been using.

In short, we are talking about a primary and classic indicator, as many traders have started trading with its use. This indicator can help us in making buying or selling decisions and can be very useful in the beginning. This version of the indicator is available on the MQL market, in the indicators section, at a price of 30USD, or for rent at a price of 10 USD per month. It is an economic indicator as there are multiple versions of the RSI available on the market.

Categories
Forex Service Review

Real-Time Currency Valuation Indicator Review

Igor Korepin is the creator of this indicator, created in June 2015, although with several later updates. The developer presents this indicator thought in monetary indices, and it can also analyze and control the market situation widely.

The indicator displays indices of eight major currencies and can also calculate indices of any other currency, metal, CFD, etc. You won’t need to study dozens of charts to determine strong and weak currencies, as well as their current dynamics. The picture of the entire currency market during any period can be seen in a single indicator window.

Main Features

It forms indices of eight major currencies, automatically determining the indices of the current instrument, as well as the best indices available at the moment. You can display only the required indexes in option and one of the indexes not included in the main group.

It allows you to quickly switch to any currency pair or open a chart of the desired instrument directly from the control panel. The indicator works both in standard mode with historical data and in real-time mode with tick data.

The reference point and the drawing depth are established using a vertical line available for movement. It has an integrated set of classic technical indicators – MA, MACD, CCI, RSI, Stochastic. The market situation is monitored through an integrated system of notifications.

The prefixes and postfixes of a symbol are determined automatically. It is possible to select a currency, whose index will be used as primary in the calculations. Graph of the correlation dependence between currencies in one click.

Advantages

-It is very easy to use – you do not need to prepare for the first use.

-Quick navigation – choosing the required currency pair or opening a new chart is easy.

-Exotic instruments – analyze the movements of metals, oil, and other raw materials.

-Real-Time Mode – The tick chart of all coins shows the best times to enter.

-The situation is under control – allow the notification system and never miss a strong movement in the market.

-Only seven currency pairs for calculations – the indicator is useful and easy to use.

In summary, we are looking at a handy indicator and suitable for every beginner trader. Please, ease of use and a very friendly interface. Users who have tried this indicator have been, for the most part, very satisfied with it, so we think it is an indicator to consider in our list of favorite indicators.

We have only found one thing against, it is not for sale, it is only available for rent at a price of 35 USD for a period of 3 months. You also have a demo version for your free trial.

Categories
Forex Service Review

Scalper DSS (Dual Smoothed Stochastics) Indicator Review

Dual Smoothed Stochastics – indicator (DSS Bressert) is a modified indicator with an alert. You can use it in any time frame. Graphs M1 and M5 are recommended to make use of this indicator, while higher deadlines can be used for day trading.

The settings that come by default give a very good result, but the parameters can be modified by the user according to his personal preferences. It is essential that you identify the trend before negotiation, and open a trade in the direction of the correct trend only.

Stochastic Double Smoothing – DSS Bressert is an oscillator, this tool was presented by William Blau and Walter Bressert in two versions with some nuances between them. The calculation of the values of DSS Bressert is similar to the stochastic indicator, the difference is in the use of exponential double smoothing. The advantage over classic stochastic oscillators is the speed in responding to price changes in a still very uniform flow pattern.

In addition, extreme areas at the other end of the scale are achieved even in a strong trend quite often resulting in many signs of conformity with trends. In the double Stochastic smoothed – DSS Bressert, the values are the same as for Stochastic, where the values above 80 indicate the overbought state of the market, and the values below 20 indicate that the state of the market is in overbooking.

DSS Scalper is a Forex system for scalping traders. That is, short-term traders, where:

TF = M1 and M5 time frame

Takeprofit and Stoploss = 5 to 20 pips.

DSS Scalper trading in intraday:

  1. The interval of today’s days must not exceed the interval of 1 to 30 days.
  2. Green candles every day.
  3. MA histogram is BLUE.
  4. Price touch or go near the bottom red band.
  5. DSS points below 20 level and red turns.
  6. Buy Trade when DSS becomes blue and the bar is closed.

DSS Scalper Sales Rules:

  1. The interval of today’s days must not exceed the range of 1 to 30 days.
  2. Daily red candle.
  3. MA histogram is red.
  4. Price touch or go near the top band BLUE.
  5. DSS points above 80.
  6. Sell Trade when DSS becomes RED and the bar is closed.

DSS scalper output rules

  1. Departure when the price touches the opposite side of the band.
  2. Exit about 5-20pips.

In summary, Scalper DSS is an indicator that will provide us with signals of purchase or sale in very low temporary spaces, M1 or M5, with the aim of having little profit per trade, but doing several trades during the day. If we do not want this short-term operation, increased time frames can be traded intraday, doing fewer trades but with more profit in each.

In short, it is an indicator that adapts to the needs of each trader and is suitable for any type of trader, whether novice or professional. You can find this indicator in the Mql market, in the indicators section, and you can buy it for 35 USD, or 15 USD if you prefer to rent it for a month. Additionally, you have a free trial version so you can evaluate it before spending the money.

Categories
Forex Indicators

Currency Strength Meter Indicators: What You Need to Know

When you go ahead and type into the Google Currency Strength Meter, believe it or not, you will see that this tool gets over 14000 searches per month average. This is almost the same as one of the most popular indicators RSI. Can you imagine?

So, what is the currency strength meter?

This is the kind of visual map – guidance that demonstrates which currencies are strong and which ones are weak in a certain moment. It uses the exchange rates of different currency pairs to show comparable strength of each of those currencies. There are different Currency Strength Meters to be found out there. The simpler ones may not use any weighting, while more complex and advanced ones may apply their own weightings. Some may even combine other indicators with the currency strength measurement in order to provide trading signals. For example, to calculate the strength of the EUR – this tool would calculate the strength of all pairs that consist of EUR currency, and then use those calculations to determine the strength of the EUR.  

What this tool actually does is to give you information about 8 major currency pairs, mostly, based on the fact how strongly these currency pairs performed over a certain time frame. It tries to give you an overall picture of which currencies have been strong and which ones have been weak for those periods. For Currency meters, the most common time frame is 24 hours. The one that knows will notice that most similar to this tool are Forex Heat Maps – which essentially do the same thing.

As it may happen with any tool, Currency Strength Meters may have their own issues, particularly when they are poorly coded. If CSM cannot give accurate currency strength indicator values, it is of little use – regardless of their other features. With outdated Currency Strength Meters, traders may experience the following issues: MT4 can freeze, PC or laptop can freeze, stutters, whipsaw signals, memory leakage, your CPU keeps on 100%, and so on. Some of these tools that you can find out there might even produce data that were not part of the original concept of Currency Strength Meter. Some traders apply smoothing filters to this tool, like moving averages, for example, while some traders apply other filters like the RSI or MACD. By adding these filters on top of the CS meter, traders may even experience getting some false trading signals, and they can enter some bad trades which may lead to the money loss.

In years of existence, Forex strength meters developed to currency correlation matrices that could quite possibly deliver more accurate and better information, so this can be one of the ways to measure currency strength that a CS meter gives you. Since currencies are traded in pairs, for example, EUR/USD, you can use correlations to measure the strength of individual currencies like EUR and compare it to Currency Strength Meter.

Some advantages to using Currency Strength Meter including its obvious simplicity, are the usefulness as a short-term indicator, the ability to avoid double exposure and unnecessary hedging, the possibility to signal high-risk trades, and last but not least, it is available for free.

There is an opinion of certain traders that the most usual thing that new traders do when they discover these tools, they get an idea that the hardest thing in trading is to put some money on the account for start, and after that money just comes – drops from the sky in loads, you just need to apply this easy and cool tools. Indeed.  

They conclude that these are the tools that only tell you what just happened, not what is going to happen – suppose that this should help you profit in your trades? Their standpoint is that charts already give you this information. Actually, what they mean is that you have charts for 27-28 different currency pairs and this has been confirmed as better and more reliable than any Currency Strength Meter. Carefully built experience in trading, so far, has shown that brokers that make money by taking the other side of your trade very much love this tool – to put you on to use it frequently in order to make money on your trades.

From their point of view, how these tools work is that the meter is taking readings from every forex pair over the last 24 hours and applies calculations to each. Then it by algorithm finds the current strength in the pair and gives you a visual guide. It displays which currencies are strong and which are weak at any given moment, reflecting that movement in a gradually colored matrix. Only by using an effective currency strength meter, you will have another tool at your disposal that will empower you to become a profitable trader. You must admire the sound of it!

The claim is that another thing that can attract the novice is the simplicity that this tool has. It is quite easy to use it, even though it doesn’t give much of a result in practice, to be honest. Listening to this, the conclusion to be drawn is that Heat Maps and Currency Strength Meters are not very useful. If you wish to stick to it, after all, you can do it on your own and they wish you a load of luck because you will need it by far.

Now, what they say about the Currency Strength Indicator, is that it is a little bit different in the outer look. They explain it as a graph with an overview of the strength of a currency, presented with lines in different colors. It is just a line version of Currency Strength Meter. It measures the strength of a currency based on all of the currencies that are available with your Forex broker in the last 24 hours or the period setting of your choosing. It then applies calculation and assigns individual strength to each currency and presents information in an easily understandable way.

What this indicator actually does is to allow you to overlay several currency pair graphs (lines) on top of each other so you can see and try to predict where the price of a certain pair may go next. This also can be used as a two-lines cross indicator – a position where you would make a move after two chosen lines finish crossing each other, or as a reversal trade, when two different lines both appear at their extremes.

We gave this indicator enough of our time and attention and tested it thoroughly. Unfortunately, it doesn’t give results strong enough to rely on it and to base your future trades on its results. However, you may discover something we don’t know yet, and we are all different people. The systems each trader builds, even if based on the same ideas are also different. If you like the idea of it, our suggestion is to try, to test it and see where it will get you. It could be worth trying. 

Some prop trading firms use individual currency baskets, also called currency index. Traders may be familiar with the dollar index, DXY, but other major currency indexes are not common. By analyzing how each major currency is holding against the others in the form of a simple chart, prop traders have an insight on what currency they should be trading. Custom currency baskets can be easily made using the now-famous Tradingview platform.

What you can do, also, is to go out to search for other places where different versions of Currency Strength Indicators can be found. Choose a couple, or more, that you like, download them, and start to test them. Try to test the indicator, up against a chart and see how it performs on its own first, before testing it out against other indicators or with other indicators.

You will certainly get better results by adding any momentum indicator that has enough volume behind it. We suggest doing the back-testing standalone and after that, test it together with the volume indicator already attached and measure test results when you are showing enough volume to do so. This thing should give you a million of false signals when there is no real volatility in the market. By our experience so far, it should make a big difference in overall results and this could be the most efficient way. Even though we don’t truly endorse it, there is a possibility that it might work for you.

This indicator is very unique to most of the indicators out there and should be handled accordingly. The conclusion from this would be that Currency Strength Meter is a sort of useless standalone, redundant and it is made only to get the novice in trading excited and in a better position to lose their money very fast.

Currency Strength Indicator could be, possibly, a little better – it may be worth testing if you choose to do it wisely and properly. The currency strength indicator is not an indicator that should be used on its own. Rather, this indicator can complement your existing trading strategies and could help you to pick the right combination of the currency pair to strength.

Categories
Forex Indicators

Guide to Finding Trend Indicators

As an invested trader or a keen observer, you probably recognize the importance of understanding and using indicators in forex trading. Thankfully, owing to a plethora of available information, you can feel relieved knowing that such an abundance of sources may actually save you from months or even years of hard work (and quite a few losses too). Quite naturally, to be able to start trading, you really need to see where you are standing with regard to your level of skills and knowledge.

However, rest assured that, in terms of indicators, there is a definite list of types you should focus on, as well as the right approach to interpreting charts and following trends. Note that some expert traders do not rely on secondary indicators. Their primary source of information is Price Action and only occasionally use an indicator or two to support Price Action patterns. The article assumes you know how to handle the most popular trading platform, the MetaTrader 4/5.

One of the key points where traders often misinterpret the advice they come across is that indicators always work. This is true to a certain degree, of course. Before you read or watch any material on the topic of forex, you must think about what types of information you should be looking for are. That further implies that you must be aware of what your needs and goals are as a trader. Understanding how the fiat market functions is also a vital prerequisite to being able to make use of indicators, i.e. profit from forex trading.

Another essential principle of this market of which traders should become conscious as early as possible is that trading revolves around trends, not reversals. Many studies have confirmed that trend following is the most profitable course of trading. It is each trader’s task to learn how to read into these trends because these skills will essentially bring out the lucrative side of this business. Even more importantly, indicators are useful and much-needed tools, yet the way they are combined will eventually equal the amount of financial reward. Therefore, if you learn how to combine trend indicators effectively, you can achieve some amazing results.

Although each trader will need to put a great number of hours into grasping the complexity of this market at the beginning of their career, the purpose of learning about trend indicators is to reap quite a few benefits afterward. As an experienced trader, you may not need more than 10 to 15 minutes during the day to see how your efforts lead to profitable outcomes. In the end, everything boils down to the question of whether you want to sacrifice your time or money doing any other job. If the answer is neither, then you know that learning how to trade currencies properly is a crucial step.

Every trader will work towards understanding the degree of the risk involved in their everyday trading. This step is particularly important because you will need to set the limit, which will essentially help you know what the right time to stop is. Indicators alone are thus insufficient unless you become aware of your boundaries and your goals first.

Once you decide on your priorities and preferences, you can allow yourself to start searching for the right indicators that you will use eventually to build up your own algorithm. To achieve this, you will need to check various blogs and websites, as these sources of information often complement each other. Unfortunately, the search for the right indicator rarely ends here as you still have to think of a few other key points on your path to becoming an expert trader.

Firstly, you should pay attention to indicators that offer too many signals and thus push traders into starting off too early. Some others do the opposite by not alarming you to make a trade on time, which equally defective and dissatisfactory. In addition, if your indicator provides a narrow selection of information, it does not necessarily imply that these trades will be beneficial.

An example of great indicators is the one which can give you great signals and, at the same time, prevent you from trading during unstable periods. This is extremely important for the times when a price may be going in one direction, but the big banks unexpectedly get involved and completely change the prices’ direction without any prior warning or news event. An indicator able to avoid false trends and save you from these sudden price changes is the type of indicator you should strive to find and use in your trading.

Unfortunately, a surprisingly vast number of available indicators have proved to be impractical and of no use in reality. Created by programmers who often do not do any trading themselves, such indicators fail to provide the type of information traders necessitate. Nonetheless, most of the remaining ones can actually be quite useful with some additional adjustments, which all traders learn how to make after a while.

Despite the fact that the vast majority of indicators demonstrated poor performance, all good indicators typically fall into three main groups: 1) zero-line cross, 2) mutually crossing lines, and 3) chart indicators, which will be discussed in detail. In case the indicator you are thinking of using does not belong to any of the three, you may want to avoid it to evade any money-related losses. You may, nonetheless, use the following descriptions to see how good indicators function with real charts and currencies and decide to test them yourself later.

Categories
Forex Market Analysis

Daily F.X. Analysis, August 24 – Top Trade Setups In Forex – Choppy Sessions In Play! 

On the news front, the market isn’t expected to offer any major economic event today; therefore, most of the market movement is likely to be based upon technical levels. Choppy sessions are expected today.

Economic Events to Watch Today  


EUR/USD – Daily Analysis

The EUR/USD closed at 1.17953 after placing a high of 1.18828 and a low of 1.17539. Overall the movement of EUR/USD remained bearish throughout the day. The EUR/USD pair dropped on Friday and bottomed at 1.1753; it’s lowest since August 12. A stronger U.S. dollar and the poor economic data from Europe weighed on EUR/USD pair.

At 12:15 GMT, the French Flash Services PMI for August fell to 51.9 from the expected 56.3, and the previous 57.3, weighed on Euro. The French Flash Manufacturing PMI also declined to 49.0 against the estimated 53.0 and previous 52.4 and added pressure on single currency Euro.

At 12:30 GMT, the German Flash Manufacturing PMI rose to 53.0 from the anticipated 52.2 and supported Euro; however, the German Flash Services PMI came in as 50.8 against the expected 55.3 and weighed on Euro on Friday.

At 13:00, the Flash Manufacturing PMI for the whole Eurozone declined to 51.7 in August from the projected 52.7 and previous 51.8. The Flash Services PMI for the whole bloc also fell to 50.1 against the forecasted 54.6 and added pressure on EUR.

Apart from German Manufacturing PMI, all the PMI from the whole bloc, including biggest economies, came in against EUR, and hence, EUR/USD pair suffered. The data showed that only German manufacturing activity was expanded in August. At the same time, other countries, along with whole euro bloc’s manufacturing & services activities, were contracted in August. Meanwhile, the greenback was the top performer on Friday with DXY up by 0.5% on 93.5 level, the highest since Monday.

The U.S. Dollar was already supported by the release of Fed Meeting minutes on Wednesday, and on Friday, the support was extended after the release of positive PMI and Home Sales data.

At 18:45 GMT, the Flash Manufacturing PMI and the Flash Services PMI were released from the U.S. The Manufacturing PMI surged to 53.6 against the expected 51.9, and the Services PMI was surged to 54.u from the 50.9 forecasted. The expansion in the Manufacturing & Services sector of the U.S. gave strength to the U.S. dollar. At 19:00 GMT, the Existing Home Sales in July exceeded the expectations of 5.40M and came in as 5.86Mand supported the U.S. dollar.

The strong U.S. dollar exerted more pressure on EUR.USD prices and dragged them down at the ending day of the week. Meanwhile, the Euro currency was also under pressure because of the resurgence of coronavirus cases in Europe. In recent days France, Germany, and Italy have experienced their highest daily case counts since the spring, and Spain has found itself amid a major outbreak.

Over the past two weeks, Spain has seen Europe’s fastest rising caseload with 142 positive cases per 100,000 people. The number had risen more than 3,000 by the time the state of emergency ended on June 21.

The EUR/USD pair was also under pressure on Friday because of the possible entry of a new phase of the pandemic in Europe. 

Daily Technical Levels

Support Pivot Resistance
1.1787 1.1797 1.1807
1.1777 1.1817
1.1767 1.1827

 EUR/USD– Trading Tip

The EUR/USD pair fell sharply from 1.1954 level to 1.1790 level. For now, the pair is likely to find an immediate resistance at 1.1806 level, and a bullish breakout of 1.1806 level can lead EUR/USD prices towards 1.1886 level. On the lower side, the violation of the 1.1751 level can extend the selling trend until 1.1706.


GBP/USD – Daily Analysis

 The GBP/USD pair was closed at 1.30884 after placing a high of 1.32550 and a low of 1.30588. Overall the movement of GBP/USD pair remained bearish throughout the day. At 04:01 GMT, the GfK Consumer Confidence in August declined to -27 against the forecasted -25 and weighed on British Pound and added in the losses of GBP/USD pair. At 11:00 GMT, the Public Sector Net Borrowing increased to 25.9B from the expected 28.3B and supported British Pound. The Retail Sales for July also increased to 3.6% from the forecasted 2.0% and supported British Pound.

At 13:30 GMT, the Flash Manufacturing MI from Britain exceeded the expectations of 54.0 and came in as 55.3 and supported GBP. The Flash Services PMI also rose to 60.1 against the estimated 57.0 and supported GBP. At 15:00 GMT, the CBI Industrial Order Expectation in August was declined to -44 from the anticipated -34 and weighed on GBP/USD pair and added in its losses on Friday.

On the other hand, at 18:45 GTM, the Flash Manufacturing PMI from the U.S. surged to 53.6 from the anticipated 51.9 and supported the U.S. dollar that weighed on currency pair. The Flash Services PMI also surged to 54.8 against the anticipated 50.9 and supported the U.S. dollar. The Existing Home Sales exceeded the estimate of 5.40M and came in as 5.86M and supported the U.S. dollar that ultimately weighed on GBP/USD pair.

Meanwhile, on Brexit front, On Friday, the British and European Union negotiator made slight progress towards the post-Brexit trade deal in talks this week. Both sides were concerned that time to reach an agreement was running out before an end-year deadline.

The E.U. Chief negotiator, Micheal Barnier, said that those who were hoping for negotiations to move swiftly forward this week would be disappointed. However, his British counterpart, David Frost, said that a deal on post-Brexit relations was still possible and was still London’s goal, but it would not be easy to achieve.

Frost said that several significant areas remain to be resolved, and even when there was a broad understanding between negotiators, there was still much work to do as a time for both sides was short.

Britain shifted to be the leading country to ever leave the European Union on January 31 after 46 years of membership. Both sides are now negotiating a new partnership to be effective from 2021 on everything from trade and transport to energy and security. If both sides failed to reach an agreement, Britain would follow the World Trade Organization’s rules.

The attest round of talks between the U.K. & E.U. was also not fruitful, and it has decreased hopes for a post-Brexit deal. It means the hopes about the no-Brexit deal returned in the market and weighed on GBP/USD pair that caused a sudden fall in its prices on Friday.

The U.K. economy is also under pressure as the furlough scheme that has protected millions of jobs is scheduled to end in October. This would hit the labor market and increase unemployment, making it difficult to recover from the record 20% slump in the second quarter of this year.

These fears have also weighed on single currency Pound and kept the pair GBP/USD under pressure.

Daily Technical Levels

Support Pivot Resistance
1.3082 1.3092 1.3103
1.3071 1.3113
1.3062 1.3124

 GBP/USD– Trading Tip

On Monday, the GBP/USD pair is trading sideways above a strong support level if 1.3072. The support here is extended by 1.3074 level, where the bearish breakout of 1.3074 level can extend selling unto 1.3007 level. On the higher side, the next resistance is likely to be found around 1.3155 level. The 50 EMA and the technical indicators such as RSI, MACD, and 50 periods of EMA suggest a selling bias in the Cable. Let’s consider taking selling trades below 1.3075 level, while buying can be seen if the GBP/USD pair continues to close candles over 1.3075 level. 


USD/JPY – Daily Analysis

The USD/JPY pair was closed at 105.789 after placing a high of 106.070 and a low of 105.439. Overall the movement of USD/JPY remained almost flat yet slightly bullish. On Friday, the USD/JPY pair dropped in the first half of the day after the release of Japanese Manufacturing PMI and the persisting uncertainty due to ongoing geopolitical tensions. However, in the second half of the day, the USD/JPY pair recovered its early daily losses and rose to post slight gains amid better than expected U.S. economic data.

AT 04:30 GMT, the National Core CPI for the year declined to 0.0% from the estimated 0.1% and weighed on Japanese Yen. At 05:30 GMT, the Flash Manufacturing PMI from Japan in August rose to 46.6 against the estimated 45.0 and came in favor of Japanese Yen. The improvement in the manufacturing sector in Japan gave a push to Japanese Yen and dragged the pair USD/JPY to the lower level near 105.400.

However, after the release of positive macroeconomic data from the U.S., the USD/JPY pair started to rise and converted its daily losses in gains. At 18:45 GMT, the Flash Manufacturing PMI in August rose to 53.6 against the projected 51.9, and the Flash Services PMI rose to 54.8 against the anticipated 50.9.

The expansion in the U.S. manufacturing and services sector gave strength to the U.S. dollar that was more supported by the release of U.S. Existing Home Sales data. The Existing Home Sales in the U.S. for July rose to 5.86M from the anticipated 5.40M and gave a push to the U.S. dollar that added strength in USD/JPY pair.

The U.S. Dollar Index (DXY) that measures the value of the U.S. dollar against the basket of six major currencies rose by0.5% on Friday towards 93.5 level. It also helped USD/JPY pair to recover some of its daily losses on Friday.

Meanwhile, the ongoing geopolitical tensions between U.S. & China, along with the U.S. & Iran tensions, also kept the pair USD/JPY under pressure at the ending day of the week. On the US-China front, the US Trump administration denied acknowledging the plans to meet China over the discussion of implementations of the phase-one trade deal. The U.S. Commerce ministry spokesman Gao Feng said that in the coming days, the U.S. & China would hold meetings to discuss phase one trade deal.

However, the denial of any such meeting by Trump Administration added uncertainty in the market and kept the pair USD/JPY under pressure.

N the other hand, the U.S. called all U.N. sanctions to be restored on Iran after a violation of the 2015 nuclear deal. However, 13 out of 15 U.N. council members wrote against the U.S.’s request to impose sanctions on Iran as in 2018; the U.S. ended its legal terms with the 2015 nuclear deal by calling it the worst deal ever.

Meanwhile, the Chairman of China Banking and Insurance Regulatory Commission, Guo Shuqing said that the U.S. had placed domestic laws above international laws, which will affect the Chinese people and affect the whole world people including Americans. Shuqing also mentions that these sanctions by the U.S. on Hong Kong lacked legality and violated the market economy’s principles. The ongoing geopolitical tensions increased the uncertainty, which supported the Japanese Yen safe0haven status and contributed to the flat movement of the USD/JPY pair on Friday.

Daily Technical Levels

Support Pivot Resistance
105.7700 105.8500 105.9500
105.6700 106.0300
105.6000 106.1300


USD/JPY – Trading Tips

The USD/JPY is trading sideways in a broad trading range of 106.300 to 105.240. At the movement, the USD/JPY is tossing above and below 50 periods EMA, while the RSI and MACD are in support of a neutral trend. The recent series of Doji and Shooting start candles are suggesting indecision among traders. Sooner or later, we may see USD/JPY prices break out of the range. Once it happens, the USD/JPY may trade bullish over 106.300 to target 107.084. On the lower side, violation of 105.240 level can drive selling unto 104.300. Good luck! 

Categories
Forex Indicators

Which Indicator is Best for Trade Management and Risk Measurement?

Out of the thousands of indicators out there that technical forex traders add to their charts, there is one that is often overlooked. Sometimes even ignored. Indeed, though it is used relatively frequently, many traders often forget that it is part of their process. Yet, in reality, it is one of the most important indicators to have in your toolkit.

That indicator? It is, of course, the ATR.

What Is ATR?

Many of you will, of course, already know what ATR is and how it works as well as you know the back of your hand. It never hurts, however, to refresh that knowledge and take another look at it. Put as simply as possible, Average True Range is a measure of volatility. What it does is take a look at the last fourteen candles (it doesn’t have to be fourteen but that’s usually the default setting) and tells you how much movement there has been. This will be expressed in the number of pips the currency combination you have selected has moved, on average, over those last fourteen candles.

It’s a moving indicator so you need to take care when you’re measuring it and whether the most recent candle is throwing off the rating in some way. So, if you’re day trading, for example, it is best to wait to measure the ATR just as the candle you’re currently on is coming to a close. That way your measurement is of fourteen complete candles – which will give you the best reading.

And that’s it. It’s that simple.

But Why Is ATR So Important?

The thing is, ATR is simply not one of those glamorous indicators. Which is probably why it often goes so unnoticed. In fact, many traders don’t even have it up on their chart the whole time. But that doesn’t mean it isn’t a key part of their system. Perhaps even the most crucial one. That isn’t to say that it is the best indicator or some kind of silver bullet. But it needs to be part of your system because it provides you with two key pieces of information.

Firstly, by telling you how much a currency pair is moving over a given period, it can help you to make sense of your other indicators and tell you when to trade – or rather, when not to. For example, say a currency pair has already moved beyond its average range but your strategy is signaling that you should go long. Combining the ATR into your other indicators can help to show you whether what you’re dealing with is a breakout or whether it would be better to go short or simply not trade at all.

But, here’s the key thing. The ATR is not a silver bullet. No indicator on its own is. It must be just one part of your strategy and not the driving force behind it. You shouldn’t use the ATR on its own to decide whether you should pull the trigger on a trade or not. If you think any single indicator can do that, perhaps it’s time to duck out of trading altogether or, at the very least, get back to the classroom.

It is also useful to give yourself a little history lesson and use the ATR to explore how a currency pair has performed in the past under different circumstances. Crosscheck that with any significant news events you know about and it can provide a useful picture of the volatility of a currency combination – ultimately helping you to have a better understanding of what to expect.

Managing Risk

The second useful thing the ATR can give you – and according to some this should actually be its primary function – is that it can help you to manage how much you risk on a given trade. You should not make a single trade without consulting it. So, how does that work? Well, let’s say you’re doing everything right. You’re avoiding being drawn into trading with the herd. You’re ducking and diving and staying clear of the big players are – avoiding those hotspots where everyone else is trading. 0You’re using your system to identify when the optimal moment is to trade – getting all of your indicators to line up to make sure it’s the right moment and whether to go long or short.

Before you pull the trigger, you need to know how much to trade. And that’s where the ATR comes in. You need to factor it into the process you go through – make it part of your checklist – because in that sense it is probably the most useful indicator you have. It allows you to gauge risk in a measurable way so that you can improve how you manage your money and the amount that you invest per trade for any given currency pair. Now, the number one question here is how much money you put on a trade. But it doesn’t make sense to speak in terms of dollar amounts in this example. The ATR can’t tell you to put, say, USD 5,000 on a yen vs. pound trade. Neither does it make sense to talk in terms of lots, because a lot on the pound/dollar pair will be a different amount to a lot on another currency pair. Instead, it’s better to think of how much you are trading per pip.

To do that, compare the ATR for two currency pairs. For the sake of the example, let’s take a commonly traded pair like GBP/USD. Depending on what’s happening in the news cycle but assuming no dramatic news has been happening, this pair is likely to turn out a pretty low ATR. Perhaps something like 14 pips. If we compare that to the ATR of a more volatile pair, for example, GBP/AUD, here we might see an ATR of 115 pips. Some pairs will blow that out of the water and will easily generate ATRs of 200 or 300 pips regularly. And a lot of traders will look at that volatility and will steer clear of trading in those waters.

Sticking with the example of the dollar/pound and pound/Aussie dollar pairs, it doesn’t take a mathematical genius to look at the ATR and see that 115 pips is about eight times as many as 14 pips. That means the pound/Aussie is moving about eight times as fast as the dollar/pound. As we would expect given the respective volatilities of these pairs. So, armed with that knowledge, how do we trade it? It couldn’t be simpler. Let’s say that in this example you’re trading the dollar/pound at 16 dollars per pip. You can trade the pound/Aussie with full confidence, simply by trading it at eight times less. In short, when trading a faster currency pair, use the ATR to modify your per pip trading amounts to correspond to the increased volatility. In so doing, not only are you managing risk but you are also managing your overall approach to trading.

A Whole New World

Many, if not most, traders out there – particularly the less successful ones – start off by trading equal amounts per pip on different currency pairs, without taking into account the different speeds at which they move. This makes no sense. To all intents and purposes, by doing that they are saying that they have equal confidence in their trades across currency combinations of different volatilities. The danger that exposes them to could really take a chunk out of their account very quickly indeed if things go south. Traders who do that are taking on unnecessary risks because they are not mitigating the risk of greater volatility.

The ATR allows you to see that risk and modify your behaviour accordingly. It can be a tool for managing how much you trade per pip on a given pair and, consequently, it allows you to profile your trades for risk. This ability can introduce you to a whole new world of more exotic currency pairs because it enables you to broaden the spectrum of the pairs you trade. Placing the right amount of money per pip on a trade mitigates the risk of volatile pairs and means that you can add new currency combinations to your trading schedule without the fear of being towed under by fast-moving pairs.

In a Nutshell

The most important thing to take away from all of this is that managing risk and managing your money are the most important functions you have when you approach forex trading. If you can get these two right, you can separate yourself from the less successful or outright unsuccessful traders. It is the thing that will ultimately determine whether your forex trading career is going to result in more money in your bank account or less. And the primary tool you have at your disposal for mitigating risk and managing the money you invest in trades is the ATR. Even if you don’t have it on your actual chart – and many traders chose not to – you should still use it for every single trade you make.

Categories
Forex Indicators

The 5 Best Forex Indicators

Forex indicators use mathematical calculations to measure things like volume, exchange rates, open interest, etc. about a currency pair to let traders know if they should enter or exit a trade. There are a lot of different indicators out there, such as Bollinger Bands, Stochastic oscillator, Relative Strength Index (RSI), and many more. Most people use indicators to help make more confident trading decisions without as much guesswork.

Those with programming skills can create their own software to run on the MetaTrader 4 or 5 platforms, which can make your life as a trader much easier. Of course, those that aren’t interested in developing their own software can rent or purchase indicators for a low price in most cases. If you’re looking at indicators, you’ll want to choose one that is suited for your personal trading strategy. In our opinion, the most useful indicators work with many different strategies while offering clear signals and helpful information. Below, we will go into detail about the five best indicators that are available.

Moving Averages

Moving averages gauge momentum and define areas of support & resistance in the market. These indicators are primarily used to give one an idea of the underlying direction or trend of the market. Traders can also use one or more moving averages for trading signals, for example, the point where a shorter moving average crosses above or below a longer moving average.

There are five main types of moving averages:

  • Simple moving average (SMA)
  • Exponential moving average (EMA)
  • Weighted moving average (WMA)
  • Smoothed moving average
  • Hull Moving Average (HMA)

Moving average is a lagging indicator, meaning that it reacts to events that have already happened, rather than predicting future events. The indicator focuses more on confirmation and analysis.

Relative Strength Index (RSI)

The RSI has been a favorite trading indicator for many traders since it was created by analyst J. Welles Wilder in 1978. It is a momentum-based indicator that compares the amount of a currency pair’s most recent exchange rate increases against its most recent exchange rate drops. This helps it to identify overbought or oversold conditions in the market.

The RSI is displayed as a line on a graph that moves between two extremes with a reading from 0 to 100. Traders usually interpret a reading above 70 as an indication that a security is being overbought, which will likely result in a trend reversal or corrective pullback in price. A reading of 30 or below would, therefore, indicate oversold or undervalued conditions in the market.

Bollinger Bands

John Bollinger developed the Bollinger Bands technique in the 1980s. The indicator uses a moving average with two trading bands above or below it to add and subtract a standard deviation calculation. Bollinger Bands measures volatility so that it can adjust to market conditions and provide all needed price data between the two bands.

On a chart, you’ll see a centerline, which is an exponential moving average, with two price channels (or bands) above and below it. The two price channels are the standard deviations of the asset that is being looked at. Volatile price action causes the bands to expand, or contract when the price is bound into a tight trading pattern. Looking at examples online can help one to recognize these patterns.

Moving Average Convergence Divergence (MACD)

The MACD indicator is a trend-following, momentum-based indicator that shows the relationship between the two moving averages for an instrument’s price.
The indicator comes up with its calculation by subtracting the 26 period EMA (Exponential Moving Average) from the 12 period EMA, resulting in the MACD line. It also includes a smoothed moving average (SMA) line of 9 periods to signal trades.

The Stochastic Oscillator

A Stochastic oscillator is a momentum-based indicator that compares the closing price of a security against the range of prices it experienced over a specific time period. The primary use of this indicator is identifying overbought or oversold conditions and providing trading signals.
The indicator provides traders with a number that ranges from 0 to 100. Readings over 80 are considered to fall in the overbought range, while readings of 20 or less are considered undersold. Of course, the exact line where one would consider conditions overbought or oversold can fall to personal interpretation. The indicator consists of two lines. One reflects the value of the oscillator for the session, the other reflects its simple three-day SMA.

Conclusion

Throughout this article, we have identified some of the best indicators that one can have at their disposal: moving averages, relative strength index (RSI), Bollinger Bands, moving average convergence divergence (MACD), and the stochastic oscillator. Several of these options are momentum-based and they can help to identify trends and overbought or oversold conditions, or to provide helpful trading signals. If you plan on using any of the indicators we have outlined above, be sure to check out some visual examples online first. On the contrary, if you’d prefer to trade without the use of any indicators, then you should consider naked trading.

Categories
Forex Service Review

Mr Top Bottom Non-Repainting Indicator Review

Mr Top Bottom is an indicator that was created in March 2019 by developer Mostafa Fouladi. Mr Top Bottom is a powerful no-paint indicator that draws arrows on Tops and Bottoms. It has too complicated calculations but is very simple to use. Each arrow has a specific impact value of 1 to 10. If the impact is greater it means that the signal is probably more reliable, because it is calculated on the basis of a larger oscillation.

Overview

Main features of Mr Top Bottom:

  • He doesn’t paint again.
  • Identify the best tops and bottoms.
  • Useful for Trend Trading and Swing Trading.
  • Works well in Up Trend Market, Down Trend and Non Trend Market.
  • It works on any symbol and in any time frame.
  • Gives tickets with the lowest risk.
  • Very simple and easy to use.
  • Send alerts, emails and Push notifications.

The indicator has a sensitivity parameter that helps the operator to make it compatible with its own type of trading. It also provides access to an ATR and power panel of currency.

Parameters of Mr Top Bottom:

-Maximum bars: Maximum candles for drawing arrows. This parameter will not change the results of the calculations. Simply reduce the calculation time.
Sensitivity: You can set the Sensitivity from A to F. A means the lowest Sensitivity and F means the highest. The best sensitivity will be represented by E.

-Signal type: If you put it in “Current bar”, it shows you the current signs of the candle and if you put it in “Confirmed bar” it shows the arrows after the candle closes.

Information panel and configuration:

-Show candle time: If true, the candle clock countdown timer will be displayed.

-Candle Time Color: To set the candle time text color.

-Display panel: If true, the panel will be displayed. Including the ATR panel and Currency Power.

-Display panel in Tester: If you want to test the indicator in Strategy Tester, set this parameter to false to increase the test speed.

-Moving panel on X-axis: Moving panel on X-axis of graph.

-Move the panel on the y-axis: Move the panel on the y-axis of the chart.

-Unique identification for drawing objects: If you want to attach the indicator more than once in a chart, you must change this parameter to a new character symbol such as $, $!, %, etc.

Service Cost

This robot cannot be bought, it is only available for rent on the MQL market, at a price of 40 USD for a month, or 160 USD for a year. The free demo version is also available, so you can test it and check if this tool can be useful in your trading.

Conclusion

In short, we are talking about a robot that tries to take advantage of trends, locating tops and bottoms. Apparently the EA gets good results, since there are several users who have highly valued this robot, there are no negative criticisms. Mr Top Bottom is a robot suitable for all types of traders, its operation is very simple and its fundamentals are easy to understand.

This Forex service can be found at the following web address: https://www.mql5.com/en/market/product/36398

Categories
Forex Service Review

MultyTrend PA Indicator Review

Multytrend PA is an indicator that was created in April 2019 by developer Mikhail Nazarenko. This indicator combines the principles of Price Action and a unique filtering algorithm with feedback for three moving averages. This allows you to know what are the pivot points and current trends in any time frame with a high probability of success in the trades you are pointing out. Multytrend PA is an update of the classic Trend PA indicator and can be used with the principle of the three Elder screens, but everything that is needed is shown in the same chart, which is easier for the user.

Overview

Line 1 is in fast motion, while line 2 is in the main action, and line 3 is a slow movement to determine the direction in opening orders. The coincidence of the trend in the three movements is indicated by the arrows of the indicator and reports an incipient trend in the indicated direction.

Characteristics of this indicator:

  • It has no delay and gives a notable advantage over the Moving Average standard.
  • Simple and intuitive graphical interface, the configuration is minimal.
  • Configuration for each customizable MA for your trading style.
  • Alerts are activated when trends coincide on all three lines.
  • Optimized code and minimal load on your computer processor.

Settings:

  • Line 1 filtering bars (0 – line 1) – the period to calculate line 1 in bars.
  • Line 2 filtering bars (0 – line 2) – the period to calculate line 2 in bars.
  • Line 3 filtering bars (0 – line 3) – the calculation period of line 3 in bars.
  • Filtering mode (false – high/low, true – close)

Pantalla:

  • Line 1 width – line thickness 1
  • Line 2 width – line thickness 2
  • Line 3 width – line thickness 3
  • Draw in history bars – draw the indicator in the specified number of bars in the chart

Trend alert options include:

-Alert – activate alert when trends coincide in 3 Movings Averages.

-Send mail – send an email if trends in 3 lines are the same.

-Send push notification – send a push message to your mobile when trends in 3 moving averages are the same

Conclusion

In summary, we are talking about an indicator that combines the action of price with a trend prediction based on the crosses of 3 moving averages. It seems to be a reasonably comprehensive indicator and may be engaging in its concept. Due to the fact that it has not been on the market for a long time, there are not many comments from users to verify the usefulness of this indicator, but the few comments that exist are positive.
If you want to buy this indicator, it is available on the MQL market at a price of 55 USD. You can also rent it annually for 34 USD, and try out its demo version to make a purchase decision once you have analyzed it and understood its operation well.

This Forex service can be found at the following web address: https://www.mql5.com/en/market/product/37831

Categories
Forex Service Review

PZ Wedges Forex Indicator Review

PZ Wedges is an indicator created in September 2017 by Arturo López Pérez. Arturo López Pérez is a private investor and speculator, software engineer, and founder of Point Zero Trading Solutions.

Overview

The basis of this indicator is that it finds wedges, which are continuation patterns identified by converging trends around a period of price consolidation. It signals the trades using a donchian break along with the break-up of the wedge formation. This is a very user-friendly indicator. With customizable colors and sizes. It implements breakout signals and implements alerts of all kinds. For optimal use and to be able to see wedges of all sizes, which can even overlap, you will have to load the indicator several times in the table with different sizes, for example, 6, 12, 18, and 24.

Input parameters of this indicator:

  • Size: Refers to the size of the wedge patterns that are found.
  • Break up period: Donchian period to mark trade.
  • Max. History bars: Amount of bars passed to examine in the chart.
  • Color of bullish patterns: This parameter is self-explanatory.
  • Color of the bearish patterns: This parameter is self-explanatory.
  • Uninterrupted pattern color: This parameter is self-explanatory.
  • Line width: Size of pattern lines.
  • Color of bullish shoots: This is the color of the arrows to buy.
  • Color of bearish shoots: This is the color of the arrows to sell.
  • Arrow Size: This is the size of the arrows shown in the chart.
  • Custom Alert Name: Custom title for alerts raised in this chart.
  • Show alerts: Enable or disable screen alerts.
  • Email alerts: Enable or disable email alerts.
  • Push Alerts: Activate or disable push alerts.
  • Sound alerts: Enable or disable sound alerts.
  • Sound file: Sound file to play when a screen alert is activated.

Service Cost

If you want to try this indicator to get to know it better, a demo version is available in the MQL market indicators section. If you finally want to buy it, its selling price is 49 USD.

Conclusion

In summary, we talk about an indicator that is based on the search for a specific trend continuation pattern (wedges), and that warns us of its formation and alerts us for the decision to buy or sell a certain financial asset. We think it may be an interesting indicator to have as a complement to other indicators, for example, a trend indicator. Suitable for all types of traders, be it a beginner or someone who is more advanced. We haven’t found many comments from users who have already tried this indicator, and the few criticisms that exist are disparate, with both positive and negative feedback.

This Forex service can be found at the following web address: https://www.mql5.com/en/market/product/25264

Categories
Forex Service Review

Renko Trade Alarm Indicator Review

Renko Trade Alarm is an indicator that is designed to work on the graph with Renko and Mean Renko candles. This tool generates buying and selling signals on the chart and sends notifications to the user.

Overview

For proper operation, an offline table is required in which Renko Media candles are generated. In order to receive the “Scalp” signal, it is feasible to include more filters in the form of oscillators “Stochastic” and “MACD”.

Display of the signals:

-Swing – 123 Formations.

-Pattern – Double Bottom, Triple Bottom, Double Top, Triple Top, Formations 123 Reverse.

-Scalping – Periodic change in price direction, plus additional filters in the form of stochastic oscillators and MACD.

-Ichi – Signals that have passed the Ichimoku indicator filter.

One of the most common problems we have when having multiple Renko charts with different box sizes is that a trader could end up getting confused in the size of the Renko card box they are looking at. There are not many indicators that seem to want to consider this issue, which is where the Renko Business Assistant Indicator can be of great help. By adding this Renko Trading Assistant indicator to your Renko offline or Renko Median tables, you can show in real-time the size of the Renko card box as well as key investment points.

The Renko Trade Alarm indicator helps you especially if you have multiple Renko or Renko charts open. It might seem a little tedious to navigate between Renko’s different charts, as you will need to look at the Open/Close prices of the previous boxes to determine the size of the box you are using. With the Renko Trade Alarm indicator, with a quick look, the indicator will show you what Renko graphic is seeing.

Service Cost

The selling price of this tool is 30 USD, or you can also rent it for 10 USD per month.

Conclusion

In short, we are talking about a Renko indicator that can be confusing for beginner traders. For this reason, we recommend studying first what constitutes a universal Renko indicator to understand this tool better. There is a free trial version that we must try to know this indicator and the possibilities it has to enrich our trading or not. You can find it in the MQL market in the indicators section.

This Forex service can be found at the following web address: https://www.mql5.com/en/market/product/37572

Categories
Forex Service Review

Stochastic Ichimoku Cloud Indicator Review

This indicator indicates the stochastic crossing in the direction of the trend that is determined by the relative price position in the characteristic Ichimoku cloud.

Overview

The main features of Stochastic Ichimoku are as follows: 

-Flexible adjustments. Signals are filtered by bullish or bassist bars (parameter “BUY – only on bullish bar; parameter SELL – only on bear bar”).

-Stochastic crossing configuration levels (parameters “BUY-signal if Stochastic under this level” and “BUY-signal if Stochastic under this level”).

-Ability to use the Ichimoku cloud for higher time frames (parameter “Time frame of Ichimoku Cloud”).

Label in the top right corner will show you the direction of the trend:

-Up arrow indicates that the price is above the Ichimoku cloud;

-Down arrow indicates that the price is below the Ichimoku cloud;

-The price is in the cloud (plane: in this circumstance, the signal will not be generated).

The signal is activated not only when the bar is closed (signal formed), but also in the current bar that is not closed yet (signal likely). It has enough time to analyze the reality of the market and allows you to take time to make a decision and calculate trading parameters.

The indicator can generate an early exit signal from trade when the stochastic lines intersect inversely (against the trend). You can activate (ON) and deactivate (OFF) this option using a button in the bottom right corner of the chart (adjustable parameter). Activate this button only if you are in the market and want to close a trade according to the inverse crossing of stochastic. You can disable this chart button if this option is not required (“ON-OFF – Reverse signal button”=false).

In general, good results are obtained with the default parameters if an Ichimoku cloud time frame is set a level higher than the current one. For example, attach the indicator to a graph with М1, and set the cloud time frame (parameter “Timeframe of Ichimoku Cloud”) to М5. If a graph has a М30 time frame, set H1 as the cloud time frame, etc.

Parameters:

  • Period K – period to calculate the Stochastic %K line.
  • D Period – average period for calculating line %D.
  • Deceleration – value of slowdown.
  • BUY – Buy signal appears if Stochastic is below this level.
  • SELL – Sell signal appears if Stochastic is above this level.
  • BUY – A bullish bar only.
  • SELL – The bearish bar only.

Conclusion

In short, we are talking about a well-known indicator (Ichimoku) that generally gives good results. If you want one of the multiple indicators of Ichimoku that exist in the market, this can be an option to consider, since its price ($30 USD) is affordable, and the indicator accumulates good comments from its users. The indicator can be found in the MQL market, and you also have a free demo version.

This Forex service can be found at the following web address: https://www.mql5.com/en/market/product/9925

Categories
Forex Service Review

TPA True Price Action MT4 Indicator Review

This indicator coded for the MetaTrader 4 and 5 platform belongs to the paid category and has a specific way of giving signals and trading use. The first version is published on the 3rd of July 2019, it is not a very old indicator but has received some attention. The developer is Janusz Trojca from Poland now under the team name of InvestSoft. This team has a total of 10 products with good ratings, some of them complement the TPA indicator for a complete trading system. As the name describes the indicator is based on the Price Action strategies known for the use of support and resistance lines. The authors developed a blog website investsoft.eu/ with several articles about the TPA indicator and how to use it in conjunction with others.

Overview

The page presenting the indicator on the MQL5 may look too complicated and probably will turn away customers looking for a simpler solution or just do not want to invest time learning how to interpret the signals given by the TPA indicator. The developer first wants to point out that TPA is not repainting and gives signals once the candle is closed. It can be used as the confirmation indicator but also as an exit. There are multiple ways a trader can use the signals. TPA is versatile when it comes to where it is used and on what timeframe. This means it is universal.

TPA is presented as a tool that is not the mainstream, thus avoiding the common techniques used unsuccessfully by the 90% of traders. These are characterized as misleading, most of the traders do not make a significant success if any, just because they are using the tools market makers know about and predict. However, the page does not say anything about the indicator’s exact strategy and formulas. The latest update is version 2.1 from November 2019 giving the indicator a cleaner code, the TAP line, and performance optimizations.

TPA indicator developers made a Telegram group chat for owners of the indicator where trading and other support are delivered to those that need it. Since the indicator is intended for those that know a bit about trading or for those that are willing to learn, it has the guide that is not short and could be harder to follow for some users. The demo is available and mentioned that even it could be tested in the Strategy Tester module of the MT4, the results do not count for the other factors traders implement when trading. Therefore, it is not just a plain signal following, the results in the simulation may not be valid.

In the blog article manual for the TPA indicator, we can see the scope of usage. It is essentially a trend following strategy using higher timeframe filters, price levels, risk management, and other measures outside the indicator function. The TAP line is added as the filter to counter small corrections that do not change the bigger underlying trend, it is a noise that should be filtered. The main idea is to follow the market makers and big trends they produce. 10 questions are designed for you to follow the logic of trading and using the TPA indicator.

According to them, the TPA line slope determines if the market is ranging and if there is a trend to follow. The higher timeframe is also important to analyze. Other steps are required too and involve subjective analysis of other signals, such as Fibonacci levels. The manual is also written in a hard to read English and not everyone can understand what is required. Therefore, this indicator is not for beginners. Many will be in doubt with the subjective interpretation of inconclusive TPA signals. There are some pictures as examples to see how the TPA line on 50 period acts as a rebound level, considered to be used by many market makers.

Service Cost

The indicator price is $198 for 5 activations or to rent for one month for $40. The developer states that the demo may not show the valid results in the Tester module but it does not mean trader cannot use and try the Demo without the Strategy Tester.

Conclusion

As the indicator is not explained very well and it requires some trading knowledge, it does not receive the popularity as some other indicators. The higher price is also a barrier for more indicator users. For those that understand and have used for this one after the demo trial, it is not a high price to pay. As for the rating, the TPA indicator has 4.5 stars out of 38 reviews. The review sample is high enough to have a representative image of user satisfaction. We have found only 2 users with a 1-star rating but did not disclose why the TPA is bad. The rest of user reviews that are not perfect state that TPA does not show the exit points. In our opinion, TPA has potential but requires a good amount of forward-testing and your own set of rules on how to interpret the signals. The support Telegram channel is a very good starting point if you decide to use this one, just do not expect to understand it very quickly if you are new to the scene.

This Forex service can be found at the following web address: https://www.mql5.com/en/market/product/39932

Categories
Forex Service Review

PipTick VWAP MT4 Indicator Review

PipTick VWAP for the MT4 platform is a special form of the Volume-Weighted Average Price indicator. One of the most used Moving Averages apart from the EMA or Exponential Moving Average is VWAP for its adaptability to recent market changes. Michael Jurnik from the Czech Republic is the developer of this tool, partner at PipTick. They have published 59 products, many of them not having much popularity or ratings.

Overview

The initial version of PipTick VWAP MT4 was released on 25th February 2015. It is an old indicator that has received just one review for that time. The latest update was on the 12th of May 2016 to version 1.3 where calculation accuracy has been improved and added some parameters for visuals. This indicator is also available for the MetaTrader 5 platform, both are in the paid category on the MQL5 market.

There are many ways you can use the VWAP and is a part of many trends following systems when combined with other tools. The specifics of this version is that it works in five modes. Moving mode sets the indicator to calculate as the Moving Average, while in Daily mode the VWAP is calculated from day start to the end, thus giving the traders daily range often used in trading. Weekly and Monthly do this for the selected periods and Session Time gives the ability to set a custom period for this calculation.

VWAP will be displayed as a band on the chart and thus it could be used as Bollinger Bands for reversals. Still, the best way to use the tool is for trend following and setting the Risk Management levels such as Take Profit and Stop Loss. There are 3 bands, each of them represents Standard Deviation on different sensitivity. If you combine other Moving Averages you may have a great trade exit system where the cross with the deviation line will signal precise trend exhaustion. The author suggests using the indicator with Price Action or Candle patterns.

The main features of PipTick VWAP are several calculation modes, first, second, and third standard deviation levels, customizable visuals, EA friendly, and is described as fast and reliable. There is also a demo video showing the indicator in action although not much can be concluded from it, it will just plug the lines and the channel and the rest can be used and combined in so many ways.

The settings panel will give you the ability to adjust the input and output parameters. Input parameters are Volume Method (to use real or tick Volume), VWAP mode, MA Period, colors for the lines, and visibility of all the lines for deviations, etc. Output parameters allow you to set the VWAP value, and bottom and top values for the first, second, and third standard deviations. These settings give enough freedom to test and adapt the indicator to the trader’s system and also opens the creativity.

Service Cost

The price of PipTick VWAP is $57 to buy and have 50 activations. Renting starts at $17 for one month and $37 for 3 months. A demo is available and it has been downloaded 959 times at the moment of this review. This shows some popularity but as the reviews and comments go, it Is very low.

Conclusion

PipTick VWAP for MT4 has received only one rating and it is not positive:

“This project seems to be stoped. It hasn’t been updated since 2016 and the developer doesn’t answer questions since 2018.”

The indicator consumes a large amount of CPU if the [Max bars in the chart] in the Options menu has a large value. I’ve proposed a simple solution, but it doesn’t respond, so I can’t use it and I’ve had to uninstall it.” Based on the comments section we have noted the developer did not notice user complains but plans to update the performance issues in version 1.4 soon. In our opinion, the price tag for this simple indicator is too high, not much is done here and this kind of indicator could be found on the internet for free, probably even on the MQL5 marketplace.

This Forex service can be found at the following web address: https://www.mql5.com/en/market/product/8187

Categories
Forex Service Review

MA Multi Moving Average Standard Indicator Review

MA Multi stands for Moving Average Multi Timeframe indicator that is useful in many ways and for many strategies. The developer of this indicator is Dmitriy Susloparov from Russia having 16 products offered on the MQL5 marketplace. None of them have received much attention and only MA Multi and one more indicator have ratings. Most of the indicators published are similar, they are basic indicators made multi-timeframe on a single chart. MA Multi also exists for the MetaTrader 5 platform. The first appearance on the MQL5 market is on the 3rd of May 2017 and updated on 31st, a few days later on request by one user. The developer responded quickly and made the additional option to turn off redrawing on closing each candle, updating the indicator to version 1.1.

Overview

MA Multi will work with any combination of timeframes on a chart, thus plotting several lines for each timeframe you turn on. As the Moving average has a multitude of uses, having a combination of default MT4 indicators, and this one can result in having a completely new indicator generating unique signals. It can even mean a whole new trading system. As you add channels, ATR, and other indicators on the same chart, technical analysis, and interpretation open a plethora of possible signals. Therefore, this indicator does a simple job, this is basic coding, and that are many free versions of such indicators, but, having this one customized to your liking is a nice gesture. MA Multi will be displayed as a Step MA for higher timeframes as this is how it looks like when you switch. Each line has its color, width, or whatever visuals you like.

In the settings you can set the Period, Method for calculation of the MA, the new Redraw option, and a list of timeframes to show or disable on the chart. The developer has uploaded a video showing a practical example of how the indicator can be used in trend following strategies, still, as we have mentioned, the possibilities on how you can use this are endless. The video is in Russian but it is not necessary to understand the use of multi-timeframe MA.

Service Cost

The price of this simple indicator is $10 to buy and having 5 activations. There is no possibility to rent this one but a demo is offered.

Conclusion

The developer is very open to additional updates. It seems, so if you have a special request to adapt the tool, you can send a message in the Comments section. Unfortunately, the price of $10 is low, but the indicator is very popular and has wide availability on the internet and forums for free, from other coders. It that sense, purchasing this one may be a good idea if you plan to ask the developer about updating with your needed features.

This Forex service can be found at the following web address: https://www.mql5.com/en/market/product/22642

Categories
Forex Service Review

Infinity TrendLine Indicator Review

Infinity Trendline is a trend following indicator with integrated solutions for Taking Profit and Stop Loss management. It is developed for the MetaTrader 4 and 5. It was a top free indicator once it showed up in November 2018 on the MQL5 market and since it has received many updates. New things are mostly about adding features and updating the code, enriching the indicator with new goodies. The latest update sets the version to 52.0 and is updated recently, in March 2020. Evgenii Aksenov is the author of this popular indicator/ trading system consisting of few indicators. Main takeaways are the easy-to-use trading signal system, good support, and the fact this is a free indicator that is usable even though the PRO version has more features.

Overview

Infinity TrendLine mainline may look like a kind of Step Moving Average. The author is not very clear on the inner workings on this main trend confirmation indicator but based on the settings we believe it is the ATR or Average True Range, a classic one for measuring volatility. In the Overview page, this is just explained by analysis of the average range of bulls and bears. The indicator will show you a trend signal with an arrow and it will automatically calculate 3 Take Profit levels and a Stop Loss. There is a panel on the side that shows you the probability of the price reaching the first, second, and third Take Profit. Based on this you can trade signals with the highest probability. Note that the free version will not give you the Take Profit 2 and 3, the result based on historic trades will not be shown, and many of the customization options are turned off.

Consequently, the free version feels like a marketing tool, and judging by the Overview page full of marketing cannons, the developers are heavily oriented to sales. This is not always a bad sign, the free version still has some usability. You will have a quick symbol selection pane once you click the “Free” button with the timeframes and the success percentages on each, giving you the ability to scan for the best opportunities. This rounds up on how to use the indicator, each signal optionally has a higher timeframe filter for better noise signals reduction.

These functions are available in this free version. Unfortunately, a good portion is left out, such as calculation type option, amplitude settings, Take Profit and Stop Loss settings, and adding custom symbols for the probabilities scanner. In the early days, the indicator had Amplitude, Period, and other settings for the Zig Zag indicator were available, but it seems the free version is updated in favor of the PRO, therefore becoming the sales channel. Even the screenshots on the Overview page are using the PRO version, and the feature list presents only what is in the PRO. Furthermore, if you buy the PRO version you are offered with other accompanying indicators from this developer for free, such as the HTF_Histogram indicator which seems to be necessary to determine the Higher Time Frame trend. More bundling sales techniques are evident. The developer will offer another indicator for free with the purchase of two of their products.

Conclusion

Infinity TrendLine with all these feature downgradings after each update still is useful as a trend baseline. Take Profit and Stop Loss levels can be used to a limited degree, but the true value of this line may be in its step-like plotting and a precise price crossing once the major trend is changing or losing momentum. As for the ratings, this one received 4.8 stars based on 60 reviews. 435 comments are signaling this indicator is still popular, giving traders a solid solution for trend trading. Although, most of the experienced traders will avoid such products providing automatic Take Profit or Stop Loss levels and the probabilities. These features are not transparent enough for them. Infinity TrendLine, even the PRO version is more for those that do not know to manage these key Risk Management levels and want a ready-made solution. As with all “All in One” products, they excel at nothing and are mediocre in everything. A notable hard to find average review is from Simone Gargano stating:

“The indicator is good, very easy to use and clear BUT as you may know before considering an indicator as good you would have tested it at least 6 months. I’ve loaded this indicator to my Koder Killer EA (used to test the indicators) and is not showing good results over the last 4 months like the indicator’s success rate shows (65%+ on average). I rate it 3 stars for this reason at the moment.”

All other positive reviews are a reason enough to test this indicator and if you need more options, consider the paid PRO version.

This Forex service can be found at the following web address: https://www.mql5.com/en/market/product/33083

Categories
Forex Service Review

TickUnit Scalper Currency Strength28 Pro Review

TickUnit Scalper Currency Strength28 PRO is a new indicator type on the scene popular with the scalper trading strategies. It is designed for the MetaTrader 4 and published on 5th July 2019. Since then it has received frequent updates with very good additions such as to save tick data for faster recovery. The developer of this combo indicator is Bernhard Schweigert from Morroco and he has 12 products offered on the MQL5 repository, most of them are popular and have very high ratings from the users. He made a currency correlation/strength indicator using Tick-Units data on 28 currency pairs, or all of the major currency combinations. It belongs to the paid category and could be regarded as a complete trading system.

Overview

TickUnit Scalper Currency Strength28 PRO is a combination of Advanced Currency Strength 28 and Advanced Currency IMPULSE with ALERT, both of them, of course, is the developer’s separate product. Currency Strenght can be used on 11 different tick units, 1, 2, 3, 4, 5, 6, 10, 12, 15, 20, and 30 seconds. You will have the convenience to have a single chart for all 28 pairs trading under the subwindow. Now, since the indicator is used on the lower than M1 timeframe, up to 30 seconds, it is not the standard MT4 indicator. Advanced Currency Strength28 Indicator is used for the standard MT4 timeframes and is a separate product. Tick Unit Scalper Currency Strength28 is presented as the first tick unit indicator on lower timeframes than M1. As such, fas broker conditions are a must, also the spreads must be raw. A user manual is made and linked in the ‘Overview’ page. It is detailed with gif visuals, although not very clear, traders that have a bit of trading and MT4 knowledge will understand how to use this special indicator.

The feature list is interesting but now everyone will see the value-added just by reading the description. One would need to try the indicator first. Sensitivity modes will adapt to the trading style, be it super frequent or slow and steady. Alerts are possible for extreme values in the Currency Strenght meter so you will know when a very good opportunity arises. Each currency has special dynamics, so the indicator already has pre-set parameters for each, thus making optimal signals. Dynamic Fibonacci levels are used for the Price Action zones as part of the proprietary code for this indicator, and according to the signal is generated. The zones represent areas of Resistance and Supply and are recommended to add on, it Is another indicator.

A signal is very easy to follow, it will be shown in the window and with one click a chart will open the currency pair. Even though the pictures show the Take Profit levels, it is not very clear if they are calculated by the indicator or if they are just fixed values. Trades should know when to trade, the momentum will show when the market is flat and no currency stands out as the weak or strong. Also, the traders should avoid main fundamental analysis events or factors that could affect the market. This is common for most scalper strategies. This said testing is valid only if manually done.

The settings are very detailed, you can change the Alert parameters, set the sensitivity and timeframe, visuals change, and more. Bernhard Schweigert also packed the templates and profiles for the MT4 and also has a blog with many useful updates, news, and tips.

Service Cost

TickUnit Scalper Currency Strength28 PRO is not available to buy, only to rent for 3 months or 1 year. 3-month rent has a price tag of $98 and 1 year $148. A demo is available. The reason for this kind of charging is probably because of good ratings and sustainability for the developer in the long term. Scalping is very popular and this indicator is unique and not hard to use. The logic behind the strategy is sound but may use some popular techniques such as Fibonacci levels.

Conclusion

There are only 5 reviews for this indicator and sums up a rating of 3.8 stars. This is not enough to have a verdict. Some of the useful user reviews are:

“Very good indicator and signals, but one has to still do some more analysis to filter good and bad signals.”

“THIS INDICATOR WORKS AND I RECOMMEND IT. IT HAS MADE ME MONEY. AS I ALREADY SEEN ITS PERFORMANCE ON THE MOST POPULAR CURRENCY PAIRS…As with the other of Bernhardt’s indicators, this is a good one!”

Traders that have seen the indicator in cation with the demo can easily learn to use it and test it. Since the author has already made the templates and profiles, you should have a ready-made best settings for each currency. The rent price is small to pay if this indicator matches your fast-paced scalping trading philosophy, as it is specialized for these traders only. Whatsmore, using faster than the M1 trading period will require very high focus and stress that most beginners will have difficulty handling.

This Forex service can be found at the following web address: https://www.mql5.com/en/market/product/39366

Categories
Forex Service Review

Scalp Tools Support and Resistance Levels Indicator Review

Scalp Tools Support and Resistance Levels is designed to do one thing, to identify the Support and Resistance levels. Usually, indicators that are specialized to do one thing are the ones that do this very well. Most successful trading systems are composed of a few specialized indicators for every aspect of the system. Even though the indicator name has the Scalp word, it is not limited just for scalper systems, most Price Action systems will rely on the Support and Resistance levels. This word is probably included in the name of the indicator for SEO purposes.

Nevertheless, the indicator has a perfect rating, has been developed long ago, on 9th September 2014. The latest iteration is version 2.7 updated on 5th December 2017. Scalp Tools Support and Resistance Levels is, therefore, a relatively old indicator that belongs to the paid category on the MQL5 market. Martin Fischer from Germany, the developer of this indicator has 23 products total with mixed ratings and a good part of them is free.

Overview

The tool offered is advanced, with a few very interesting features. The calculation for the important market levels is calculated automatically on several timeframes regardless of the trading instrument. Therefore, the indicator is universal. The usage is self-explanatory and the publisher has a youtube video presenting the indicator in just 1 and a half minutes. What we can see is that the design of the tool is in the form of a window with a menu. Support and Resistance lines are one of the few other options.

Timeframes available are from M1 to Monthly, the same as the MetaTrader 4 platform for which the tool is made. Here you can set the High Low distance in bars, or a range for which the tool will calculate the levels. The minimal difference in pips is also a definition parameter and the history used in the automatic analysis is defined by the bars or candles number. Interestingly, the analysis has the option to calculate levels at the cursor, as you move it. This is a unique feature that requires some coding and creativity. All parameters have the + and – buttons for ease of use. Such design does not make the tool eligible for testing in the MT4 tester module, although the tool such as this works at the moment of inserting, there is no point in testing the Support and Resistance levels through the simulation.

You will see the levels based on the settings and the evident levels based on the Price Action. Since the tool can differentiate the levels on multiple and simultaneous timeframes (traders can set H1 and Daily Support/Resistance levels on one chart), it increases the versatility. This indicator also uses round price levels as important Support/Resistance points.

https://youtu.be/_0jZ2bTS1Ag

Settings available for the tool (additional ones) are visual and the autosave function. Visuals are of course about the line width, color, type, about fond size, and so on. The autosave has the option to save periods and the symbols or to save only periods. This is quite handy, a trader will have the previously set parameters for each trading instrument.

Service Cost

Scalp Tools Support and Resistance Levels price is $30 to buy and $10 to rent for 3 months. You will have 5 activations per purchase and the demo is available. Note that the demo works only on the separate link provided by the developer. The Free Demo button will not give you the version that works offline.

Conclusion

Scalp Tools Support and Resistance Levels has only 5 reviews, but all have perfect ratings. It seems the tool did not receive much attention and popularity despite the advanced design. The most useful review is by Hailey stating:

”This is the handiest indicator and I wish all indicators were built on this principle. Click on it to see sup/res lines, click on it to remove. The support/resistance lines are right on the money. I put it on virtually every one of my templates! I don’t know the developer and I’m not getting a kickback on a $10 indicator. Just telling what I see. Great indicator.”

From our perspective, the tool is very handy but does only one thing and one that many traders can do without the need for an indicator. Therefore, the price of $30 could be a bit steep for a beginner and unnecessary for an expert (who probably already has his Support/Resistance indicator). However, in case your trading Price Action system does not have such an indicator, and you would benefit from one, Scalp Tools Support and Resistance Levels is a good choice.

This Forex service can be found at the following web address: https://www.mql5.com/en/market/product/5965

Categories
Forex Service Review

Pattern 1-2-3 Indicator Review

This pattern is popular among the Pirce Action strategy traders, or more precisely, the 1-2-3 Pattern is a reversal signal distinguished by a zig-zag move at the end of a trend. This indicator automatically plots this pattern on the MetaTrader 4 chart (also available for MT5). Initially published on 28th September 2016 on the MQL5 market, the developer Pavel Zamoshnikov from Russia released a few updates at the request of users. It was updated with new functionalities and bug fixes finishing with version 3.5 from April 2019. Since the pattern is commonly sought-after, the tool received some popularity. The author has a large pool of released products consisting of 45 indicators, EAs, and signals.

Overview

The indicator is very specialized in what it does, but since the drawing of a pattern is subjective, this task is not easy to code and to give the right levels for drawing points 2 and 3. The base of the formula comes from the Zig Zag indicator that is adjusted through several conditional measures, some of which can be altered in the “Method for pattern triggering” parameter. The Overview page is clear, showing all that the indicator can handle. 1-2-3 pattern is drawn in real-time, and once it is completely formed an alert will be triggered, without any redrawing. A video presenting how the indicator work is great and short. These patterns can show on any trading instrument, be it in forex, equities, or crypto, while the indicator does not require manual setting adjustment for each.

If traders want to adjust the actual 1-2-3 numbers display, it can be easily done in the settings. Fibonacci levels are used in conjunction with the adjusted, non-repainting Zig Zag indicator, so the points are pinned to one of up to 5 Fibbonaci levels scanned by the indicator. These levels are also used to Stop Loss and Take Profit automatic placement and can be displayed with description if set so. A full alert component is used to signal the trader by email, push, or to a mobile device. If traders want a complete automatic solution, a new published Exper Advisor is containing the 1-2-3 pattern recognition from this indicator.

According to the author, the recommended timeframe is from M5 to monthly, although the greater the number of candles drawing the pattern the better and longer the trends are. However, it seems there are some limitations to useability. Intraday traders would need to focus on the EU and US trading sessions as the patterns are not reliable on other markets.

In the settings panel, you can adjust the number of candles for calculation, Zig Zag indicator depth, the method for pattern triggering (breakout from the 3rd point line or just touching), show Take Profit and Stop Loss levels and how they are calculated, some visual settings and how or when the alert will be triggered.

Service Cost

The Pattern 1 2 3 indicator can be bought for $30 with 10 activations without the option to rent it. A demo is offered in the separate link on the ‘Overview’ page. This price is relatively low comparing to other indicators doing the same or similar function but we have found some free versions elsewhere, just not exclusively made for the 1-2-3 pattern.

Conclusion

A total of 19 users gave this indicator a good rating of 4.6 stars and commenting often, showing high interest. This descriptive 3-star review shows not all are happy:

“After purchasing the indicator, I found a lot of problems. From a formal point of view, this is a good indicator. However, when used in practice, there will be too much noise, which is not practical. The formation of the trend is mainly after the completion of the 123 mode, that is, after breaking the 2 points horizontal line. If only 2 points of the horizontal line are needed. After the breakthrough, the market signal is stable and other signals are redundant. Any other signal warnings are noise. There are no such separate alert message reminder options set in the metrics. Your indication is that multiple message reminders appear with a switch and the sound is the same. This is not a very good difference, it is trouble…”

Just note there are only two reviews with a rating lower than 5 stars.

This Forex service can be found at the following web address: https://www.mql5.com/en/market/product/18523

Categories
Forex Service Review

FFx MACD Divergences Indicator Review

The MetaTrader 4 and 5 platforms come with one of the most popular indicators known to traders – MACD. FFx MACD Divergences build upon the already integrated indicator in the MT4 platform, extending the functionality especially useful for divergence strategy traders. This paid indicator is published on 4th July 2014 on the MQL5 repository and since then has no received much attention. The latest version has not changed since the initial placement and remains at 1.0. The author of this extension tool is Eric Venturi-Bloxs from Thailand. This author has no less than 52 products on the mql5.com, a good portion of that is free.

Overview

This extension indicator is simple. It adds hidden and classic divergences on the MACD averages and displays it in a single window for multiple timeframes. This way, traders that rely on trade filters based on higher timeframe divergences can have a glance if there is one. The display will show as many timeframes you set in the settings in multiple small subwindows. The addon on the tool is very simple but original and useful for the followers of the divergence strategies.

The settings available allows traders to set timeframes from M1 to Monthly, set the number of bars for each timeframe window, set alerts on various conditions, change colors, and so on.

Service Cost

The price of this simple and useful indicator is $10 for 5 activations and there is also a demo. The price is not high given the rarity of such tools.

Conclusion

User ratings are 5 starts but based on only 3 reviews since 2014. Still, it should be understood that this tool targets specific traders. One of the reviews perfectly describes how FFx MACD Divergences can be used:

“Woooooow!! love it! I trade low TF signals based on H4+Daily Divergence. Now when my indicator gives me a buy signal on e.g. M15 then I immediately see if there is higher TF divergence or not on the same chart. Trade Yes or No? Decision takes one second now. Thank you for this great tool and the cheap price Eric!”

The author developed similar small useful gadgets for other trading styles.

This Forex service can be found at the following web address: https://www.mql5.com/en/market/product/4900

Categories
Forex Service Review

Currency Strength Matrix Indicator Review

Currency Strength Matrix is a paid indicator published on the MQL5 marketplace designed for the MetaTrader 4 platform. It belongs to the trend confirmation category although it is used in conjunction with other indicators. It tries to differentiate by offering better information for Price Action, Reversal, and Momentum trading strategies, according to the developer’s words. The initial version was published on 5th July 2017 by Raymond Gilmour from the United Kingdom, author of just one more indicator called Cycle Finder Pro.

All are with positive ratings although the developer made these to use them as a sales funnel to his website, it seems. Nevertheless, the indicator is not overpriced, the last update was on the 2nd of April 2019. Most of the updates optimized the code for better performance, some of the early updates added functionalities such as better identify cycles, automatic reading price action for oversized bars, and some visual upgrades.

Overview

The MQL5 Overview page has good content and clearly shows how to operate the indicator. Yet the inner workings are not disclosed. What is presented are three modules, each with its representation and performance. The Trend Matrix module is a table that shows which currency pair is in the trend by plotting a 1 in the corresponding matrix cell. This way could be confusing at the start but once you understand that the left table side currencies are terms, you can know if the trend is up or down. However, the second module shows the strength of each major currency (8 of them). This table measures the score for each currency from -6 to 6 where 6 is the most extreme case of a strong currency.

The score is calculated using the relevance of other currencies plus the 1 or 0 from the Trend table. Comparing the scores traders will know which currency is the weakest and the strongest and thus have a better perspective when entering trades. The last part of the Currency Strength Matrix combo is the Momentum chart. Basically, this is the Strength table represented in a chart moving in real-time. By looking at it traders can see the momentum or where the trend is progressing to. Additionally, the chart will show the lines for each currency, the line crossing can be the trade entry signal confirmation.

Currency Strength Matrix can be used and in our opinion, must be used along with other indicators. It is a first step in the decision process since it shows the most probable currency pair having a strong trend, or are not strong enough for any trade entry. The user guide describes 3 types of trading. The confirmed trend is when all 3 modules show a clear signal on one currency pair. Pairs should be consisting of a strong currency with a score of at least +5 and a weak one with at least -5. For “early trends” traders can use the 0 level line crossing on the Momentum chart that will signal the currency gaining or losing strength.

One should also be careful to select currencies only gaining momentum from the extreme scores, such as -5 or +5. “Begging trend” trading is done by looking at what currencies are at extremes and entering a trade once they start moving out of the extreme zone. This method carries the biggest risk but traders may have entered perfectly into an early and long trend.

In the settings panel, traders can adjust the ATR multiplier used for oversized candles detection. A lower multiplier will detect more candles but smaller. Calculation frequency can be adjusted so the indicators will use more time until they update. The rest of the settings are more cosmetic, turning the panels on or off, changing the font size and color, and so on.

Service Cost

The price for the Currency Strength Matrix is $98 for 10 activations. To rent it for 1 month will cost $39 and for 3 months $59. A demo is available. Notably, the author is promoting a free indicator that comes along with this one called Easy Draw for easy market switching.

Conclusion

As for the ratings, currently, 16 reviews are giving an average score of 4.5 stars and 136 comments. This shows that the indicator has some popularity although it does not reach the level most authors would like. The quality of the code seems to produce issues to some traders, most of the updates are about optimization. Certain users complain about this:

“Not good for me and bad. I do not recommend it at all. The owner of the indicator is asleep. There is no support or update for this indicator. Which I did not benefit from.”

Overall, currency strength meter indicators are popular among traders and therefore many versions are doing the same thing as this one. Some of them are free and can be found online.

This Forex service can be found at the following web address: https://www.mql5.com/en/market/product/23149

Categories
Forex Service Review

FX Power Currency Strength Meter Review

FX Power for the MetaTrader 5 (MT4 also available) is an indicator presented as “the first currency strength meter with a complete history across all timeframes”. Essentially it can be used standalone or as one of there indicators that compose the author’s Simple Trading System. The FX Power indicator developers are the Stein Investments team from Germany. The latest version is 3.76 updated in March 2020 and the first version is published in 2016.

Overview

Using this indicator requires some basic knowledge about the values of the currency relation measurements or the Delta. Although the logic is simple, the use of this indicator requires you to follow a certain strategy, and by this we mean it is not intended for scalpers on the 1 or 5M timeframe. The author has composed a very nice page about the indicator and a youtube video describing all the features of his indicator. The main purpose is to measure movement power or currency strength against others, although it has other purposes that could be used, such as quick chart switching from a single window.

The main features of FX Power are:

  • The non-repainting, real-time display for all brokers
  • Multiple timeframe selection that is not by default
  • The movable panel display suitable for higher resolutions
  • Automatic configuration
  • Alerts
  • EA friendly

The author presents some usage tactics but in our experience, if the indicator is used standalone and not as part of the Simple Trading System, it is completely irrelevant as the indicator should be in-line with the trader’s custom system. Also, the indicator does not represent all in one trading solution. However, Stein Investments presents 3 possible scenarios:

  1. Tradeline crosses. Each line represents a currency.
  2. Use the combination of two time periods to confirm a cross.
  3. Use currency combinations, if two currencies are getting stronger than one, the signal is more probable.

The indicator has a great and intuitive way of changing analysis timeframes from a control panel list box. The panel alone is very nicely coded, has very useful tools. The currency strength has several modes of display in this panel, as a HeatMap, DeltaMap, Symbol, Compact, and Equalizer. The Equalizer will display currency power similarly as music tone equalizer power meters, Compact will shink the panel to show only major single currencies with their Delta value, Symbol view that will show only the currently active chart currency pair, and the most interesting DeltaMap that will show an 8×8 matrix using the 8 majors and the pair combinations with the respective Delta value – excellent for searching trade opportunities on both directions.

Clicking the crosshair located on the panel will show all 8 currencies on the indicator chart if you want to see the relation to others. According to the author, the Delta peaks, or values above 6 or below 3, are considered as good exit indication, similarly to the RSI oversold and overbought levels. The Delta panel is moveable across the MT5 and can be placed anywhere you like with the drag and drop.

Settings for FX Power are very nicely categorized and have a plethora of options for each. Starting with the analysis period, you can select many non-default ones such as 8H, 10 minutes, 3 days, or 2 years. Customizing the panel and indicators looks is easy offering the line style, color for each currency, and similar. Alerts customization is also great with a good understanding of the trader’s needs. In this light, you can set up your alerts on line cross, certain level (Delta or currency) trigger alert be it low or higher threshold. Mobile, email, or sound notification alerts are optional.

Service Cost

The price tag for the FX Power meter indicator is $49, the same is for the MT4 version. Renting it is possible, $29 for 3 months or $39 for the whole year. There are 10 activations offered after purchase. A demo is available. The price is right at the point, the indicator is high quality and useable. Of course, there are similar ones for free if you are picky, but probably not the same quality or options.

Conclusion

The indicator received great reviews. The MT5 version has only 3 user reviews from the MQL5 repository but the more popular MT4 has an almost perfect 4.9 ratings from 70 reviews. The ones that left 1 star were hard to find and totally irrelevant, like this one:

“VERY DANGEROUS discretionary trading approach you can burn all your deposit if you don’t be skilled enough. You need a plan a money management strategy and an exact entry signal approach. BE WARNING WITH THE DISCRETIONARY TRADING SYSTEM THEY CAN BE CATASTROPHIC ESPECIALLY IF YOU DON’T BE SKILLED”.

It can be said that this indicator does exactly the job it is intended to the point of perfection. The combination with other trading systems is great, it can serve also as a filter for entries, as an exit indicator or as trade entry. Our recommendation is to use as an opportunity scanner on multiple timeframes, just be sure to use the right one for your trading.

This Forex service can be found at the following web address: https://www.mql5.com/en/market/product/16252

Categories
Forex Service Review

EMA Cross Alert Signal Indicator Review

EMA Cross alert is a simple but paid category indicator created by Suriya Thammalungka from Thailand. The EMA means Exponential Moving Average, an indicator used very frequently in many combinations but mostly as a two-line crossing for trend following. The indicator is simple and is never updated since the initial version in June 2016 for MetaTrader 4. It is interesting to see this indicator in the paid category as it is too simple to belong here and the indicators used are basic.

Overview

Traders mostly use the 50, 21, and 100 period EMA for as the support line and in combination with a faster EMA for a signal. This is what the indicator’s main purpose is, to alert on the faster EAM crossing the slower. By default, you can insert as many EMAs as you want onto your chart in MT4.

Service Cost

To purchase EMA Cross Alert you will have to pay $19 for 5 activations, or $12 to rent for 3 months. A demo is available. The response to this release is absent. There are no reviews and no comments. The reason for this is the indicator simplicity, EMA already exists in the standard MT4 installation and the only this the author did is add the alert on the cross with an arrow. Other indicators like this exist and they are free. Therefore, there is no reason to spend $19 on this version. There are other simple products by this author (10), interestingly, none of them have received any rating or popularity.

Conclusion

There is nothing worth mentioning with this indicator except that is has the alert system on line cross. The alert can be turned off in the settings but there are no special notifications. Essentially, there are 3 settings, period for the first and second EMA, and the alert on/off setting. Based on the settings, the EMA will leave a visual arrow on the chart on the candle close on any timeframe. You can customize the periods giving you different uses. The author published a video with all the settings demonstration. Of course, it is nonsense to measure the performance of such a simple indicator.

This Forex service can be found at the following web address: https://www.mql5.com/en/market/product/16974

Categories
Forex Service Review

Candlestick Patterns All Pairs Indicator Review

Candlestick Patterns All Pair is an indicator developed for automatic pattern recognition and plotting them on the MetaTrader 4 chart. The tool belongs to the paid category on the MQL5 market and is developed by Denis Luchinkin from Russia. He has over 20 published products but without notable popularity or ratings. This tool is published on the 23rd of March 2017 and has not been updated since. The candle patterns are used as predictive signals and could be reversal, trend, and sometimes scalp strategy elements.

Overview

This tool has a single purpose and this is the automatic plotting so you do not have to search for the pattern. 29 patterns are included in the database for recognition applicable to all forex currency pairs and timeframes. Notable features are the 5 additional settings for instruments, plots an arrow so you will know if the pattern is bearish or bullish, each pattern can be disabled if you consider it unreliable and has a handy table which shows the last patterns on all 28 major currency pairs and timeframes. This way the table will show traders what are the latest opportunities and possible Price Action movements. If you want to hide the table it is done with a click of a button.

The tool is simple and does the job well, the patterns are correct and precise. If you want to search more history you can set the candle values in the settings. Timeframes can also be turned off or on so you can have only 1H and 4H timeframes available, for example. Some visual settings are also optional like the text size, color, and so on. The patterns included are mostly common and considered as reliable although some may be missing such as Double through, still, some of them may be visible only on higher timeframes. The database contains Advance Bloc, Belt Hold Line, Counterattack Lines, and others that are not that used, then the Dark Cloud Cover, Doji, Engulfing, Evening Star, Gap, hanging Man, and Hammer which are commonly used.

Others patterns are Gravestone Doji, Harami, Inverted Hammer, Long Legged Doji, Mat Hold Pattern, Morning Star, NeckLine, Piercing, Separating Lines, Shooting Star, Side By Side, Stalled Pattern, Tasuki Gap, Three Crows, Three Line Strike, Three Methods, Three White Soldiers, Tweezer, and Upside Gap Two Crows. Once you pull in the indicator you will see the pattern and the name with the accompanying arrow depending if the pattern is bullish or bearish. The “Ago” column in the table shows how many candles have passed since the pattern appeared.

Service Cost

The price for the Candlestick Patterns All Pair tool is $25 to buy for 100 activations or $10 for a 3-month rental. A demo is available as the MT4 automatic install if you are registered in the MQL5 market.

Conclusion

The ratings are absent and a few comments are suggesting this tool is not popular. In the comments we have noted several users asking for alerts and other updates but the official update has not been released since. So, the developer may have abandoned this tool. If you are a fan of patterns, you could find other indicators such as this one for automatic plotting for free, although the price of $25 is not too much. Since the demo is offered, you will know if Candlestick Patterns All Pair works.

This Forex service can be found at the following web address: https://www.mql5.com/en/market/product/21853

Categories
Forex Service Review

BlueDigitsFx Spike And Strike Reversal Review

BlueDigitsFx Spike And Strike Reversal is a composite indicator for the MetaTrader 4 platform developed by Ziggy Janssen. This MQL5 repository developer is the owner of 6 published products with solid ratings and popularity. The indicator, as the name suggests, is a reversal strategy signal provider in the paid category. It is also aimed to filter fake reversal signals from the market using another module integrated. The overall quality is great and could be a good addition for traders relying on reversals, provided they have some additional tools. BlueDigitsFx Spike And Strike Reversal was published on 12th November 2019 and has not been updated ever since. Still, it does not mean it does not have the support, it is just a few months old but already has received some attention.

Overview

Two modules are integrated into this indicator. One has multiple indicators, aggregating the reversal confirmation signal. Essentially, it is a prediction indicator, not to be confused with confirmation indicators that lag. The second is the oscillator based on which the arrows are made for trade entries. One important fact about this indicator, it is repainting and this issue has been reported by some users. The repainting issue is not always a bad thing, to some traders’ philosophy, the market conditions can change and thus the signal also changed, the indicator has changed its “mind” as a real person would.

However, the problem lies that you will not have valid measurements when backtesting as that historical false signal before the indicator changed is not recorded on the chart. Repainting may mean the indicator never misses and is always positive on the outcome. Some additional indicators that lag and confirm the signal are essential for repainting indicators, and such case is also with the BlueDigitsFx Spike And Strike Reversal. Bollinger Bands are also used judged by the settings, although just for the channeling.

The main features of this reversal indicators are easy to follow signals, you will basically have arrows for sell and buy, cannot get more simple than that. It has the filtering ability, although we are unable to confirm if this feature is transparent or just integrated, thus decreasing the value of the indicator in conjunction with the trader’s system. Signals are generated on bar close only, works for all symbols and timeframes, has the full alert module with all the features, and is compatible with EA development. The features are not packed with redundant content, which signals the author is authentic with the approach, not a salesman. Similarly, clear content is about the usage guide. The trade entry signal revolves around the -6 and +6 value of the swing. Take Profit level is also determined with the swing low and swing high.

The trade exit is naturally evident with another arrow in the opposite direction. All this makes this indicator well rounded up although, note that is should be used as an addition to a system, as the developer also suggests. For best results, other system products by Ziggy Janssen is suggested, but it could be any reversal system. The product is called 1,2,3 system and is published on the MQL5 repository. The timeframe suggested is H1 and above although lower can also be used with less precision, meaning the indicator is not ready-made for scalpers and we are unsure if any setting change can make it so.

Settings are simple, traders will not have much to change here so optimization should be easier although it also limits the optimization scale. Nevertheless, you can change the calculation period, the filter period, the signal method, and the Bolliger Band parameters on the period and deviation.

Service Price

The price of BlueDigitsFx Spike And Strike Reversal is now high, $30 to buy, and $15 to rent for one month. If the MQL5 market is correct, 68 activations are available once you buy, more than enough even if you change your computer every year. A demo is available too.

Conclusion

Based on the reviews, this indicator only received 2 low ratings form users that did not like the repainting fact. Others are very satisfied. One review describes well how the indicator contributed to his trading:

“I don’t usually leave reviews and I’m not a big fan of most indicators, but THIS ONE… Ziggy knocked it out of the park! Don’t use it as a stand-alone indicator, but with price action and weekly pivots, it’s incredible for me. Having alerts to give me a heads up for price reversals, which is how I trade, is a dream come true. Ziggy makes himself exceptionally available and cares about your experience with his indicators…This indicator is exactly what I wanted to keep my charts clean but effective. I’d would give more stars if they were available! Thanks, Ziggy!!”

In our opinion, the indicator should be first understood and tested for repaints yourself. Even if it does, forward demo testing is needed. First of all, it should be assessed if this indicator is synergetic with your system. On the side note, the BlueDigitsFx Easy 1 2 3 System received a perfect rating out of 33 reviews, which is not easy to achieve, it should be considered as a possible system that works with this indicator.

This Forex service can be found at the following web address: https://www.mql5.com/en/market/product/43438

Categories
Forex Service Review

True Direction Oscillator Review

True Direction Oscillator or TDO is a trend gauging oscillator type indicator using a simple but effective formula. The developer is very open and transparent on how the indicator works and the Overview page has professionally made content. TDO has been initially published on the MQL5 market on 23rd November 2015 and since has received many updates. The latest version is v9.1, freshly updated in February this year. The author of this very interesting and popular indicator is Muhammad Al Bermaui from Egypt, showing great dedication to support his work.

Overview

The latest updates include optimization of the code and buffers, making the indicator require fewer computer resources and some additional ease of use and visual enhancements. The number of reviews and comments is great, making this indicator one of the most popular on the MQL5 market. It belongs to the paid category although the price is not high, especially for a quality indicator.

TDO is an enhanced momentum indicator based on the Price Rate of Change (ROC) except the formula is improved to work equally on bullish and bearish momentum. Therefore, the formula is disclosed as:

  • Center = (A + B) / 2
  • TDO = 100 x (A – B) / Center, where A and B are price levels

For trend traders, TDO is a great addition. Based on the presentation, the indicator is universal, using the formula on every trading instrument is valid. The timeframe is also universal, thus it can also be used in certain scalping strategies and has a good way of having an exit signal, not just rend confirmation. TDO will draw an arrow on the chart once the trend is confirmed, and does this based on 5 different TDO periods alignment in the same direction, bullish or bearish. This is done to prevent false zero-cross signals as per developer words. Additionally, TDO is confirmed to be non-repainting.

To facilitate with Take Profit and Stop Loss management, TDO features a panel with buttons to turn on the Linear Regression channel or Standard Deviation channel, giving the traders precise levels for this purpose using one of the best mathematical methods for measuring volatility highs and downs. Also, you can add Grid levels (rounded up price) and the automatic Support and Resistance plotting on the chart. A well rounded up solution for those using the Price Action strategies.

The developer has a very neat “table of contents” providing the readers a link to the TDO demo, User Manual, FAQ, Video library, and an EA development guide on the TDO indicator. All of the guides are clear and well written. TDO is simple to trade, an arrow will point and confirm the trend, the arrow in another direction could also mean the exit and the appearance of a new trend. Scaling in, or adding a position to already open trade in the same direction, is suggested once the TDO panel lights are aligned.

Of course, you can set alerts when this happens and also on additional parameters so traders will not miss the opportunity. The video provided shows that the indicator has a histogram that draws only once all of the TDO signals are aligned, showing the “True” trend. Using this histogram can also be a good exit or continuation strategy.

Four color palettes are offered in the settings listing and you can also have a quick symbol changer on the chart, allowing traders to have easy switching for all major 28 currency pairs on a single chart window. If 28 currency symbols are not enough, you can add more in the settings using the “;” separator. If you have too many symbols, you can arrange them in custom formation like 3 rows with 10 symbol buttons or similar. Timeframes switching is also designed similarly, right below the symbol buttons with the option to show up to 9 timeframes.

The mentioned channels are also customizable in the settings where you can change values for the calculation period, and also to set the channel as a ray, extending well beyond the last price level for prediction purposes. Grid settings are optional and the same is for the Support and Resistance automatic plotting.

Service Cost

TDO is priced $50 to buy with 1000 activations. Therefore, traders purchasing this indicator will never run out of licenses. Renting is possible for 1 month for $10 and 3 months for $30. A demo is provided but works only on the EUR/SUD pair with full functionalities, a separate link for it is provided. The price for a great trend indicator is never an issue, especially when we see support form the author and extremely good rating.

Conclusion

TDO has a rating of 4.9 out of 388 reviews and has 552 comments to this date. This is hard to achieve, we had to search a while to find bad reviews, we have found one that signals that TDO might be lagging for some:

“These signals are mostly wrong. Not sure what everyone is talking about. The panel constantly changes and the arrows are mostly wrong.”

Out of the good reviews, to the point is the one from bubienok:

“True Direction Oscillator and Bermaui Deviation Percent are perfect for intraday and also trend trading. Excellent work Muhammad.”

TDO is probably one to go for trend or swing traders, it goes very well with other indicators from this developer, but it can also be a great addition to any system.

This Forex service can be found at the following web address: https://www.mql5.com/en/market/product/12914

Categories
Forex Service Review

EA for Any Levels Indicator Review

Most of the EAs follow a certain method or strategy, but it is uncommon to see an Expert Advisor made for traders to make their custom automated trading system. EA for Any Levels Indicators is such a product published on the MQL5 market. It is coded for the MetaTrader 4 platform and recently published, on the 14th of March 2020. The developer of this EA is Vyacheslav Nekipelov from Russia, selling 16 other products on the same market that do not have much popularity but they are useful and simple. There are no updates to this EA yet but it can certainly be upgraded with many ideas.

The EA can be regarded as a building platform for your system and it is not complicated to set everything up. Of course, there are limitations to what you can achieve, however, there are so many combinations using just the MT4 default indicators. If you are creative, this tool could be the base of everything you do in Forex, and it is affordable too.

Overview

By a level indicator in the name of the EA, it is meant indicators that have measurable levels that can trigger an action for the EA. In most cases, it is to enter a position and execute other directives of the algorithm. For example, one of the indicators can be the RSI for exits or reversal entries. MACD for trend confirmations although for divergence it is not possible to automate. CCI and other line cross indicators are easily implemented.

The Overview page will give you instructions on how to set the EA and the addition of indicators. The file name of the indicators you want to insert has to be typed in the relevant field of the EA setting panel. This string is called “Indicator name”. The indicators folder is ..\MQL4\indicators by default where you can see the exact file name. Indicators that are not by default MT4 installation in this folder can be found online and added to the folder.

These custom indicators can also work with the EA for any levels indicators, they just need to have level cross values for action triggering. Each indicator has its settings such as periods, timeframes, minimum/maximum levels, and so on. These parameters need to be inserted into the EA fields called “Number of indicator parameter” and “Parameter” from 1 to 5. MACD which has 3 parameters ( each the 3 Moving Averages period setting) needs to be filled up. By default MACD setting they are 26, 12, and 9. Once done, you will need to set the levels to trigger Sell and Buy trade entries.

One of the MACD trend confirmation signals is the zero line cross. At this point, the EA will enter the Sell or Buy order depending on the direction of the MA. Since the cross value is 0 at the Zero line, this value is typed in the “Buy level” or “Sell level” field. For the RSI indicator, for example, these levels are 30 for Buy and 60 for Sell since these levels are the default Oversold and Overbought zones of the RSI indicator. The EA does not support levels for the position exists, therefore you will not have a dedicated indicator for this. However, there is an integrated Stop Loss, Take Profit, Trailing Stop, and Breakeven methods for optimized exits. Sometimes the combination of these methods is better than most exit dedicated indicators.

The Stop Loss and Take Profit can be enabled or disabled. If on, you can set a fixed point value for each. Trailing Stop has it’s step parameter and is no different than the classic trailing we have with the MT4. The addition of the Breakeven will allow you to negate any risk you have with a position once it is in profit. The parameter for the profit value is defined in points at which the automatic Breakeven will set the Stop Loss order at the trade entry price. If you want to use the Take Profit distance in currency values, it can also be customized. The settings panel of the EA also has a lot multiplier parameter according to which trades will be multiplied. This is probably the Martingale method of increasing the stakes after each losing trade or maybe some other unexplained EA behavior. Other settings are related to visuals and trade information display on the chart.

Service Cost

EA for Any Levels Indicators cost is $50 and has 10 activations. It is also possible to rent it although if your trading is built on this tool you will probably want to have it permanently. For one month the rent is $15 and for 3 months $30. A demo is available and has been downloaded 41 times till the writing of this review.

Conclusion

The video and the screenshots attached on the Overview page do not disclose any EA backtesting performance. They are merely presenting some of the EA abilities, settings, and guidance. EA for Any Levels Indicators is a platform for the system traders to build with it and the performance depends on many factors. Traders that already have their trading system and want to automate it could try this EA, especially if all of the algorithm rules can be replicated. Overall, the EA is affordable, and will probably stir the imagination of traders of what they can build with it. For now, there are no comments or ratings by the MQL5 community.

This Forex service can be found at the following web address: https://www.mql5.com/en/market/product/47261

Categories
Forex Service Review

Delta EMA Indicator for MT4 Review

EMA or Exponential Moving Average is one of the most used and classic indicators for technical analysis. This indicator measures the difference between the closing candle prices and creates a momentum presented as an EMA in the MetaTrader 4 separate window chart. This idea is not new and is one of the classic ways of measuring momentum. The author made a simple indicator but it is very useful.

Steven Brown from the United States published Delta EMA for MT4 on 14th September 2018, updating it two times just to expand the alert options. The latest version is 1.4 from November 2018. Since the indicator is very simple, there isn’t much room for improvement, adding new functionalities will probably make a new indicator by itself. Still, the indicator belongs to the paid category on the MQL5 market and does not have much popularity.

Overview

The Delta EMA is displayed in a histogram form in a separate indicator window. This histogram will change colors depending on the values of the delta, this way a trader will have an indication if the momentum is suddenly increased. Momentum can be used for trend following strategies, scalping in some cases, and reversals. Trend following is mostly used with momentum crossing the zero line, but adding an overlapping, slower EMA can make the indicator MACD-like and provide another way of trend confirmation. Reversals are signaled by a change of the momentum histogram direction, signaling trend exhaustion and a start of a new one. Note that ranging situations are a bit harder to assess, in these situations the histogram bars are close to the zero line since the change of the price candles is very small.

The best way to filter sideways markets is by adding two horizontal levels to the indicator, creating a range inside which traders should avoid entering trades. Of course, this method would require some testing to find the optimal levels. Scalpers may find the momentum useful as the filter for all trade entries, waiting for the brighter histogram bar for entries in the same direction and quick exits once the momentum starts to diminish on lower timeframes. Our recommendation is to use this indicator in conjunction with other Moving Averages to create custom indicators specialized for a single purpose.

Settings available for this indicator are important, this extends the usability for various strategies and testing. Delta EMA for MT4 has only a few settings. You can change the period for the EMA of the Delta. The more periods, the smoother and slower the histogram will be. Delta factor can also be changed, from 0 to 1 – where the EMA becomes the current delta. The Signal Threshold sets the trigger value for the bright colored histogram bar when the extreme momentum happens. The rest of the settings are related to the alerts and delta printing to the terminal.

According to the author, the default settings of the indicator work well on the H1 timeframe while smaller Signal threshold values are good on lower timeframes. If you want to implement Delta EMA for MT4 into the EA, the Overview page will explain what functions are key to call. Although only users with some coding knowledge would need such information, it is good to see the developer is open for people who want to use this indicator for their EAs. There is only one picture presenting this indicator without any pointers for trading entries, exits, or similar. Beginner traders may find this simple indicator complicated and not obvious on how to use it.

Service Cost

It should not be hard or time-consuming to make this indicator but the price for Delta EMA for MT4 is $30 with 5 activations or $10 to rent for one month. A demo is offered where you can test various combinations or settings before buying. This is not a popular indicator, probably because it is not free, the simplicity of the indicator makes it available on the internet, and there is nothing unique about this one.

Conclusion

The rating is perfect although only based on two reviews. One scalper by the username of rainwalker123, is very satisfied with how the indicator performs on the M1 timeframe. There are no comments published. Steven Brown has 3 other indicators published on the MQL5 market and none of them received any rating, even though they are very interesting.

This Forex service can be found at the following web address: https://www.mql5.com/en/market/product/31721

Categories
Forex Service Review

BBMA Dashboard Indicator Review

If you are familiar with the BBMA trading system, then this indicator or tool is the perfect addon. It is a specialized tool but can also be considered a complete trading system. It consists of multiple indicators designed for this algorithm trading. BBMA system is made by Mr. Oma Ally and the BBMA Dashboard tool is published by Alireza Yadegar from Iran. The system is relatively new, from mid-2016, and the tool soon followed a release on the MQL5 market, for the MetaTrader 4 platform. The developer regularly updates it, adding new functionalities, settings, design, and fixes.

The latest version is 6.1 updated in April 2020. The system and the tool already have some attention from the market. Alireza Yadegar has 9 other products that have similarities with this strategy, also some free and useful tools. BBMA Dashboard is in the paid indicators category although it is affordable considering it Is a complete system.

Overview

BBMA Dashboard has all the elements of the trading system, introducing the dashboard, alerts, and other features. The Overview page does not fully explain the system logic, just how the use the Dashboard. It is also useable by traders that have similar systems or just for having an overview of trading opportunities. Essentially, the system uses the Bolinger Bands indicator, Moving Averages types, and the rest of Money and Risk Management methods defined by the Stop Loss, Take Profit, and indicators. All of the elements can be customized, Moving Averages can be transformed into other types, not just the WMA (Weighted MA), EMA or SMA.

The system is a mix of Moving Averages, on multiple timeframes inside the Bollinger Bands channel. The signals are defined on the crosses, candle crosses, slopes, and other factors. Combining higher and lower timeframes a signal can be aligned, increasing its validity. At some points, the system is following reversals, breakout, and trend following strategies. Scalping is not suggested although it is not evident as inappropriate. On the contrary, scalping is possible with the latest edition that introduces MACD and Stochastic filter, allowing traders to scalp on reentry The Dashboard will show an alert when the WMAs are touching, when the candle is closing outside of Bollinger Bands, when the WMA5 is outside the Bands, and other aspects and rules of the BBMA system.

Having multi-timeframe signals will be essential therefore they are represented as green and red boxes for each timeframe and asset. A gray box means there is no signal, probably means the market is ranging or the price is in between the Moving Averages. The Dashboard is customizable, traders can select what asset will display, or use the automatic mode. Keyboard interaction is supported, also right-click context menus, making the Dashboard interactive and easy to use. Visually the frame of the Dashboard is adjustable by Y and X-axis, also the font, box dimensions, colors, and so on.

In the settings panel, traders have complete freedom. The main functional option is to select what kind of method or algorithm will be sued, as there are many combinations, from “Reentry” to “CSAK” (standing for closing candle beyond Middle Bollinger Band signal). Since the system has many elements, traders will have to find what method they find most appropriate to their trading style. Some of the options listed in the Overview page are Pip distance between the MA for the signal trigger, mid-Bollinger Band level filter, the latest Stochastic and MACD filter, and many alert clauses.

Service Cost

The BBMA Dashboard is specialized for the system that is commercialized by the inventor, that has presentations and classes in Malaysia. The system is easily assembled and the MT4 template can be found online. The Dashboard tool cost on the MQL5 market, however, is $80 with 5 activations, and $40 to rent for 3 months.

Conclusion

A demo is available will all the features on the demo accounts, so you can explore all the features. There are 2 reviews total until version 6.1, giving the tool a perfect rating. The reviews do not say much about the experiences with the Dashboard, but from other sources, we have found many positive remarks. The developer is very supportive as can be seen in the comments section, providing users with directions. He also has a telegram group for contact. If you are a BBMA system follower, the BBMA Dashboard is a must.

This Forex service can be found at the following web address: https://www.mql5.com/en/market/product/41366

Categories
Forex Service Review

Elliot Wave Indicator Review

Traders familiar with Elliot Waves know there are a few elements that need to be determined before executing a trade. This indicator is developed with the idea to trade towards the 5th Elliot Wave in conjunction with other indicators, as a part of the “Trade The Fifth” swing strategy. This is a commercialized product also published in the MQL5 market for the MetaTrader 4 platform. Other platforms are supported but on the owner’s website. The developer is Paul Bratby from Spain who is the presenter of this swing strategy using Elliot Waves, publishing one more product related to this group strategy ideas. The first version is published on 13th December 2019 and has never been updated to date. Elliot Wave Indicator belongs to the paid category but it is not available to buy, this is a subscription-based service with several options.

Overview

The author has not described this system, although there is a video on how to trade and about some of the system components’ roles. However, it is not enough for you to start away with trading and there is no guide. You will need to acquaint yourself with the Elliot Wave theory trading, or, if you are familiar, you will need to understand how the oscillators, zones, and Moving Averages are used. All these additional indicators are integrated into this product. For all the info you will probably need to dig the internet or subscribe to the service. We have a feeling the Overview page is deliberately devoid of any guidance to push for the sales.

Swing trading based on fractals, patterns, and Moving Averages is the core of this indicator-system. The features presented are also pointing out to some reversal and Price Action trading elements, such as the Pull Back Zones, and concentrated price levels. Elliot Wave Indicator has automatic Elliot Wave counting, meaning a trader will not have a subjective interpretation as the indicator automatically recognizes and plots the count. Elliot Wave theory is highly subjective, the waves can be smaller to some and bigger to others, it is a matter of perspective, hence even two traders use the same strategy, the results can be very different. This indicator removes this factor and will be the same. Pull Back zones are the reversal elements of this system using unknown formulas to plot them on the chart. They are colored probably relative to the probability calculations.

The oscillators are customized with additional markings that signal important trading conditions according to which traders may see false breakouts or the right setup to entry and even exit. For example, the Stochastic oscillator has yellow dots in the extreme value range that indicate a strong momentum of the trend and a real breakout. One more oscillator is implemented for confirmation called 5-35 Oscillator. As for the Moving Averages, it is not disclosed what are the settings for these MAs, although based on the screenshots they are forming a narrow channel and have the trend baseline function. This channel does not cover the price tops and bottom levels, it acts just as the ranging filter and trend confirmation.

The video is well narrated and explains a bit about the logic of the strategy but teases by not disclosing enough information to comfortably apply the system. Training is mentioned where you could learn more, of course, if you subscribe to the service. It is difficult to assess how successful this system is, the author does not have a signal offered on the MQL5 with this system or their website where we could confirm the performance. Still, the system does not rely only on the Elliot Waves, it is combining other indicators and, additionally, the Take Profit and Stop Loss levels. These levels are set according to the Target Zone plotted on the chart and tops of the MA channel, for example. Where exactly they are put is not disclosed, but experienced traders can effectively find the right for them regardless.

Service Cost

Users that subscribe to the service will receive additional support, videos, webinars, and the 3 hour Bootcamp where the system is presented fully. The price can be an issue to some as the 1-year subscription is $499. There is no option to buy permanently. Optionally, you can rent for 1 month costing $55, 3 months for $159, and 6 months for $299. There are no reviews still, although the product is relatively new on the scene. A demo is offered and has been downloaded 56 times to date, showing low popularity.

Conclusion

The Comments section is empty. Overall, the Elliot Wave Indicator system is specialized for the followers of the Trade The Fifth group, which may play a major role in why the system is not known on the scene. It is also expensive without any proof of results the group is having. Advanced traders usually do not seek complete trading systems. Elliot Wave strategies follow the concept but it is best to structurally find the right indicators and build your own.

This Forex service can be found at the following web address: https://www.mql5.com/en/market/product/44034

Categories
Forex Service Review

Advanced Price Movement Predictor Pro Edition MT4 Review

Given by the name one could think this indicator uses candle patterns or other non-lagging methods to predict trends. However, this is not true, this is a combo indicator for the trend following strategies using Price Action methodology. It is developed for the MetaTrader 4 client by Boris Armenteros from Spain, as the leader of the Barmenteros team. This team has some trading and coding experience having at least 15 products released on the MQL5 market. Advanced Price Movement Predictor is initially published in January 2014, however, it is not updated frequently.

The latest update was in September 2014 having a few minor fixes and alert additions. Note that this does not mean the product has lost support, the Comments section shows the latest activity in 2019 and the team has published ForexFactory thread for this indicator. This is a paid indicator with multiple formulas incorporated making it almost a complete trading system.

Overview

The service’s overview page does not tell much about the indicator formulas, it is mostly made as a guide for the less knowledgeable, with mild marketing elements. Shortly put, the author describes it as a short-term price movement analysis tool based on advanced math. By looking at the features list we have noted some key points. Support and Resistance levels are heavily used and that the indicator is self-adjusting making it universal for any timeframe and market. Again, the author is using vague descriptions highlighting complex calculations, advanced math, statistics, and probabilities.

The result users will see is simple. The indicator’s info panel will display if the trend is Up, Down or Flat. Therefore, even this is not highlighted in the Overview page, flat markets are detected also and, of course, useful for trend-following traders as these market conditions are unfavorable for them. Another feature of APMP is the automatic chart recognition of the Support and Resistance levels. These levels are displayed on the indicator panel also using the higher timeframes. If these levels overlap, the indicator will see it as the congestion point and more reliable level.

It is also possible APMP uses the Fibonacci levels as it is one of the most popular Price Action indicators. Stop Loss level can be placed in between the Support or Resistance points, as the author suggests, or in our opinion, another indicator should be used for this purpose, such as the ATR. A trailing stop is also one of the options for the trade exit. APMP is not designed to indicate the trade exit, so additional indicators should be added to the system. The info panel will display designated colored boxes for each timeframe, signaling the trader if there are any trends there. Traders can decide and create their own rules for entry or exit based on this.

Some users report that the indicator may use a linear regression method for trends among others. Since the linear regression channel can be extrapolated to show the estimated or predicted price movement domain, this may be the reason for the indicator name. However, the indicator can be measured in the MT4 tester, just note that the results do not account for the Support and Resistance levels. Doing this manually can also be a problem given the fact these levels are drawn in real-time and updated without a stamp on the chart. On the other hand, this indicator is EA friendly, so a part of his functionality can be tested if it is integrated into the EA.

Service Price

Advanced Price Movement Predictor Pro Edition price is $50 and provided with 5 activations. Interestingly, on the developer team website,m this indicator is $60 with several other versions for $45. They are all also available for the MT5 platform. Some features for this cheaper version are excluded such as “Intelligent finding of congestion zones”, “Price movement prediction of ALL timeframes” and similar. There is no possibility to rent this indicator and the demo should be downloaded for the barmenteros.com website instead of the MQL5.

Conclusion

User ratings show an average score of 3.8 stars based on 8 reviews. This is not great although we could not find any helpful bad review except one from Haki1215: “not good to use, I just use MACD Stoch ADX MA to trade much better.” APMP popularity is not low considering more than 140 comments left, however, user reviews are not good enough to boost it to stage. This is probably a great indicator for beginner trend following traders since sideways filter is integrated with the rest of fundamental factors. Experienced traders usually avoid such indicators where exact formulas are not disclosed.

This Forex service can be found at the following web address: https://www.mql5.com/en/market/product/2732

Categories
Forex Service Review

CSM Currency Strength Meter Indicator Review

Currency Strength meter indicators are interesting to many traders and have many uses, not necessarily to enter new positions. CSM indicator is the work of Aliakbar Kavosi from Iran releasing the first version of CSM in March 2016 for the MetaTrader 4 platform and updated it twice in late 2019, giving the indicator a new code and better symbols integration with various brokers. This author is the owner of 18 published products on the MQL5 market without significant attention from the users. CSM is not free but seems to do other Currency Strength meters do, just with a small deviation.

Overview

This indicator combines two methods of calculation the currency strength, Absolute currency strength (ACS), and Relative currency strength (RCS). CSM is further extended with the option to select symbols on majors or minors with the addition of Bank for International Settlements (BIS) factor. It is not very clear what this factor affects but it is meant to adjust the currency values to represent more valid data. The uses are just as with other meters, traders that rely on line crosses or overbought/oversold ranges can naturally use for reversals or trend confirmation.

On the other hand, it is not for low timeframe scalpers, the data that this indicator is presenting in the window is too messy and unreliable in lower timeframes. Reliability is adequate at H1 and higher. Other uses are just filtering for both trend confirmation or following, for example, enter only sell position for currencies getting weaker or when the currency is in the set oversold range. The zero line can also be a factor for this purpose.

According to the author, this tool is handy when trading the news, if the difference between currencies is above 3 or 30% without the BIS factor, the signal is strong. BIS reporting could be a good addition to this indicator although the real value is expressed on how effectively it can be used. We have noted that the developer may not have extensive experience in trading, some sources on the Relative currency strength (RCS) published on the Overview page is from Wikipedia.org, which is not professional or specialized for Forex, especially for indicators. Providing suck link to the indicator Overview page is not a good sign, the author may lack practice and builds indicators based purely on theories. This fact reflected on the CSM popularity.

CSM will show a histogram and the currency lines chart. The Strength readings vary from 0.0 to 9.0 and are displayed in the right part of the indicator chart, beside each currency. A value of 9.0 is the strongest, and is the BIS factor is not used it will be shown as 100%. They will be automatically sorted to help traders find the strongest one easily. In RCS mode, CMS shows the strength of 8 major forex currencies, while in ACS mode the range is extended to non-majors. The settings panel will allow all this to be set, additionally visuals and toggles for each currency line, etc. CSM code is EA friendly according to the author.

Service Price

The price for this kind of Currency Strenght meter is $30 with 5 activations, 10$ to rent for 1 year and a Demo is available.

Conclusion

Probably the most interesting about this one is the mixed modes, Absolute currency strength (ACS), and Relative currency strength (RCS) with the addition of the BIS filtering factor. How useable is all this is unknown, there are no reviews by the MQL5 users. The two published comments are just not enough. Even if the rest of Aliakbar Kavosi’s products are not popular, it does not mean they do not provide value. It is recommended to try CSM before anything, especially if you are a trend following or reversal trader cautious about the fundamental analysis.

This Forex service can be found at the following web address: https://www.mql5.com/en/market/product/15258

Categories
Forex Service Review

Support and Resistance Zones Indicator Review

Price Action traders know Support and Resistance levels are the dominant element in their analysis, as well as other strategies. Support and Resistance is an elementary factor assessed for the prediction of points of trend reversals in both directions. This indicator is designed for the MetaTrader 4 for automatic recognition of concentrated prices based on which the zones are plotted on the chart. The indicator that can determine these levels instead of the trader makes the whole process faster, more precise, and non-subjective.

Overview

Support and Resistance Zones first appearance was on 21st October 2015 on the MQL5 market, developed by Mihai-Andrei Mitrache from Romania. This developer has his team for analysis and automated solutions although only two products are offered on the MQL5 market and their website. The latest version is 8.3 from the beginning of 2019. It has been updated many times with additional features, bug-fixing, and stability. It belongs to the paid category and has changed prices a few times according to the past user comments.

Automatic zone recognition has two modules for this purpose. The first one is gathering values on the historic peak levels, or highs and lows. These points are recorded and they form clusters. This data is passed on to the second algorithm module which disregards the values least repeated and accurately defined the clusters. These concentrate price levels are then represented as horizontal ranges on the MT4 chart creating the Support or Resistance levels. As an additional feature, the zones are divided into week normal and strong, depending on the price concentration, each shaded with a different color. Therefore, the Support and Resistance Zones indicator is not taking into account the Fibonacci zones, it is purely constructed on the mentioned modules.

The indicator is dependant on the historical price movements, this data is needed to find the levels and clusters. If you do not have enough history, the author suggests downloading from the History Center in the MT4 platform. You just need to select the asset and the timeframe. Once done you will be able to adjust several parameters to accommodate the indicator to your strategy. Setting the number of history bars, the indicator can be adjusted to use more recent price clusters instead of relying on old data. For traders that use lower timeframes, for example, M5, some important historic price levels could be important from a few days back, therefore the history range can be increased.

You do not need to use Support and Resistance zones for the current timeframe if traders think zones from higher timeframe are more reliable, the indicator features this setting. The Snap to Price setting is an extension that aims to adjust the zones to the recent price changes, regardless of the history bars scanned. This is especially useful if you want to clean the chart of excessive zones, not relevant to the current market. Snap To Price Percentage will define how far a trader wants to account for the recent period. We have mentioned the zones have strong, weak, and normal levels if you for some reason what only the strong zones, this can be optimized using the Zones Power Display.

Support and Resistance zones with are defined by at which level the cluster is defined, or the “sharpness”. Changing the S&R Power Split Display will result in thin or wider zones. You can also customize and enable what will be displayed from the settings range on the chart, so you have control of what is enabled. The indicator has a wide range of settings that extends how it can be used to various strategies, and some traders, it is important to have a tool that eliminates the subjective chart interpretation.

Service Price

The price of Support and Resistance Zones indicator has seen some drastic changes over the years. At one point it seems the price was above $500, which is certainly too high for a specialized indicator. As of now, the price is $85 with 10 activations. Renting is offered for $15 for one month and $25 for 3 months. Demo version has been downloaded 1247 times, showing mediocre popularity, although one could expect more since this is a common element in many strategies. However, the rating is perfect 5 stars from 5 reviews.

Conclusion

The only useful review is left by Lev Vladimirovic Marushkin:

“So far I am very pleased with the indicator and the support. I use this one mainly for entry confirmation and for taking profit and the MTF possibility is a very nice feature! I have both indicators of this author and they are both great in helping you to earn some green pips. 🙂 Thank you Mihai-Andrei for creating this!”

If you rely heavily on the Resistance and Support lines, even though they are regarded as non-existent in forex by part of the traders’ community, this indicator is based on logical and empirical methodology with plenty of changeable features.

This Forex service can be found at the following web address: https://www.mql5.com/en/market/product/12395