In forex trading, some indicators are a case study in making sure you’re using the right tool for the right job and what can go wrong when you take something at face value without doing your own research.

The Parabolic SAR is a great example of an indicator that absolutely crushes some traders – particularly beginners and traders who aren’t properly testing their tools. Like a lot of forex trading tools out there, the SAR is advertised as being good at one thing but it turns out that this superficial understanding of it leads you down a dead-end and can cause your portfolio serious harm if you use it wrong. And, just like a lot of other indicators out there, there may well be legitimate and effective uses for it that lurk beneath the surface but that you will never discover if you just use it out of the box, without taking the time to examine it properly.
This is precisely why the parabolic SAR merits a closer look. That means both that we’re going to talk about it here but also that you should put in the work and properly test how it can fit in with your trading setup.
What is it and Why is it?
There’s a recurring theme in the forex world and the world of trading in any kind of securities more broadly and that’s that the people who dream up and develop indicators and tools are just downright bad at naming them. So many times you’ll come across a tool or method or indicator and you’ll think it’s good at doing one thing because of what it’s called but, on further examination, you’ll realize that it’s actually no good at that thing and you end up using it for something completely different – sometimes you’ll straight up use it for the opposite of its intended application.
That’s kind of the case with the parabolic SAR, which is an acronym of Stop and Reverse. The indicator was the brainchild of pretty much the daddy of a whole host of technical trading indicators – you may have run into him before but if you haven’t, his name will still crop up often enough that you’ll end up remembering it anyway: Welles Wilder Junior. He came up with some of the most-used indicators out there, the Relative Strength Index (RSI), the Average True Range (ATR), the Average Directional Index, and, among them, the Parabolic SAR.
Now, it’s true that he came up with a lot of these indicators to assist equities traders rather than forex traders – they were mostly developed in the 1970s and 80s, well before spot forex trading was even a thing – but the fact that they are still so familiar to us today speaks to the fact that there is often still some value in them. And there is potentially some value in the parabolic SAR, it’s just that it may not be in using it as it was originally intended.
Wilder developed the SAR because he was looking for a way to measure an asset’s momentum in such a way that it would be possible to calculate the point at which it becomes more likely than not that the momentum would switch direction. The idea he had was that a strong movement in the momentum takes on the shape of part of a parabolic curve. A parabolic curve looks a little like a graph of exponential growth and traces a gentle arc from the near horizontal to the near-vertical. In the SAR, the momentum doesn’t always follow through the whole curve and might only mark out a section of it – nonetheless, that’s where the first part of its name comes from.
Wilder also noticed that when the price catches up to the curve mapped out by the momentum, the odds that it would change direction became higher than the chance of it continuing in the same direction. This meeting point of the momentum arc and the price is then the stop point and a reversal here becomes likely – hence stop and reverse.
Reversal Hunting
There’s one great thing about the Parabolic SAR that’s immediately obvious to everyone who comes across this thing and that draws traders into actually using it and that is that it’s almost ridiculously easy to read.
Now, to the more seasoned traders out there that might seem like a bit of a nonsensical thing to say, they would immediately see that as a red flag and be like, “well, you know what, just because something is easy to read doesn’t automatically mean that it’ll actually work the way it’s intended”. And they’d be right of course but once you’ve been trading a while it becomes kind of difficult to take yourself back in time and put yourself in the mindset of someone who’s just starting out.
Traders who have never seen anything like the SAR before will be immediately impressed with how clear and simple it is and how straightforward the signals it sends you are. And that’s its initial appeal – it looks like it does exactly what it was advertised to do and there’s zero input required from you the trader. You just plug it in and it’s ready to go.
On the surface of it, the SAR was developed as a reversal indicator that tracks momentum and then tells you, “hey, momentum has bumped up against price here, there’s a reversal unfolding”. And if you don’t look at it in any greater depth than that, this superficial approach to it is going to lead you down a blind alley where you could find yourself embroiled in some very serious losses.
The first thing to point out here is that reversal trading is a very dangerous, high-risk business and if you’re not 100% sure of what you’re doing, it is very hard to be in the small, elite club of traders that can make it reliably and sustainably work for them. If you are new to trading or even if you have a couple of years of experience under your belt and you decide to go hunting reversals using the parabolic SAR, you are doubly in trouble. Not only will you almost certainly run into big losses running reversal trading without an array of measures and systems (such as risk assessment, money management, and a thoroughly tested and evaluated toolkit of indicators and strategies) designed to cut back on bad trades, you will also be applying the wrong tool to the wrong job.
Reversal trading is not for the faint-hearted and it most definitely is not for beginner traders. But more than that, the parabolic SAR just isn’t a good indicator for the job. It will, almost without fail, call out reversals that are immediately followed by retracements – go test it out, it’s almost uncanny.
Alternative Uses
So if it sucks at doing what its name says it’s good at, what is the SAR actually good for? Well, those of you who have by now become accustomed to taking indicators for a spin around the testing range will be familiar with this one phenomenon that crops up all the time.
What happens, even with quite experienced traders, is that you’ll take a tool or an indicator and start backtesting it, and when you see it takes you into a trade, you’ll measure out how much of a win that trade would have been. So, if you see it take you into a trade that runs for, say 600 pips, you’ll say to yourself, “awesome, this thing is great, I just took home 600 pips!” Well, no, no you didn’t. If you were really making that trade in real-time, there’s no way that you would have taken all 600 pips of that run. Your trade entry and exit just cannot be that perfect in the real world. If you’re lucky, you might have grabbed half of it and taken a 300 pip win but more likely you’ll only have been able to realize something like a third of the whole movement and taken 200 pips.
Now, of course, the reverse is also true and you might have seen that move switchback early on just far enough to blow out your stops so you would have to count it as a loss. One would hope that you have the right money management approach to cut down on that loss by ensuring that you are going into the trade with the right stake that allows you to set your stops at a point that allows a bit of leeway in the price movement. The other thing that you can do here to maximize your win is to apply the right technical trading tools to ensure that you can reap as much of the reward as possible.
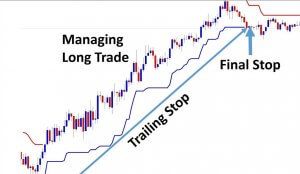
This is where the SAR comes in. Not, probably, as your primary entry indicator but more as a secondary, confirmation indicator that helps you to see out a trade to the maximum possible point. In short, you can use it as a trailing stop.
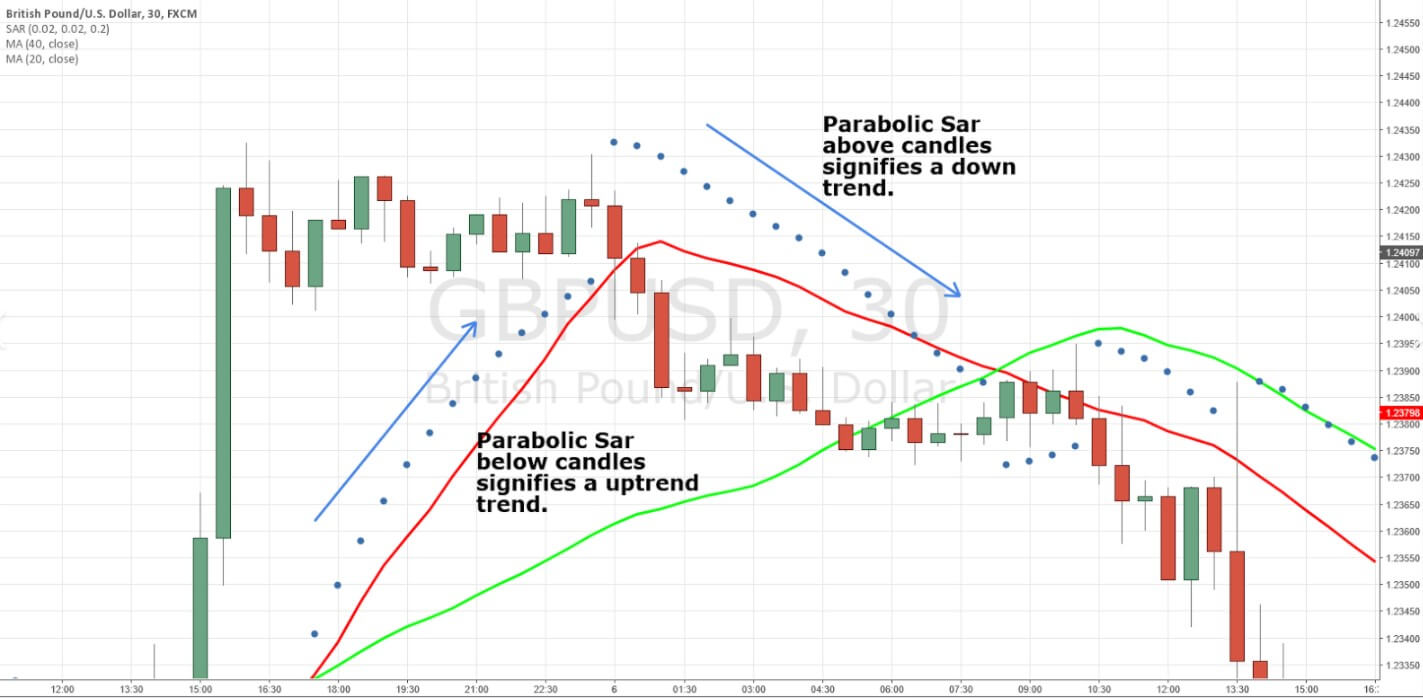
On your chart, the SAR will appear as a series of dots above and below the price that appears as lines – those are the sections of the parabolic curve that we talked about before. When the lines of dots cross the price line, they will flip across to the other side. In reversal trading, this is supposed to be a signal that a reversal is happening but – as we saw – that’s not the best way to use these things.
Context
It’s important to know when to use the SAR because, like a lot of other indicators, it only works in certain market conditions. The main thing to remember is to absolutely never use the SAR when the market is choppy. If you see that the market is ranging or heading sideways or even if there’s a weak trend then you are not going to want to use SAR because it will throw up lots of little false signals that will make it impossible for you to make any money out of the trades it leads you into.
So, the best way to approach the SAR is to use it once you have already identified a strong trend in the market and in conjunction with a primary indicator (or set of indicators) that will lead you into a trade. Under these conditions, the SAW can really shine.
When your system identifies a trade entry on a strong trend and you make the decision to pull the trigger, you can use the SAR as a continuation indicator to lead you down the movement to the point at which you can exit and still walk away with as many pips as possible.
To get accustomed to how this might actually function out in the real world, you will have to put in the work and try this thing out on your historical charts and through a demo account – making sure you combine it carefully with the tools you already use.
Round-Up
In short, the main things to take away from the SAR are that you should never ever use it in either of the following scenarios: a) as any kind of reversal indicator – it does not do this job well and it will lose you money; b) in any way shape or form if the market is not in a clear, strong trend – if there is any fuzziness to the market or even a weak, watered-down trend, don’t use the SAR.
But in its capacity as a secondary or confirmation indicator that you use as a trailing stop or continuation indicator that leads you through a trade you are entering (when the market is already in a strong trend), it has the potential to help maximize your wins.
Finally, make sure you test it for yourself and that it works in the system you have set up to suit your trading needs and preferences. If it doesn’t fit into this, never fear, there are plenty of other trend indicators out there that will do a similar or better job and all you have to do is get out there and find them.