There are special ways we can take signals out of an indicator, ways not described by default. In many cases we find an indicator that is not very good for its role in our system, we have better-performing ones. We try different settings to improve it and this may take a lot of time when we backtest, especially if there are many settings.
Now, if you are a veteran in technical analysis, you probably have tested many indicators and know about adding Moving Averages on top of indicator data. If not, we have done an article about this customization that could generate very accurate signals out of simple, mediocre indicators we have scratched as bad on our top list before. Whatsmore, even indicators that have a different role by default can be converted to other roles just by adding MAs.
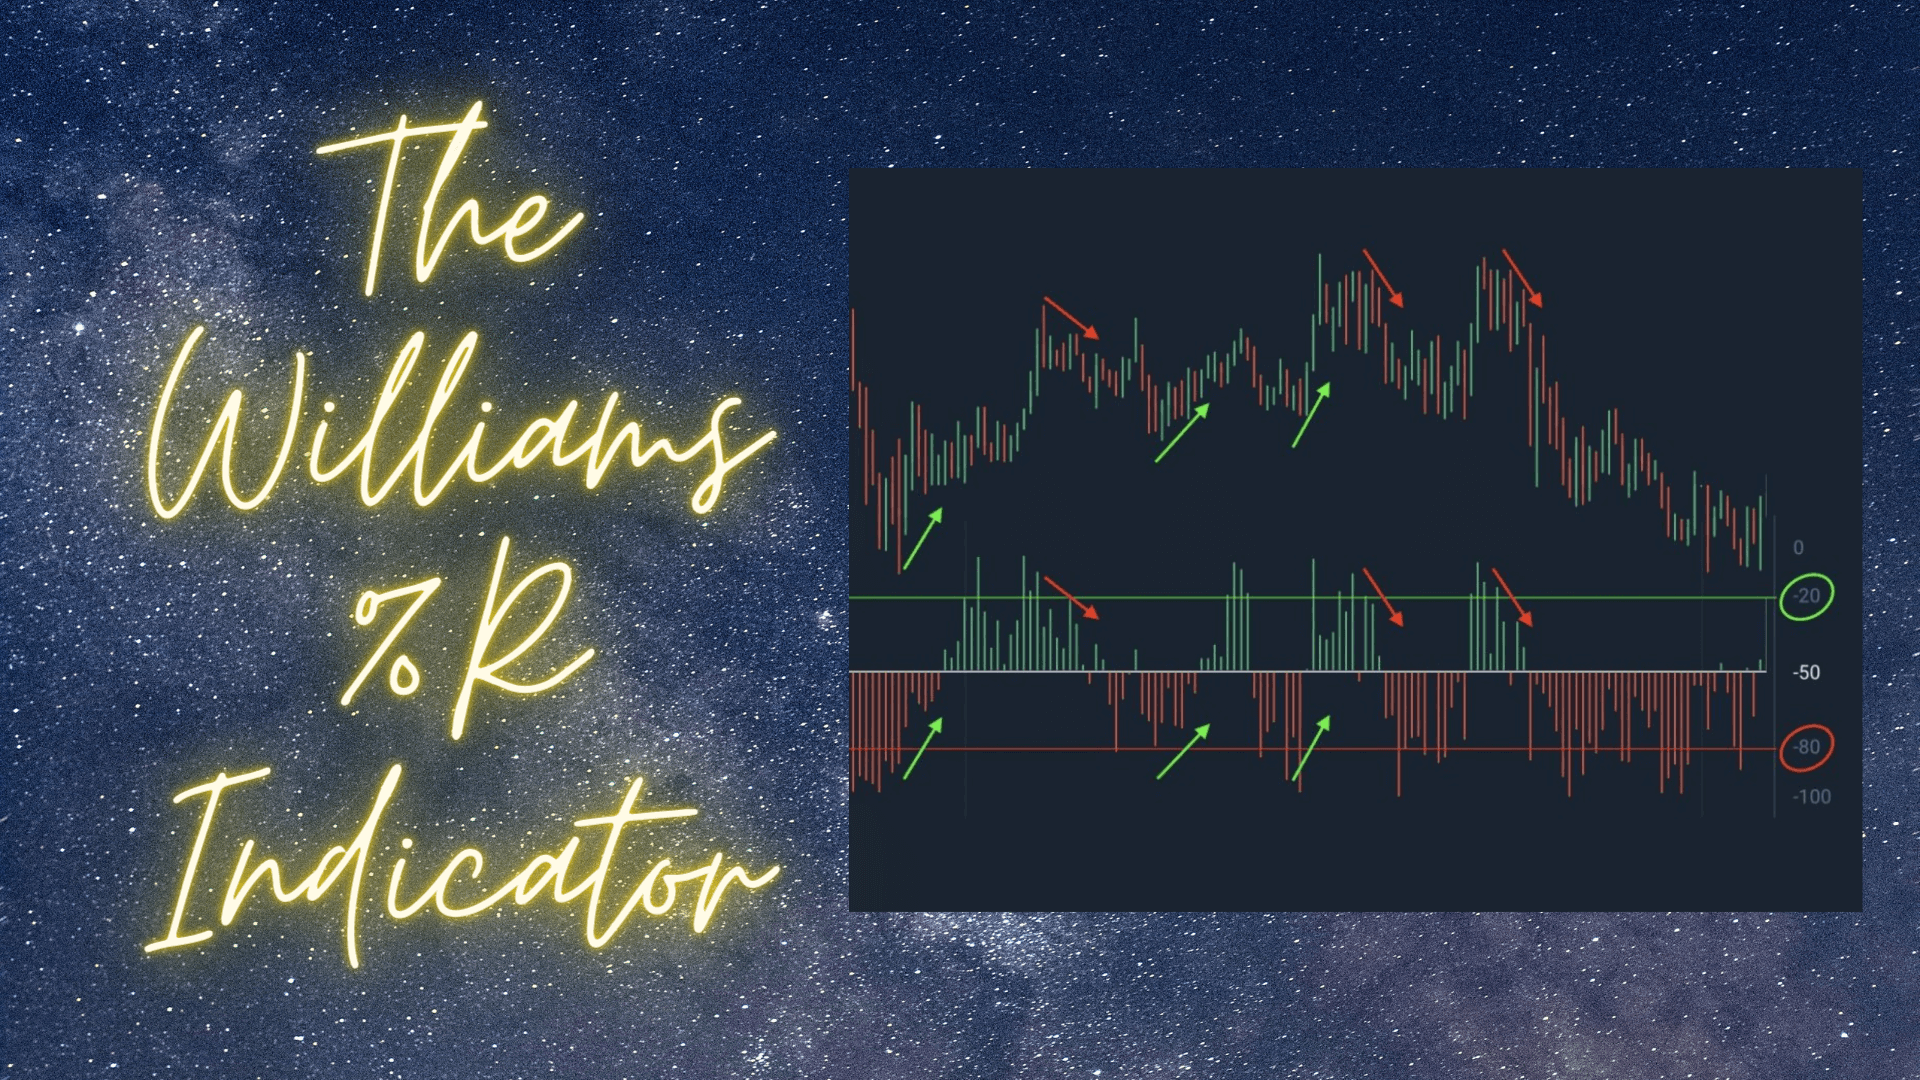
The Williams %R is a reversal type indicator, an oscillator with overbought and oversold signals. In theory, it does not fit into the trend following method of trading and we might just skip it because our system is designed and needs trend confirmations. When we discuss exit indicators, the reversal type indicators fit very well into this exit signal role. Yet Williams %R is probably not good enough even as an exit indicator for your trend following system. Thorough analysts do not move on until they exhaust all possibilities out of an indicator, be it by adding MA if possible, changing settings, or interpreting signals for other, unorthodox uses. In this article, we will tackle how a mediocre indicator in all categories can become our top indicator just by having a different view of its signals.
Very few reversal indicators can be made a good trend indicator. They are simply not made for that role. Williams %R is a rare diamond by accident that can be made useful. Williams %R is not in the Bill Williams indicator family where you can find Awesome, Alligator, Fractals, MFI, and others, which are generally not great for trend following algorithms according to professional prop traders. Williams %R is made by Larry Willaims and it is already integrated into the MT4 platform so you do not need to look for it. The settings by default are not optimal if you want to trade it using our algorithm structure but you can try and test different settings, every system is unique. As our traders say, typically they do not test indicators with lower period settings than by default. It is usually done with defaults or a bit longer to smooth the indicator, but Williams %R is another exception.
According to our tests and testimonies from professional technical traders, the daily timeframe is the best choice for many reasons, not only performance-wise. However, Willimas %R seems to be better at lower frames than the daily. This does not mean that if you trade on a daily only Williams %R is not useful. You will need to test. Lower timeframes, even 4 hour is good enough just do not go lower than 15 minutes. Williams %R is a confirmation indicator with the way we use it, but it is not great for continuation trades. The way we use it is completely the opposite of what it is made for. Let’s get into more detail.
In the picture below we have already included Williams %R with a modified period setting to 8, the Kijun-Sen from the Ichimoku indicator on default settings as our baseline and we are on the 4-hour timeframe. Williams %R has another interesting fact – it has a scale from 0 level and below. The area from 0 to -20 is regarded as the overbought area and the area from -80 to -100 is the oversold area. It is rare to see indicators with these values but do not be confused, if you want to add the “zero” line to experiment just add a horizontal at -50. Similarly to the popular RSI indicator, Williams %R generates a signal once the oscillator line crosses the overbought and oversold levels into the middle range.
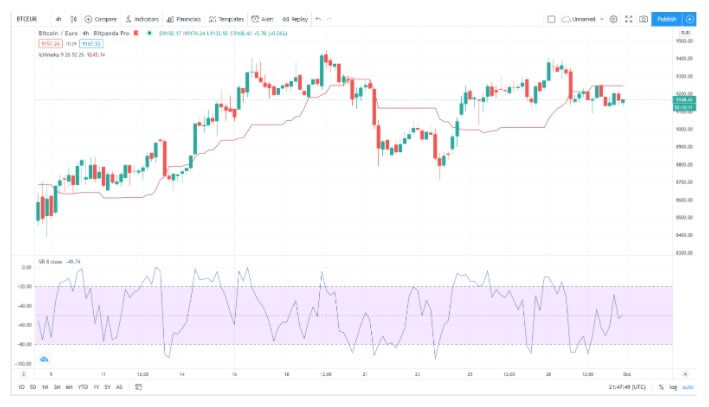
When applied on the BTC/EUR chart above we see a lot of signals that didn’t end well, most likely in a loss when interpreted in a classic way. On certain occasions, the signals were very good, as the bullish trend on the left side of the picture. False signals frequency is hard to eliminate here, even if we add the volume filter. Simply, Williams %R has a choppy behavior by default so we need something to counter this issue.
When we observe how and when trends start, it is noticeable every trend starts when the line enters either the oversold or overbought area of the indicator. In the picture below we have marked all entries allowed by the baseline. Out of 6, only one was a losing trade, and that one was a small loss compared to the trends captured. This way gives out interesting and consistent results, even though the indicator was never designed for it. For those not familiar with the baseline element in our analysis, only when the price crosses and closes above or below it we look at the Williams %R for a trade entry signal. If you go to lower timeframes such as H1, 30M, and 15M, this way continues to give you good signals. Beginner traders that like trading on lower timeframes deviate from our algorithm principles, however, Williams %R is a good to go indicator which will likely outperform their current confirmation indicators. When the market is ranging, this indicator will rarely give you a signal, often the line will stay in the normal range, making it a great loss eliminator. When you par it up with the volume filter, you can scratch almost every fake signal in a ranging market.
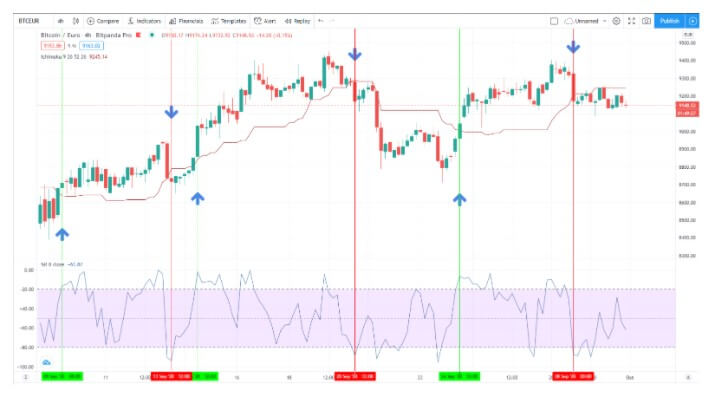
To conclude, we flip the original signal interpretation. A classic way of trading this indicator is going long when the Williams %R line exits the oversold range into the normal -20 to -80 area and going short when the line exits the overbought, upper area. Now we flip this into going long when the line enters the oversold and overbought areas. This is similar to the CCI, and some momentum oscillators, but Willimas %R does the job better according to our testing. As for exit signals and continuations, it does not prove to be as efficient, however, we encourage you to test this out. Finds like this are not so rare if you try to research and test every interesting indicator. When you see it is very bad at its first intention, a small twist in settings, Moving Average addon, or another signal interpretation can flip it into a top indicator. Adding Moving Averages on this indicator is possible which brings a whole new area for interpretations across different roles. Note you need to select Apply to “First Indicator Data” first so the MA is on top of the indicator window.

