Categories
Forex Indicators

The Williams %R Indicator: Winning Custom Interpretation Twists

There are special ways we can take signals out of an indicator, ways not described by default. In many cases we find an indicator that is not very good for its role in our system, we have better-performing ones. We try different settings to improve it and this may take a lot of time when we backtest, especially if there are many settings. 

Now, if you are a veteran in technical analysis, you probably have tested many indicators and know about adding Moving Averages on top of indicator data. If not, we have done an article about this customization that could generate very accurate signals out of simple, mediocre indicators we have scratched as bad on our top list before. Whatsmore, even indicators that have a different role by default can be converted to other roles just by adding MAs. 

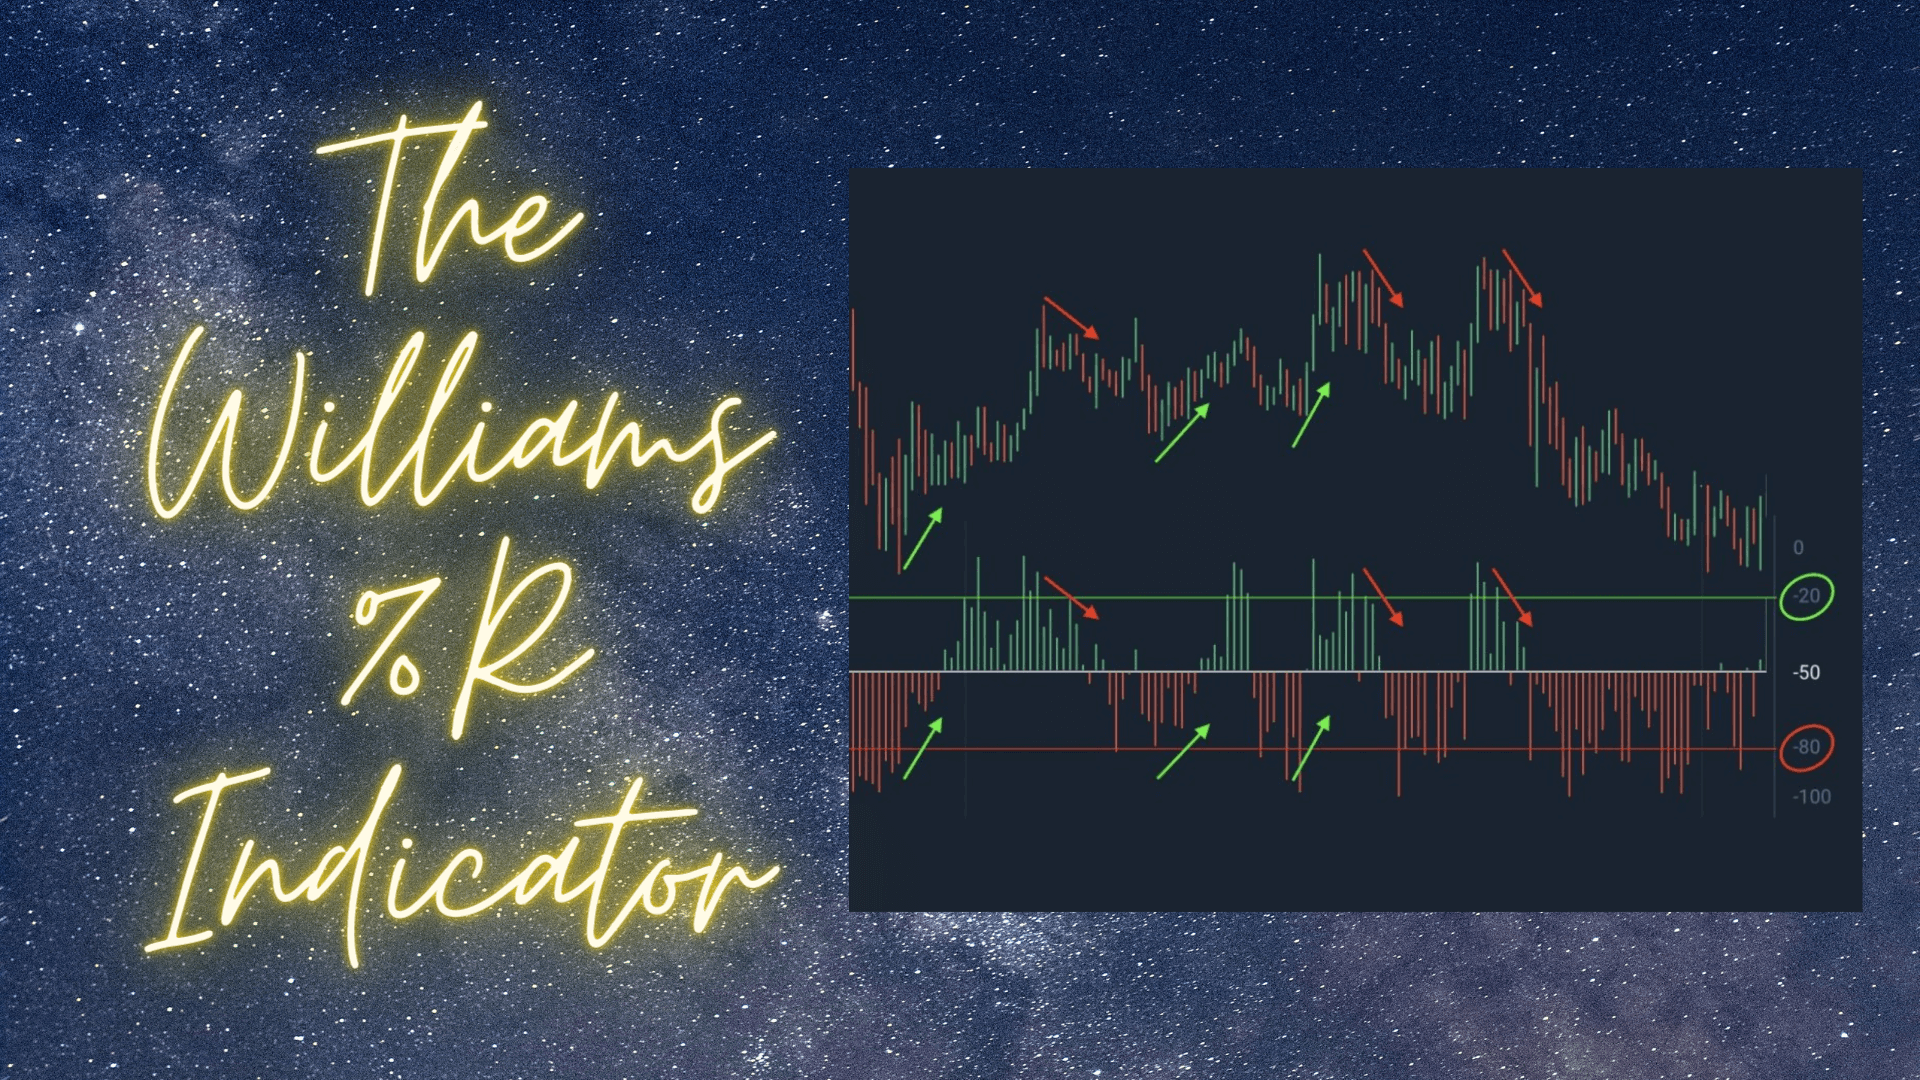
The Williams %R is a reversal type indicator, an oscillator with overbought and oversold signals. In theory, it does not fit into the trend following method of trading and we might just skip it because our system is designed and needs trend confirmations. When we discuss exit indicators, the reversal type indicators fit very well into this exit signal role. Yet Williams %R is probably not good enough even as an exit indicator for your trend following system. Thorough analysts do not move on until they exhaust all possibilities out of an indicator, be it by adding MA if possible, changing settings, or interpreting signals for other, unorthodox uses. In this article, we will tackle how a mediocre indicator in all categories can become our top indicator just by having a different view of its signals. 

Very few reversal indicators can be made a good trend indicator. They are simply not made for that role. Williams %R is a rare diamond by accident that can be made useful. Williams %R is not in the Bill Williams indicator family where you can find Awesome, Alligator, Fractals, MFI, and others, which are generally not great for trend following algorithms according to professional prop traders. Williams %R is made by Larry Willaims and it is already integrated into the MT4 platform so you do not need to look for it. The settings by default are not optimal if you want to trade it using our algorithm structure but you can try and test different settings, every system is unique. As our traders say, typically they do not test indicators with lower period settings than by default. It is usually done with defaults or a bit longer to smooth the indicator, but Williams %R is another exception.

According to our tests and testimonies from professional technical traders, the daily timeframe is the best choice for many reasons, not only performance-wise. However, Willimas %R seems to be better at lower frames than the daily. This does not mean that if you trade on a daily only Williams %R is not useful. You will need to test. Lower timeframes, even 4 hour is good enough just do not go lower than 15 minutes. Williams %R is a confirmation indicator with the way we use it, but it is not great for continuation trades. The way we use it is completely the opposite of what it is made for. Let’s get into more detail.

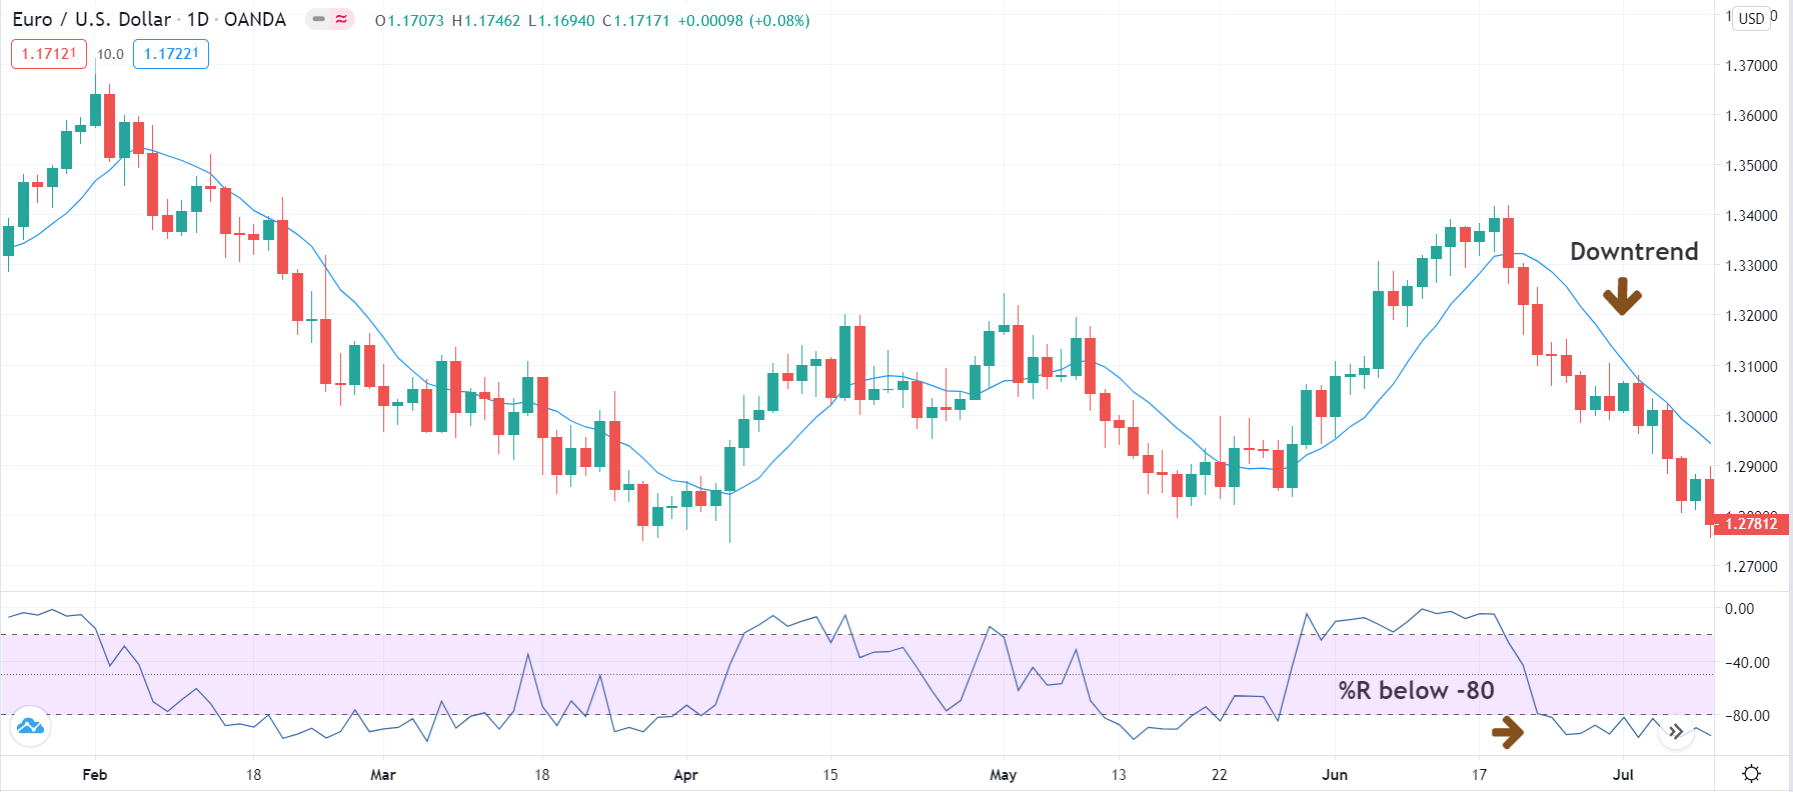
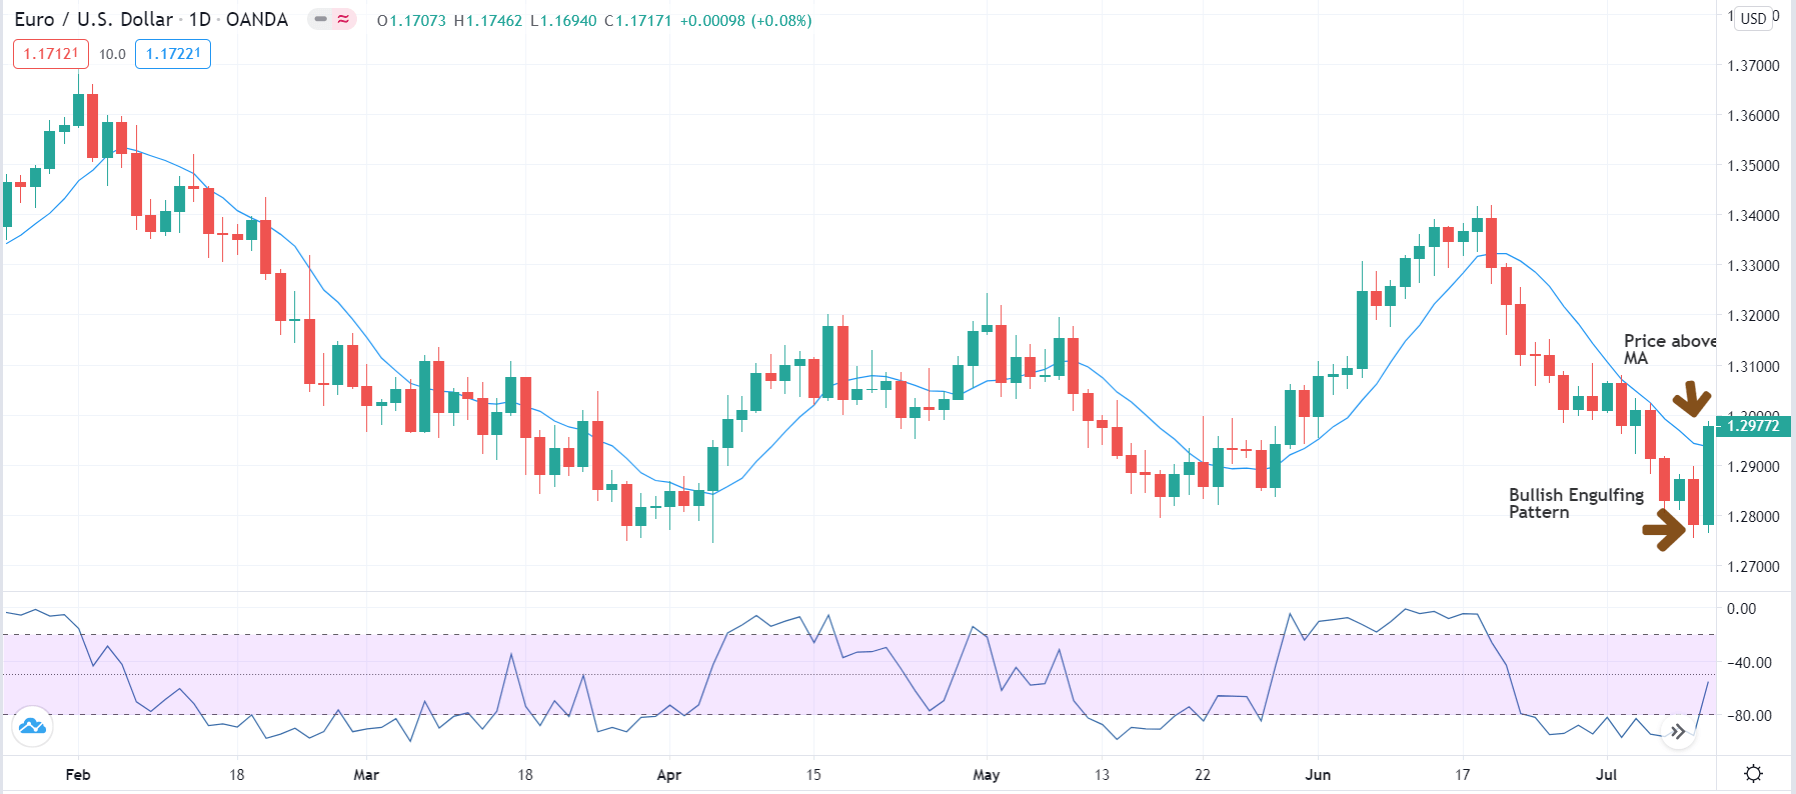
In the picture below we have already included Williams %R with a modified period setting to 8, the Kijun-Sen from the Ichimoku indicator on default settings as our baseline and we are on the 4-hour timeframe. Williams %R has another interesting fact – it has a scale from 0 level and below. The area from 0 to -20 is regarded as the overbought area and the area from -80 to -100 is the oversold area. It is rare to see indicators with these values but do not be confused, if you want to add the “zero” line to experiment just add a horizontal at -50. Similarly to the popular RSI indicator, Williams %R generates a signal once the oscillator line crosses the overbought and oversold levels into the middle range. 

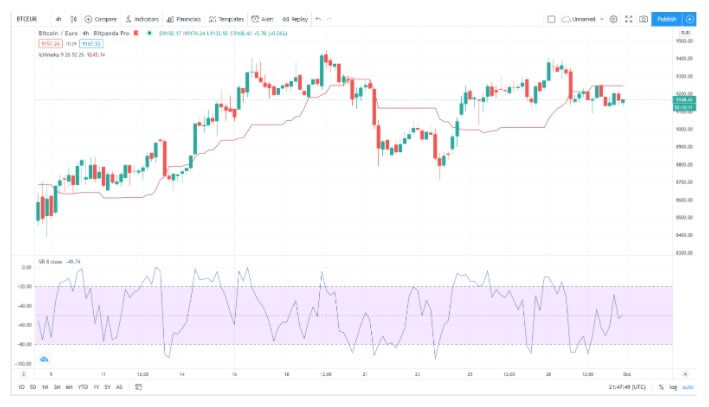
When applied on the BTC/EUR chart above we see a lot of signals that didn’t end well, most likely in a loss when interpreted in a classic way. On certain occasions, the signals were very good, as the bullish trend on the left side of the picture. False signals frequency is hard to eliminate here, even if we add the volume filter. Simply, Williams %R has a choppy behavior by default so we need something to counter this issue.

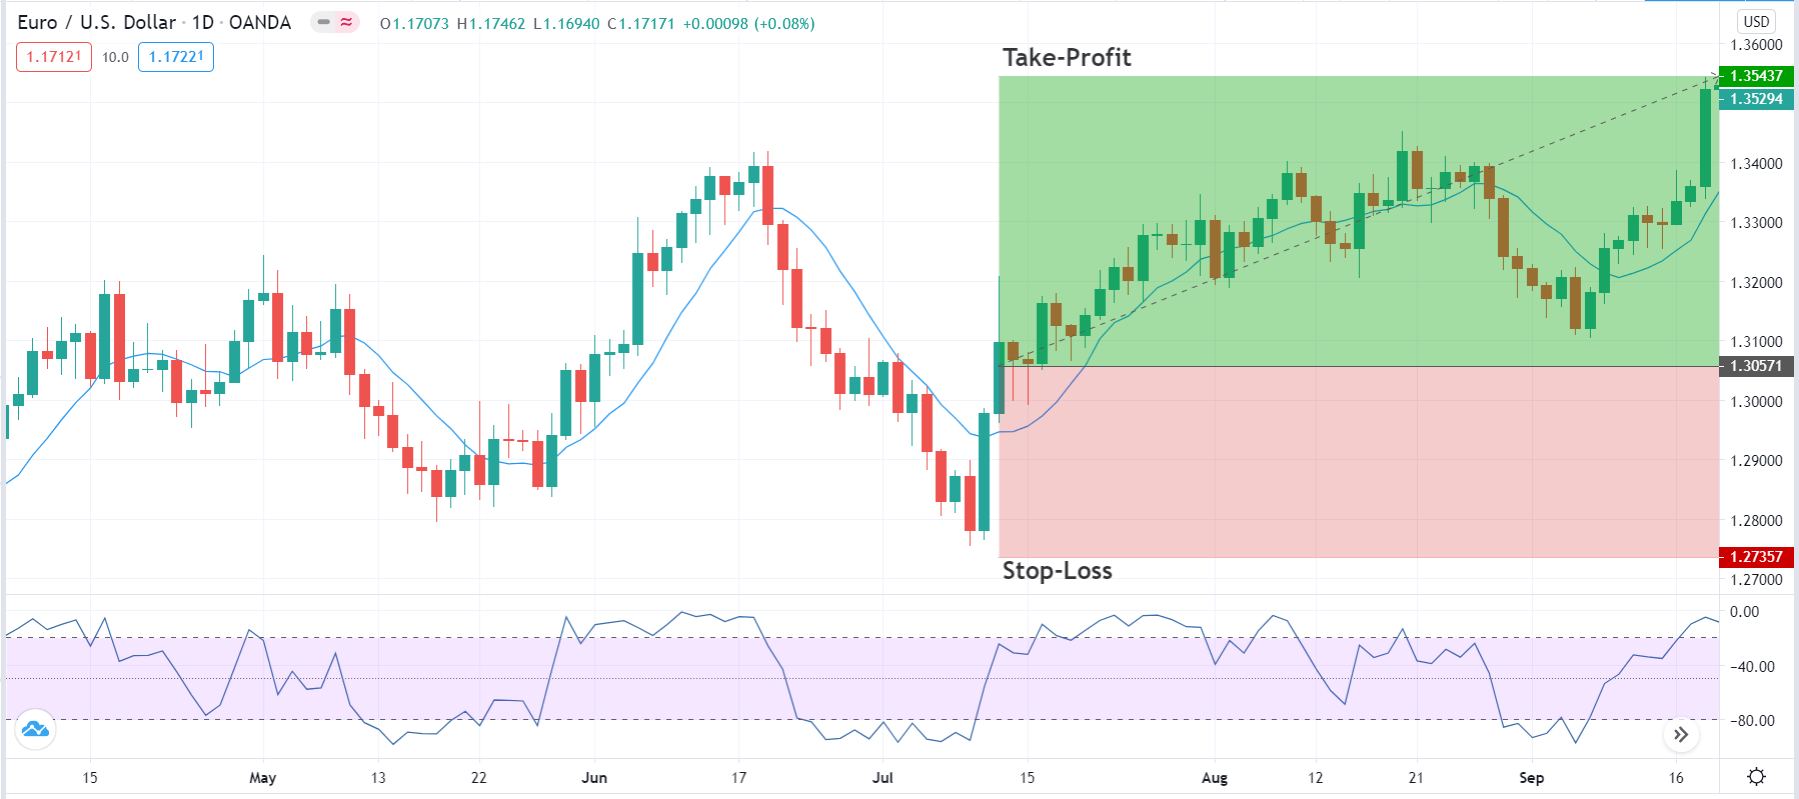
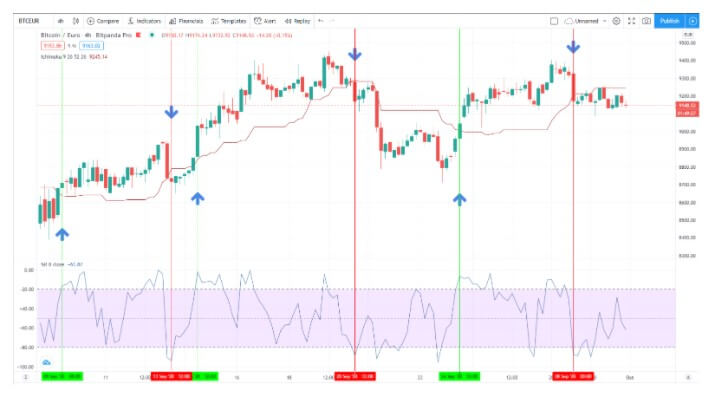
When we observe how and when trends start, it is noticeable every trend starts when the line enters either the oversold or overbought area of the indicator. In the picture below we have marked all entries allowed by the baseline. Out of 6, only one was a losing trade, and that one was a small loss compared to the trends captured. This way gives out interesting and consistent results, even though the indicator was never designed for it. For those not familiar with the baseline element in our analysis, only when the price crosses and closes above or below it we look at the Williams %R for a trade entry signal. If you go to lower timeframes such as H1, 30M, and 15M, this way continues to give you good signals. Beginner traders that like trading on lower timeframes deviate from our algorithm principles, however, Williams %R is a good to go indicator which will likely outperform their current confirmation indicators. When the market is ranging, this indicator will rarely give you a signal, often the line will stay in the normal range, making it a great loss eliminator. When you par it up with the volume filter, you can scratch almost every fake signal in a ranging market

To conclude, we flip the original signal interpretation. A classic way of trading this indicator is going long when the Williams %R line exits the oversold range into the normal -20 to -80 area and going short when the line exits the overbought, upper area. Now we flip this into going long when the line enters the oversold and overbought areas. This is similar to the CCI, and some momentum oscillators, but Willimas %R does the job better according to our testing. As for exit signals and continuations, it does not prove to be as efficient, however, we encourage you to test this out. Finds like this are not so rare if you try to research and test every interesting indicator. When you see it is very bad at its first intention, a small twist in settings, Moving Average addon, or another signal interpretation can flip it into a top indicator. Adding Moving Averages on this indicator is possible which brings a whole new area for interpretations across different roles. Note you need to select Apply to “First Indicator Data” first so the MA is on top of the indicator window.  

Categories
Forex Basic Strategies Forex Daily Topic

Trading The Forex Market Like A Pro Using The Williams %R Indicator

Introduction

In the forex market, the Relative Strength Index (RSI) is the most sought after technical indicator for measuring overbought and oversold conditions in the market. However, there are times when RSI can give misleading signals. To overcome some of these limitations of RSI, we use William’s %R (Williams Percentage Range) to help us identify when an asset is oversold or overbought.

Having determined that the asset has moved too much in one direction, we can position ourselves on the other side of the market after suitable confirmation. In today’s article, let’s discuss a strategy based on William’s %R indicator to identify when the market has become overbought or oversold. Let us first get into the specifications of the strategy.

Time Frame

The strategy works well on higher time frames such as ‘Weekly’ and ‘Daily.’ Therefore, the strategy is suitable for swing and long-term traders.

Indicators

We use the following indicators in the strategy:

  • William’s %R
  • Simple Moving Average (standard setting)

Currency Pairs

The strategy applies to all currency pairs listed on the broker’s platform, including major, minor, and exotic pairs. This is one of the distinguishing features of the strategy.

Strategy Concept

The William’s %R indicator usually ranges between 0 to -100, where a reading of 0 to -20 tells us that the asset is overbought. On the other hand, if %R falls in the range of -80 and -100, the asset is said to be oversold. As with other technical indicators, %R generates accurate trading signals when used in conjunction with other analytical tools such as chart patterns and systems.

Just because an asset may appear overbought and oversold based on the %R, this doesn’t necessarily mean that the price will reverse. Hence, we include a few concepts of the chart pattern and price action to confirm that the reversal is real. The more we wait, the higher the confirmation. But this reduces the risk-to-reward (RR) ratio moderately. This depends more on the type of trader if he is more conservative or aggressive.

In the strategy, we firstly establish a trend that is mostly in the overbought or oversold situation. This means William’s %R should indicate an overbought situation of the market for a major part of the trend during an uptrend. On the other hand, in a downtrend, William’s %R should indicate an oversold market situation for a major part of the trend. When the trend remains in the overbought or oversold condition for most of the time, the reversal tends to be sharp in nature.

This is why the above condition is important for the strategy. Next, we wait for the ‘Bullish Engulfing’ pattern to appear on the price chart, in a reversal of a downtrend. Likewise, in a reversal of an uptrend, we wait for the ‘Bearish Engulfing’ pattern to appear on the chart. This is the first sign of reversal. The reversal is confirmed when the price starts moving above the moving average, in a downtrend, and below the moving average, in an uptrend.

Stop-loss for the trade will be placed below the ‘engulfing’ pattern in a ‘long’ position and above the ‘engulfing’ pattern in a ‘short’ position.

Trade Setup

In order to explain the strategy, we will be executing a ‘long’ trade in EUR/USD currency pair using the below-mentioned rules. Here are the steps to execute the strategy.

Step 1: The first step of the strategy is to identify the major trend of the trend. An easy to determine trend is if the price is below the simple moving average, the market is in a downtrend, and if the price is above the simple moving average, the market is in an uptrend. Here we need to make sure that William’s %R indicates an overbought/oversold market situation for the major part of the trend.

The below image shows an example of a downtrend that is oversold.

Step 2: The next step is to wait for the market to present the ‘Engulfing’ pattern on the chart. In a downtrend, the ‘Bullish Engulfing’ pattern indicates a reversal of the trend, while in an uptrend, the ‘Bearish Engulfing’ pattern indicates a reversal of the trend. If the second of the engulfing pattern closes above the MA in a reversal of the downtrend, the reversal will be more prominent. Similarly, if the second candle closes below the MA in a reversal of the uptrend, the reversal can be resilient.

Step 3: The rule of entering the trade is fairly simple. We enter ‘long’ when the price starts moving further above the moving average after the occurrence of an ‘engulfing’ pattern. Similarly, we enter ‘short’ when the price starts moving further below the moving average after the occurrence of the ‘engulfing’ pattern.

Step 4: Lastly, we need to determine the stop-loss and take-profit for the trade. In a ‘long’ position, stop-loss is placed below the ‘Bullish Engulfing’ pattern. In a ‘short’ position, it is placed above the ‘Bearish Engulfing’ pattern. The take-profit is set at a point where the resultant risk-to-reward (RR) ratio of the trade will be 1.5. However, partial profits can be taken at the opposing ‘support’ and ‘resistance’ levels that might be a hurdle for the price.

In our example, the risk-to-reward (RR) ratio of 1.5 was achieved after a period of one month since traded on the ‘Daily’ time frame.

Strategy Roundup

William’s %R is a very powerful indicator that helps us identify opportunities during a reversal phase of the market. It is important to note that %R should never be used in isolation. Combining the %R indicator with chart pattern, price action, and market trend gives us an edge in the market, which is difficult to get when applied individually. Trade executed using the above strategy can longer than expected to give desirable results since it is based on a higher time frame.

Categories
Forex Indicators

What You Need to Know About Trading with the Williams %R Indicator

Do you trade using indicators? Still do not know this indicator created by Larry Williams? The Williams %R indicator, although less popular than others, is worth studying.

Introduction

The Williams %R is an impulse indicator developed by Larry Williams. It moves between 0 and -100, providing information about the weakness or strength of a financial instrument, i.e., stocks, currencies, or commodities. It can be used as overbought/oversold levels, impulse confirmations, and trading signals. Readings from 0 to -20 are considered overbought. Readings from -80 to -100 are considered oversold levels.

Calculus

The formula used to calculate the Williams %R is:

% R = (Maximum – Closing) / (Maximum – low) * -100

Minimum = lowest minimum over the period analysed.

Maximum = highest maximum in the period analysed.

The default setting for the Williams %R is 14 periods. It can be days, weeks, months, or an intraday period of time. An R %of 14 periods would use the most recent closure, the maximum of the last 14 periods and the minimum of the last 14 periods. The Williams %R has only one line by default.

When the indicator is:

-Near zero shows that the price is quoted near or above the maximum during the period analysed.

-If the indicator is close to -100, the price is traded near or below the minimum of the analysed period.

-Above -50, the price is traded within the upper part of the period analysed.

-Below -50, the price is traded at the bottom of the period analysed.

If we look at the daily chart, AAPL shows overbought at the -4 level. Back sessions were at the -80 oversold level.

Interpreting

Williams’ interpretation of %R is very similar to that of the Stochastic Oscillator, except that %R is traced backward and the Stochastic Oscillator has internal smoothing. Williams’ interpretation of %R is very similar to that of the Stochastic Oscillator. Values in the range of 80% – 100% want to tell us oversold, while readings in the range of 0 to 20% suggest that it is overbought.

Like other overbought indicators – oversold, the most favorable thing will always be to wait for the price to change direction before trading. The over-purchase may remain for an extended period of time. For example, if an overbought indicator – oversold (such as Williams’ Stochastic Oscillator or %R) shows an overbought condition, it is advisable to wait for the price to fall, before selling if you already have a long position or a stop loss.

Often, the %R indicator helps to find a turnaround in the stock market almost at the right time. The indicator usually forms a peak and then turns offa few days before the value price turns. Similarly, the %R usually creates a drop and goes up a few days before the price resumes.

Like the vast majority of overbought indicators – overbought, it is much better that we wait for the price to change direction before trading.

Using the William %R Indicator Correctly
  • To identify over purchases in an Index or stock.
  • Centre line of the WILLIAMS %R indicator.
  • Divergences

Let’s look at each of them in the most detail.

To identify levels of over-purchase:

The indicator ranges from 0 to -100. No matter how fast action moves or falls, the Williams %R indicator fluctuates in this range. Oversold and overbought levels can be used to make an identification price extremes, which appear to be unsustainable.

-Williams %R above the threshold of -20 is considered overbought.

-Williams %R below the threshold of -80 is considered to be oversold.

As is known, a market may remain overbought for an extended period of time. Trends with some strength usually present a problem in these oversold levels – overbought already classic. WILLIAMS %R can be overbought (> -20) and prices can simply continue to rise when the uptrend is strong. In contrast, the WILLIAMS %R may be oversold (-80) and prices may simply continue to fall when the trend is strong.

Amazon has a WILLIAMS %R at 14%, in a daily chart. Seeing, from left to right, Amazon came to overbought at -3 in early December, when it traded around 696. Amazon did not reach the peak level as soon as the overbought reading appeared. It took a few days but then we saw a drop of almost 149 points. 19%. From overbought levels of -3.1, the WILLIAMS %R moved around -98 in mid-January towards the oversold terrain. Despite this oversold reading, Amazon continued to fall to the ground on January 20. Traders must always confirm the WILLIAMS %R indicator with price action or price action. On 20 January a Hammer sail was formed with the oversold WILLIAMS %R. This confirms that the short-term soil was reliable and recovered up to $638 a share. The WILLIAMS %R indicator was overbought and again we saw drops. Overbought and oversold levels are marked on the charts.

Centre line of indicator WILLIAMS %R:

The WILLIAMS %R indicator detects bullish and bearish movements in the market by observing when crossing above or below the WILLIAMS% R-50 level. After being overbought and oversold, if the Williams %R crosses the -50 line, it usually indicates a change in movement.

If you can find the Microsoft chart from April 20, the DOJI formed by Microsoft suggests a trend change. It also broke -50 which also suggests a change. In the example illustrated above, the %R of MSFT was overbought, then the share price began to fall and the %R crossed below the -50 line quickly, before most of the bearish movement occurred.

It is advisable to use the price stock with this Williams-based %R strategy to increase the odds of success. . As you may have observed, in the above example, the bar that pushed the reading of the Williams %R, below -50, was a DOJI. This usually warns of a change of trend if the next candle is also bearish. Traders should open short positions in MSFT with Stop Losses just above the DOJI sail. The trader would have entered the market when the bearish momentum was at its highest. Therefore, you could have managed to place a tighter stop loss, which in turn would increase your risk/reward advantage in this particular operation.

It is possible to use this strategy to be able to open a long position when the %R is above -50after it has been oversold for a period of time.

It is highly recommended to use price action in combination with this Williams-based %R strategy to increase the odds of success.

Divergences:

The WILLIAMS %R divergence occurs when there is a difference between what the price action indicates and what the WILLIAMS %R indicates. These differences can be interpreted as a sign of an imminent turn. There are two types of divergences. Bearish and bullish.

Bullish divergence WILLIAMS %R:

A bullish divergence occurs when the WILLIAMS %R is oversold, below -80, increases above -80, remains above -80 in recoil, and then breaks over its previous reaction at a higher level. A bullish divergence forms when prices move to a lower minimum, but the indicator forms a higher maximum.

WILLIAMS% R bearish divergence: when the price reaches a new maximum, but the WILLIAMS %R reaches a lower maximum.

If you can see a Facebook chart, the price dropped to 77.22 on May 5. WILLIAMS %R went straight to the oversold area. It moved up and up even further, but the price dropped to 76.79 on May 12. Once the WILLIAMS %R moved above -80 and we had a bullish enveloping pattern, as shown above, we marked the turn. The price recovered up to $83.

Conclusion

The WILLIAMS %R index is a unique impulse indicator that has stood the test of time. The WILLIAMS %R is best suited to identify possible spins in overbought/oversold levels and bullish/bearish divergences. As with most indicators, WILLIAMS %R should be used in combination with another indicator or with the price action. It is possible and positive to perform the combination of using WILLIAMS %R with price patterns with the objective of increase signal robustness. If you operate intelligently, by combining price action, and use the Williams %R to confirm the momentum in the market, your likelihood of ending a profitable trade would greatly increase.