Introduction
In the previous set of articles, we discussed strategies based on most of the technical indicators in forex. But there is one technical indicator that was not covered extensively and, i.e., the ‘Pivot Points’ indicator. Traders do not use it extensively because they don’t know the right way of using it and are not aware of their strength.
Today, we solve this problem by discussing a mostly based strategy on the Pivot Points indicator. By now, we all know that a technical indicator should never be in isolation. Therefore, the ‘Pivot Points’ indicator is combined with some very powerful chart patterns and key technical levels to improve the probability of successful trades.
‘Pivot Points’ are nothing but potential support and resistance levels that will help us determine the same, even it is established. The pivot point’s parameters are usually taken from the previous day’s trading range to calculate today’s pivot points. The simplest way of plotting the pivot point indicator on the chart is by selecting the indicator from the broker’s charting software.
The main pivot point (PP) is the central pivot based on which all other pivot levels are calculated. Calculating the central pivot point is pretty simple. We just have to add yesterday’s high, low, and close and then divide that by 3, a simple average of the high, low, and close. We don’t have to worry about the calculations as the software does all that for us and gives it readymade.
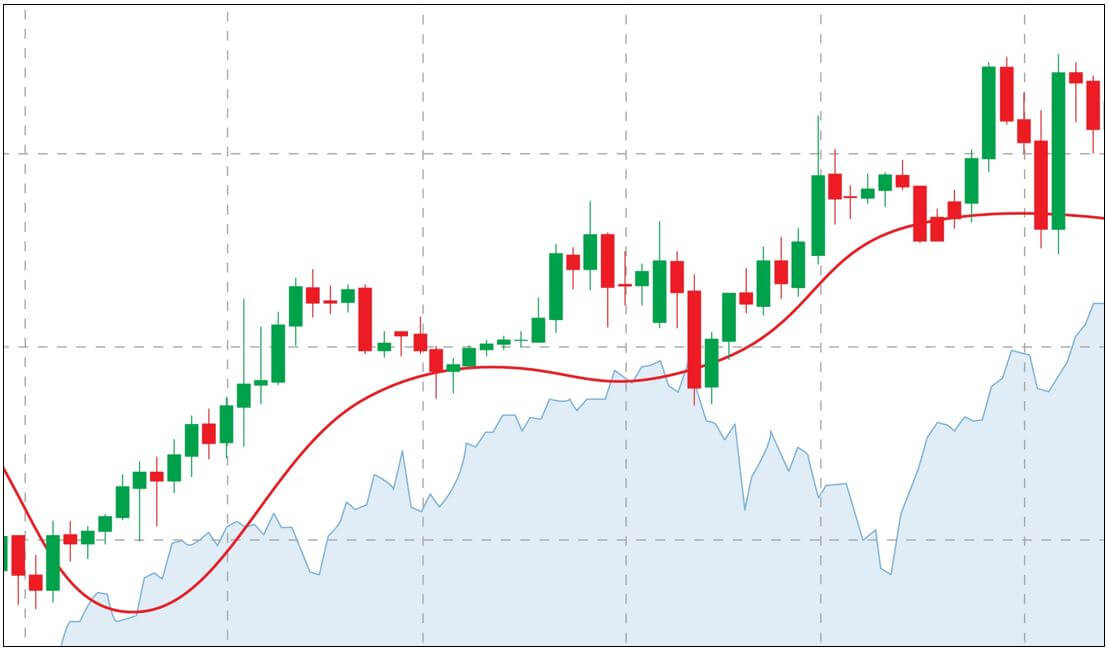
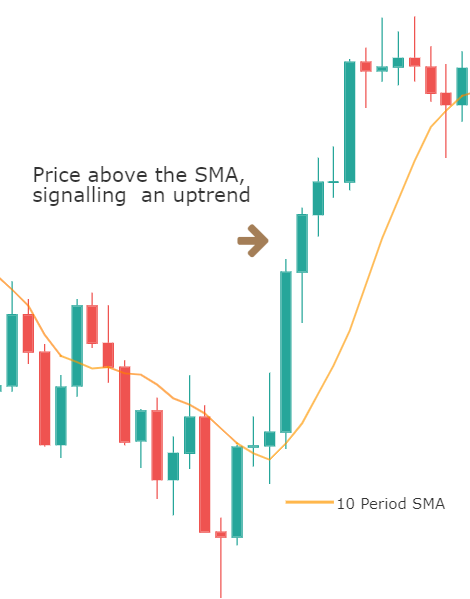
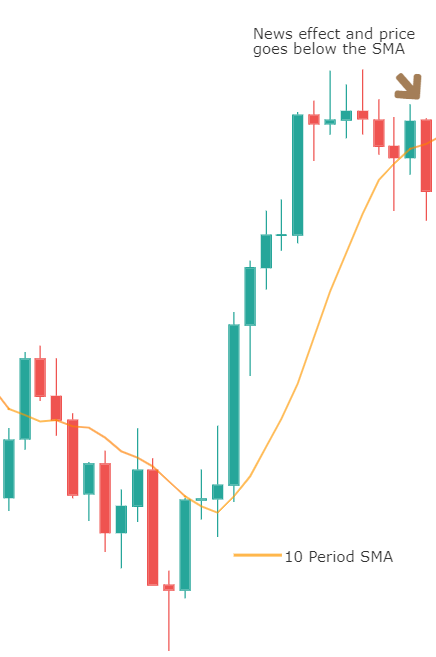
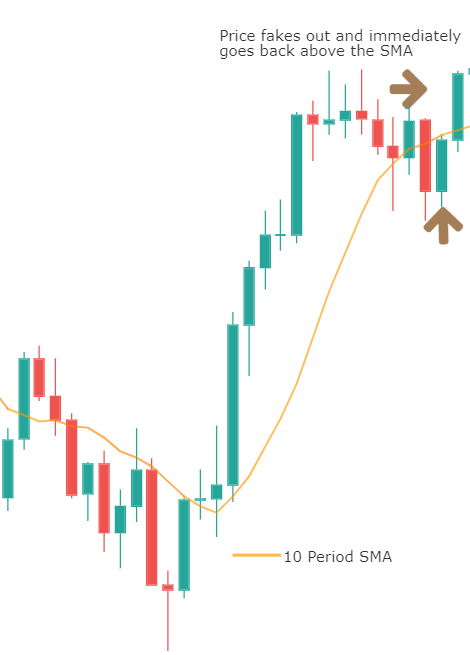
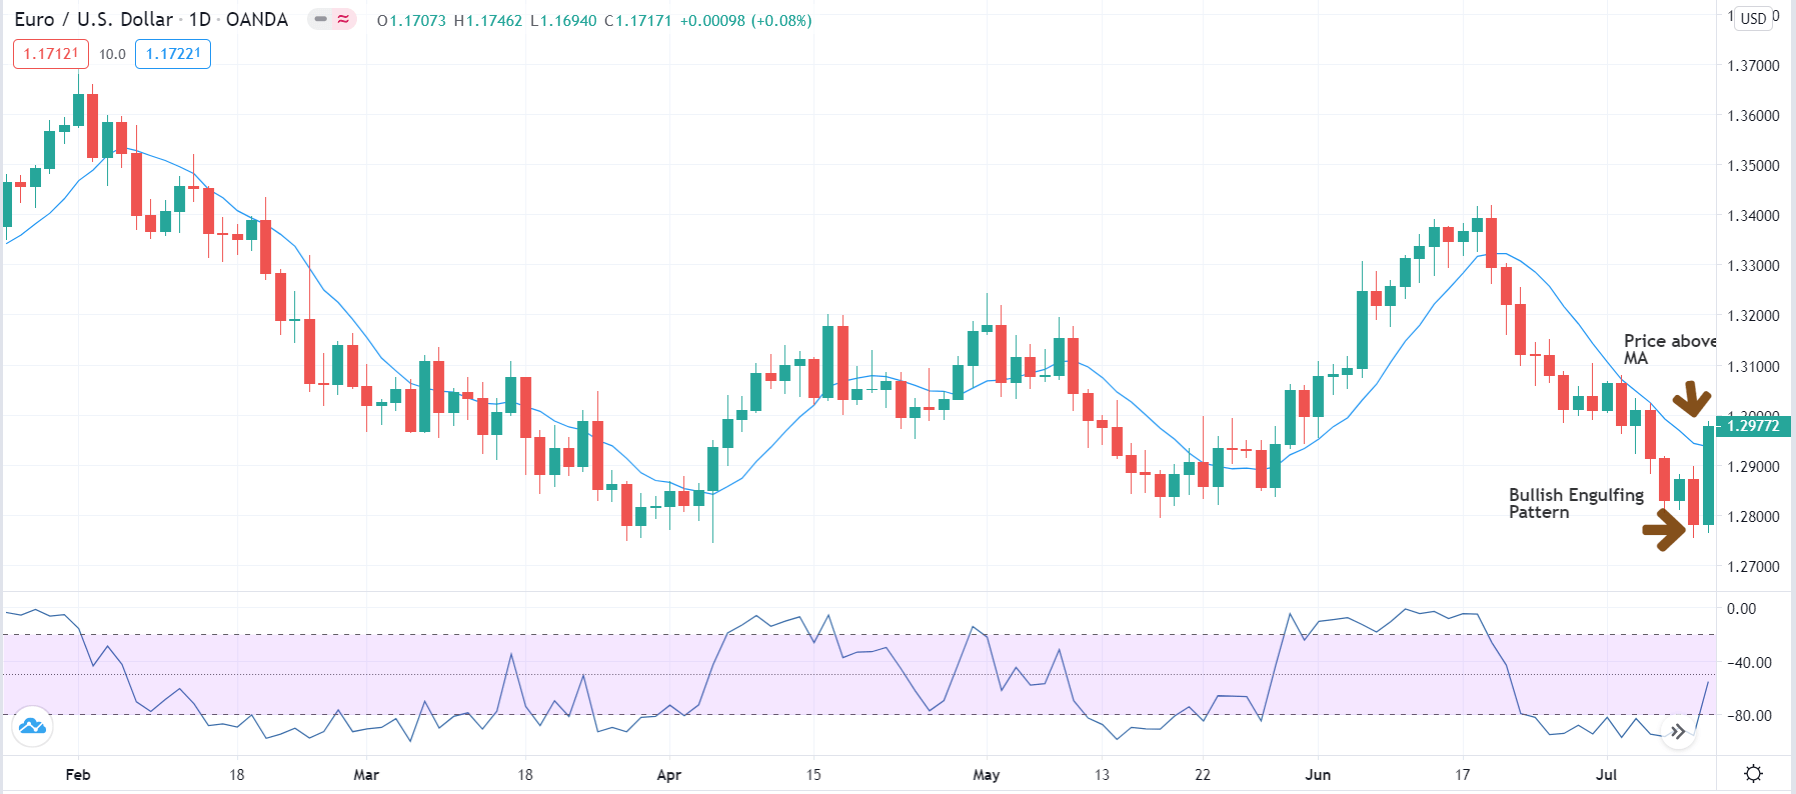
The only thing we have to remember is that if the price is trading above the central pivot point, it signals a bullish trend. If the price is below the central line, it is considered a bearish trend.
Time Frame
The strategy works well on small time frames such as 15 minutes, 3 minutes, and 1 minute. It would not be wrong to classify the above strategy as a ‘Scalping Strategy.’
Indicators
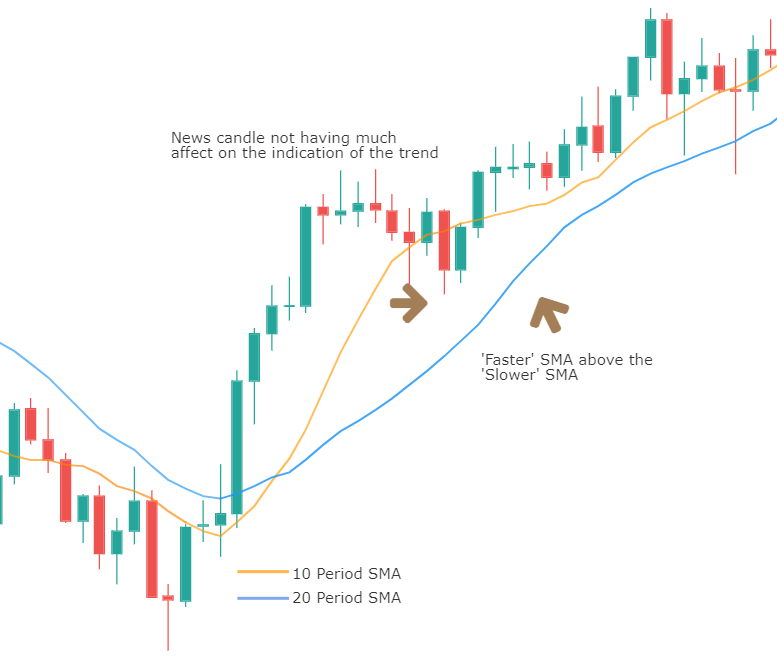
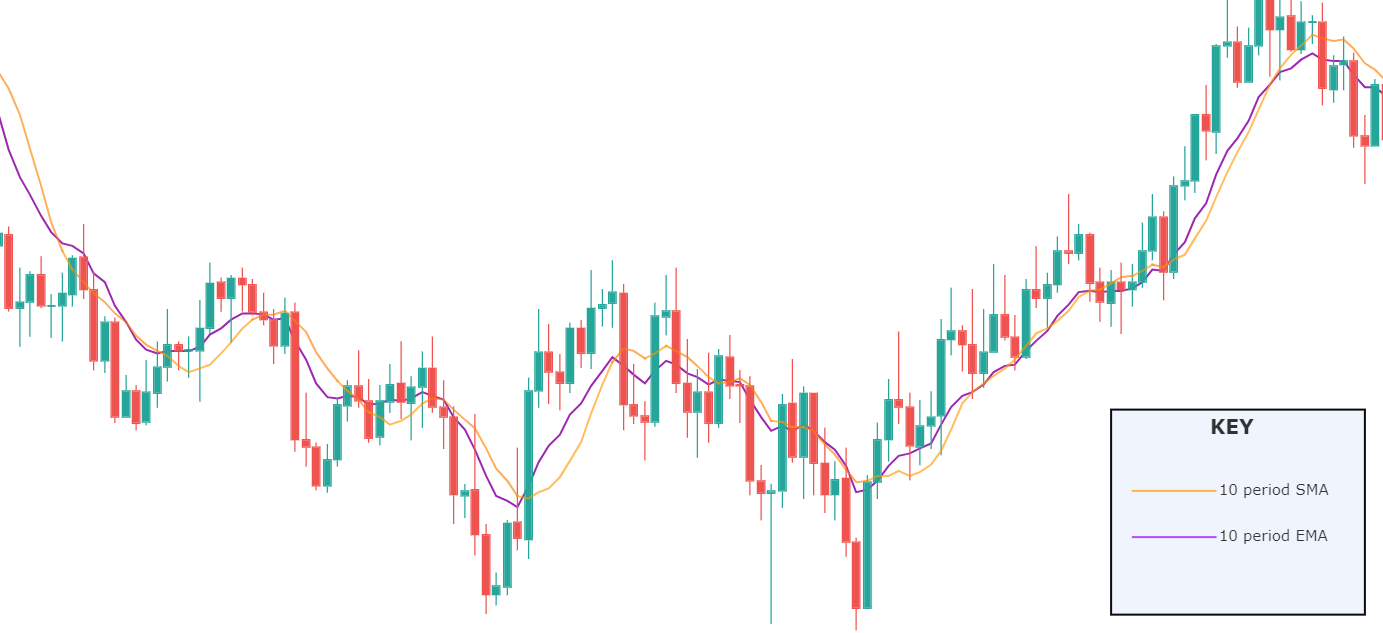
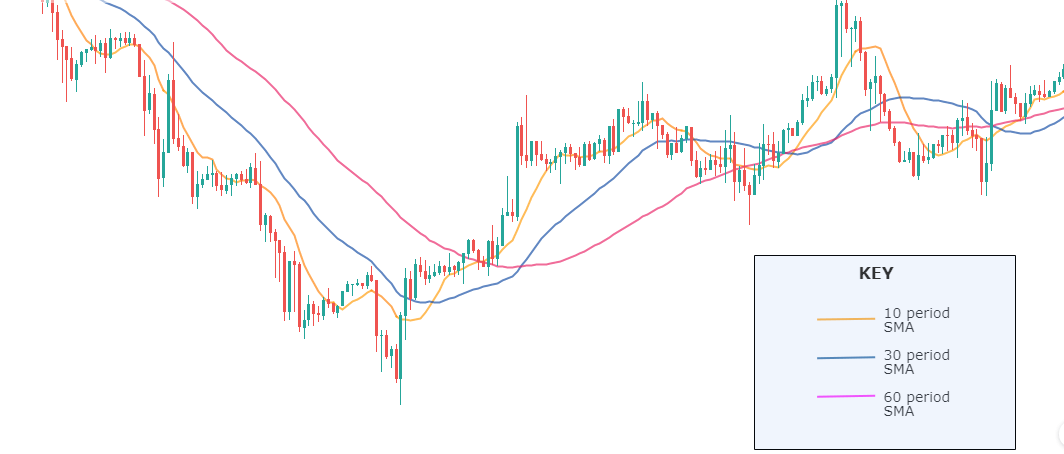
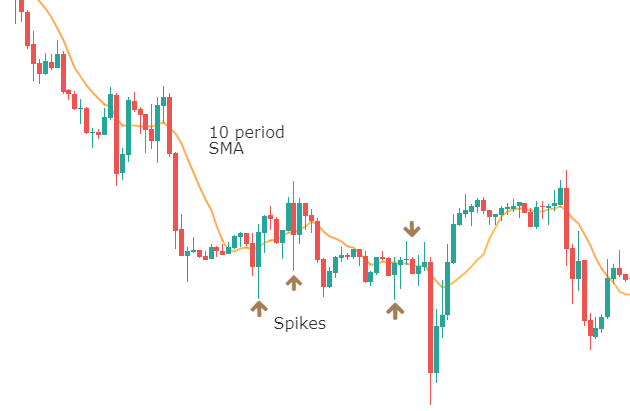
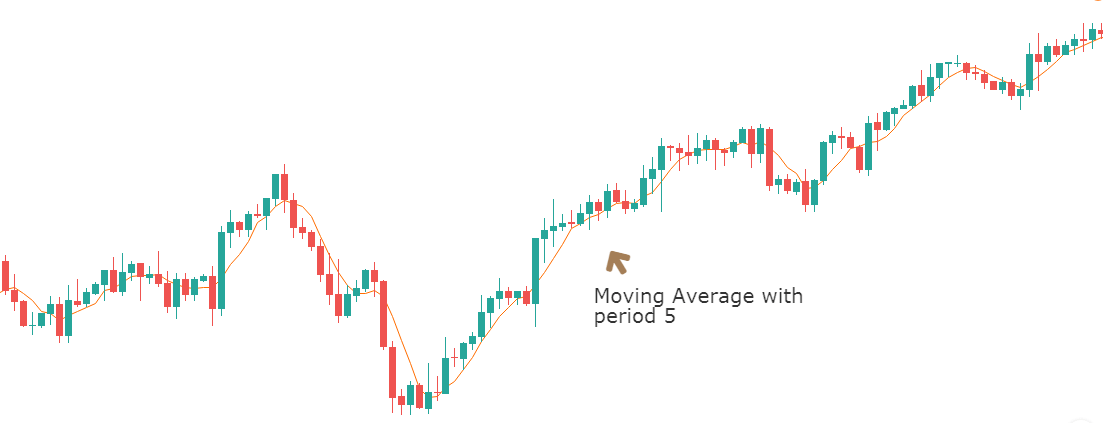
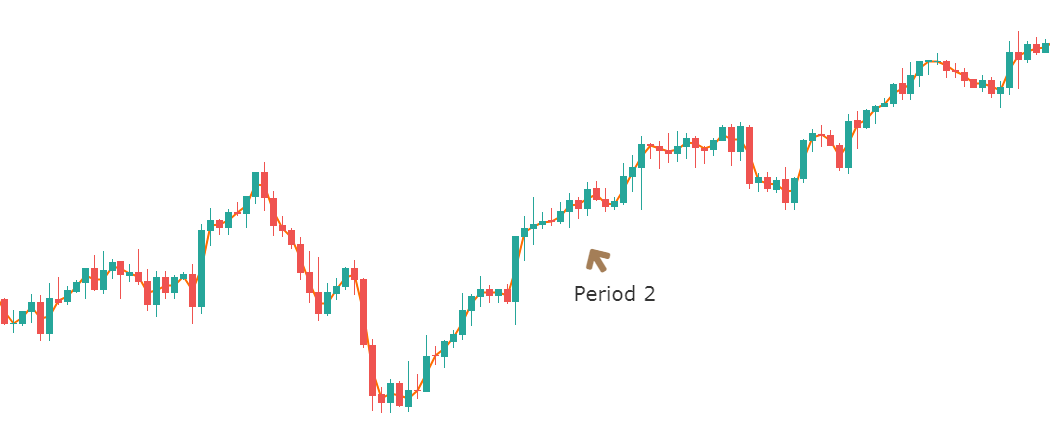
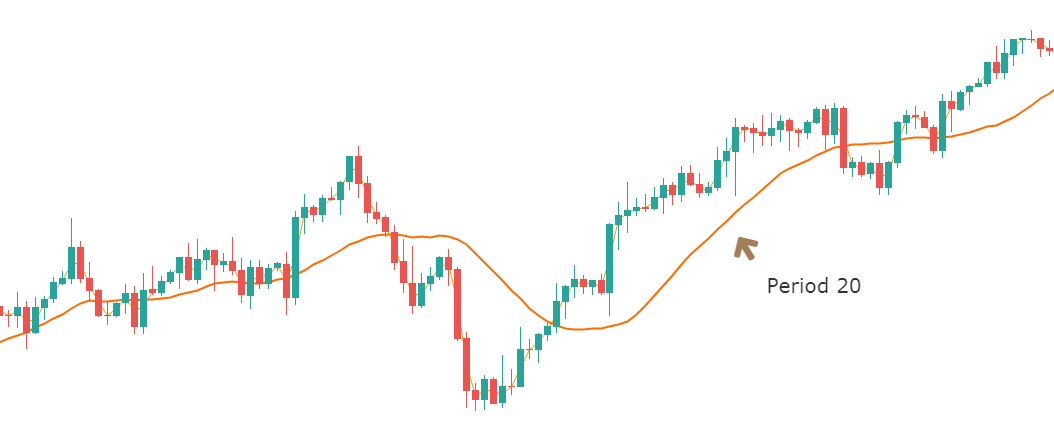
We use just one technical indicator for the strategy and, i.e., ‘Pivot Points.’ We could also use the Simple Moving Average (SMA) to get a clear idea about the market trend.
Currency Pairs
The strategy is only applicable to major currency pairs of the forex market. EUR/USD, USD/JPY, GBP/USD, GBP/JPY, AUD/USD, EUR/GBP, and NZD/USD are preferred currency pairs.
Strategy Concept
The ‘Pivot Point’ strategy is based on the concept that when price respects any of the support and resistance levels of the ‘Pivot Point’ indicator, they tend to become ‘true’ S/R levels that can be relied upon. When price re-tests these ‘true’ support and resistance levels, it moves in the direction as anticipated. The above logic works greatly in favor of traders and thus increases the probability of making a profit. However, there are some rules we need to follow to execute the above strategy successfully. Let’s discuss these rules in detail.
Trade Setup
To explain the strategy, we will be executing a ‘long’ trade in EUR/USD currency pair using the strategy’s rules. Here are the steps to execute the strategy.
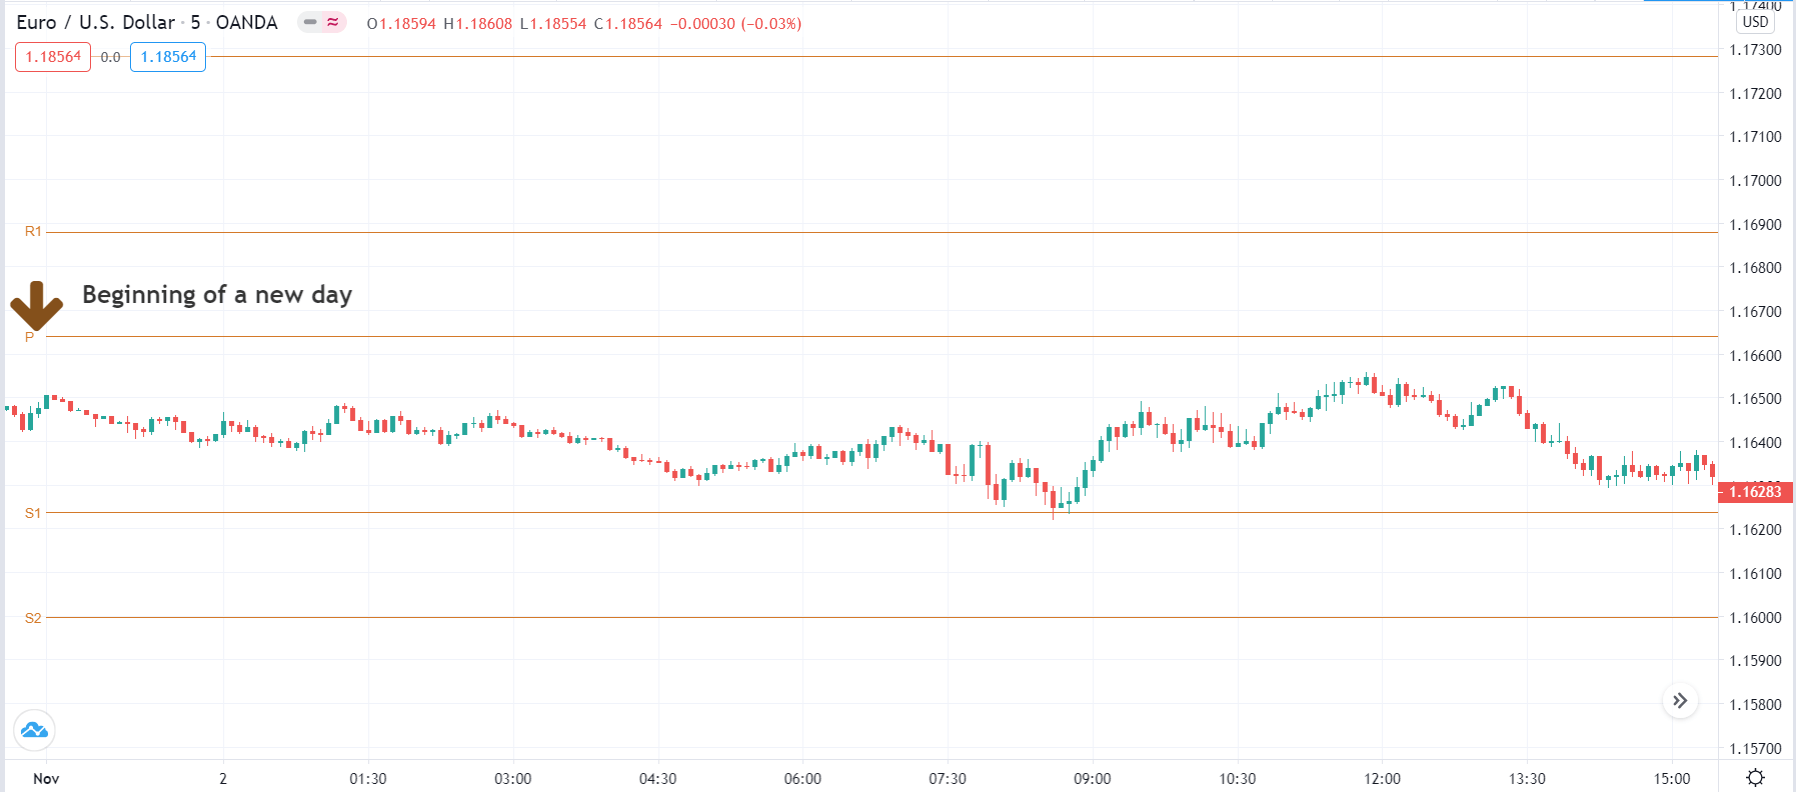
Step 1: Firstly, we have to plot the pivot point indicator on the chart with its default settings. As this is mostly an intraday strategy, we start each day as fresh using the partitions made by the pivot point indicator. The below image exactly shows how the beginning of a new day would look like on the pivot points.
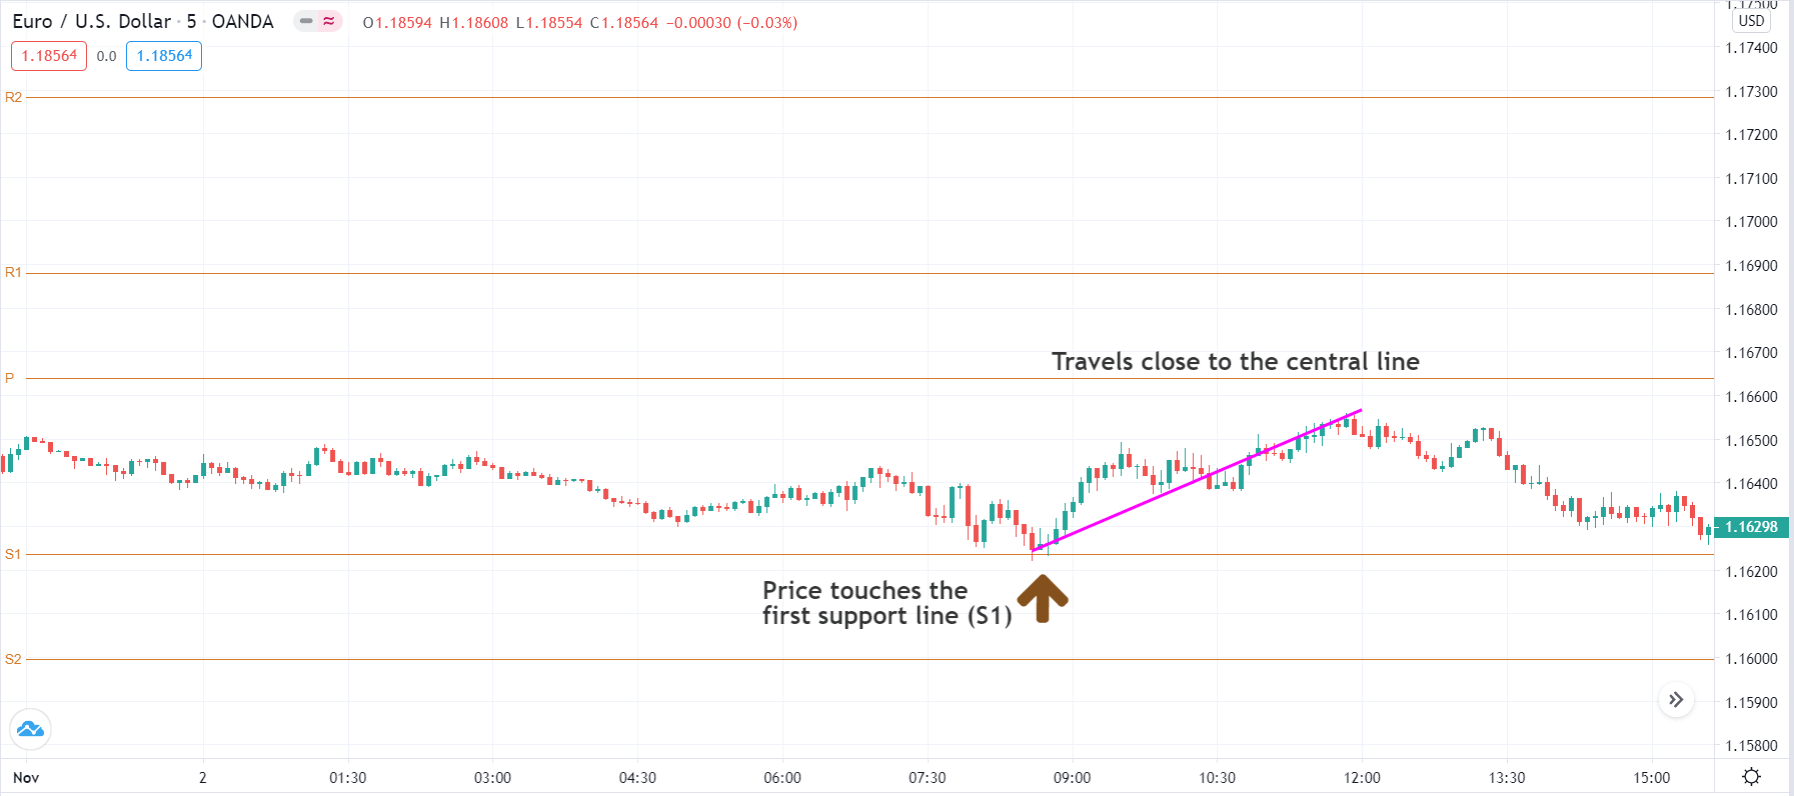
Step 2: Next, we need to wait for the price to touch any support and resistance levels as plotted on the chart by the pivot point indicator. Not all touches are going to be important to us. Only the price touches that cause major price movement in the market will be considered as significant. For instance, if the price touches R1, R2, R3, R4, or R5 and goes down to the central line (PP), this shall be considered ‘true’ resistance. Likewise, if the price touches S1, S2, S3, S4, and S5 and goes back up to the central line, this shall be considered ‘true’ support.
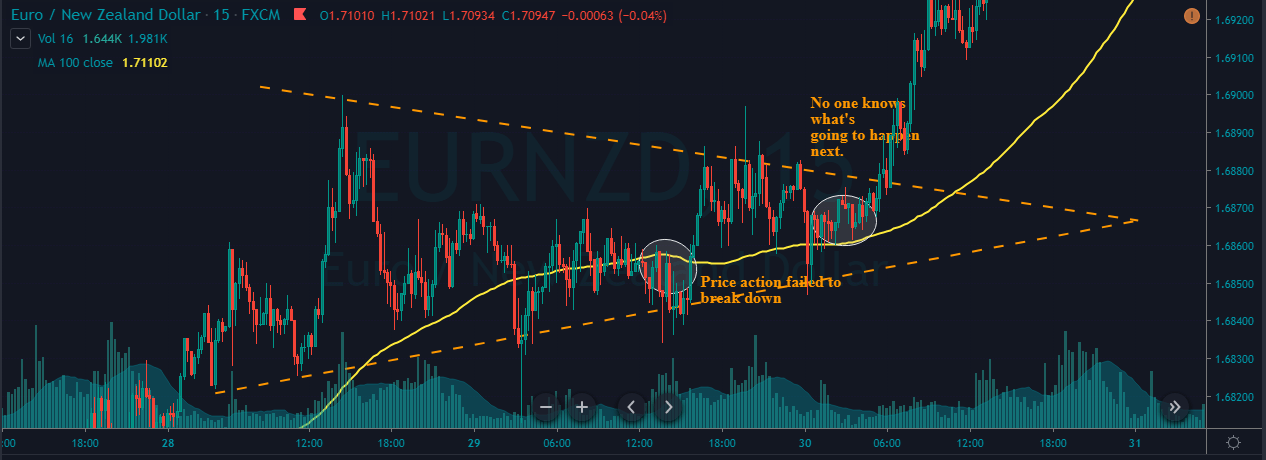
The below image shows how price touches S1 and travels close to the central line. Hence, this can be considered as ‘true’ support. The further price travels, the stronger is going to be the ‘support.’
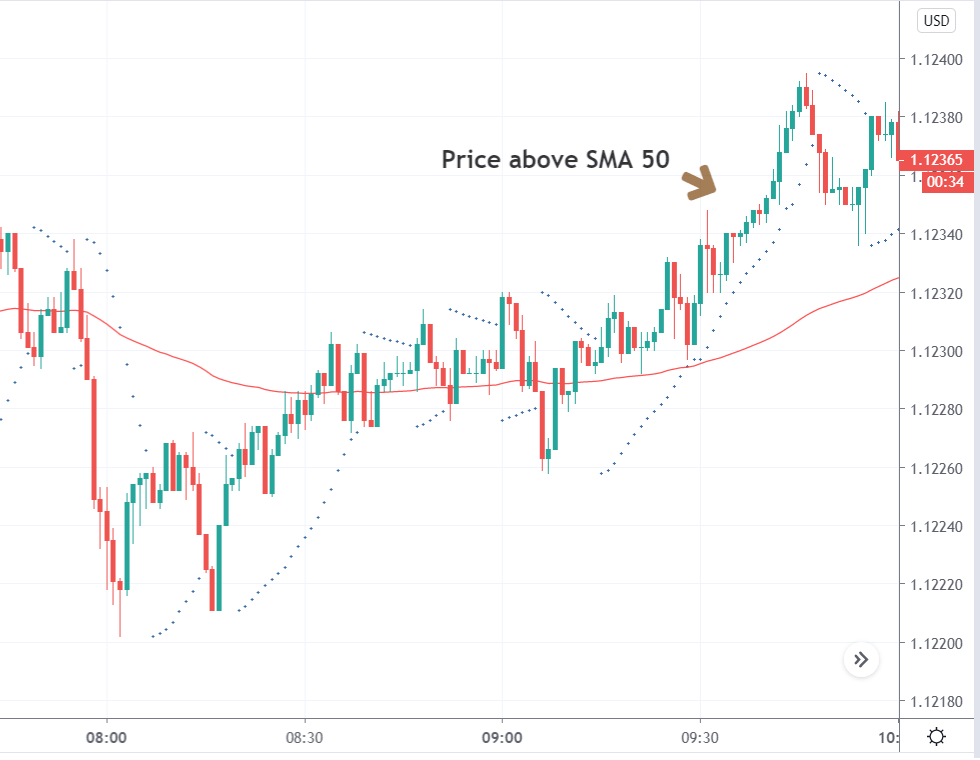
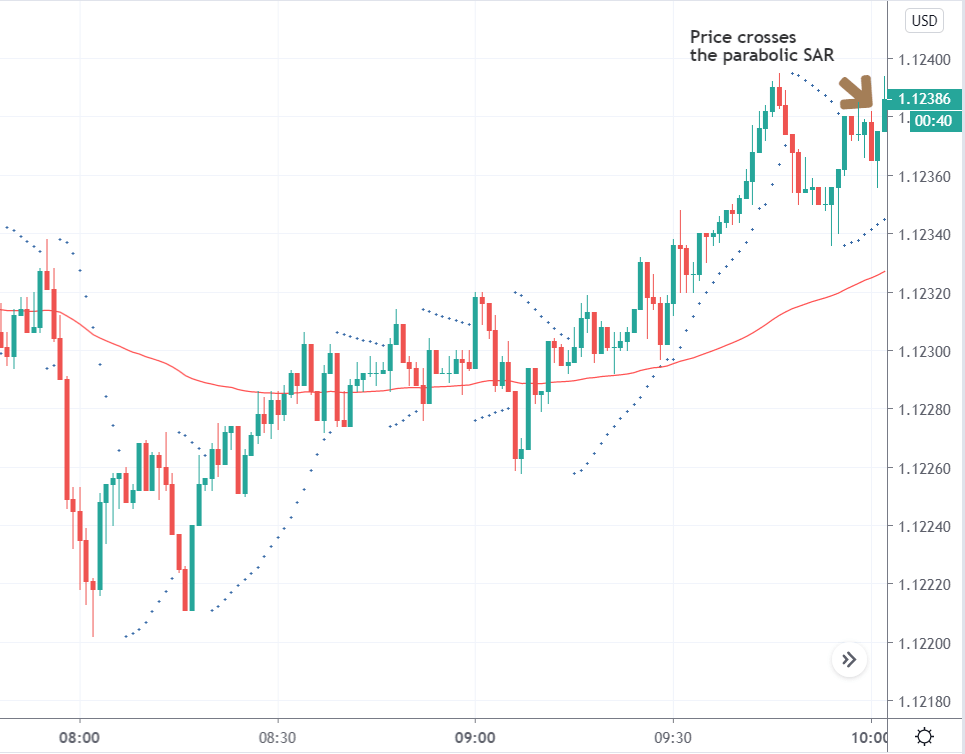
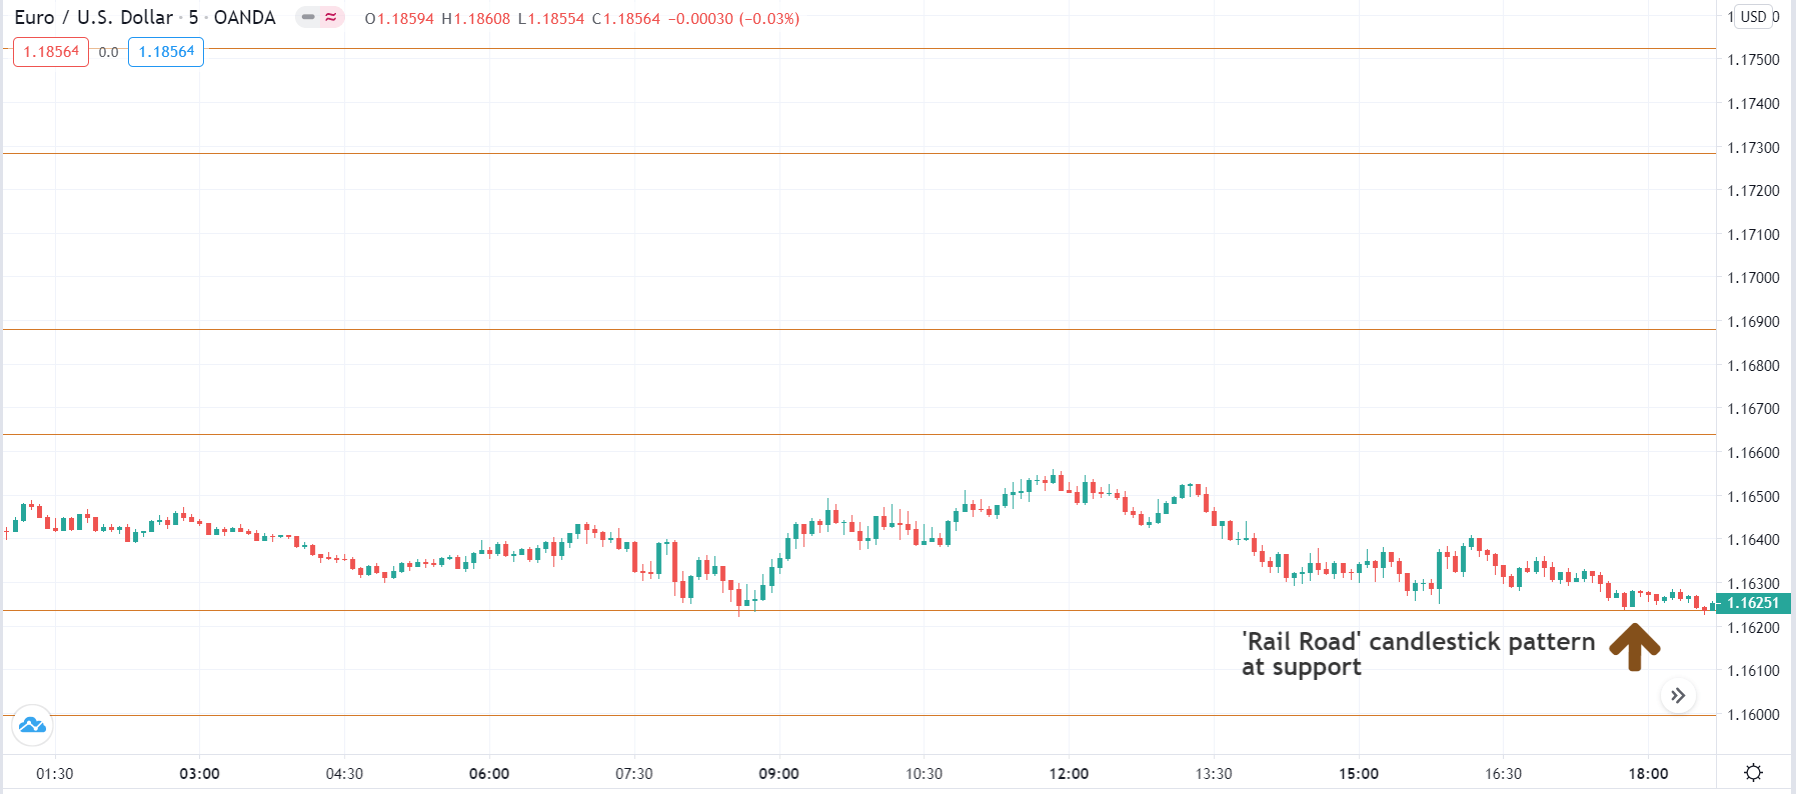
Step 3: After establishing ‘true’ support and resistance levels, we wait for the price to return to this level and show a suitable price action pattern before we can actually enter into a trade. Once the price touches established ‘support’ or ‘resistance,’ we need to watch for the formation of the ‘Rail-Road Track’ candlestick pattern on the chart. The ‘Rail-Road Track’ is essential because it confirms the respective level. We still don’t enter for a trade. The next step explains the rule of ‘entry.’
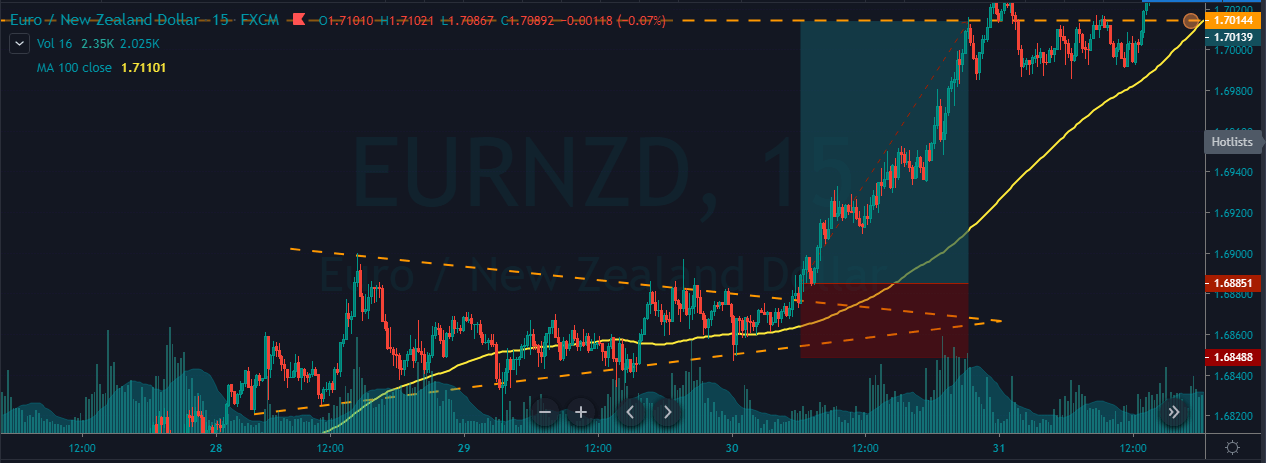
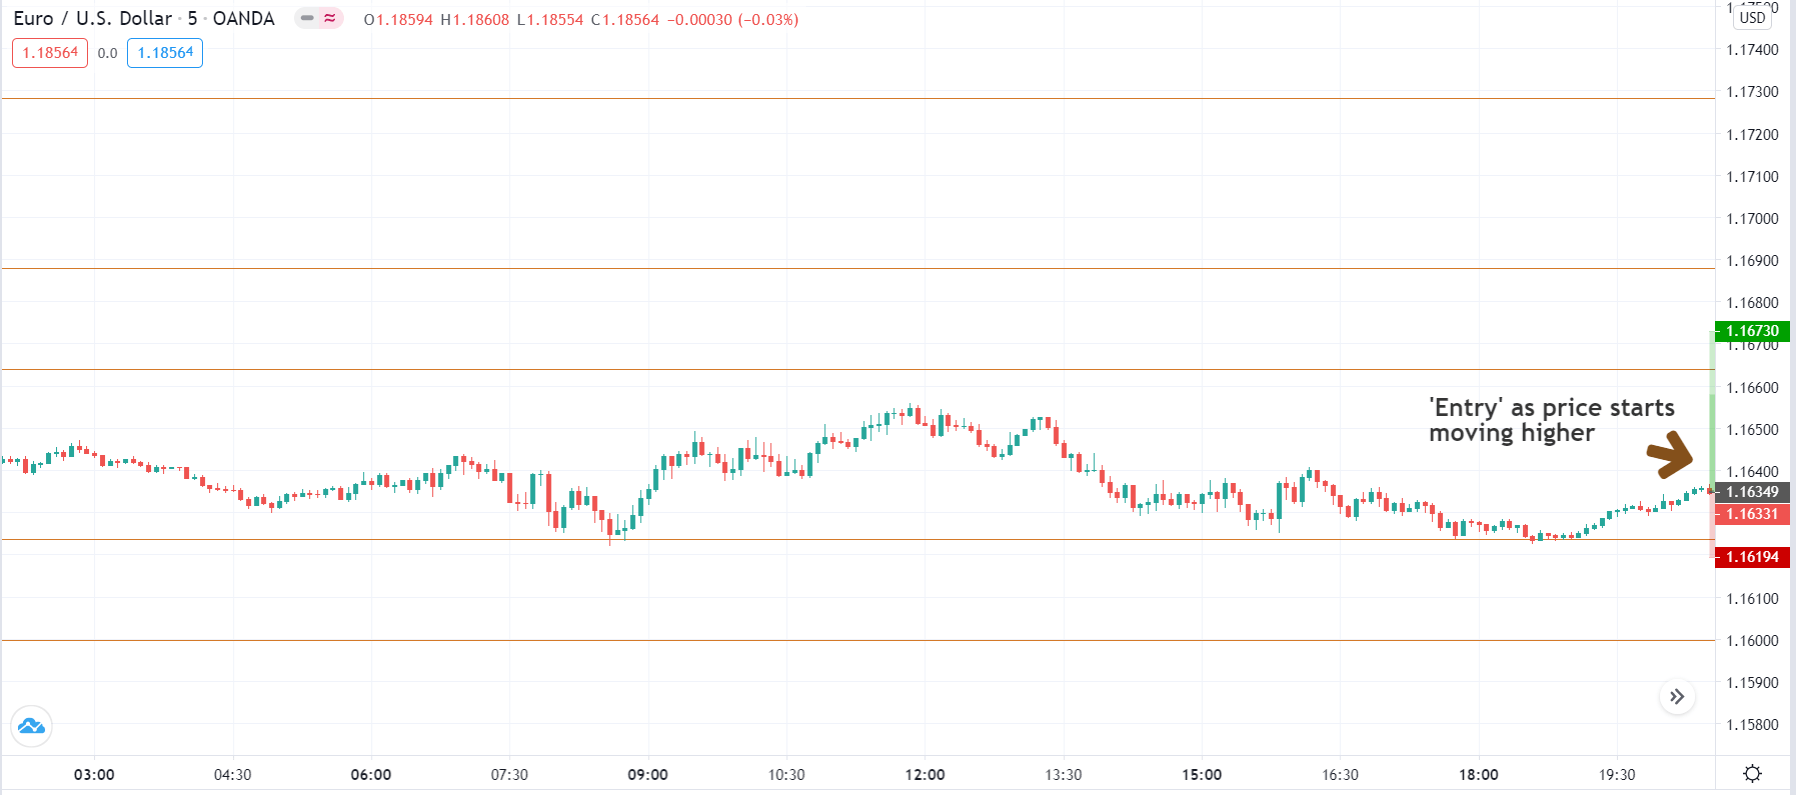
Step 4: To be sure that the support or resistance is holding, we enter only after the price starts moving in the direction we expect to move. For example, in the case of ‘true’ support, we enter ‘long’ when the price moves a further higher from the ‘support.’ Similarly, in the case of ‘true’ resistance, we enter ‘short’ when the price moves further lower from the ‘resistance.’
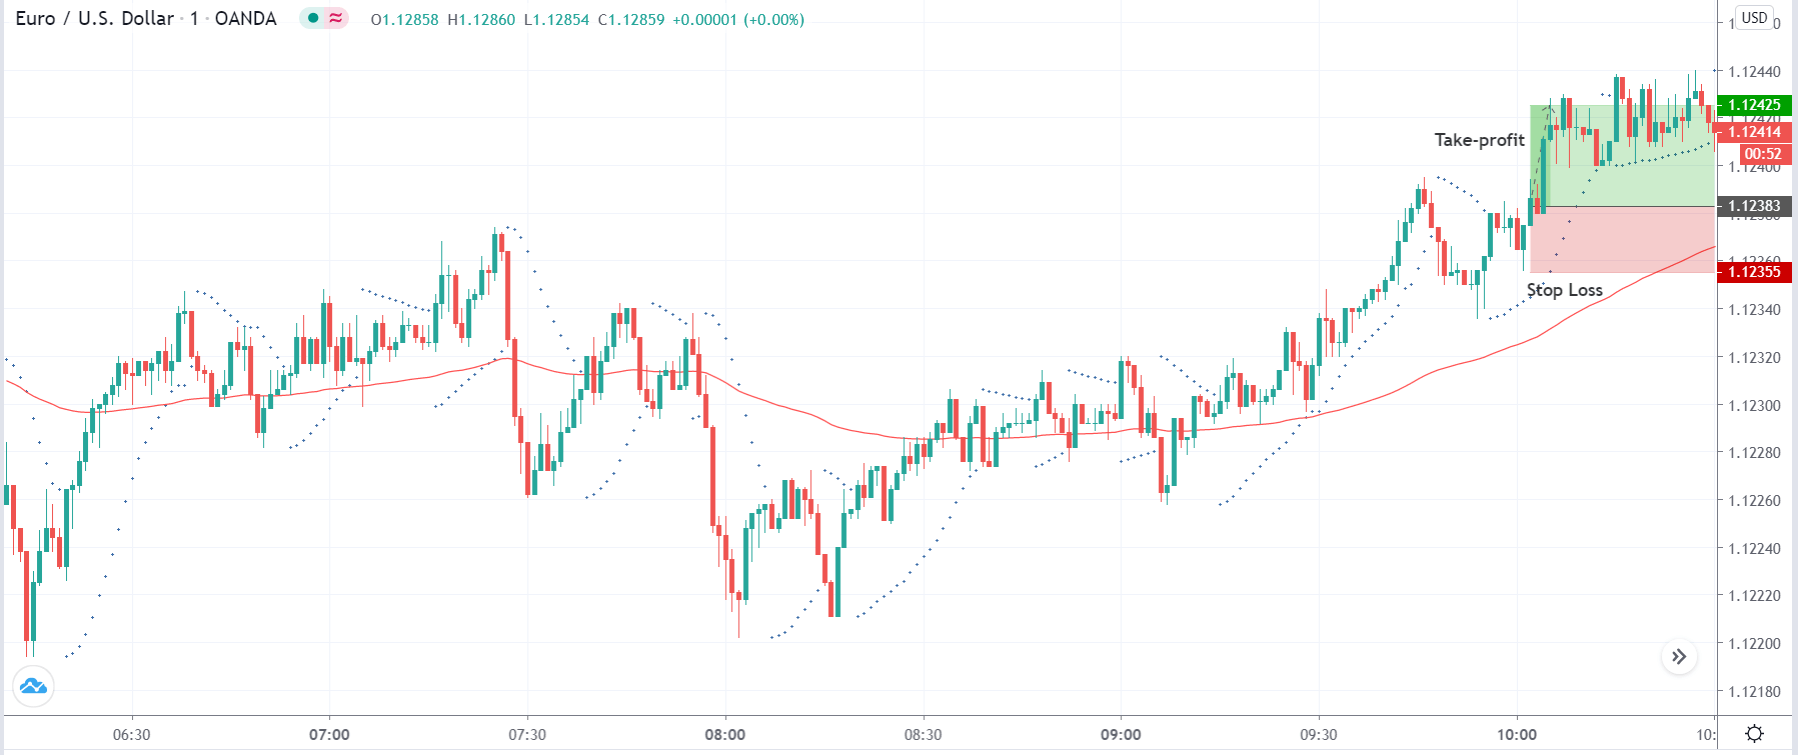
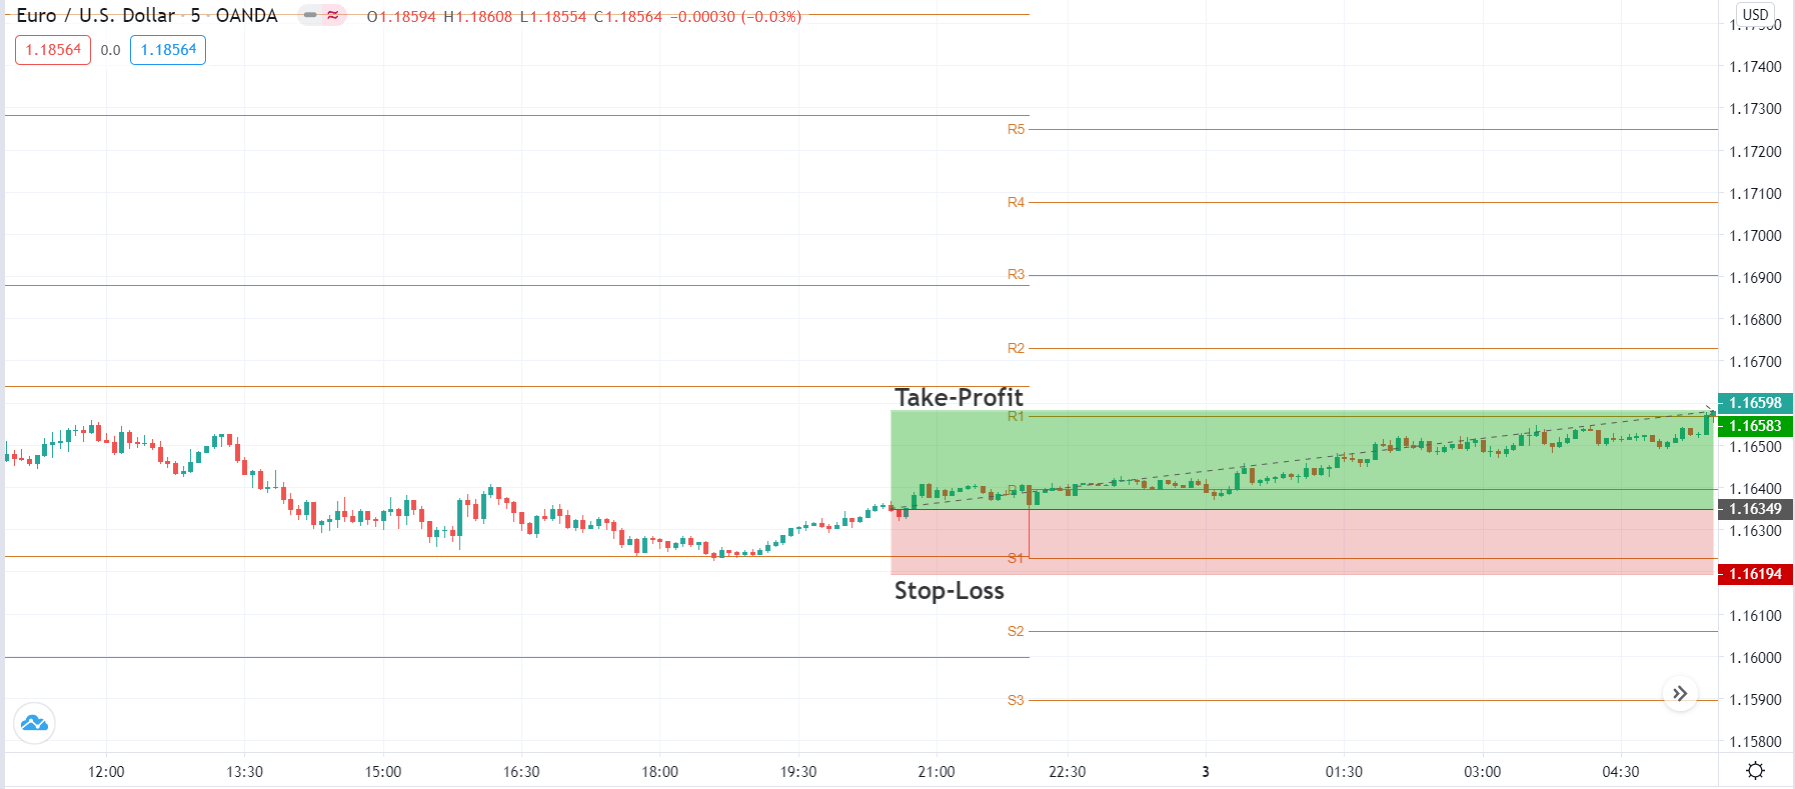
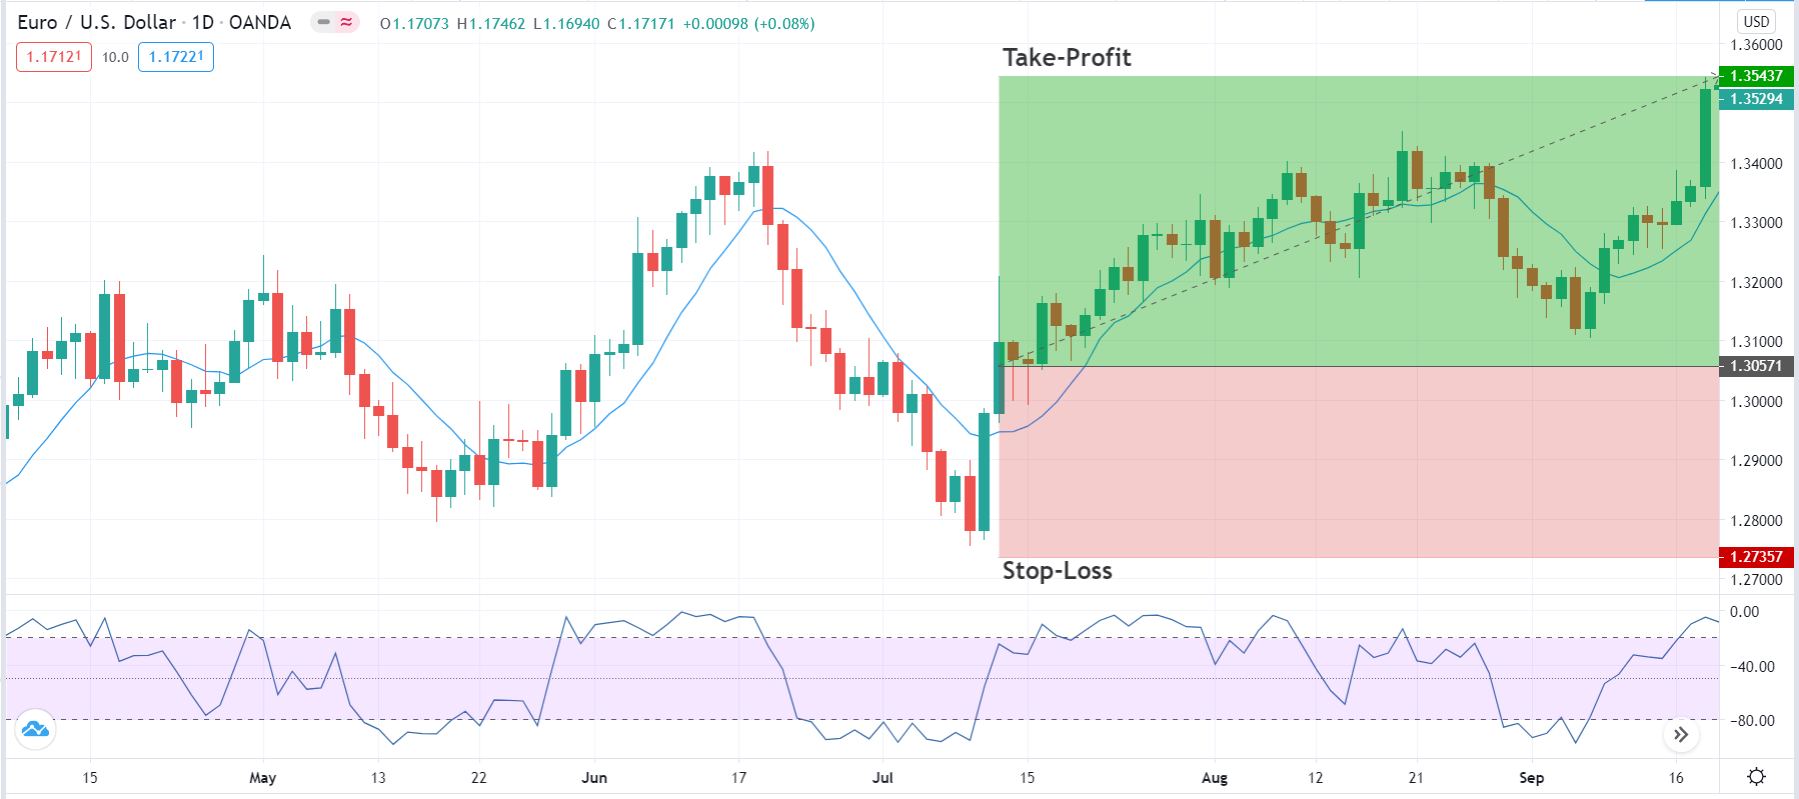
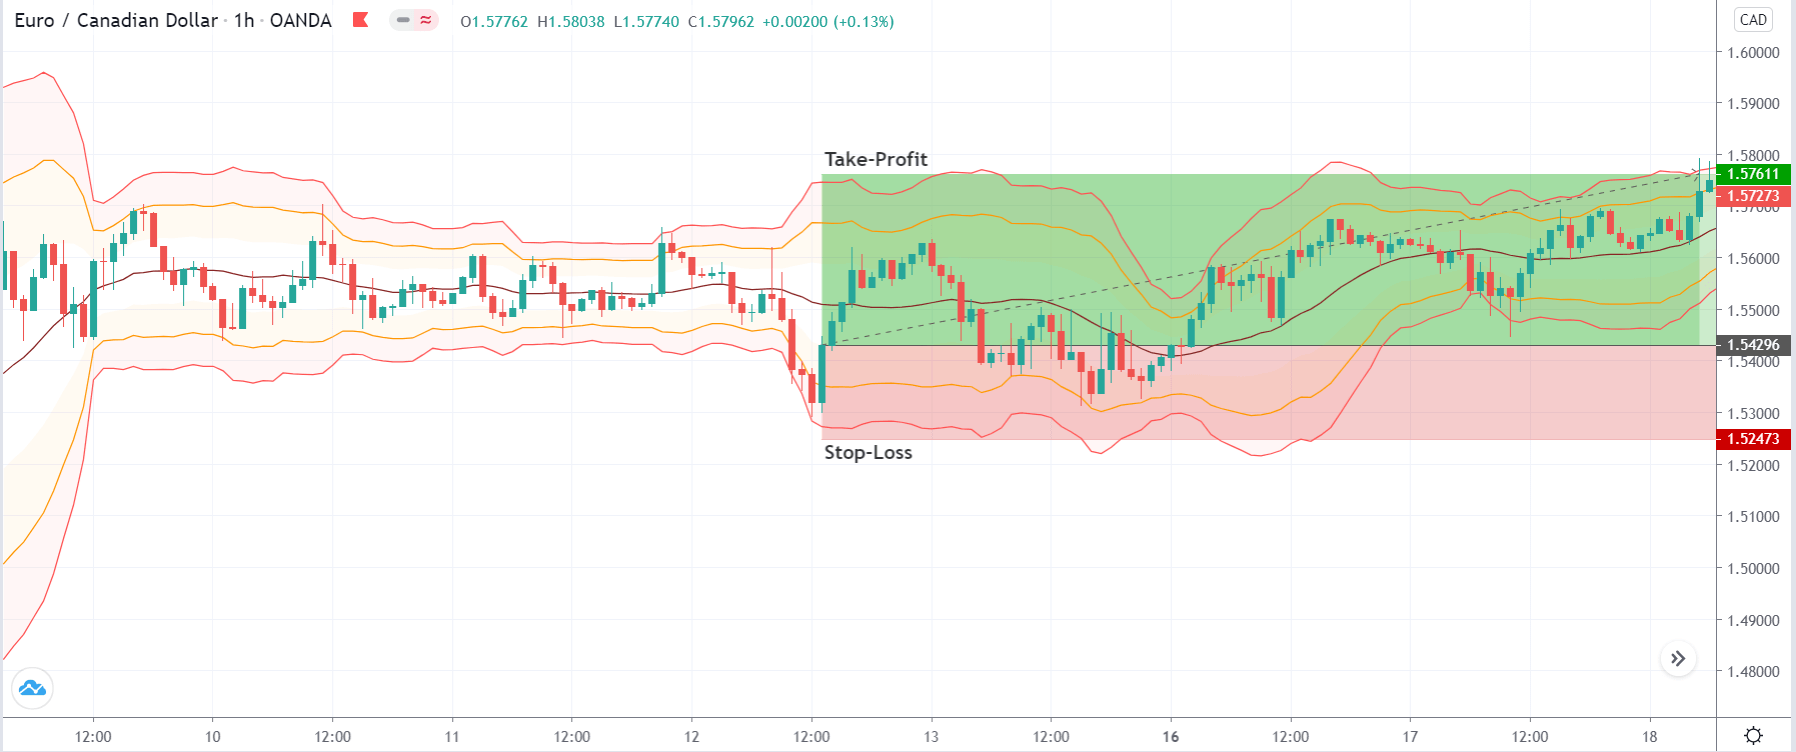
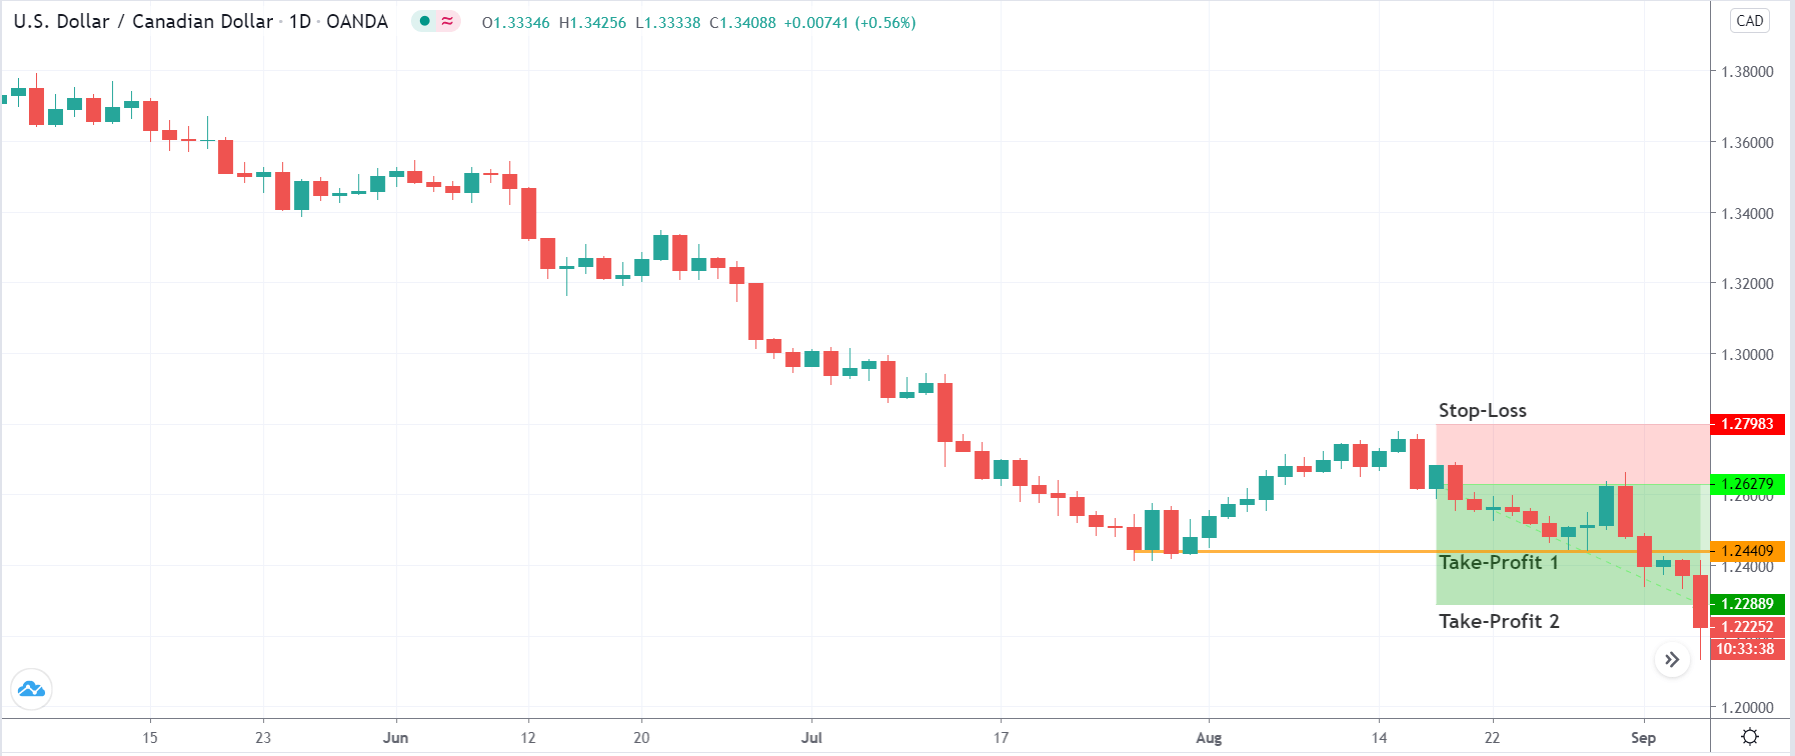
Step 5: In this step, we define the take-profit and stop-loss levels for the trade. The stop-loss is placed below the ‘support’ from where the price had bounced off, in case of a ‘long’ position. On the other hand, it is placed above the ‘resistance’ from where the price had collapsed. The ‘take-profit’ is set at the opposing ‘support’ and ‘resistance’ level as indicated by the pivot point indicator.
Strategy Roundup
The pivot point strategy is like a complementary tool to the traditional S/R strategy that can be used to improve the results. Since we are dealing with really small time frames, the probability of ‘successful trades’ can be ‘low.’ However, that shouldn’t be a concern for us as the risk to reward (RR) of trades executed using the above strategy is above average. This will ultimately put us in a profitable position.


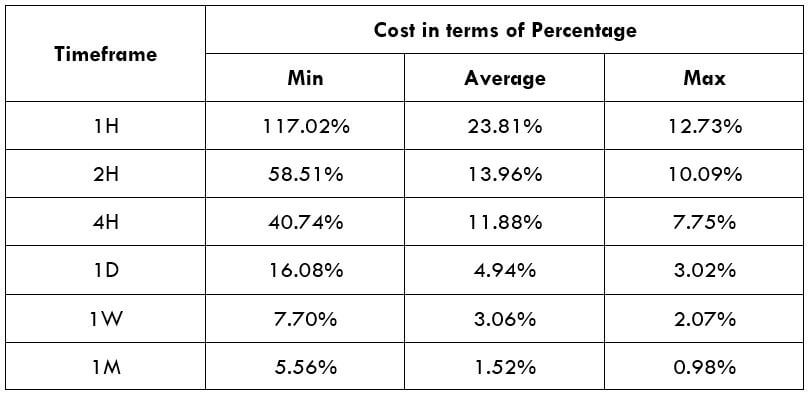
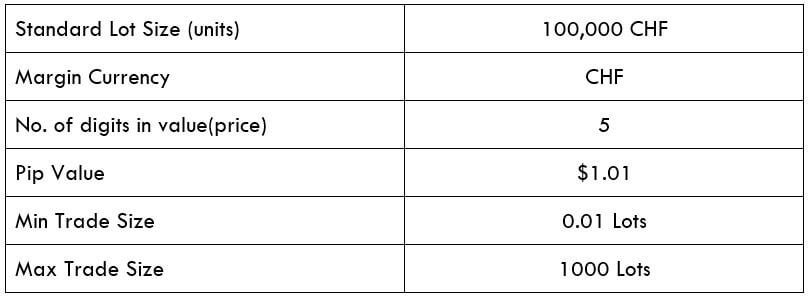 Spread
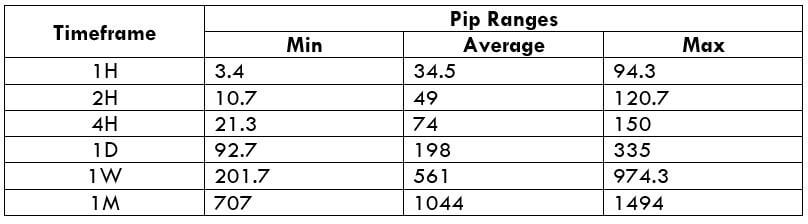
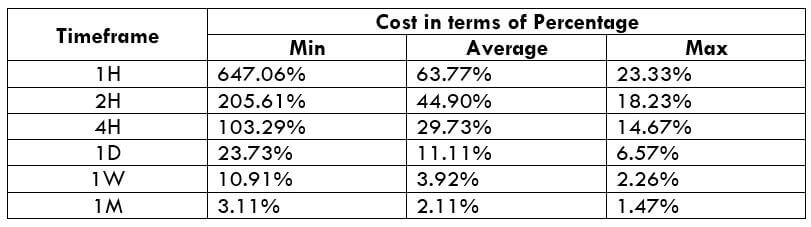
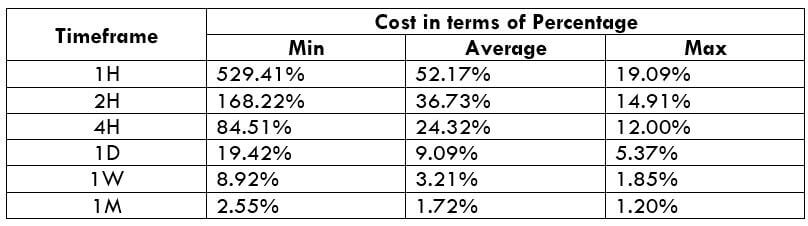
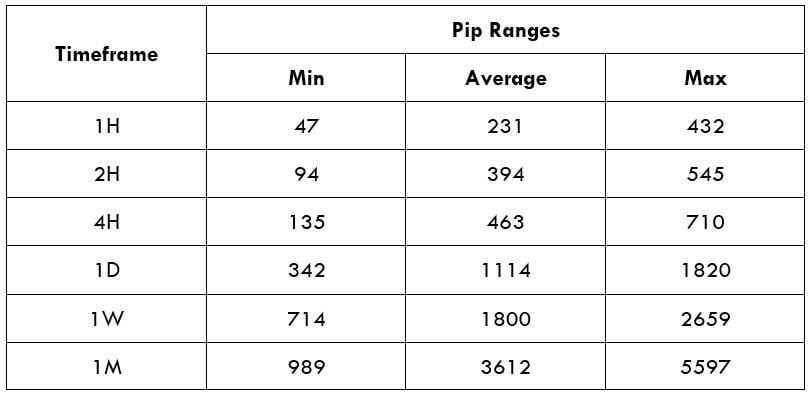 Procedure to assess Pip Ranges
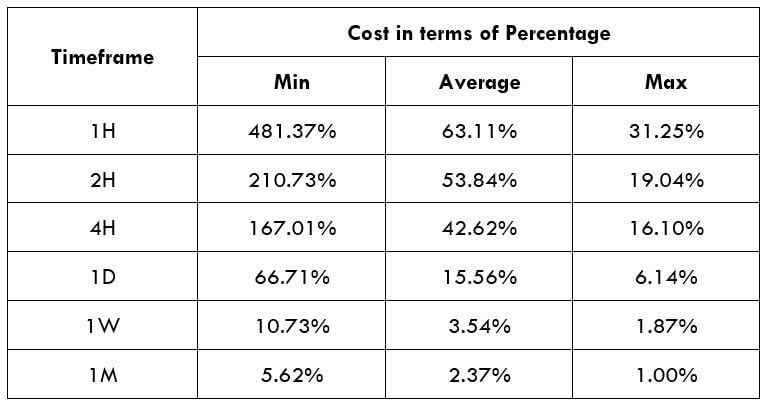
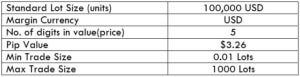
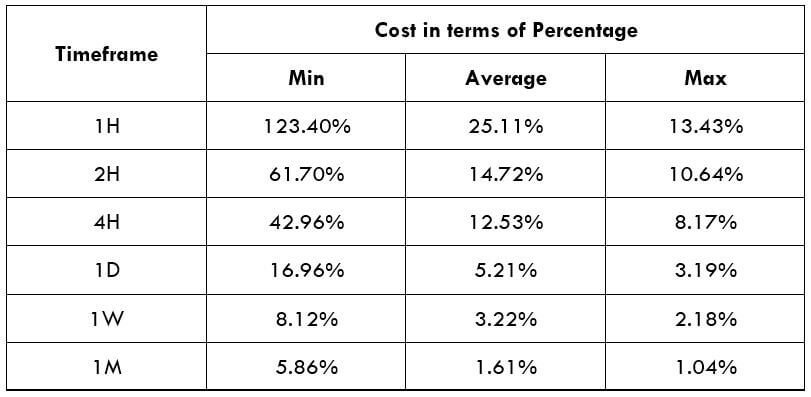 STP Model Account
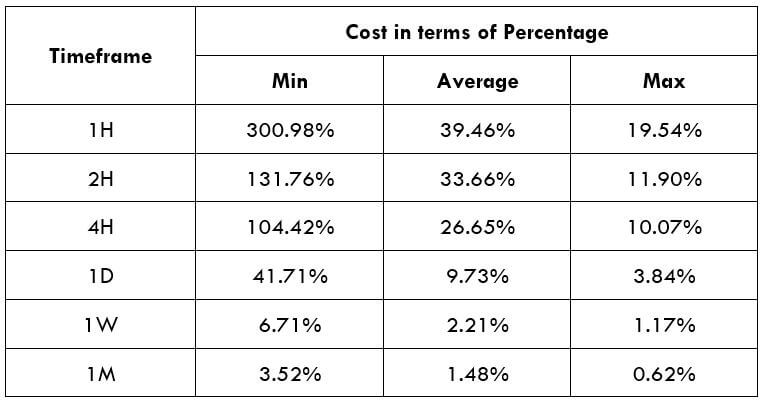