Categories
Forex Basic Strategies

Learning To Trade The ‘Turn To Trend’ Forex Strategy

Introduction

Although many times before, we have stressed on trading with the direction of the market, yet most traders have a hard time trading with the trend. The observation is contrary to what is said by experts and professional traders since the majority of retail traders claim to be trading with the trend but end up trading counter-trend. While everyone talks of the idiom, “the trend is your friend,” in reality, most traders love to pick tops and bottoms and constantly violate the above rule.

Time Frame

The strategy is fixed to two-time frames. The daily time frame for trend identification and the 1-hour time frame for trade entry.

Indicators

We use the following technical indicators for the strategy:

  • 20-period SMA
  • Three standard deviations Bollinger band (3SD)
  • Two standard deviations Bollinger band (3SD)

Currency Pairs

This strategy is applicable to most of the currency pairs listed on the broker’s platform. However, exotic pairs should be avoided.

Strategy Concept

This setup recognizes the desire of most traders to buy low and sell high but does so in the predominant framework of trading with the trend. The strategy uses multiple time frames and a couple of indicators as it’s a tool for entry. First and foremost, we look at the daily chart to ascertain of the pair in a trend. For that, we use the 20-period simple moving average (SMA), which tells us the direction of the market. In technical analysis, there are numerous ways of determining the trend, but none of them is as simple and easy as the 20-period SMA.

Next, we switch to the hourly charts to find our ‘entry.’ In the ‘Turn to Trend’ Strategy, we will only trade in the direction of the market by buying highly oversold prices in an uptrend and selling highly overbought prices in a downtrend. The question arises, how do we know the market is overbought or oversold? The answer is by using Bollinger bands, which help us gauge the price action.

Bollinger bands measure price extremes by calculating the standard deviation of price from its moving average. In our case, we use the three standard deviation Bollinger band (3SD) and Bollinger band with two standard deviations (2SD). These two create a set of Bollinger band channels. When price trades in a trend, most of the price action will be contained within the Bollinger bands of 2SD and 1SD.

Trade Setup

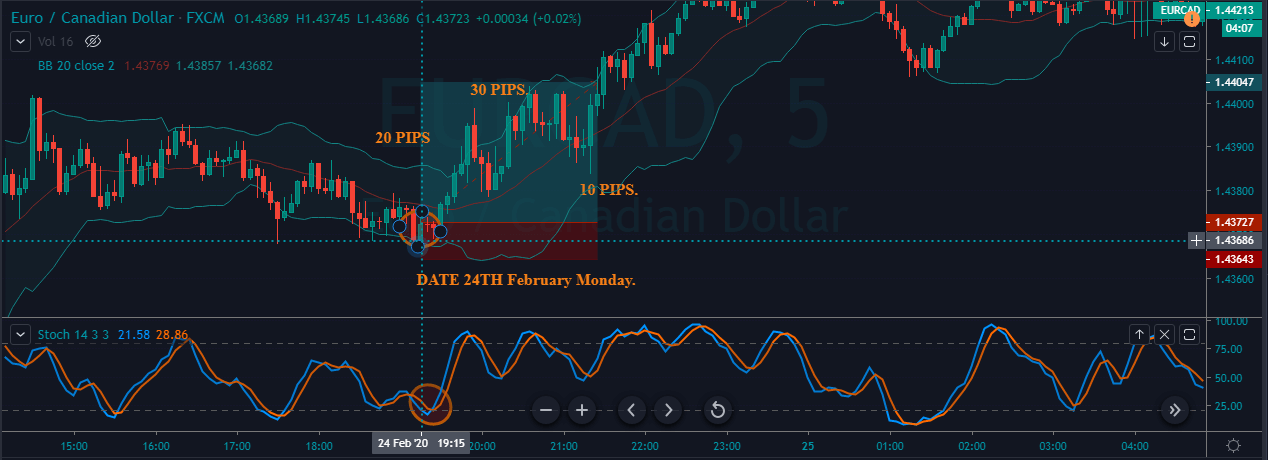
In order to illustrate the strategy, we have considered the chart of EUR/CAD, where we will be applying the strategy to take a ‘long’ trade.

Step 1

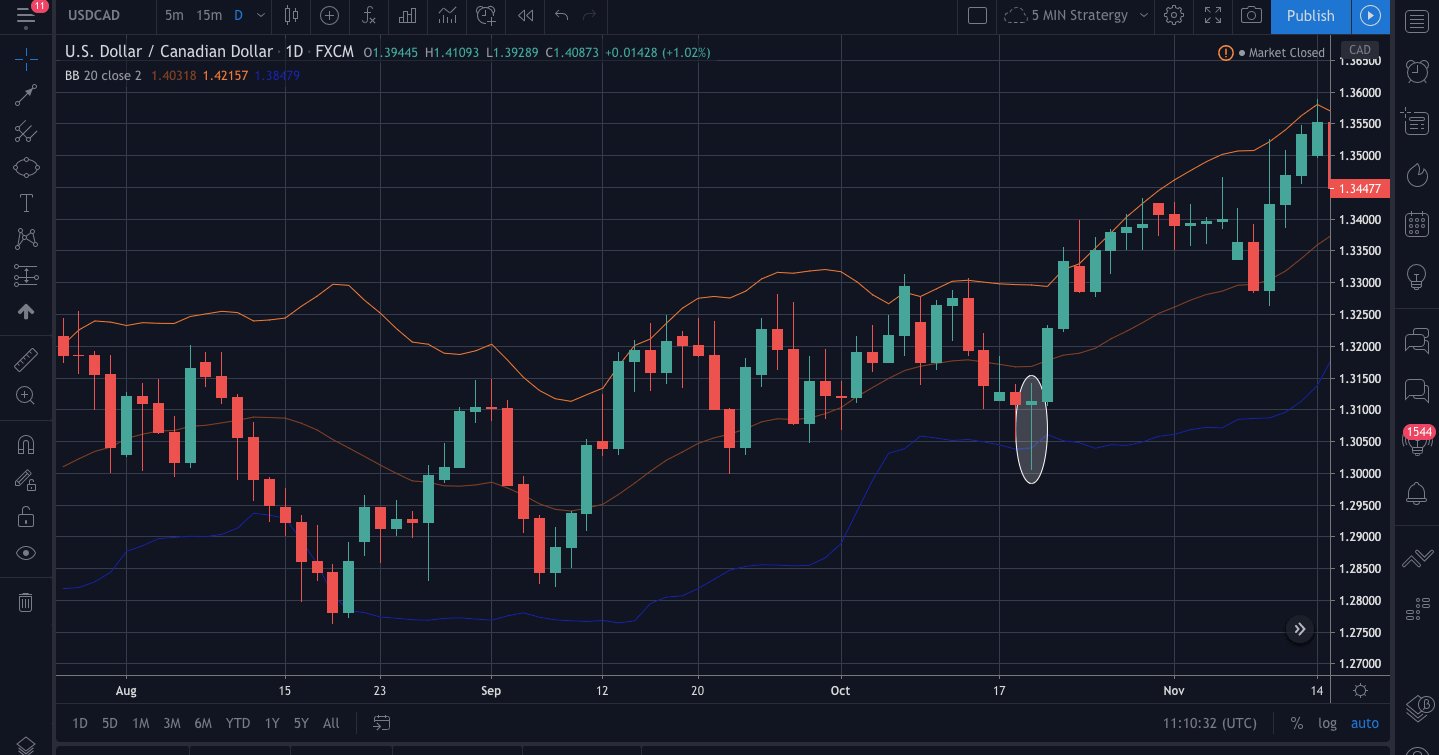
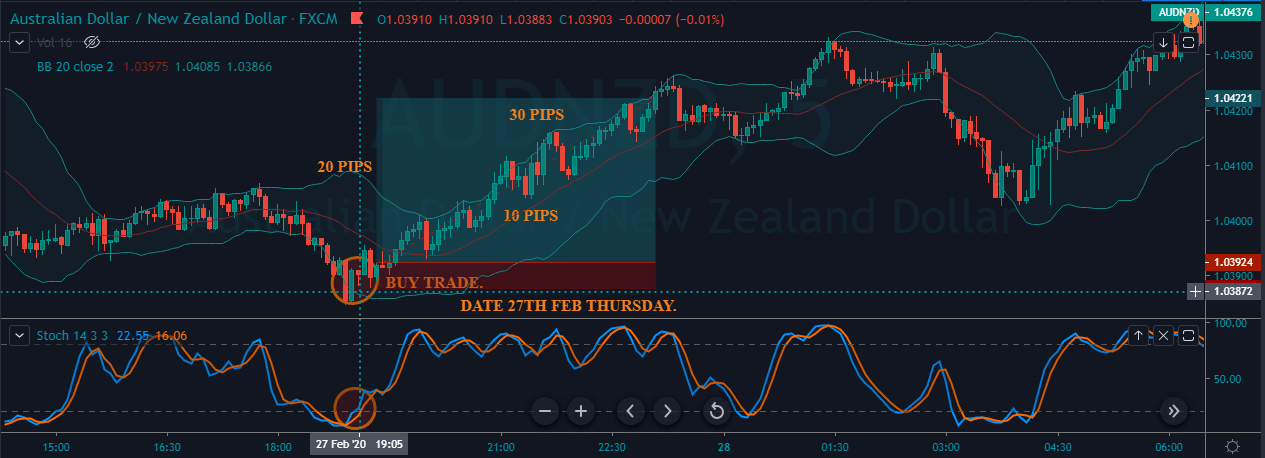
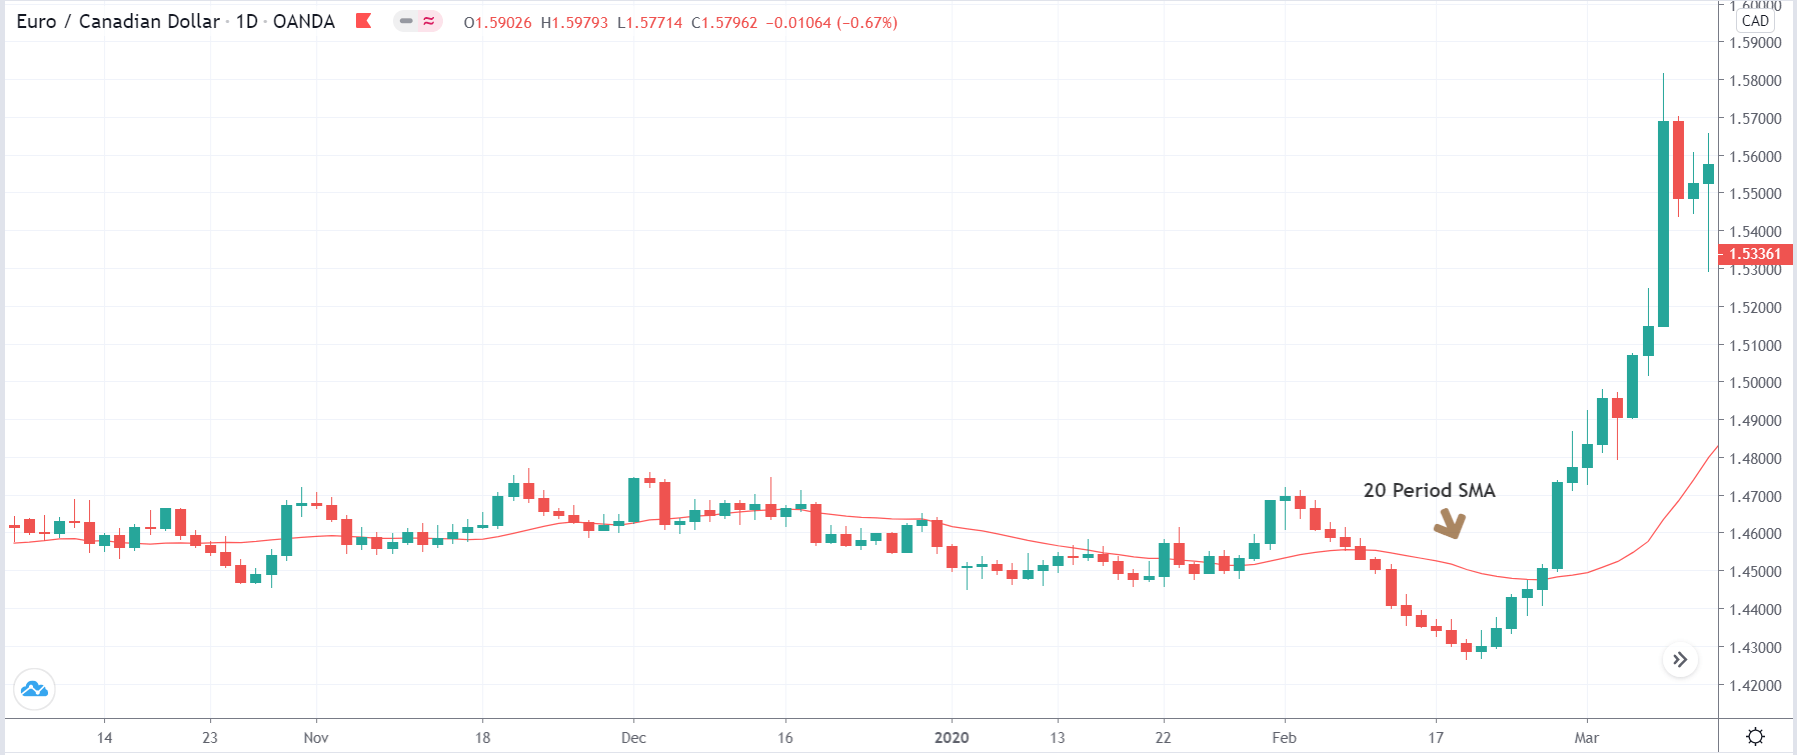
The first step is to identify the major trend of the market. This can be done using the 20-period simple moving average (SMA). If the price is very well above the SMA, we say that the market is in an uptrend. Likewise, if the price is mostly below the SMA, we say that the market is a downtrend. For this strategy, we have to determine the trend on the daily chart of the currency pair.

In our case, we see that the market is in a strong uptrend, as shown in the below image. Hence, we will enter for a ‘long’ trade at the price retracement on the 1-hour time frame.

Step 2

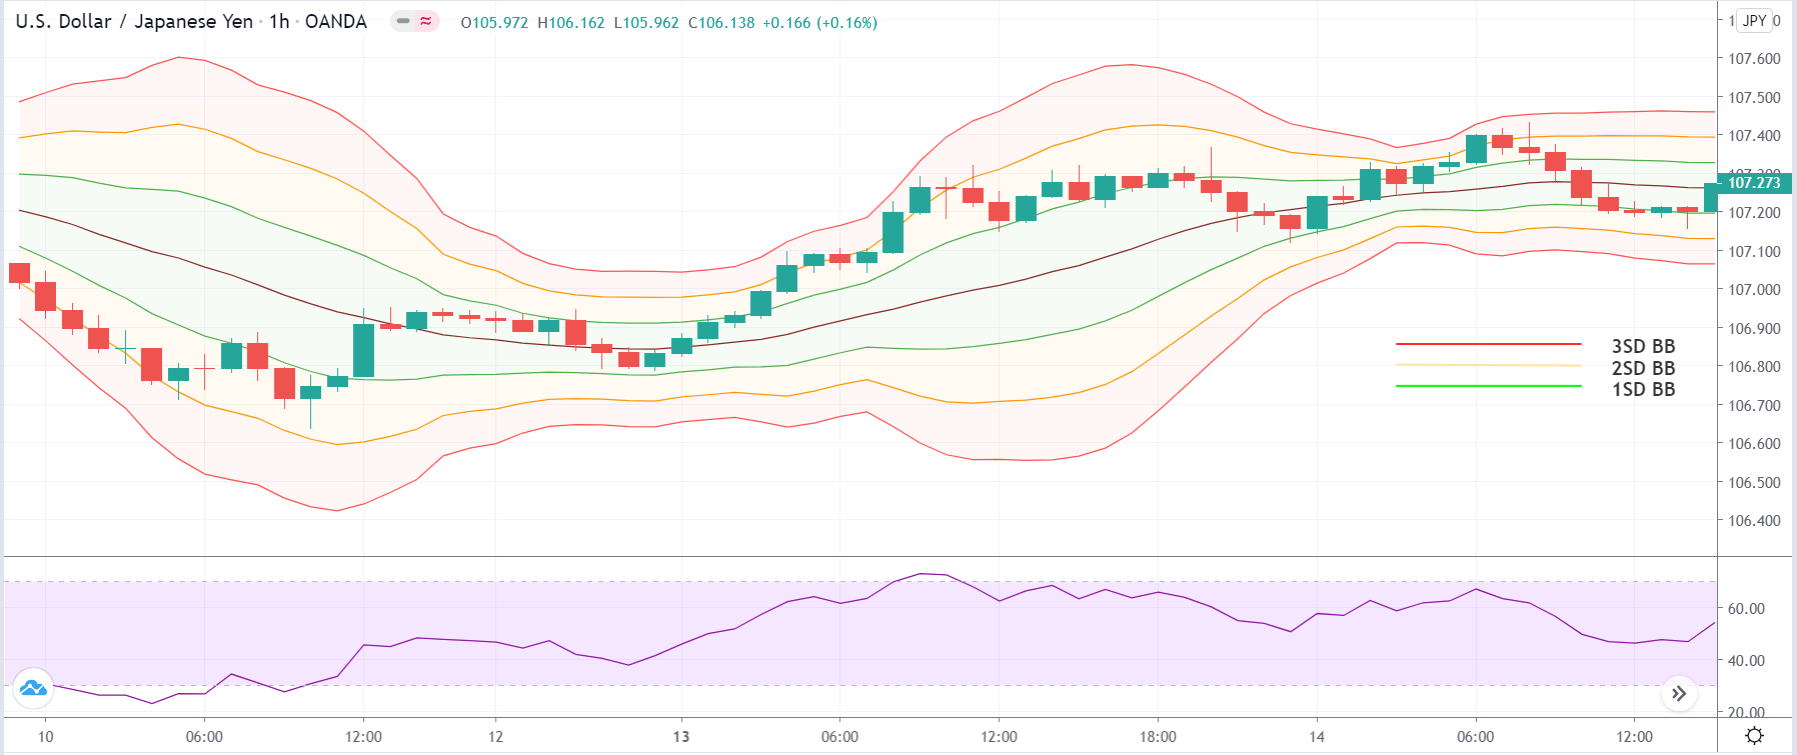
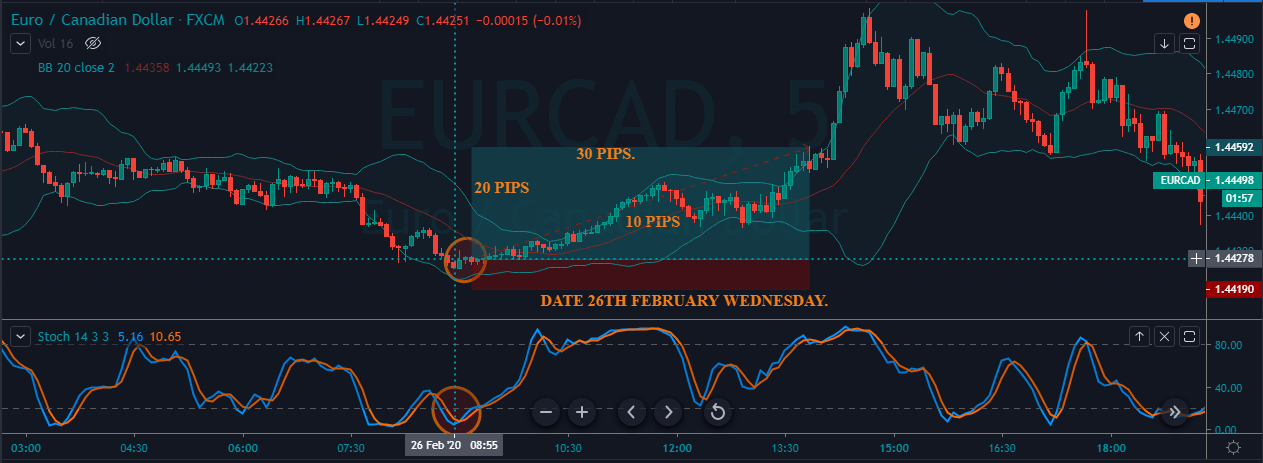
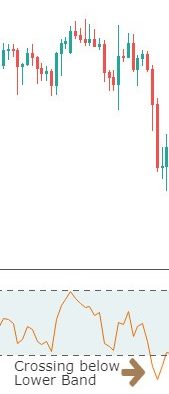
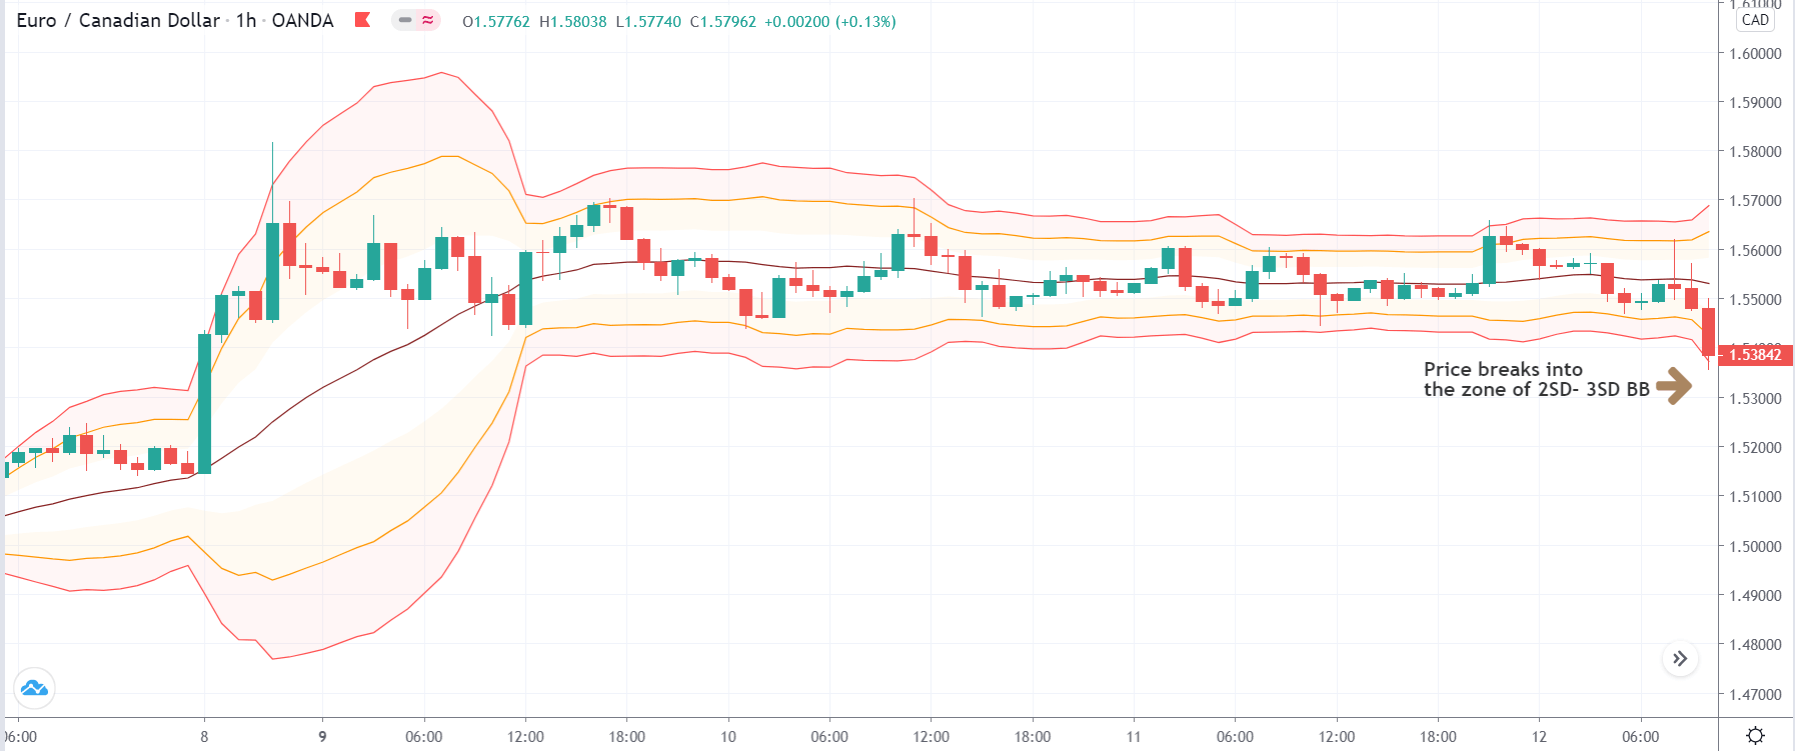
Next, we have to change the time frame of the chart to 1 hour and wait for a price retracement. In order to evaluate the retracement, we plot three standard deviations (3SD) and two standard deviations (2SD) Bollinger band on the chart. After plotting the two Bollinger bands, we need to wait for the price to get into the zone of 2SD-3SD BB.

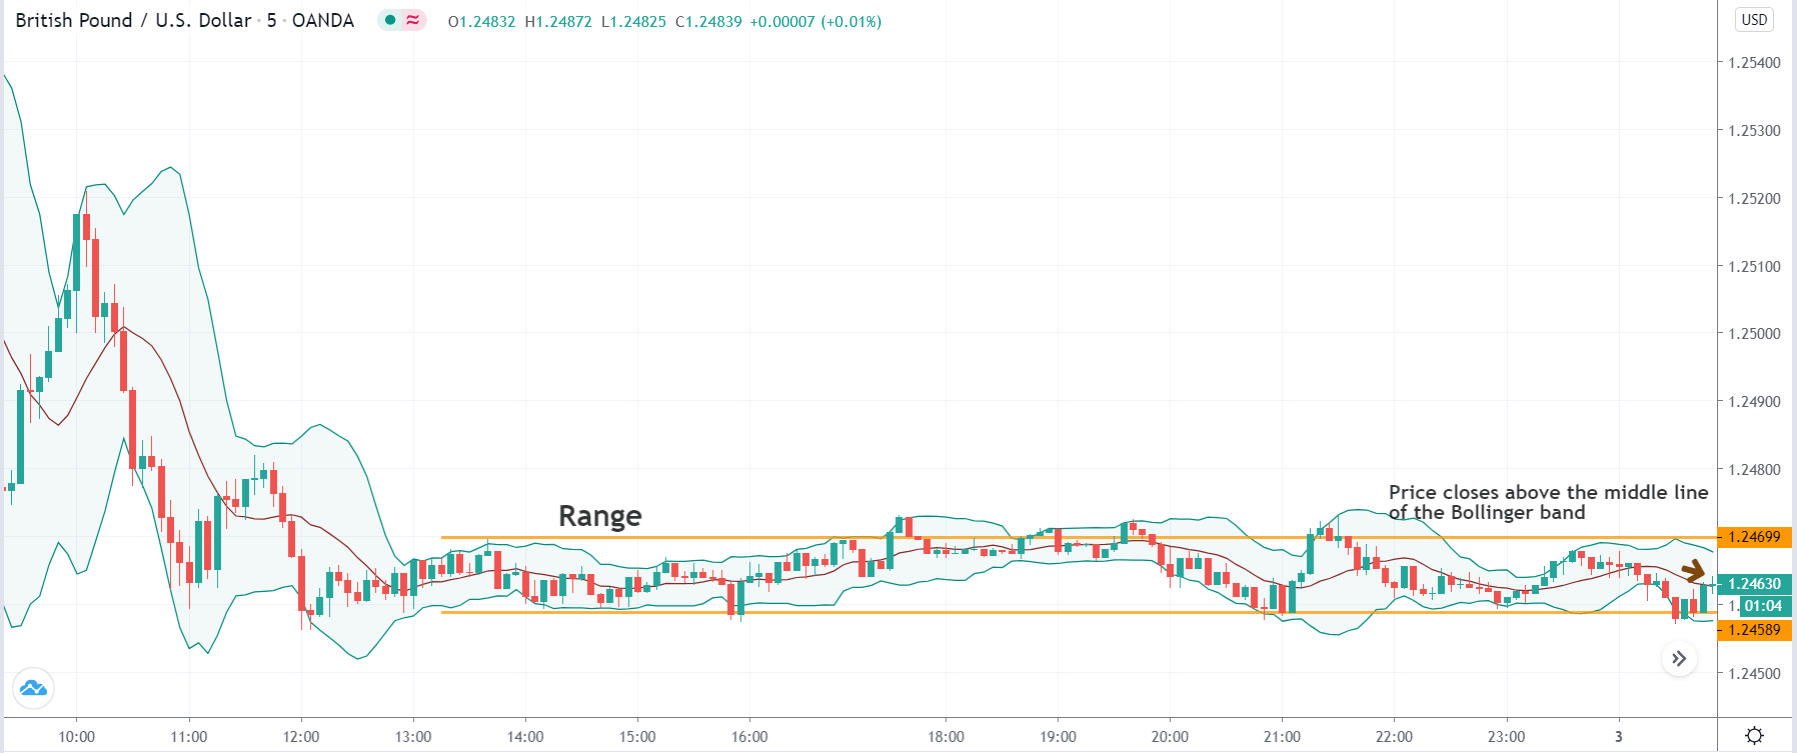
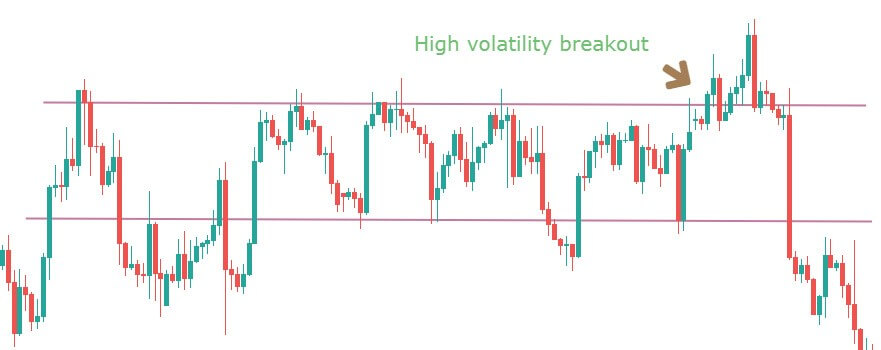
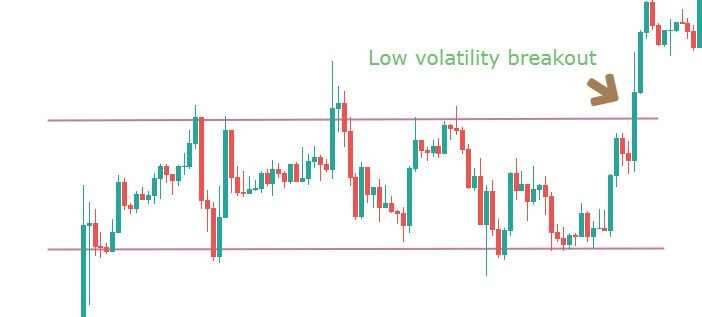
In the below image, we can see that the price breaks into the zone of 2SD-3SD BB after a lengthy ‘range’ movement.

Step 3

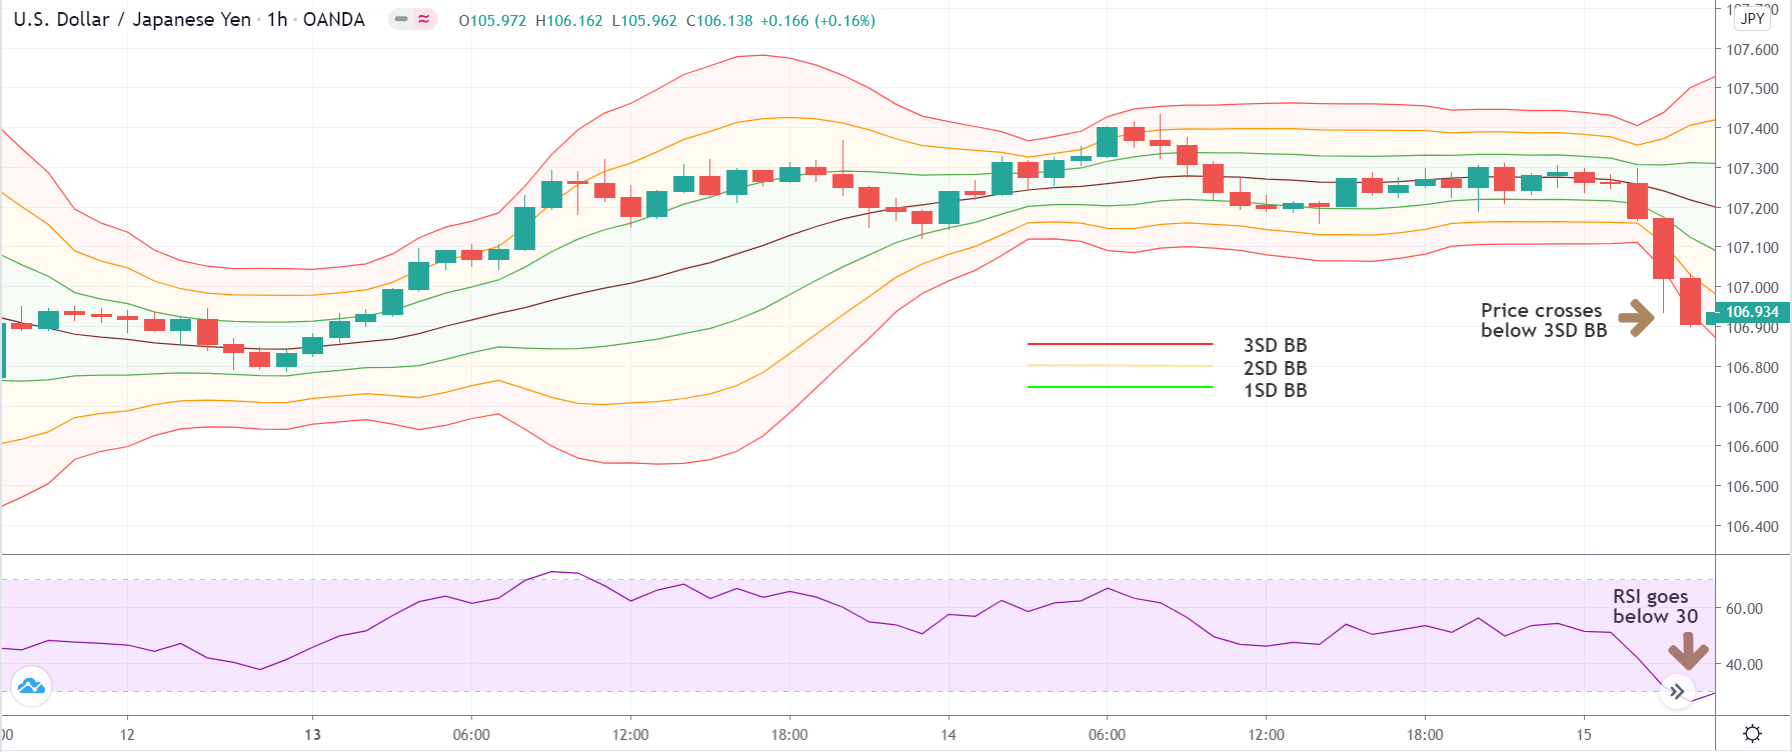
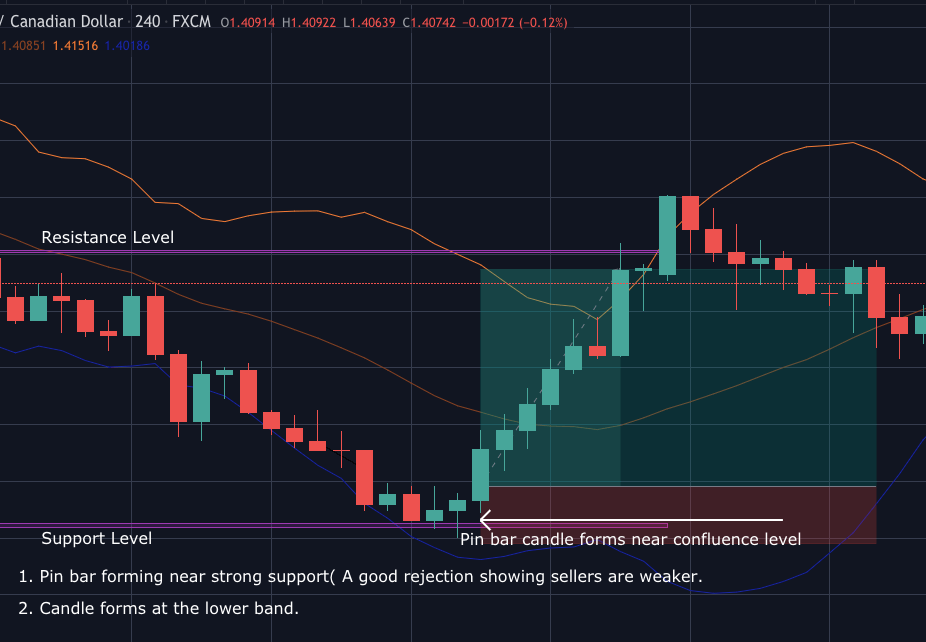
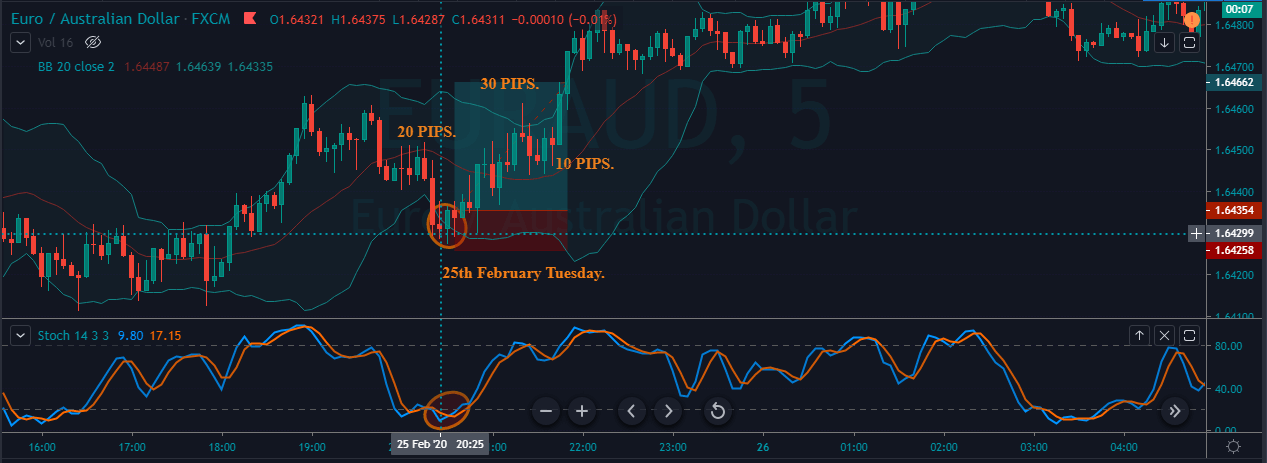
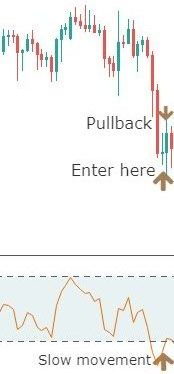
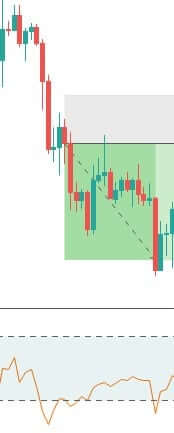
Once the price moves into the zone of 2SD-3SD BB, we wait for the price to bounce off from the lower band of the 3SD BB to give an indication of a reversal. In a ‘short‘ set up, the price should react off from the upper band of the 3SD BB, and give an indication of downtrend continuation. During this process, we need to make sure that the price does not break below or above the 3SD BB. Because if this happens, the ‘pullback’ is no more valid, and this could be a sign of reversal. This is a crucial aspect of the strategy.

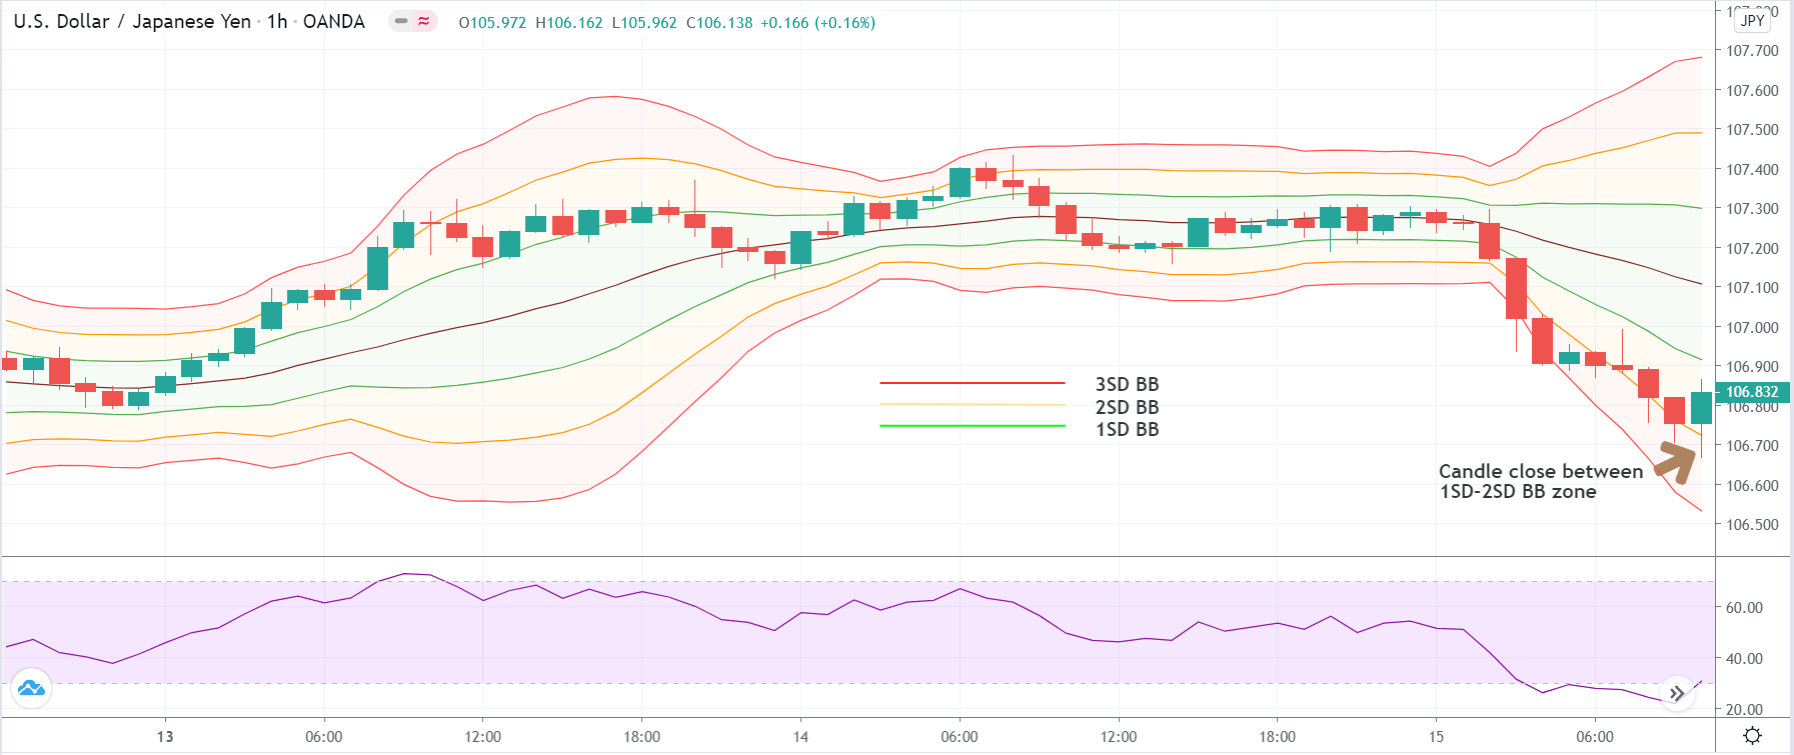
The below image shows how the price bounces off from the lower band of the 3SD BB two candles after the price moves into the zone.

Step 4

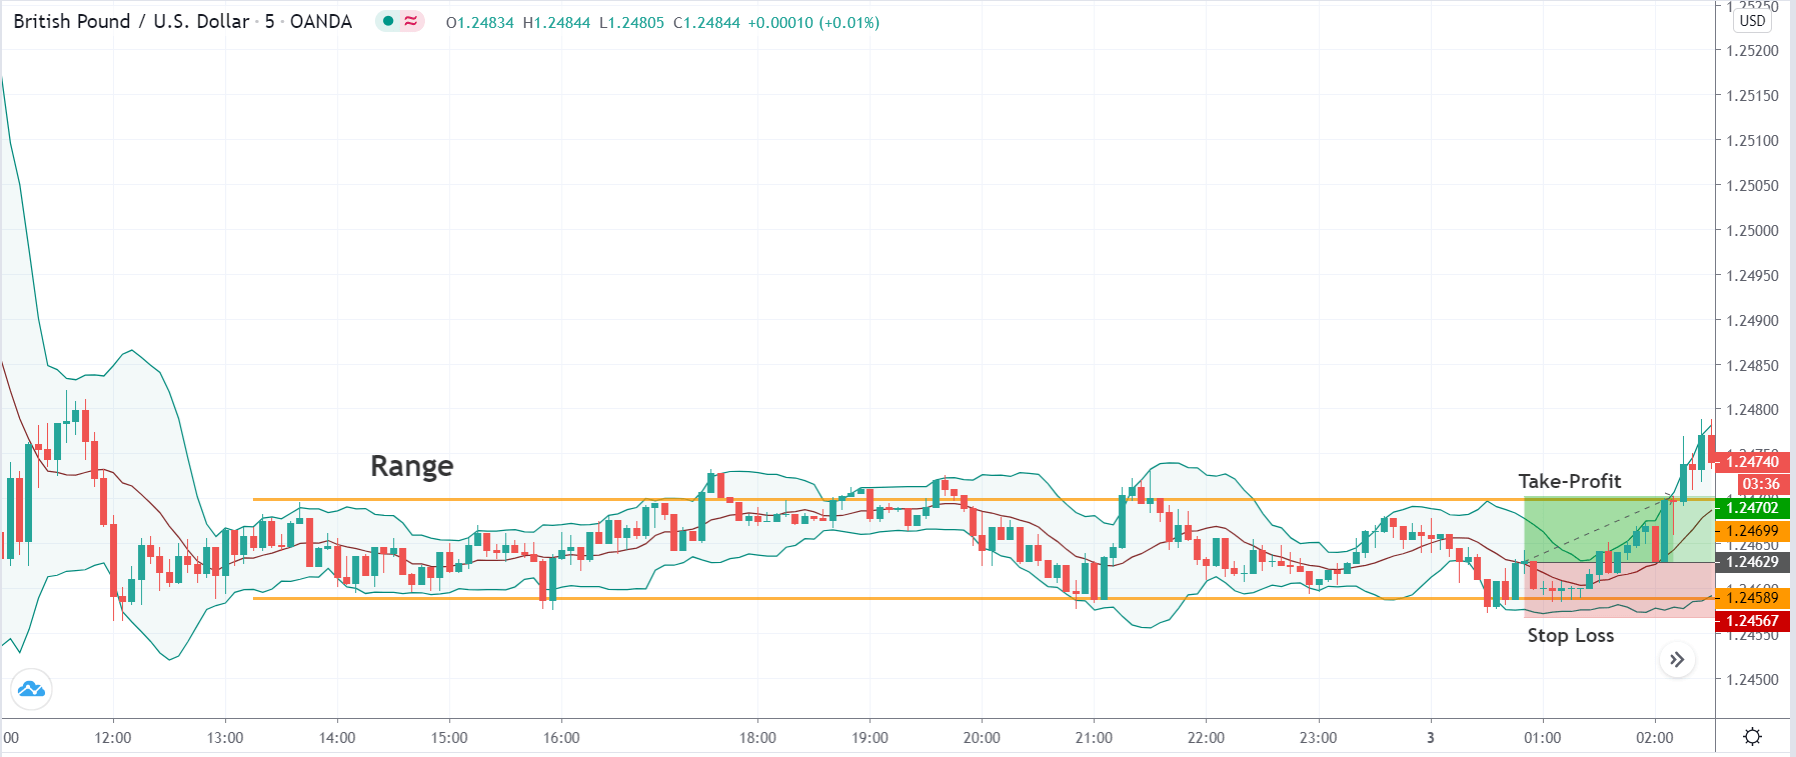
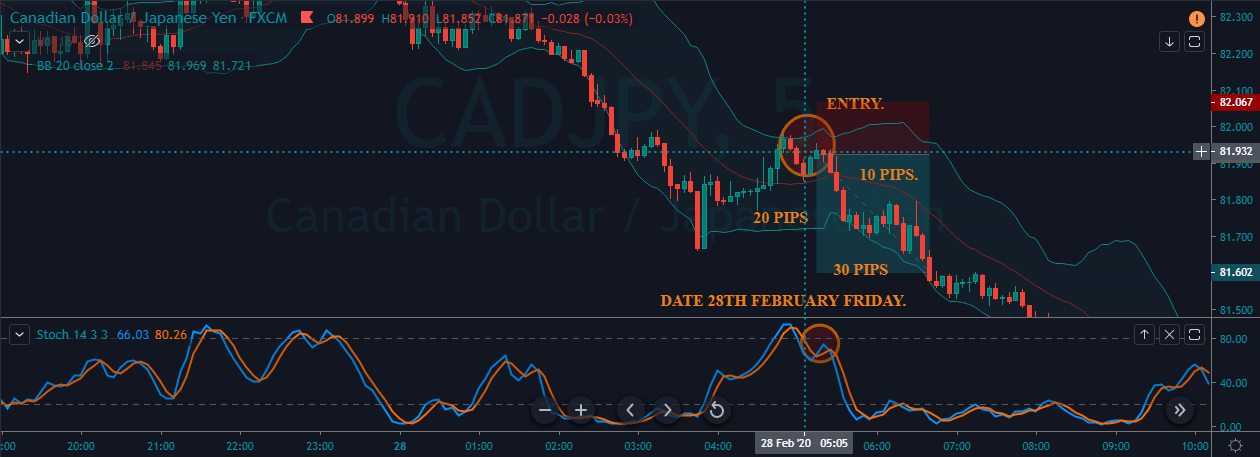
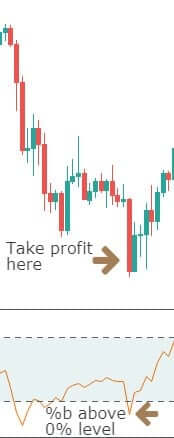
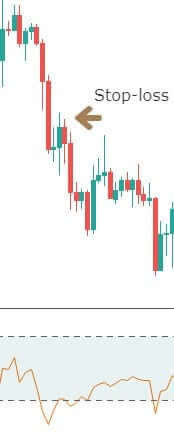
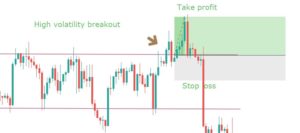
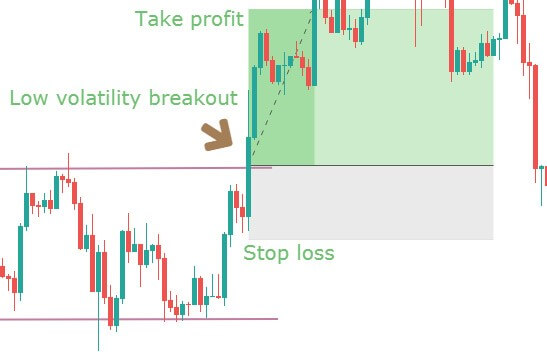
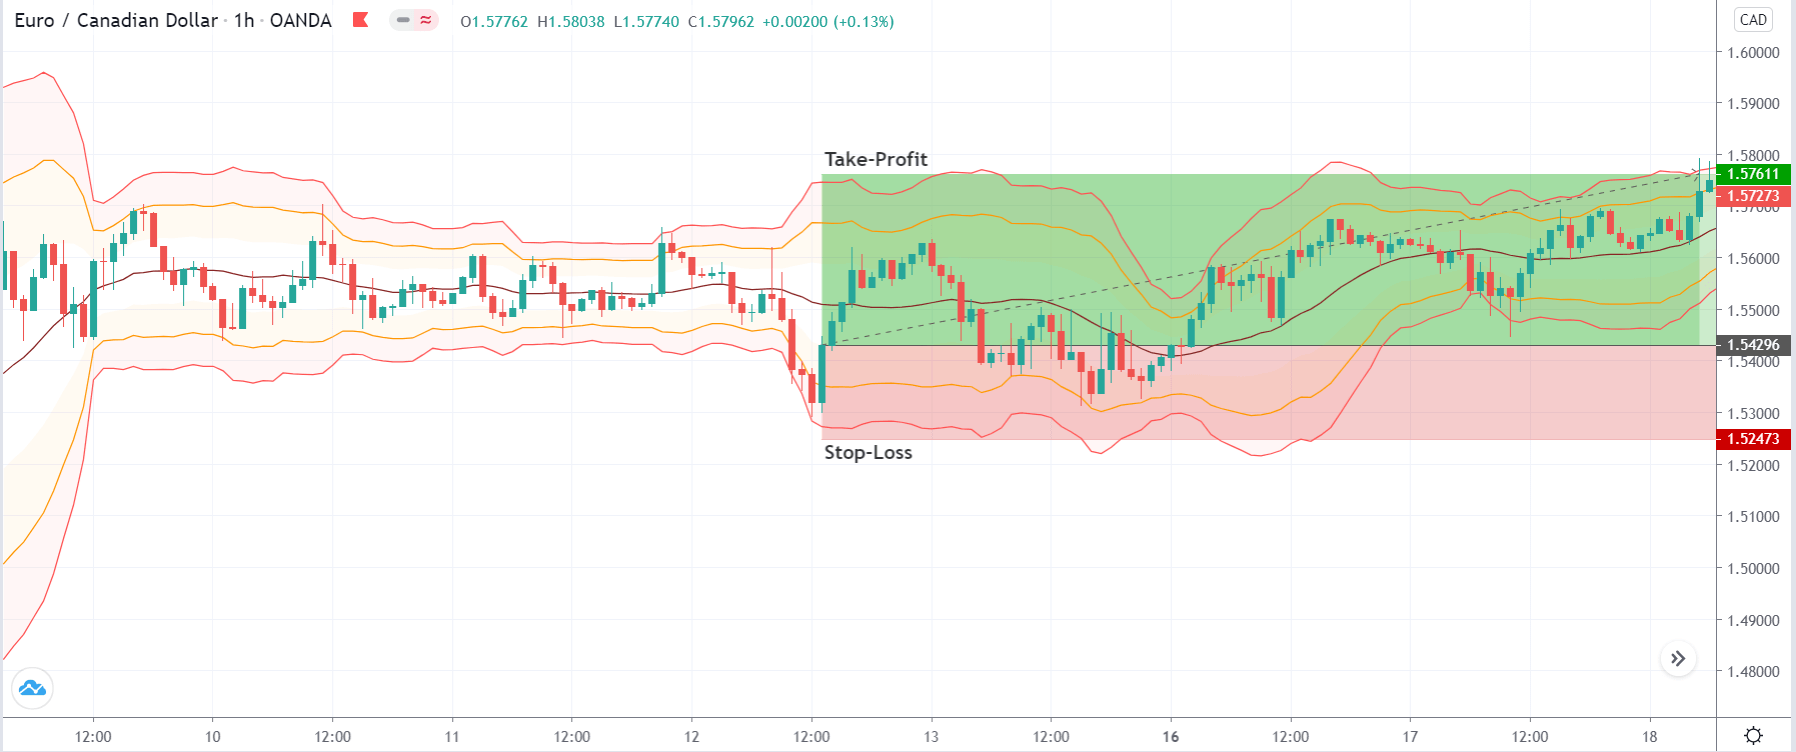
We enter the market at the first sign of trend continuation, which was determined in the previous step. Now we need to define the stop-loss and take-profit for the strategy. Stop-loss should be placed below the lower band of the 3SD BB, in case of a ‘long’ trade and above the upper band of the 3SD BB, in a ‘short’ trade. The ‘take-profit’ is not a fixed point. Instead, we take our profit as soon as the price touches the opposite band of the 3SD BB.

In the case of EUR/CAD, the resultant risk-to-reward of the trade was a minimum of 1:2, as shown in the below image.

Strategy Roundup

The beauty of this setup is that it prevents us from guessing the turn in the market prematurely by forcing us to wait until the price action confirms a swing bottom or a swing top. If the price is in a downtrend, we watch the hourlies for a turn back to the trend. If the price continues to trade between the 3SD and 2SD BB, we stay away as long as we get confirmation from the market. We can also set our first take-profit at 1:1 risk to reward to lock in some profits.

Categories
Forex Basic Strategies

Learning To Trade The Forex Market Using ‘Pure Die-Out’ Strategy

Introduction

Everyone wants to be the hero in the market and claim that they have picked the top or bottom of a currency pair. However, apart from boasting, there is no gain from repetitive selling at every new ‘high’ in hopes that this one would be the final ‘high.’ One of the biggest dangers encountered by novice traders is picking a top or bottom with no logic. The pure die-out is an intraday strategy that picks a top or bottom based upon a strong recovery after an extended move.

Time Frame

As it is an intraday strategy, the highly suitable time frames are 1 hour and 15 minutes.

Indicators

In this strategy, we will be using two indicators. The two indicators are RSI and Bollinger Bands.

Currency Pairs

This strategy works best on major currency pairs only. Among these, the preferred ones are EUR/USD, USD/JPY, GBP/USD, GBP/JPY, and USD/CAD.

Strategy Concept

The strategy looks for intraday fake-outs using three sets of Bollinger bands and the relative strength index (RSI) on the hourly and 15-minute charts. The trade setup is formed when RSI hits either an overbought or oversold level. The market is considered to be overbought when RSI moves above 70, while the market is considered oversold when RSI goes below 30.

This signals a possible reversal in the market and that we can start looking for a trade in the opposite direction. However, rather than just immediately buying or selling in hopes for a trend reversal based solely upon RSI, we add in three sets of Bollinger Bands, to help us identify the point of over-extension. We use three sets of Bollinger Bands because it helps us assess the extremity of the move along with the extent of possible U-turn.

The conventional theory of Bollinger bands suggests buying or selling when prices hit the two bands. In our strategy, we will totally be using three Bollinger bands, and when prices hit the third band on any side, we say that the move is within the 5% small group, which characterizes the move as extreme.

When prices move away from the third standard deviation Bollinger band and move into the zone of first and second Bollinger band, we are confident that the currency pair has hit its extreme point and is moving into a reversal phase.

Finally, we look for one last thing before making an entry: a candle to close fully between the second and first Bollinger Bands. This last step helps us screen out false moves and assures that the previous move was really exhaustion. This is a low-risk and low-return strategy that is suitable for traders who like to scalp the market.

Trade Setup  

To illustrate the strategy, we have considered the USD/JPY currency pair, where we will be applying the 1-hour chart strategy. Here are the steps to execute the strategy.

Step 1

Firstly, open the 1 hour or 15 minutes chart of the desired currency pair. Then plot the Bollinger band and RSI indicator on the chart. We need to plot 3 Bollinger bands with the same ‘period’ but different standard deviations. The first Bollinger band (BB) should have a standard deviation (SD) of 1, the second BB will have SD of 2, and finally, the third BB will have SD of 3. RSI will carry the default settings.

The below image shows the Bollinger band indicator plotted on the USD/JPY currency pair and the RSI on it.

Step 2

If we are looking for an overextended move on the downside, wait for the price to cross below the lower band of the 3SD BB or if we are looking for an overextended move on the upside, wait for the price cross above the upper band of the 3SD BB. Along with this, we need to see that the RSI goes below the 30 ‘mark’ in a down move and moves above the 70 mark in an up move. Both conditions need to be satisfied simultaneously.

In the example since we are looking for a ‘buy’ trade, we have to wait for the price to cross below the lower band of the 3SD BB along with the RSI reading of below 30. The below image shows that the conditions mentioned above are fulfilled.

Step 3

In this step, we wait for a candle to open and close between the 2SD BB and 1SD BB zone. It is important to check that the entire body of the candle is within this zone, and it closes near the lower band of the 1SD BB. This was for a ‘long’ setup. In the case of a ‘short’ trade, the only difference is that the candle should close between the upper band of the 2SD BB and 1SD BB.

In the below image, we can notice a bullish candle that closes well within the required zone, which is a sign of reversal.

Step 4

In this step, we determine the ‘stop-loss’ and ‘take-profit‘ for the strategy. Stop-loss is placed below or above the ‘low’ or ‘high,’ respectively, from where the reversal began. As we are trading against the trend, the ‘take-profit’ is set at 1:1 risk to reward. We will also lock-in some profits when the market starts moving in our favour, to ensure that we don’t lose money if it turns midway.

Strategy Roundup

In this strategy, we combine two technical indicators to identify the market’s top and bottom, without making wild guesses. This means we are determining overextended moves logically and technically. After practising well on the 1-hour chart, we can spot trade setups on the 15 minutes time frame. Since these are counter-trend trades, the probability of success will be less. This strategy is very simple to understand if we have basic knowledge of indicators.

Categories
Forex Basic Strategies

Heard Of The ‘Piranha’ Forex Trading Strategy?

Introduction

The forex market is mostly seen to move in a trend or a range. In the previous article, we discussed the rapid-fire strategy, which works best in a trend. The piranha strategy that we are going to discuss is used in a ranging market.

Everyone would have heard of piranhas. They typically take small bites frequently off their prey until it is totally devoured. A single bite may not cause much harm, but it is the frequency of bites that causes the attack to be deadly. In the same way, the piranha strategy was developed to allow scalpers to bite the market and chew off small profits each time.

This strategy is specifically designed for the GBP/USD currency pair, where it is applied to the 5-minutes time frame chart. On average, one can find over 15 trades in a day using the piranha strategy.

Time Frame

The piranha strategy is useful for trading on the 5-minutes time frame. This means each candlestick on the chart represents 5 minutes of price movement.

Indicators

For this strategy, we use the Bollinger band technical indicator with the following settings.

  1. Period 12, Shift 0
  2. Deviation 2

When prices approach the upper band, the market is considered to be overbought, and when prices approach the lower band, markets tend to consolidate. By setting a higher deviation value, the price volatility will be magnified, and we geta a Bollinger band with wider upper and lower bands.

Currency Pairs

The strategy is designed for the GBP/USD currency pair, which is also referred to as The Cable. However, some other currency pairs in which the strategy can be used include EUR/USD, USD/JPY, and GBP/JPY. Since the strategy takes place in short timeframes it is advisable on highly liquid pairs.

Strategy Concept

We will use the Bollinger band indicator to identify the trading range of GBP/USD, after which we will mimic the nature of the piranhas by defining objective entries for long and short positions. Long trades are initiated when market prices touch the bottom of the band, and short trades are taken when prices touch the upper band.

Piranhas are active in rivers and ponds but not in the rough seas with strong currents and waves. In a somewhat similar way, we avoid trading this strategy at times of major news announcements during the U.S. or London sessions, as such environments reflect rough seas with strong currents and waves. We will analyze the GBP/USD currency pair on the 5-minutes chart to look for long and short trades.

Trade Setup

Step 1

The first step of the strategy is to first look for a range on the chart of GBP/USD. The range can be identified using the Bollinger band strategy. However, we need to apply the concepts of price action for the identification of the range. The essential criterion for a range is that the price should respect the support and resistance levels at least twice. After we have identified the range, we will apply our strategy at the extreme ends of the range to take a suitable position in the pair.

The below image shows an example of the kind range that is required for the strategy.

Step 2

The next step is to wait for the market to hit the lower band of the indicator or upper band of the indicator. At the lower band, we will look for buy opportunities, and likewise, if the price at the upper band, we will look for sell trades.

In this example, we see that the price has approached the lower band, which means there is a high chance that buyers will take the price higher from this point.

Step 3

One should not enter the market soon after the price touches the lower or upper band, which carries a huge risk. We need confirmation from the market before we can take a suitable position. In this step, we look for that confirmation. Once the price closes above the middle line of the Bollinger band indicator, it is a confirmation that the support is respected this time and that the price is heading at least till the range’s resistance.

Step 4

In this step, we determine the take-profit and stop-loss levels for the strategy. We have two take-profit levels – the first take-profit is set at the upper side of the range, a typical place for booking profits. Another method is to hold on to the trades until the market shows signs of reversals, which is when the price falls below the middle line of the Bollinger band.

The stop-loss for this strategy is placed below the support of the range or below the lower band. The trade offers a risk to reward ratio of around 1 to 1.5, which is not bad.

Strategy roundup

In the beginning, we mentioned that the piranhas hunt their prey until it is completely devoured. In a similar way, once the trade hits our stop loss, it means there is nothing left, and we need to look for a new setup.

The triggering of stop loss is an indication that the market is no longer trading in that band, and it has started a new trend. In such cases, wait until the market halts and starts moving in a range. The only difference will be that we will be looking for a trade in the opposite direction with the same rules.

This is an important point and a trick that one can use to navigate themselves in trending markets. As the strategy is developed to trade in a range, one will find few opportunities when the market goes into a strong trend.

Categories
Forex Basic Strategies

Best Way To Trade The ‘Pin Bar’ Forex Chart Pattern – The Pin Bar Reversal Strategy!

Introduction

Price action or Candlestick analysis combined with some of the factors and confirmations is more reliable as they work out even without using too many indicators on the price chart. Using many indicators on the charts makes it difficult for traders to see the bigger picture (opportunities) in the market. We have numerous candlestick patterns in trading, but there are few on which many traders have their eyes on. One of those is the Pin bar candlestick pattern.

The pin bar candle is mostly used as a reversal pattern. A pin bar typically consists of a price bar with a long wick or shadow. The region between the open and close of the pin bar is called its real body, and a long tail is known as the wick. Pin bars generally have small real bodies in comparison to their long wick. The body of the pin bar is one-third of the total size of the candle. The long wicks of the candle show the area of the price that was rejected and signifies that the price will now move in the opposite direction of the wick.

The psychology behind trading a pin bar candle is that when a price is moving in one direction and reaches significant support or resistance level, it gets rejections. Rejection in a downtrend signifies that the seller pressure (supply) in the market is decreasing, and the buyer pressure (demand) has started increasing and vice versa. The pin bar, either bullish or bearish, signifies that the price does not want to go more down or up and want to reverse from that strong support or resistance level.

Understanding The Bullish & Bearish Pin Bars

Every time a pin bar candle occurring at a strong level does not always mean that the market is going to reverse from that level. To make this valuable, we must see that the overall picture and not just a single candle. In this trading strategy, we will see how we can analyze the overall market near that confluence level. Before that, let’s understand the two types of pin bar candlestick patterns.

Bullish Pin Bar Reversal Pattern

The bullish pin bar candle occurs when the price comes near a strong support level; this leads to the formation of a long wick of the pin bar and shows rejection from that level. This candle usually forms at the end of a downtrend and signifies that there can be either a short-term uptrend or a full reversal forming a strong uptrend.

Bearish Pin Bar Reversal Pattern

The bearish pin bar candle occurs when the price comes near a strong resistance level; this leads to the formation of a long wick of the pin bar and shows rejection from that level. This candle usually forms at the end of an uptrend and signifies that there can be either a short-term downtrend or a full reversal forming a strong downtrend.

Trading Strategies

Pairing The Pin Bar candles With Support & Resistance Levels

As already mentioned, just finding a pin bar candle at the support and resistance level is just not sufficient to trade. We have to figure out what the market is exactly trying to show us. When we see the candles approaching a strong support or resistance level, we have to analyze all the previous candles carefully. If the candles are very big and the momentum is very high, it is less likely to bounce back from that particular level. So, what we have to do is carefully track the candles with wicks. Candles with wicks show that the particular trend momentum is getting weak, and the pressure is reducing as the level is approaching.

After we see candles with wicks and some weaker candles, we will wait for our pin bar candle. As soon as we see the pin bar candle, we have to wait for the next candle to close above the pin bar’s high. We can then buy or sell in the market and place our stop loss 2-3 pips below the pin bar’s low.

In the below USDCAD 1Hr chart, we can see that the market touches the support level 3 times, the first time the candle was a long and strong bearish candle, and so we must take trades as the picture is still not clear. The second time when the market reaches the support, we see the candles have small bodies and more wicks. This tells us that the seller pressure is decreasing. Finally, for the third time, the market started getting rejections even before touching the support level, and we can also see so many long wicks in the candles. Finally, we see a pin bar candle touching the support level and getting the rejection, and then we see so good bullish momentum.

Below is the chart of USDCAD 1hr, market getting a rejection from the resistance level.

Pin Bar Pattern + Bollinger Bands

We are already familiar with one of the famous indicator called the Bollinger band that is used to measure the volatility of the market. We will now use a pin bar with the Bollinger band and understand how we can find some good trades opportunities.

The below chart is USDCAD 1Hr time frame over here. We can see that the market has not pierced the lower band since a long time as mostly the price is between the upper and the lower band. Moving forward, when the candles come close to the lower band, we see a pin bar occurring after the market gets rejection. After the formation of a pin bar candle, we can see the market getting the buying momentum, and it becomes bullish.

Trading With The Confluence Level

As from the above strategies, we are clear how the market behaves when a pin bar occurs at strong support and resistance level and the extreme level of Bollinger band. Now we will see what happens when a pin bar occurs at confluence level. A confluence level is an area that is on the radar of many traders, and many technical indicators generate the same signal. This trading concept is used by price action traders to filter their entry points and spot high probability signals in the market.

The below example is the pin bar forming at the extreme lower band and a strong support level. We can see that as the market reaches the support level, the bodies of the candles get weaker and smaller, forming longer wicks. Also, the pin bar pierces the lower band near that support level giving us a better signal for a buy.

Talking about the entry and exit points, our entry will be the point when the next candle crosses the high of the pin bar candle. As we see, it is a bullish pin bar; we can be sure that our entry is good if it crosses the high with good momentum. Our exit here will be the next strong resistance level. If you use a trailing stop loss, then we can move the stop loss to breakeven and be in the trade as long as you see the higher high higher low as, after a trend reversal, the candles move very fast and gives more profit and risk to reward ratio.

Conclusion

Trading with a pin bar candle has been proven to be one of the most effective trading strategies. As we saw, we must have a watch on all the candles when it approaches a confluence level because a single candlestick will not give us much information about what market is going to do next. The reliability of these candles is more with the higher time frame as it omits the noises on the chart, and we can have a clear picture. If you are a day trader, then you can 30min or 1hr time frame for executing the trade. Cheers!

Categories
Forex Basic Strategies

Making Consistent Profits with ’10 Pips A Day’ Forex Strategy

Introduction

There is a lot of buzz in the Forex industry about the ten-pip a day strategy. We have seen both experienced and novice traders getting excited about this strategy. So we decided to talk in detail about this topic in today’s article. Some expert traders believe that it’s not possible to make ten-pip consistently in the market, while many others say it is possible.

In reality, it entirely depends on the person’s trading skills, mindset, and experience. Traders need to adapt themselves to the market situations to be successful. Making ten-pip a day is a great way to accumulate wealth in the Forex market, and it is easily possible. All we need is to master our skills to the point where we exactly know when to take a trade and when not to.

Statistics say that it’s not easy to make consistent money in the Forex market, and the losses are a part of the game. This is true to an extent, but if we practice this strategy enough on a simulator, we can easily make ten pips a day no matter what. In this article, let’s understand how to make ten pips per day in the Forex market by using five different buy and sell examples of five trading days in a week.

Trading Strategy For Making 10 Pips A Day

’10 Pips A Day’ – The idea behind this term is to stop trading for the day right after making ten pips that day. Also, it is up to you to follow this idea or not. You can stop trading after making ten pips, or you can ignore that and go for 20, 30, or even 100 pips a day according to the market situation.

But only go ahead if you are 100% confident about the markets. In case of any tiny bit of uncertainty, make sure to exit right after you make ten pips. One critical aspect of this strategy is selecting the currency pairs. One must be professional enough to understand the market situations and pick the pairs where there is a minimum potential of making ten pip profits.

Pairing The Bollinger Bands With The Stochastic Indicator

Rules For Going Long
  1. The market must be in a strong uptrend.
  2. Wait for the price action to slowdown at the lower Bollinger Band.
  3. Let the Stochastic Indicator reverse at the oversold area.
  4. Only go long if the above two rules are satisfied. Also, consider the momentum of the price.
  5. Place the stop-loss just below the lower Bollinger Bands.

Now, to understand how this works, we have taken five different trades for five trading days in the last week of Feb 2020 and have generated 10, 20, and 30 pips in the market successfully. According to this strategy, conservative traders must stop trading after making ten pips for that trading day. But, if you are an aggressive trader, go ahead for bigger targets. Let’s get into the examples.

Monday Trade

The below chart represents a buy trade in EUR/CAD Forex pair. When all the rules mentioned above are met, we took a long position in the New York Session on 24th Feb 2020. Our stop-loss is placed right below the lower Bollinger Band.

We have gone for three different targets according to the market situations and predominant S&R levels. As mentioned, exit the trade as soon as you make ten pips if you are a conservative trader.

Tuesday Trade

For the second day, we have picked the EUR/AUD Forex pair as we identified some potential market moves. We have gone long on this pair in the New York session on 25TH Feb 2020. We can clearly see both the indicators indicating a clear buy signal.

Here, we have gone for the third target and exited the trade as soon as we made 30 pips.

Wednesday Trade

Our third trade was in the EUR/CAD Forex currency pair in the Asian session on 26th Feb 2020. When prices hit the lower Bollinger bands, and the Stochastic indicated the oversold market conditions, we went long on this currency pair.

We would have exited the trade at ten pips, but the market started printing continuous bullish candles, which made us wait for the prices to hit the third target.

Thursday Trade

On the 4th day (27th Feb 2020), we took a long position in the AUD/NZD Forex pair. The entry was at the point where the prices touched the lower Bollinger Band, and the stop-loss is placed just below the recent low.

Since the higher highs were getting continuously printed, we went for the third target and exited the trade as soon as we made 30 pips.

Friday Trade

For the Friday trade, we chose the AUD/NZD Forex pair. We went long in the Asian session on 28th Feb 2020. When both the indicators lined up in one direction, it is a clear indication that the sellers have given up, and now it’s time for buyers to lead the market.

We had exited at the third target even when the market was moving up north.

 Rules For Going Short
  1. The market must be in a strong downtrend.
  2. Wait for the price action to slowdown at the upper Bollinger Band.
  3. Let the Stochastic Indicator reverse at the overbought area.
  4. Only go short if the above two rules are satisfied. Also, consider the momentum of the price.
  5. Place the stop-loss just above the upper Bollinger Band.

Monday Trade

The below chart represents the first sell trade we took in the NZD/JPY Forex pair on the 24th Feb 2020. We went short when the price action hit the upper Bollinger band, and the Stochastic indicated the overbought conditions.

The stop-loss is placed just above the upper Bollinger Band. We have gone for the third target, and the market printed a brand new lower low.

Tuesday Trade

The below image represents the USD/CHF Forex pair. This pair was in an overall downtrend, and on 25th Feb 2020, we have activated the sell trade right after our sell criteria is met.

We can see the market reaching all of our targets in just a couple of hours.

Wednesday Trade

For the third day, we have chosen the USD/CHF Forex pair to identify the sell opportunities on 26th Feb 2020. The entry was at the point where the price action touched the upper Bollinger band, and the stop-loss was just above the upper band.

The reason we place the stop-loss there is because of the bands of the indicator act as a dynamic support resistance level to the price action.

Thursday Trade

The 4th trade belongs to the CAD/JPY Forex pair, and we have activated our sell trades on 27th Feb 2020. We took sell when both of the indicators lined up in one direction, and we booked profit at the third target.

Friday Trade

For the last sell trade, we chose CAD/JPY currency pair. Sell trade was activated on Friday, 28th Feb, in the Asian session. When the Stochastic reached the overbought area and gave a sharp reversal, we saw the price action hitting the upper Bollinger band. This essentially means that the market is ready to go down.

Bottom Line

In almost all of the cases, we have gone for the third target only and make 30 pips profits. The reason behind this is to show you how reliable is the Bollinger Band and Stochastic combination. We are saying this time, and again, please stop trading after making ten pips per day if you are a conservative novice trader. But if you are experienced enough to predict the market, milk as much as you can depending on the market conditions. All the best.

Categories
Forex Basic Strategies

How To Trade The ‘Three Black Crows’ Pattern Like A Professional Forex Trader

Introduction

Three Black Crows is a bearish candlestick pattern that consists of three consecutive red candles. This is a visual pattern and can be identified easily on the price action charts. The Three Black Crows pattern essentially indicates a shift in control from bulls to bears. In the book known as ‘Candlestick Trading Technique,’ Steve Nison says that this pattern is one of the most useful ones for longer-term trades.

In an uptrend, this pattern consists of three consecutive bear candles that have large bodies of roughly the same size. The Three Crows pattern confirms the strength of the sellers.

Each candle should be open and close lower than the previous candle.

Each candle should mark a successive decline in price action and should not have long shadows or wicks. Using this trading pattern in conjunction with other technical indicators will enhance the probability of winning the trade.

Trading Strategies With Three Black Crows Pattern

TBC Pattern + Bollinger Bands

In this strategy, we have paired the Three Black Crows pattern with the Bollinger Bands to identify accurate trading signals. The Bollinger Bands indicator is developed by the technical trader John Bollinger. It consists of a centerline and two bands above and below the price chart. The bands of the indicator contract and expand according to the different market conditions. In a volatile market, the bands of the indicator expand and in a dying market condition the bands’ contract.

Step 1 – First of all, find the Three Black Crows Pattern in an uptrend.

Step 2 – Take a sell-entry when the Three Black Crows pattern hit the upper band of the Bollinger Bands Indicator.

In the above chart of the NZD/USD forex chart, we can see that the pair was in an overall uptrend. Around the 4th of November, price action prints Three Black Crows, which is an initial clue to go short. Furthermore, price action also respects the Bollinger upper band, which is a sign to go short on this pair.

Step 3 – Stop-loss & Take Profit

Placing accurate Stop loss is one of the most critical aspects of successful trading. Some of the novice traders never use stop loss, and it is the biggest mistake they do. We always suggest the traders use the stop-loss order in every trade they take. If you have the fear that your trade might hit the stop loss, then use a deeper stop loss and expect only 1R trades. If you are an aggressive trader, then stop loss above the Bollinger bands is the safest idea.

The basic idea most of the traders have is to exit their positions when price action hits the lower band of the Bollinger band indicator. If you follow this strategy, there will be fewer chances of you making money. Because price action moves in cycles, and prices often hit the upper and lower bands. We suggest you always use the higher timeframe major support area for booking your profits. You can also close your position when the market prints the Three White Soldiers pattern, which is quite the opposite of the Three Black Crows pattern.

In the above example, we have closed our full position when the market reached a previous major support area. Most of the time, price action always reacts from a significant support area. In our case, when we closed our position (yellow dotted line), price action immediately changed its direction.

TBC Pattern + MACD Indicator

In this strategy, let’s learn how to trade the Three Black Crows pattern by combining it with the MACD indicator to identify reliable trading signals. MACD is a trend following indicator, and it stands for Moving Average Convergence and Divergence. This indicator consists of a histogram, moving averages, and a centerline. Traders use the MACD moving average crossovers to identify the trading signals. When the moving averages of the indicator go above the zero-line, it indicates a buy signal. Likewise, when it goes below the zero-line, it indicates the sell signal.

Step 1 – First of all, find the Three Black Crows Pattern in an uptrend.

Step 2 – The strategy is this – when market prints the Three Black Crows pattern, see if there is a crossover happening on the MACD indicator at the overbought area. If there is a crossover, it is a clear sign to go short in any underlying currency pair and vice-versa to go long.

In the image below, GBP/CAD was in an overall uptrend. When price action prints the Three Black Crows pattern, it indicates the ongoing trend reversal in the near future. Furthermore, when crossover happened on MACD, it’s a clear signal that the GBP/CAD is ready to start a downtrend afresh. After our entry, price held for a bit at the support area and dropped to print a brand new lower low.

Step 3 – Stop-loss & Take Profit

Put the stop loss above the first candle of the Three Black Crows pattern and close your whole position when price action reached a significant support area.

As you can see in the image below, we closed our full position at the major support area. Overall it was not a smooth ride, but our position didn’t go into loss even for a single time. Traders can also close their positions according to market situations, or according to their trading style.

Bottom Line

Three Black Crows pattern is one of the most famous and popular trading patterns out there. This pattern can be used to identify the trend reversals in an upward market. Whenever you find a Three Black Crows pattern on the price chart, we suggest you sit up straight and understand if this pattern has the potential to reverse the market or not. It is always advisable to pair this pattern with other trading tools to confirm the indication. Traders can also use this pattern to enter or exit a trade. Some traders use this pattern with the combination of other trading tools in order to close their full position. The end goal is to use this pattern to identify trading opportunities and trend reversals more accurately. Cheers!

Categories
Forex Basic Strategies

Trading With The Bollinger Band %B Indicator

Introduction

If you have experience trading with the Bollinger Bands indicator, you will find it easy to trade with the Bollinger Band %B indicator. The only difference is that, in this indicator, you can identify the relationship between the price and the bands with at most clarity.

What is the Bollinger Band %B indicator?

It is basically a technical indicator that quantifies the price of an asset with respect to the upper and lower limits of Bollinger Bands. We have derived 6 relations between the price and the indicator.

  • The %B is at zero when the currency pair is at the lower band.
  • % B will be at 100 when the currency pair is at the upper band.
  • The indicator is above 100 when the price of the currency pair above the upper band.
  • It is below zero when the price goes below the lower band.
  • The %B is above 50 when the price goes above the middle band.
  • And it is below 50 when the price goes below the middle band.

The Bollinger band %B uses the 20-day simple moving average (SMA) as the default parameter, just like the Bollinger Bands. This indicator is available on most of the trading platforms and terminals.

Bollinger Band %B formula

%B = (Price – Lower Band) / (Upper Band – Lower band)

Things to know

Before understanding the strategy, it is necessary to know a few things about the indicator as these concepts will be used in every step of the strategy. Below is the chart of a forex pair with the Bollinger Band %B indicator plotted to it.

  • The upper dashed line represents the 100% level of the %B indicator also known as the upper band.
  • The lower dashed line represents the 0% level also known as the lower band of the indicator.
  • The area in between the two dashed lines is known as the middle band.

These bands help us in identifying different trading opportunities. Hence, one needs to know about it before knowing the strategy.

The Strategy

Step 1: Identify the major trend

To identify the overall trend of the market, the trader needs to shrink the chart and determine the trend.

An uptrend is defined as a series of higher highs and higher lows, while a downtrend is defined as a series of lower lows and lower highs. In this strategy, we have taken the example of a downtrend, as shown in the figure. One can also see lower lows and lower highs in the above chart.

Let us see how the strategy works.

Step 2: Find the price where %B is above 100 or below 0 in the currency pair.

In this step, we are looking for the price where the indicator is above the upper band or below the lower band. This extreme price action is said to continue for long after taking a suitable entry.

A sell setup is formed when the indicator crosses below the lower band, and a buy setup is formed when the indicator crosses above the upper band. This strategy is almost reverse of other strategies (as oversold indicates buying in other strategies).

The above chart shows the crossing of the indicator below the lower band, which is apt for a sell trade. Just because the price is below the dashed line, we cannot take an entry immediately.

The next step is to find a pullback and then make an entry. We will then see how and where to take profits.

Step 3: Take an entry only at a suitable pullback.

By suitable pullback, we mean the opposite color candles should not be swift candles and should not make higher highs. If this happens, the current trend can be weak and may not sustain. The %B indicator can also assist us with the same, as the indicator should move slowly after crossing the lower band. If the indicator reacts and moves fast, it means the pullback is strong and could also result in a reversal. Finally, an entry can be taken after the close of at least two pullback candles.

The below figure explains the above paragraph clearly.

Step 4: Determining how to take profit

In this strategy, we follow a rule-based system for making profits which are again based on our indicator. A trader needs to cover his position after the indicator crosses the lower band once again and goes above the dashed line. This style of taking profit is different than in other strategies where it is based on a fixed percentage. This way of taking profits ensures that a trader is trading based on rules and guidelines which is a disciplined approach.

The below figure explains how profit is taken and the position is covered.

When the indicator goes above the 0% (lower band) level after crossing below, it means profit can be taken now and the trade can be closed.

Step 5: Place a protective stop

Stop-loss is a mandatory and essential part of risk management, hence it needs to determined before entering a trade. For this strategy, stop-loss is placed above the high of the pullback which makes it an optimal place. The stop-loss, in this case, is very small which increases the risk to reward ratio (RR) considerably.

Here is exactly where it is recommended to put the stop loss.

The final trade setup would look something like this 👇

This results in a minimum of 2:1 RRR.

Final words

This is one of the easiest strategies which can be learned by new and experienced traders. It makes use of simple Bollinger bands added with a %B indicator. This indicator can also be combined with several other technical indicators and trading systems, but this alone, too, has a very good level of accuracy.  Now, we have to follow the money management principles to take the best trades and make huge profits from the same strategy. For this, you can also refer to our money management article series, which talks on various risk management topics. Cheers!

Categories
Forex Basic Strategies

Understanding The Volatility Breakout Strategy

Introduction

Breakout trading is one of the most common and popular strategies among traders across the world. In this article, we have added a powerful concept to this strategy, which is volatility. In a volatility breakout, we determine the movement of prices just before the breakout and also their reaction at important support and resistance levels. After analyzing the market, we will decide which breakout is safe to trade and which is not.

Volatility cycles

We have built the volatility breakout strategy in a very simple way. The principle of this strategy is that, when the market moves from one level to another (support to resistance or resistance to support) with strong momentum, the momentum is said to continue further. The other characteristic of the price is that it moves from periods of sideways movement (consolidation) and vertical movement (trend).

Price breaking out of a consolidation prompts us to believe that price will continue in that direction, which might last for one day, one week, or one month. The market after trending downwards gets choppy and reduces directional movement. Traders can use technical indicators like Bollinger Bands, which helps them to determine the strength of the breakout. Breakouts that happen with low volatility are ‘real’ breakouts; on the contrary, breakouts with high volatility can result in a false breakout. We shall look at each case in detail in the next sections of the article.


High volatility breakout

When we are talking about volatility, we mean the choppiness of the price, i.e., the back and forth movement of price. There are traders who like this kind of volatility, as they feel price moves very fast from one point to another. But this isn’t necessarily true in case of a breakout. If you don’t have the required strength in a breakout, you could be trouble.

In the above chart, we see that the price has been in a range for a long time. This means a breakout could happen anytime. Much later, the price tried to break above resistance and stayed there for quite a long time. The price is just chopping around without moving in any particular direction eminently. All these are indications that the breakout, if it happens, will not sustain. Hence, one needs to be extra cautious before going ‘long’ after the breakout.

There are many traders who are willing to take the risk and want to try their luck in such conditions. In that case, after you buy the forex pair, always keep a tight stop loss. The reason why we are suggesting a tight stop loss is that there are high chances for the trade will not work in your favor, and you should avoid making a big loss in that trade. The setup would look like something below.

If the trade works, it can give a decent profit with risk to reward of more than 1.5, which is really good. Again this strategy is only for aggressive traders.

Low volatility breakout    

When a breakout happens with a lot more strength, it is said to be a low volatility breakout. The price here does not face much of hurdle and crosses the barrier with ease.

As you can see in the above chart, the price does not halt at resistance, and the breaks out smoothly, which is exactly how a breakout should be. After that, you can see that the breakout happens successfully, and the price continues to move higher. When such type of volatility comes into notice, we will see a higher number of traders being a part of this rally because they are relatively risk-free trades. This strategy is recommended by us to all types of traders, irrespective of their risk appetite. The next question is where to take profit and put a protective stop.

Stop-loss can be placed below the higher low, which will be formed near the resistance, and profit should be booked at a price which will result in a risk to reward ratio of 1:2. Some money management rules should also be applied while booking profits. The setup would look something like this.

Measuring volatility

Since this strategy is mostly based on volatility, it is important to know how to measure volatility.

  • Bollinger bands are excellent volatility and trend indicators, but like all indicators, they are not perfect.
  • Average true range (ATR) measures the true range of the specified number of price bars, typically 14. ATR is a volatility measuring indicator and does not necessarily indicate a trend. We see a rise in ATR as the price moves from consolidation to a strong trend and a fall in ATR as market transitions from strong trend to choppiness.
  • ADX is also a prominent indicator that measures the strength of a trend based on highs and lows of the trend over a specified number of candles, again typically 14. When ADX rises, it indicates that the volatility has returned to the market, and you might want to use a strategy that fits that market condition.

Bottom line

The market does not always be in trending and consolidation phases, and we also have to learn to deal with different types of volatility. This is where most of the strategies can be used at their best, and using volatility indicators can help you trade more effectively. A breakout, when accompanied by the right amount of volatility, can be highly rewarding. Hence this is an important factor in any breakout trading system. Cheers!