Introduction
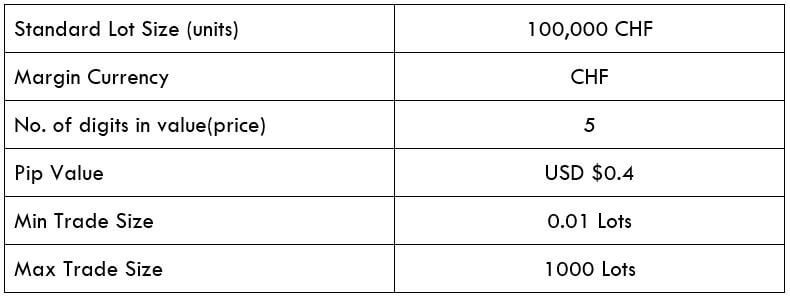
The original Connors & Raschke’s 80-20 Strategy is an intraday strategy that was published in Street Smarts by Larry Connors and Linda Raschke.
It is based on the Taylor Trading Technique, which is a manual for swing trading. Taylor’s method was the result of the observation that the markets move within a cycle that is made up of a buy day, a sell day, and a sell short day. That setup was further investigated by Steve Moore ar the Moore Research Center.
Mr. Moore focused on days that closed in the top 10% of the range for the day. Then, he checked on for the percent of time next day prices exceeded the previously established high, and, also, for the percentage of times it also closed higher.
His results showed that when prices closed in the top/bottom 10% of its range, it had an 80-90% chance of following-through the next session, but only 50% of them closed higher/lower. This fact implied an excellent possibility of reversal.
Derek Gibson, said Connors, found out that the market has an even higher chance of reversing if the set-up bar opened in the opposite end of the range. That is, a candlestick with short wicks and a large body. Therefore this pre-condition was added. To create more opportunities, they lowered the percent of the daily range from 90 to 80, because it didn’t affect the system’s profitability.
Long Setups
- Yesterday, the asset opened in the top 20% and closed in the lower 20% of its daily range.
- Today the market must trade at least 5-15 ticks below yesterday’s low. This is a guideline.
- An entry buy stop is then placed at yesterday’s low, once the trade is being filled, and an initial protective stop near the low extreme of today’s action.
Move the stop to lock in profits. This trade is a day trade only.
Short setups
- Yesterday the asset opened in the bottom 20% and closed in the higher 20% of its daily range.
- Today the market must trade at least 5-15 ticks above yesterday’s high This is a guideline.
- An entry sell stop is then placed at yesterday’s high, after being filled, and an initial protective stop near the upper extreme of today.
Move the stop to lock in profits. This trade is a day trade only.
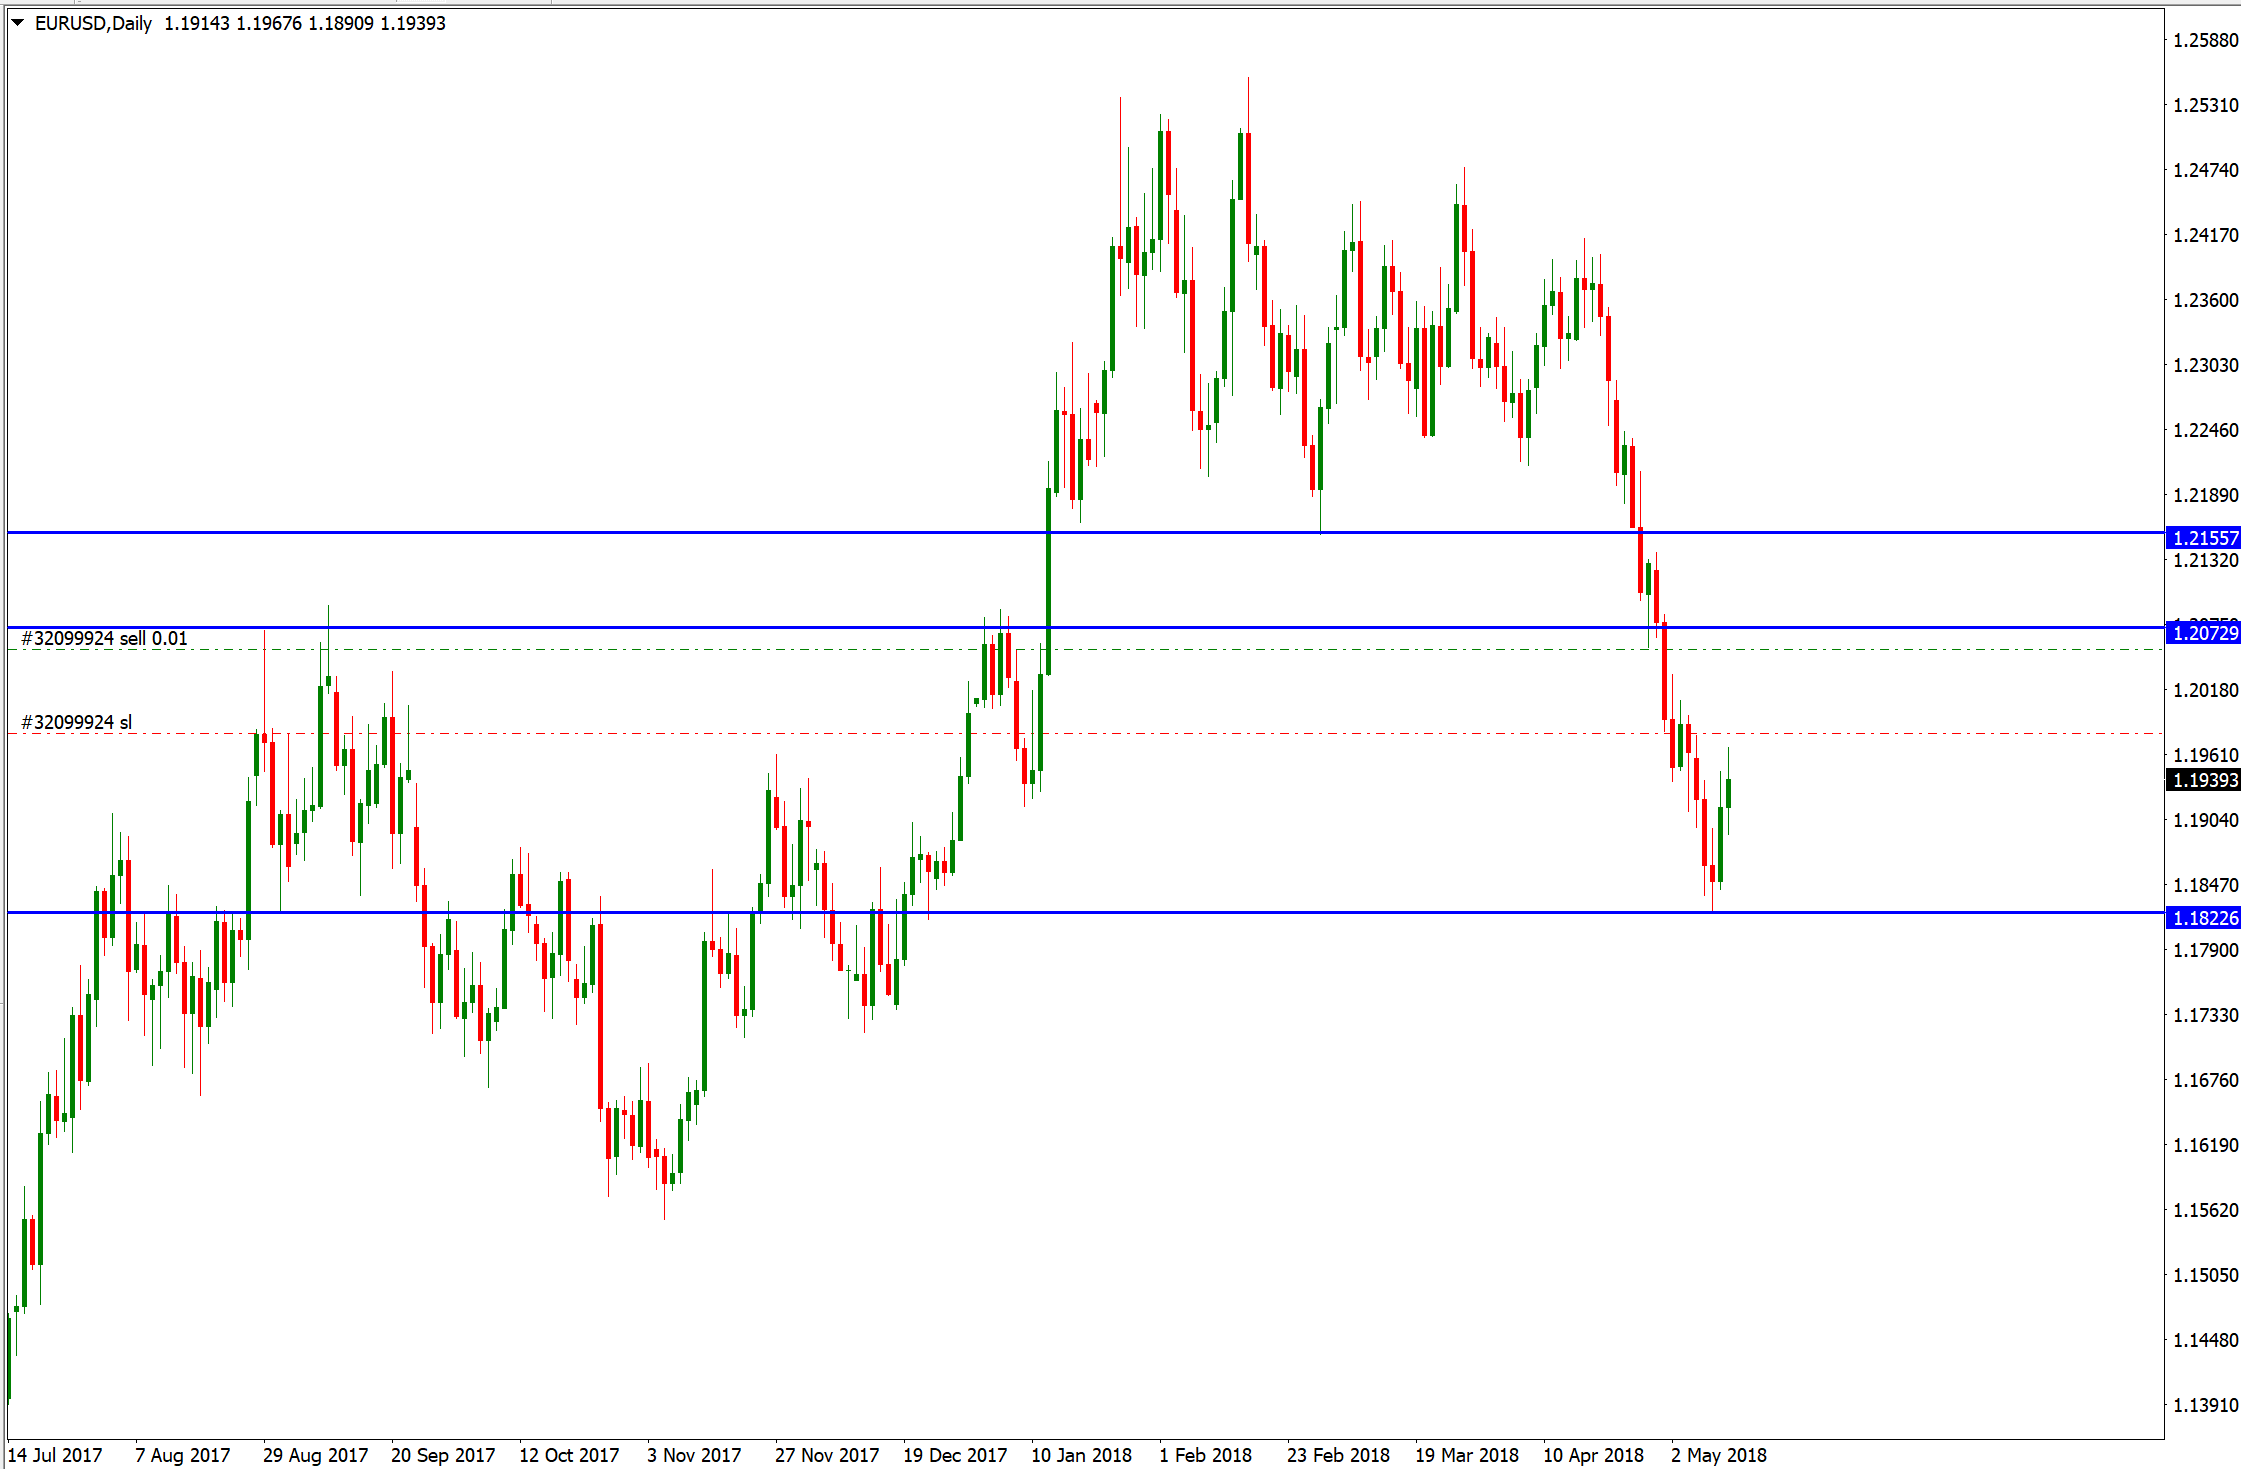
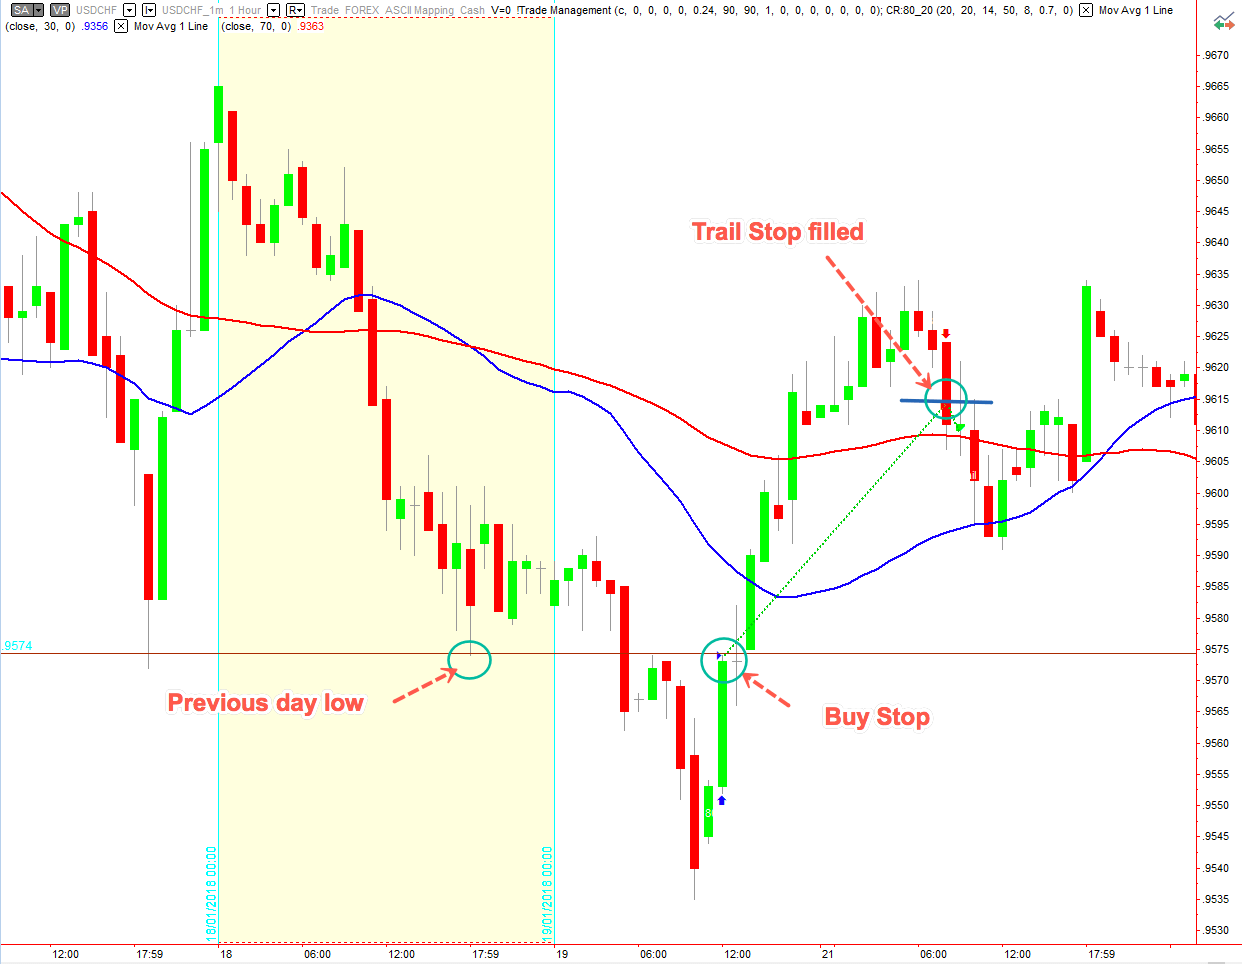
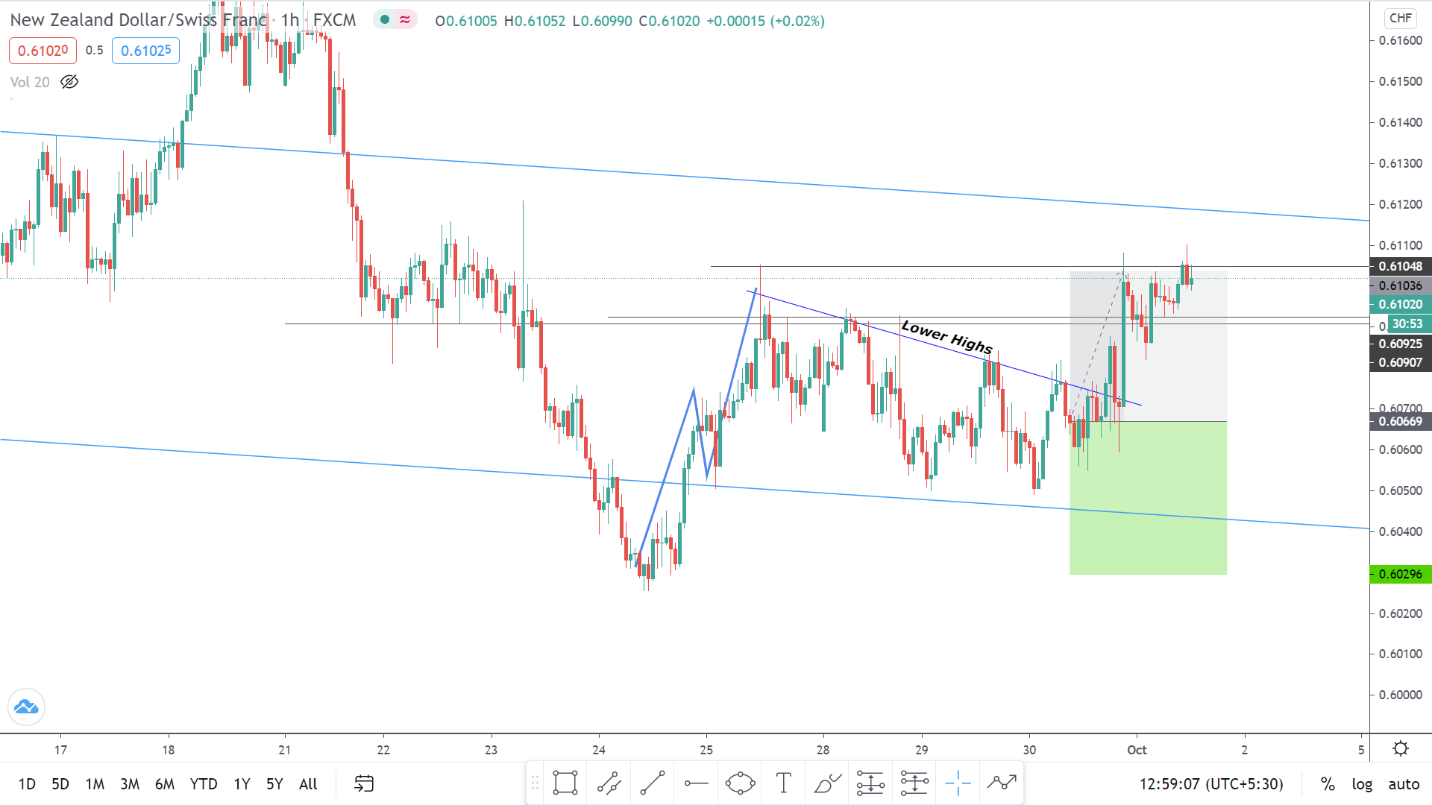
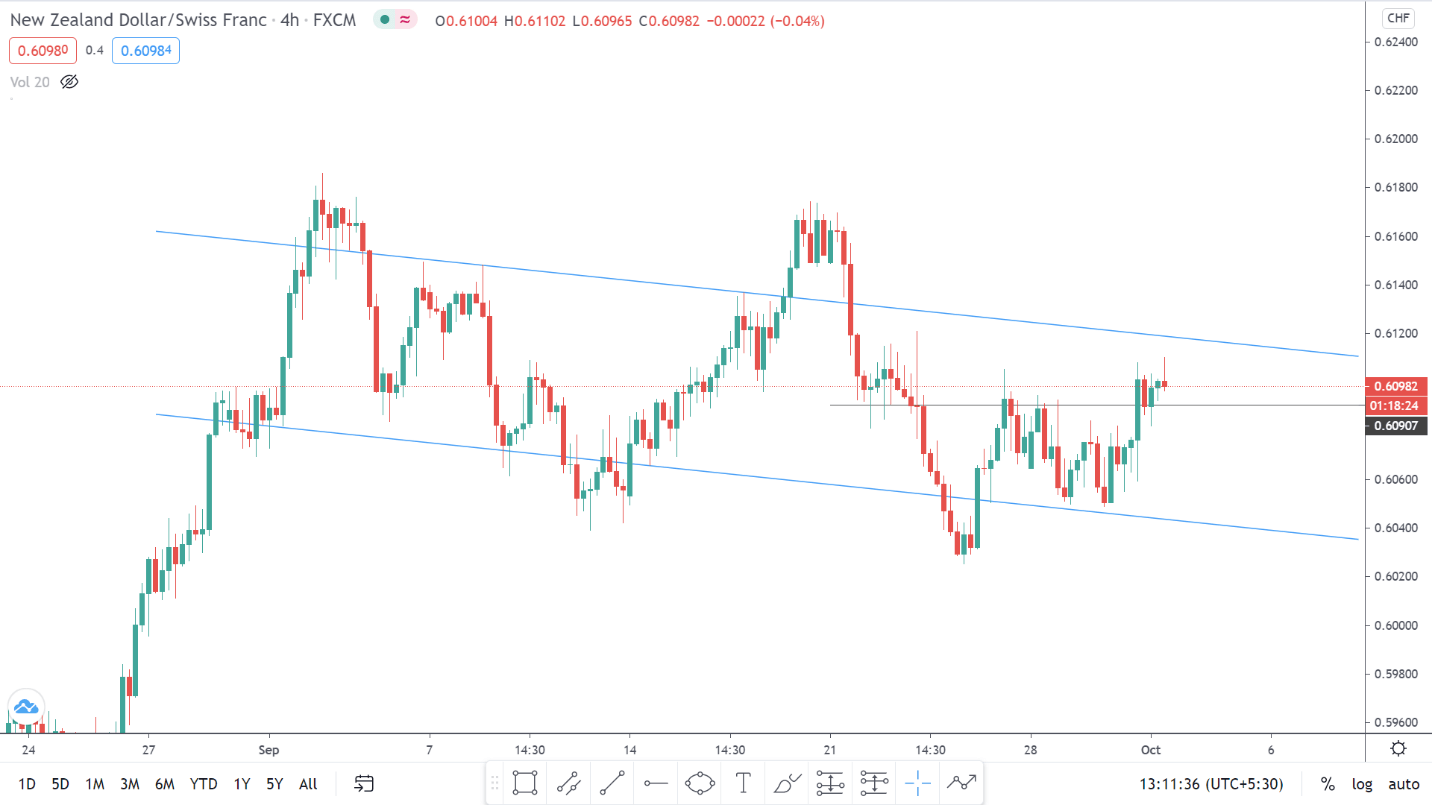
Example of a trade
Testing the Strategy
We tested this strategy using the backtesting capabilities of the Multicharts64 version 11 Platform.
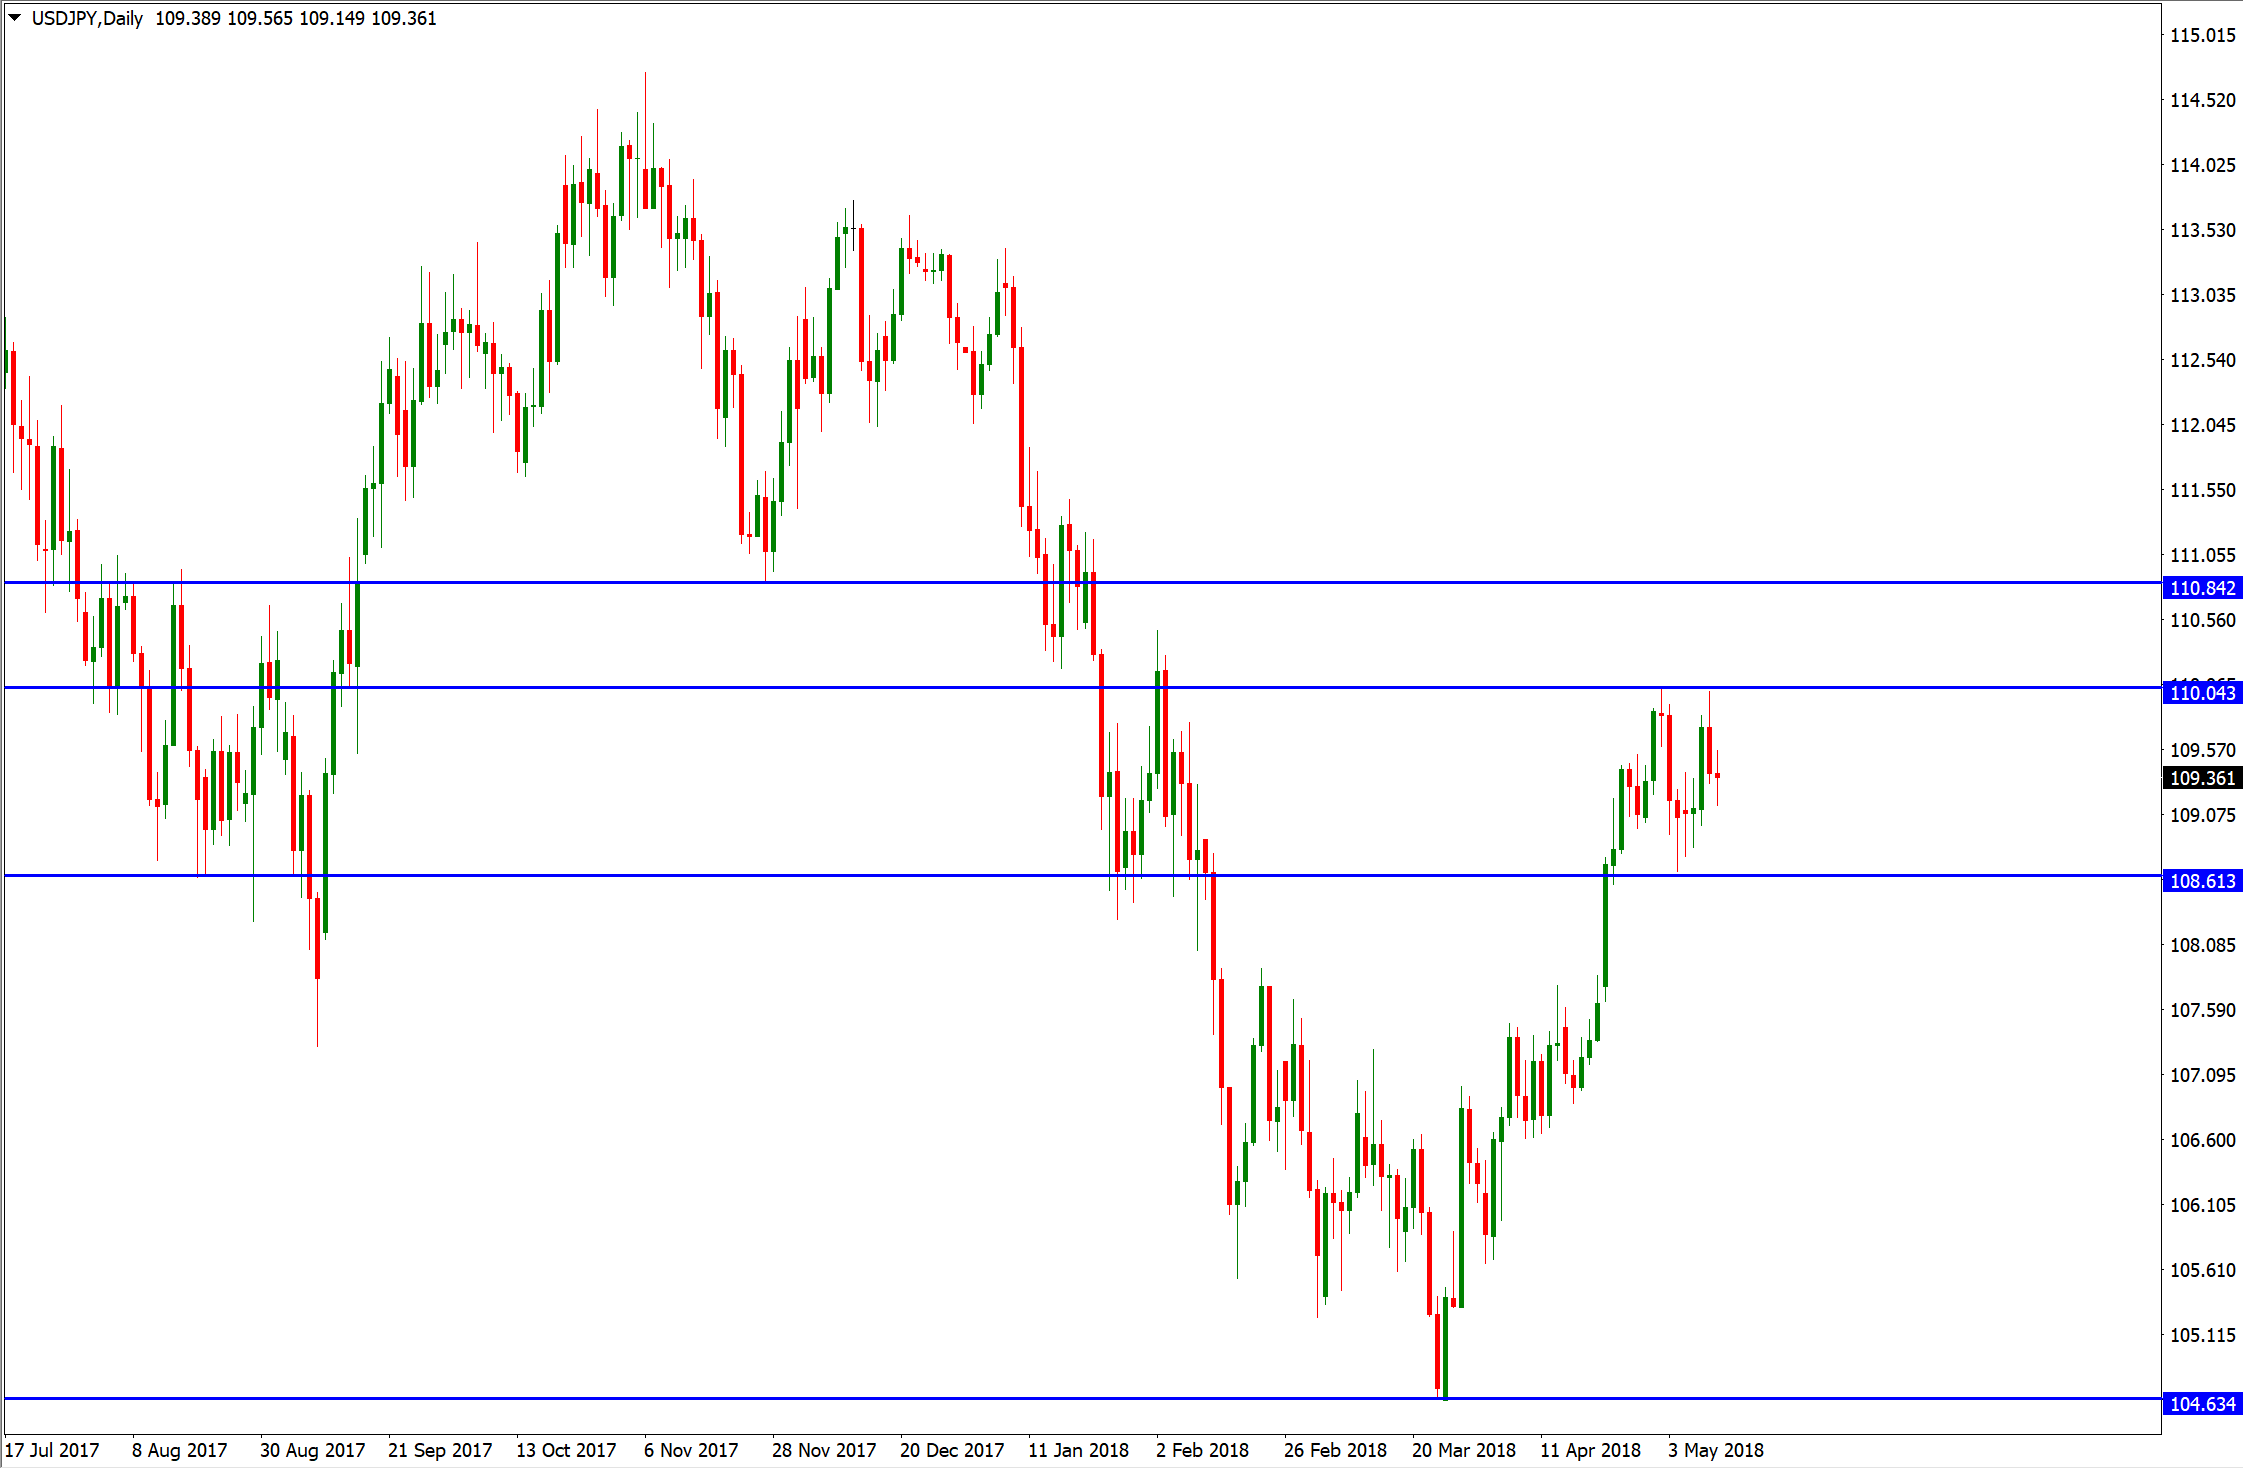
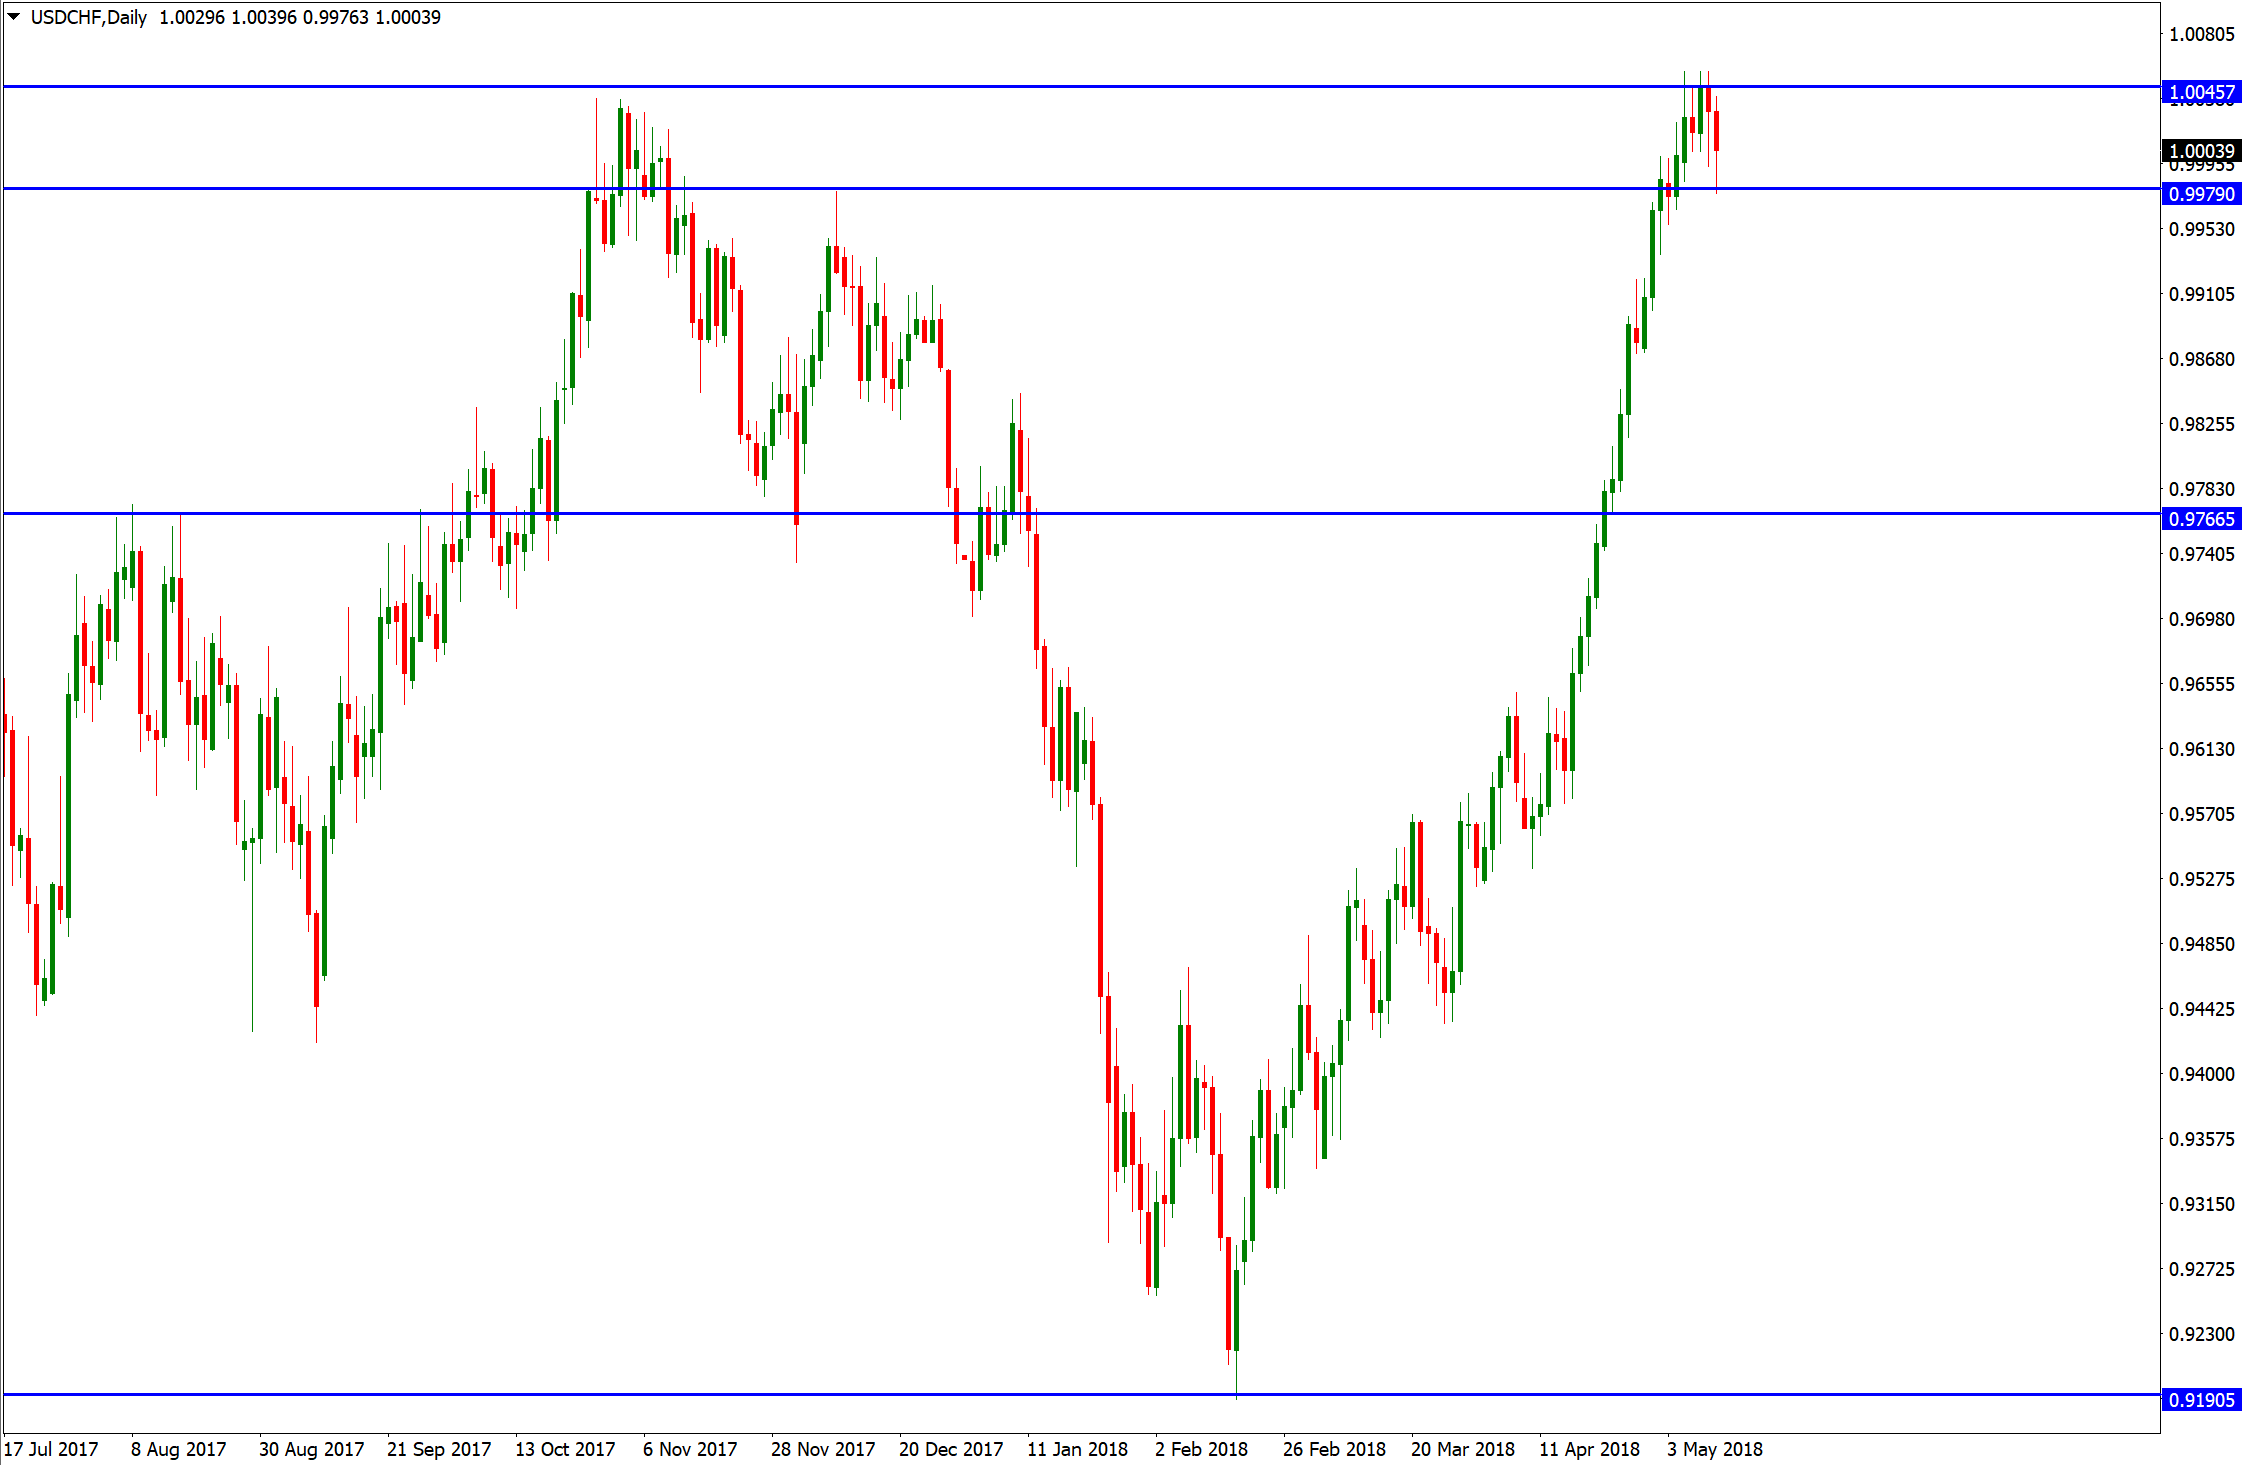
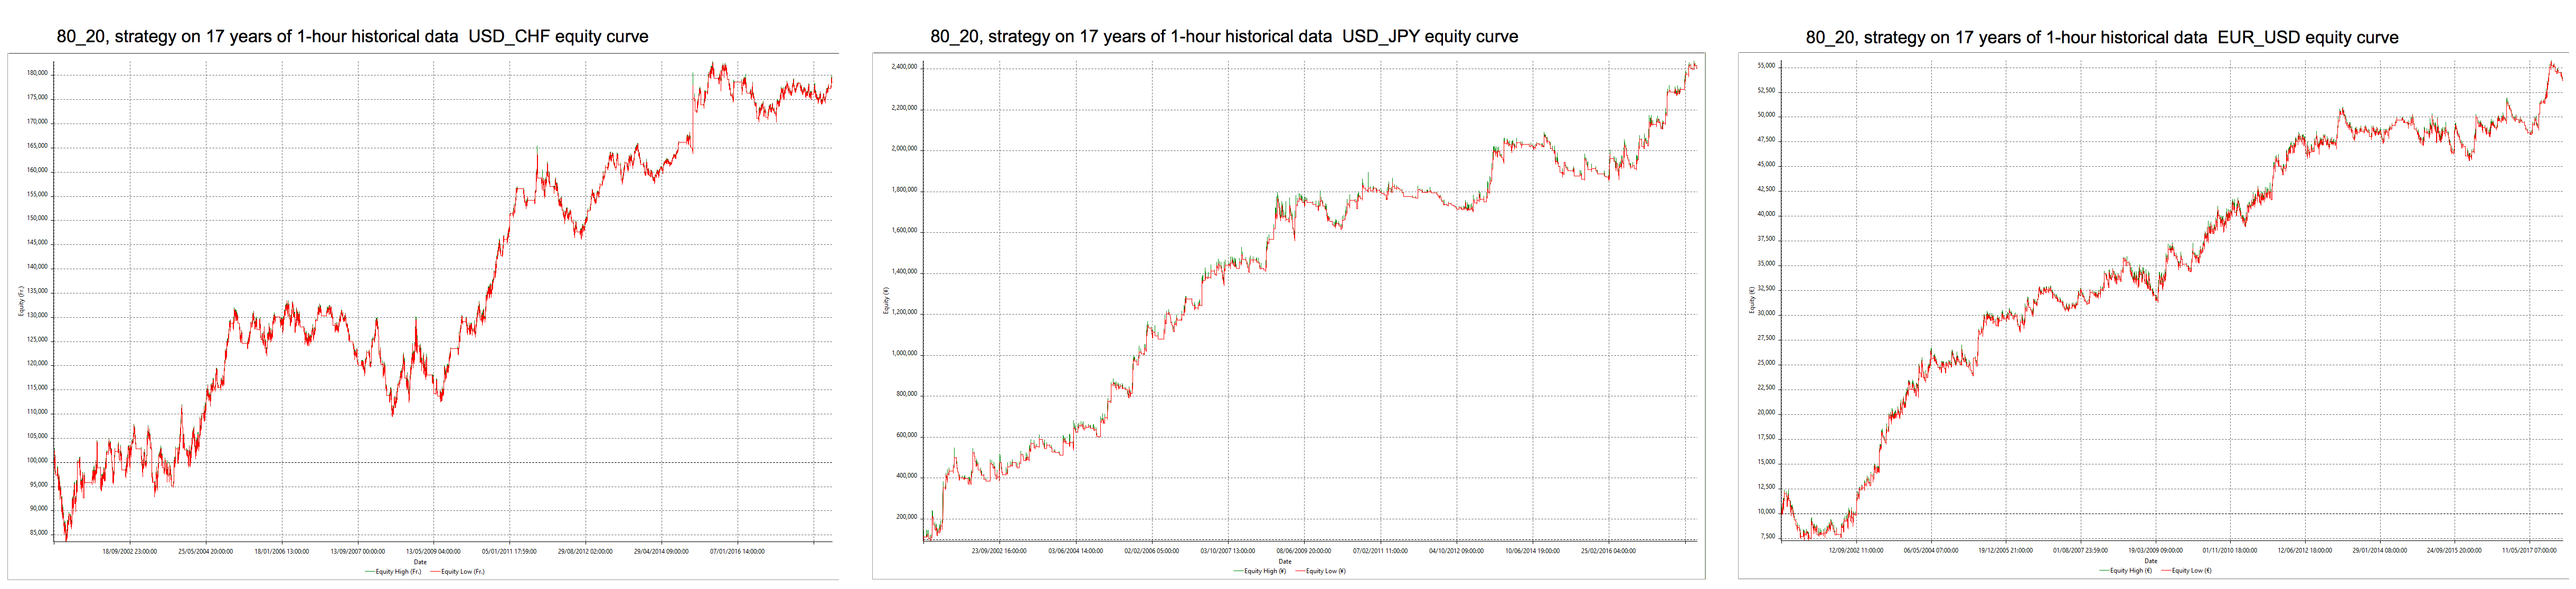
The naked strategy, as is, in EURUSD, USDGPY, and USDCHF over a range of 17 years, were positive in all cases. Below the equity curves for the three pairs:
Examining the parameter map
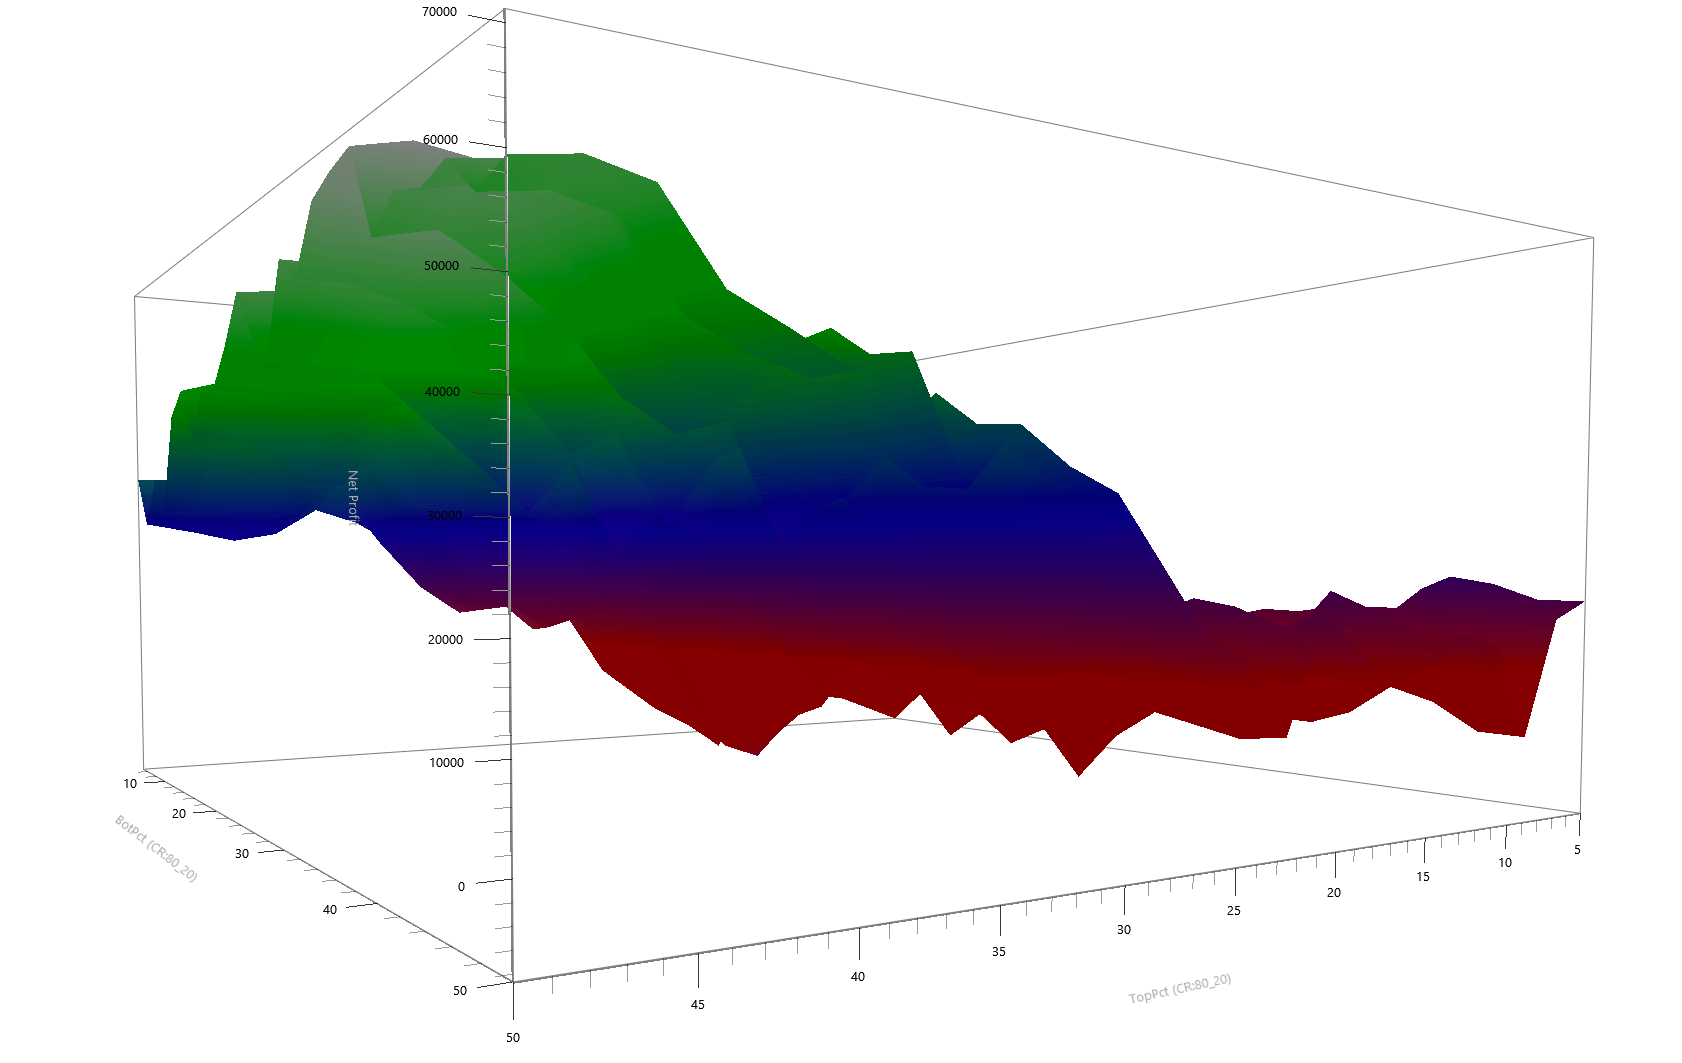
The figure above shows the parameter maps of the USD_CHF and the EUR_USD pairs. We see that the return of the strategy increases as the parameters move to the 50% level, meaning that the importance of the starting and ending point (Open to Close) in the previous candlestick is not essential. The critical fact is the next day’s break above(below) the previous highs(lows) and the subsequent return to that level (False Breakout).
Example of 50-50 System with optimized stops and targets on the EURUSD
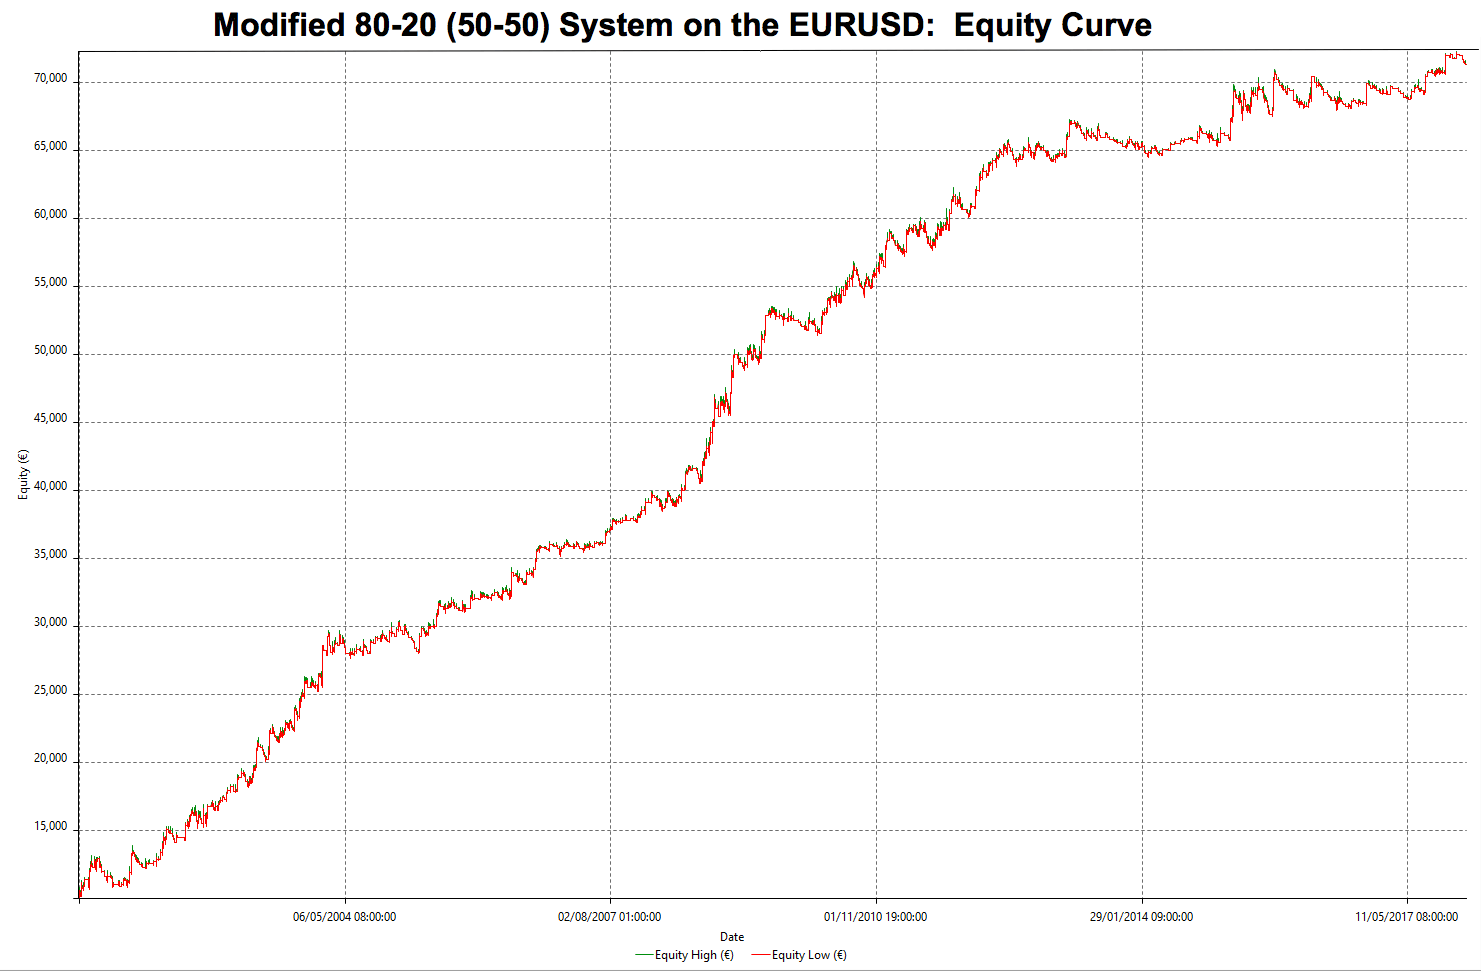
As we said, this is a 50-50 system, meaning that we don’t care in which part of the candle is the Open and Close. This is a simple false breakout system.
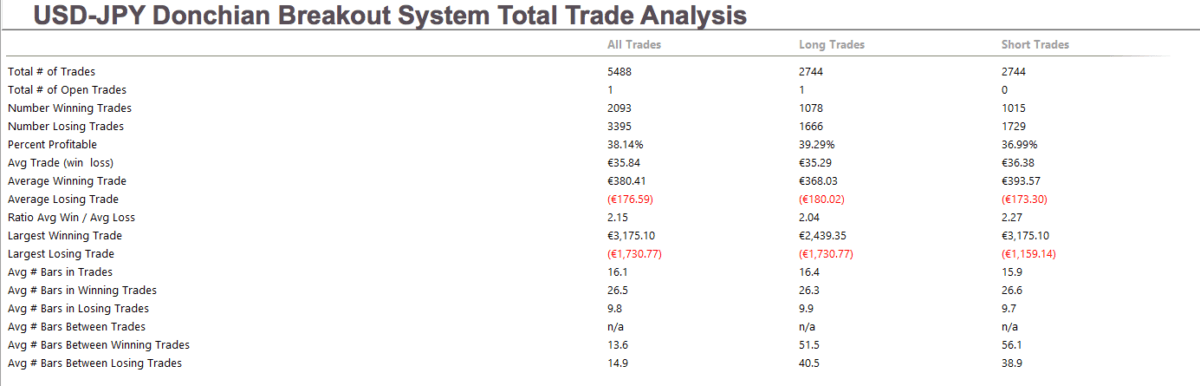
We see that the curve is quite good over its 17-year history. Starting with 10,000 dollars, the final equity reached $72,000, for a 6X profit figure.
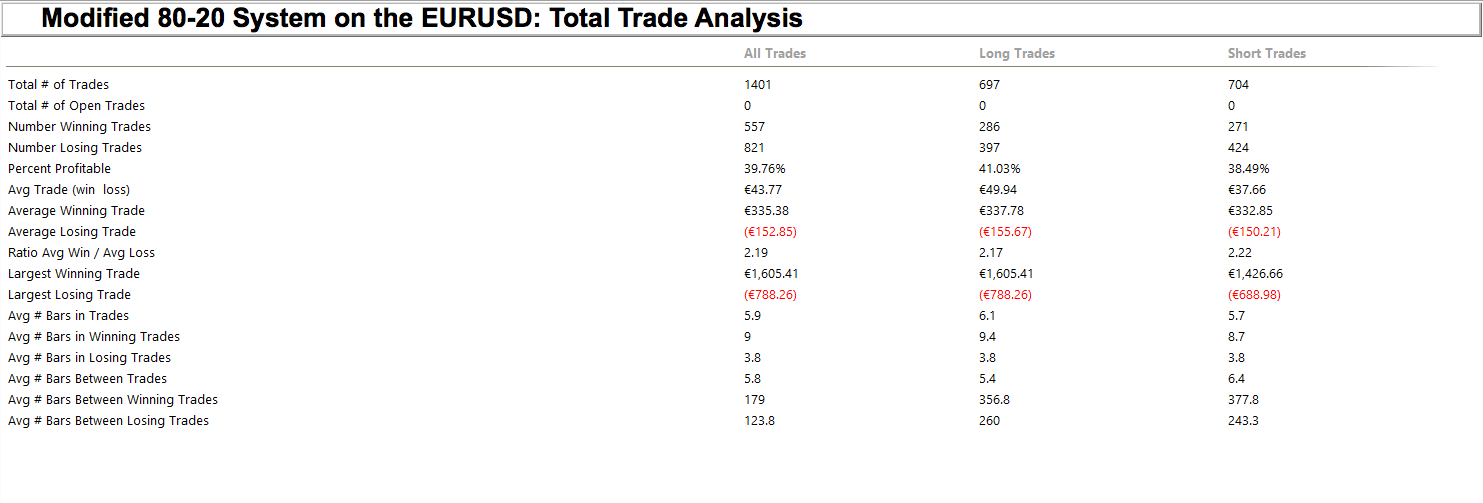
Looking at the Total Trade Analysis table, we can observe that this system is also robust, with almost 40% winners and an average Ratio Win to Average loss ( Reward/risk) of 2.19.
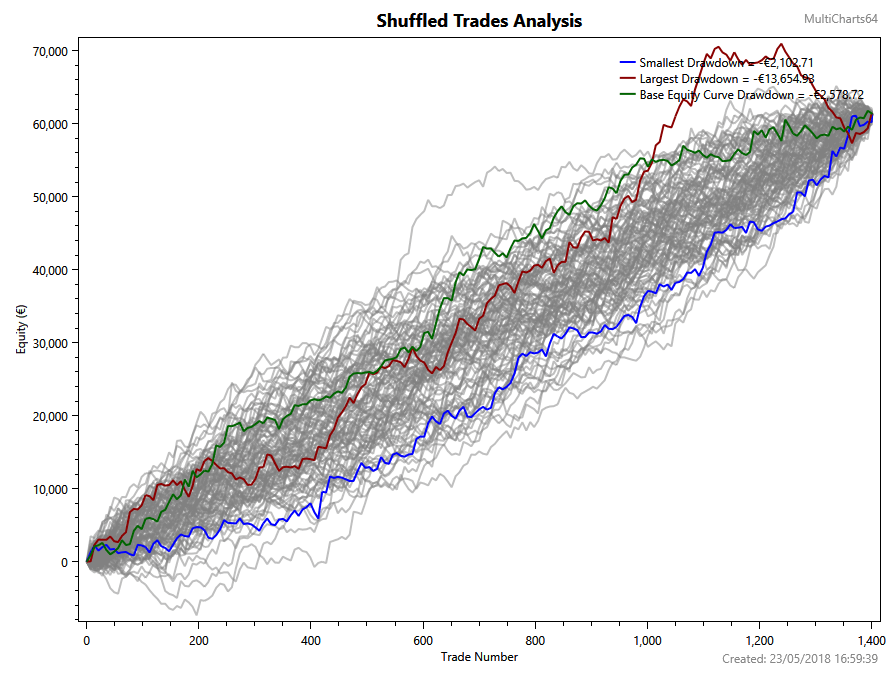
The shuffled Trades Analysis shows that the system is very reliable, with a likelihood of small drawdowns, depicting a max consecutive loss of 16 trades.
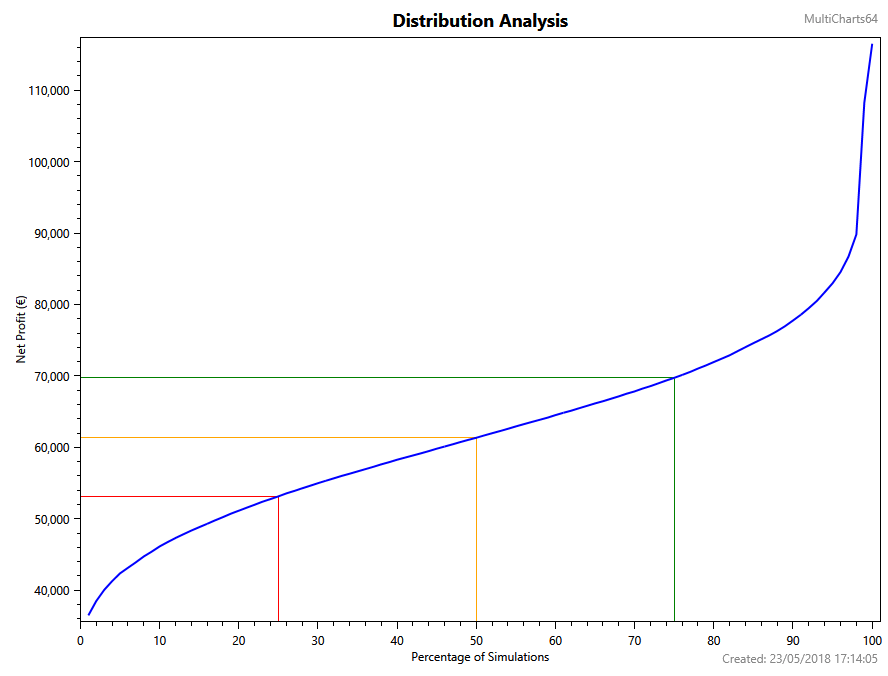
The Net Profit distribution Analysis shows that there is a 75% probability of getting a 5X equity profit over 16 years and a 25% probability of getting a 7X profit figure.
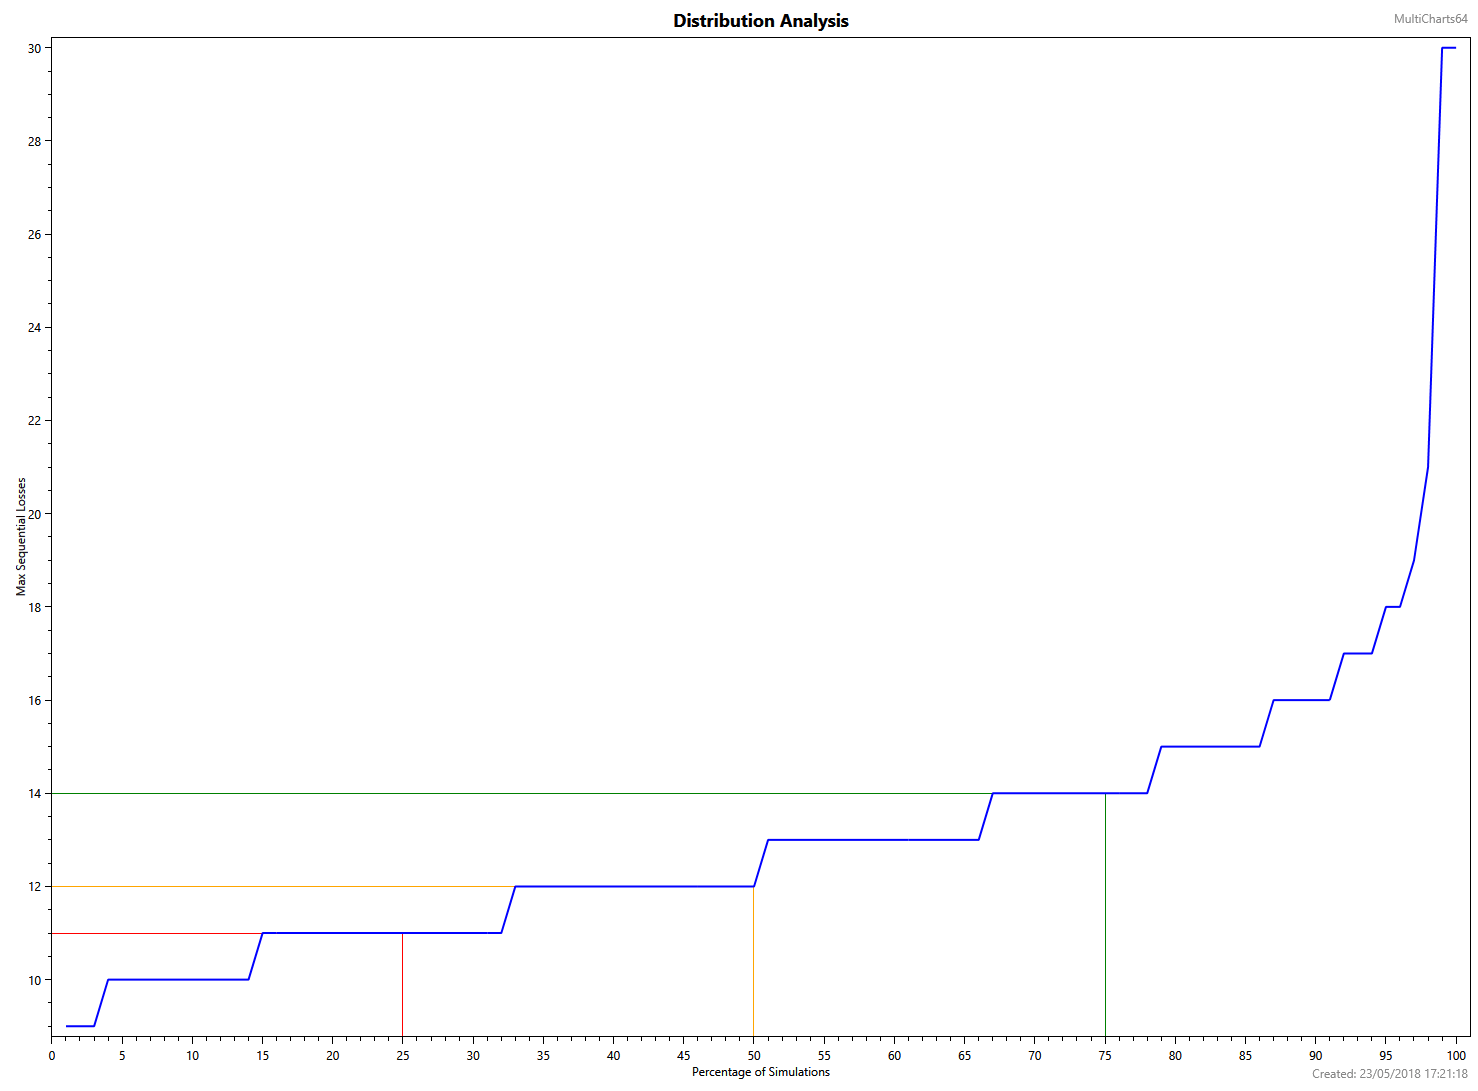
Above is the Max Consecutive Losing Streak analysis, which shows that there is less than 10% probability of ending above a 16 losing streak. Although you think that a 16-losing-streak is terrible, it is not, but we need to be prepared psychologically to endure it. This figure is the one needed to help us conservatively decide our risk strategy.
As I already mentioned in other strategy analyses, you, as a trader, need to decide which percent of your equity you can lose without losing your temper. Many don’t like to lose any amount so they shouldn’t trade, because losing streaks are part of the trading job. Many would say 10% while others 50%. That figure has a close relation to the rate of growth of your trading account because it will decide the size of your position.
And here it comes the way to do it. Once we know the distribution of drawdowns of our trading system, we, as traders, want to minimize the probabilities that a losing streak goes beyond our max drawdown figure. This is an approximation, but its good enough to allow us to decide the best position size for our risk tastes.
Let’s say we are an average-risk trader, and we will be upset if we lose ¼ of our account. Using this trading system, and admitting a 10% probability of error, we would choose 16 as the losing streak to compute our size per trade.
Therefore, we divide 25% equity drawdown by 16, which is 1.56%. In this case, we must trade using a 1.56% risk on every trade. That means that the cost of a trade computed by the distance from entry to stop-loss levels, multiplied by the dollar pip risk and by the number of contracts should be 1.56% of your current equity balance.
Let’s simplify it using elementary math:
Percent Risk (PR) = MaxDD / Max_losing_Streak
Dollar Risk = PR x Equity_Balance
Dollar Risk = (Entry-Stop) x PipCost x Nr_of_Contracts
Let’s call Entry-Stop, Pips. And NC the Number of Contracts. Then the equation is:
Dollar Risk = Pips x PipCost x NC
Let’s move the elements from this equation to compute the Nr of contracts.
NC = Dollar_Risk / (Pips x PipCost)
That’s all. Every trade will be different, and the distance in pips from entry to stop loss will be different, but we can compute the number of contracts quickly:
Let’s do an example. Our current balance is right now $12.000, and we want to enter a trade with 20 pips of risk, and our cost per pip is $10 per lot. Which is my optimal size?
Our Dollar Risk is 1.56% of $12,000 or $187
NC = 187 / (20 x 10) = 0.93 lots, or 93 micro-lots.
Computing the Performance of the System
Now we want to know how much on average are we going to get, monthly, from this system. That is easily computed using the numbers above. We know that this system’s history is 205 months long, and it had 1401 trades, which is seven trades per month on average. Evidently, this system trades very scarcely, but we can hold a basket of assets. Thus, If we manage to get a basket of 10 holdings, including pairs, crosses, indices, and metals, we could trade 70 times per month. And those trades will not overlap most of the time if the assets are chosen uncorrelated.
Based on our risk profile and the average Reward-to-risk ratio, we know that our average winning trade will be 2.2 times our average losing trade.
So,
AvgWin = 411
AvgLoss = 187
Our winning percentage is 40%, so our losing one is 60%
Then on a 10-asset basket, there will be 28 winners and 42 losers monthly, then:
Gross Profit: 411*28 = 11,508
Gross Loss: 42*187 = 7,854
Average Monthly Net Profit =11,508 – 7,854 = 3,654
This is an average 30,4% monthly from a $12,000 balance. Not bad!
Note: The computations and graphs were done using Multicharts 11 trading platform.


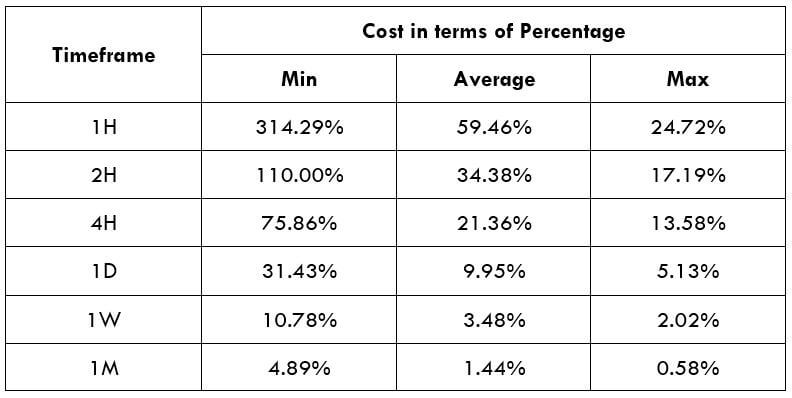


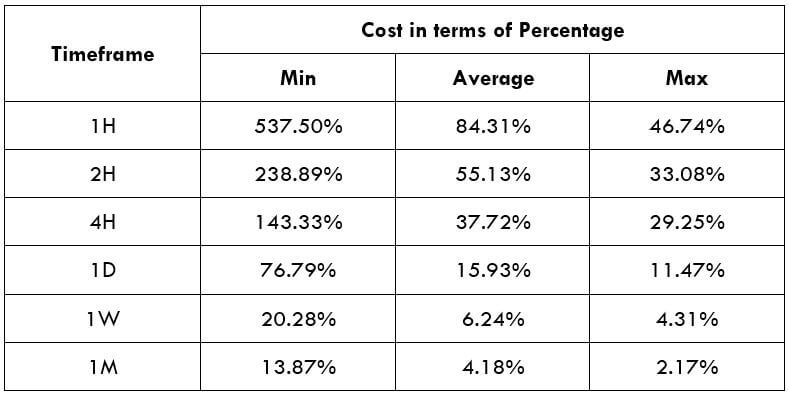


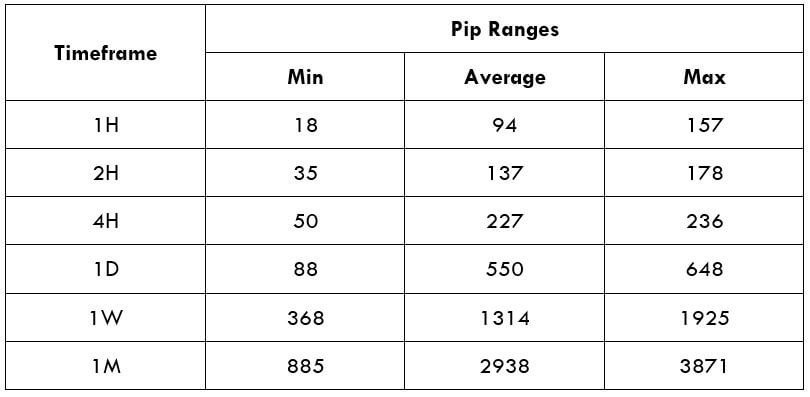

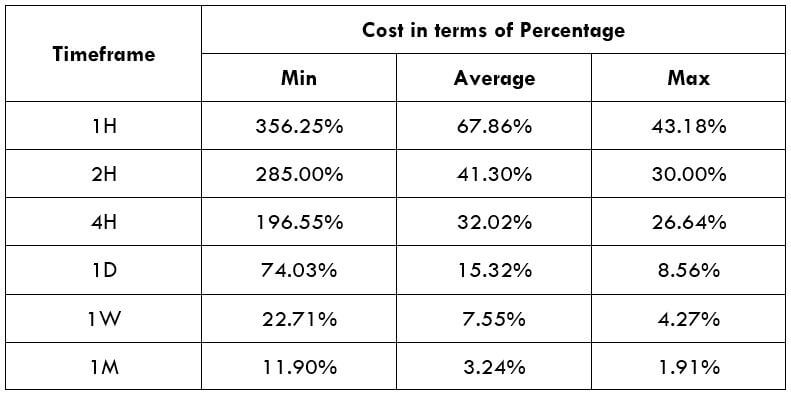

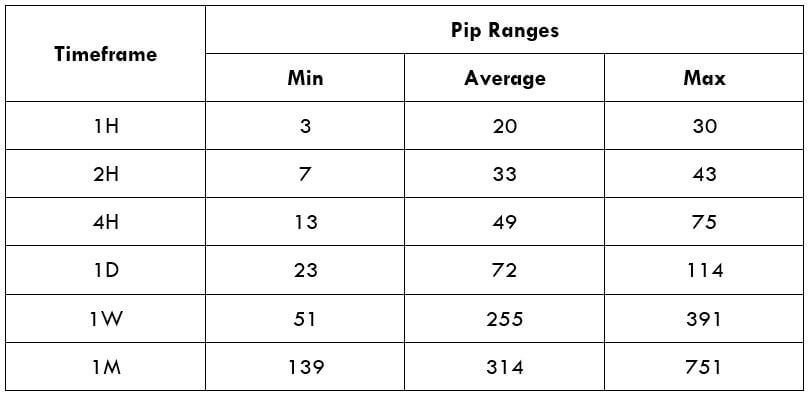
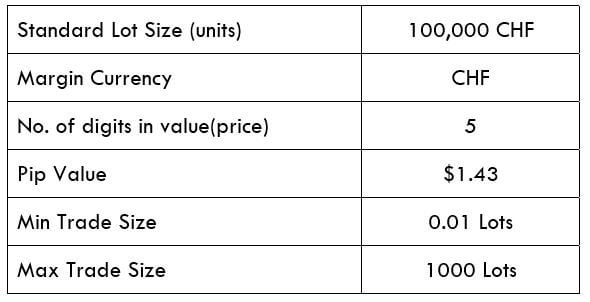
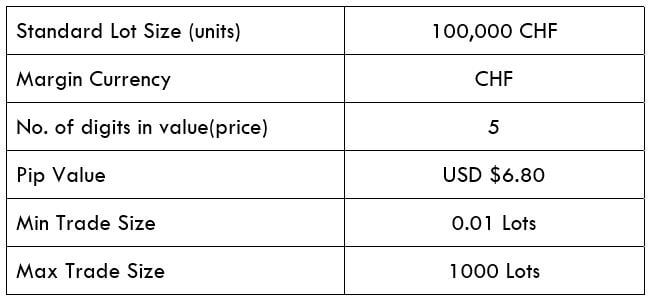
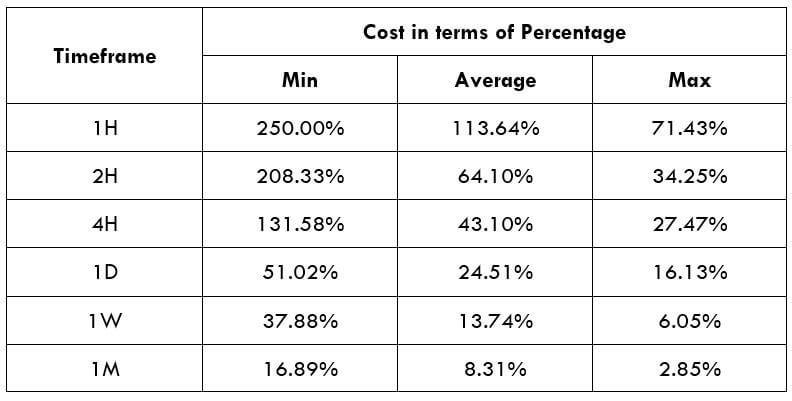
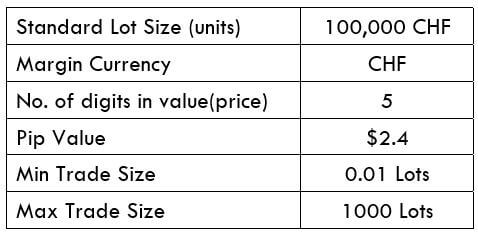
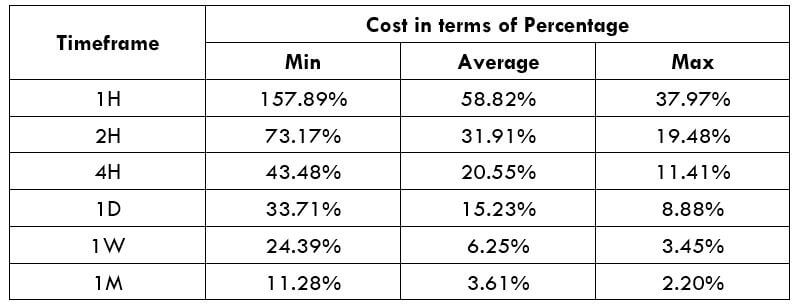
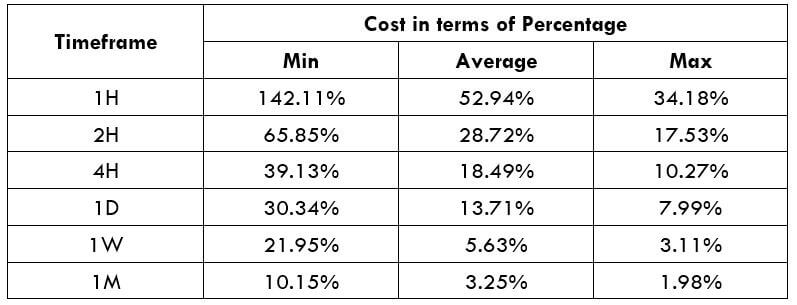
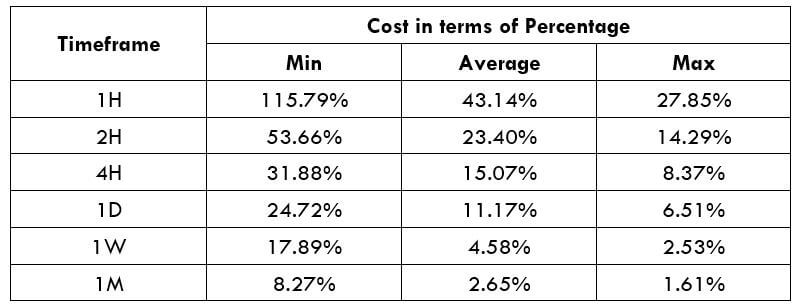
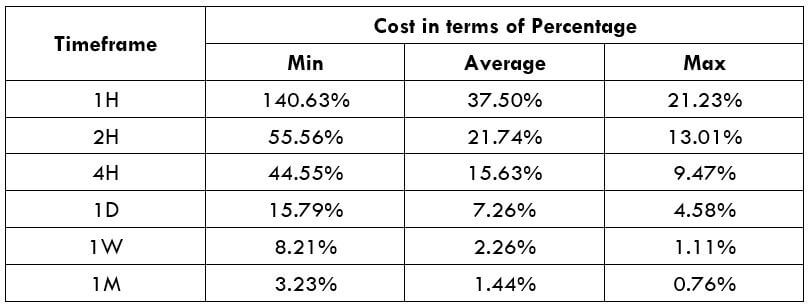
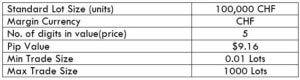
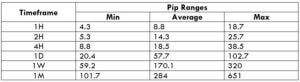
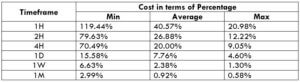
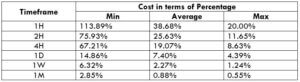
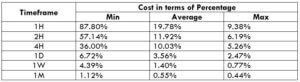
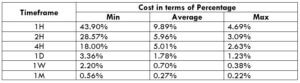
 Spread
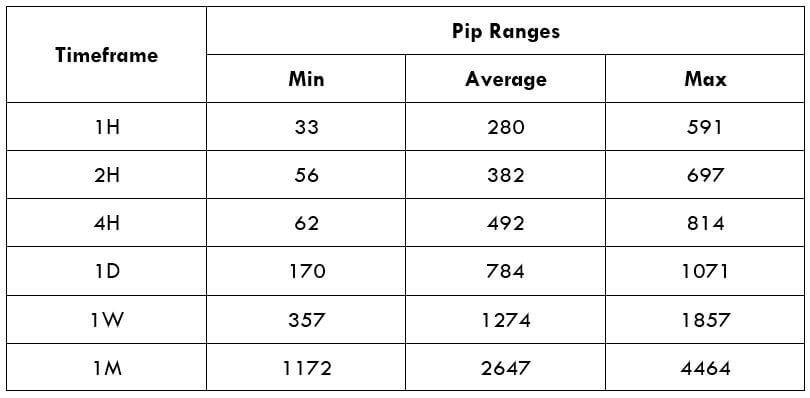
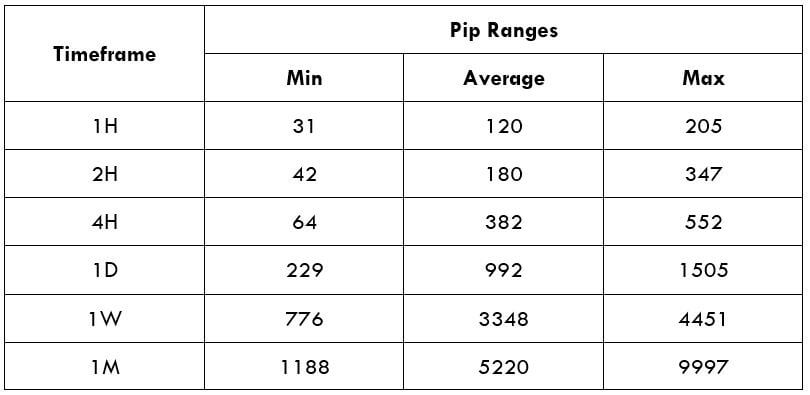
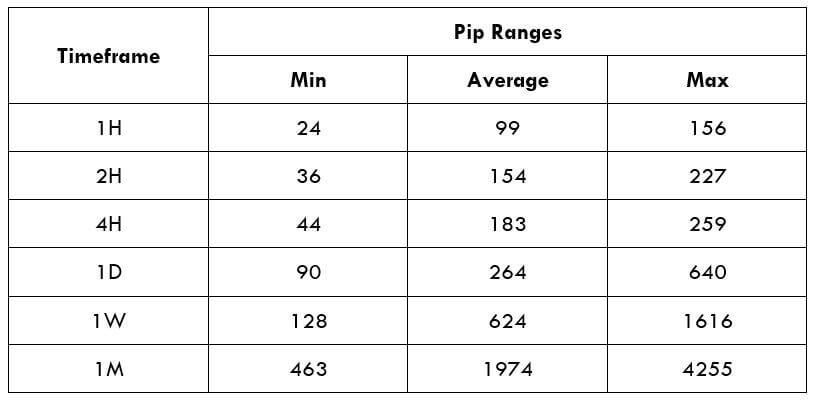
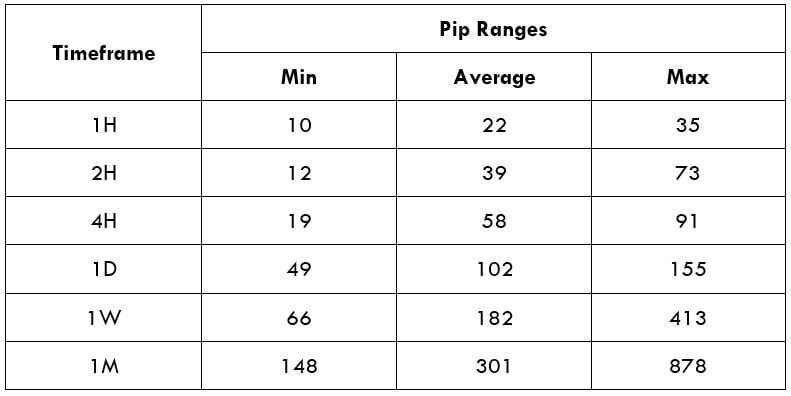
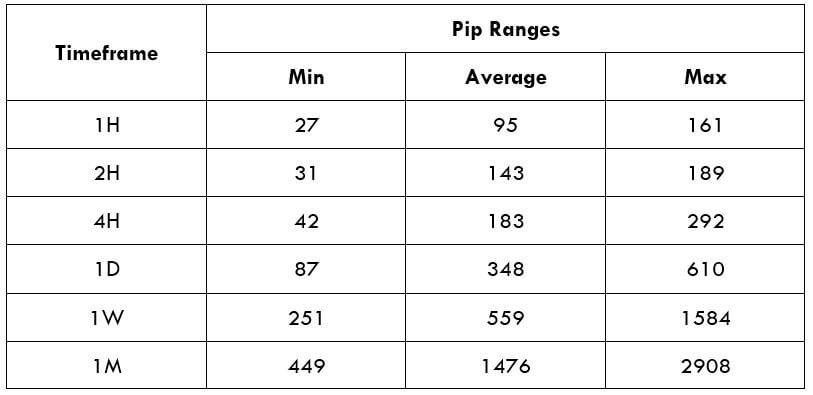
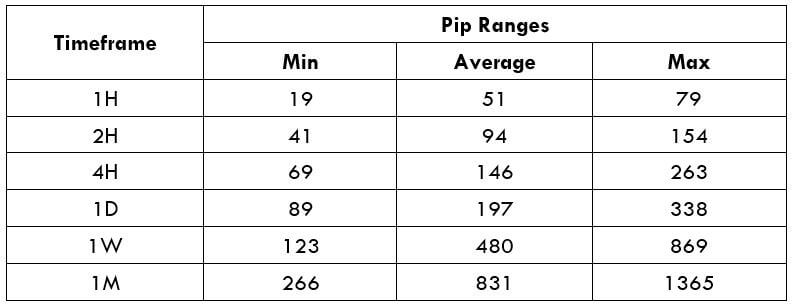
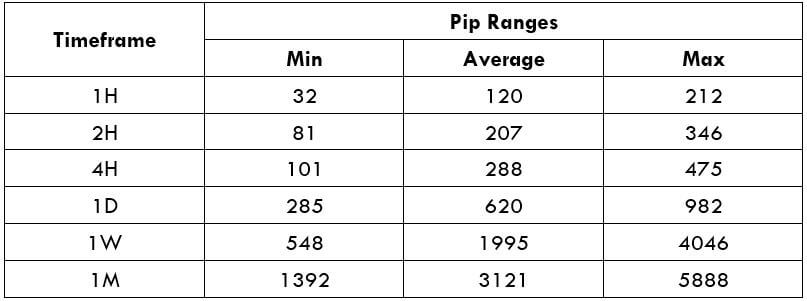
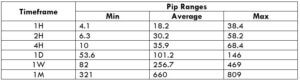
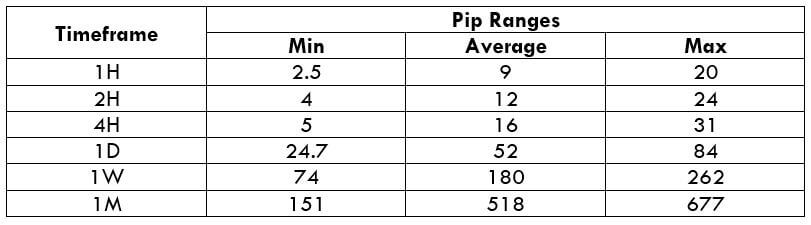
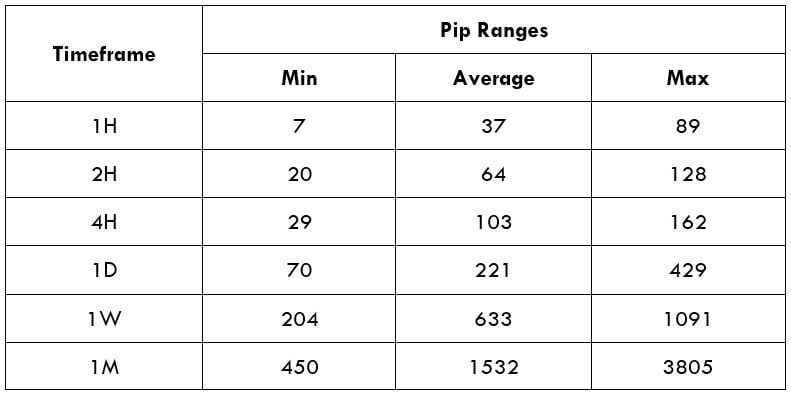
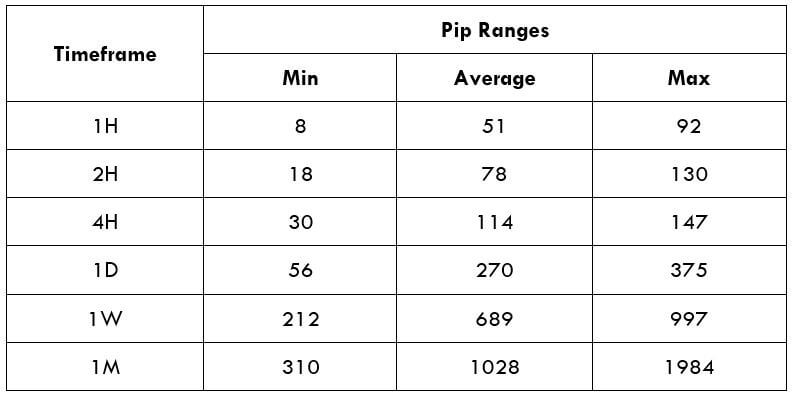
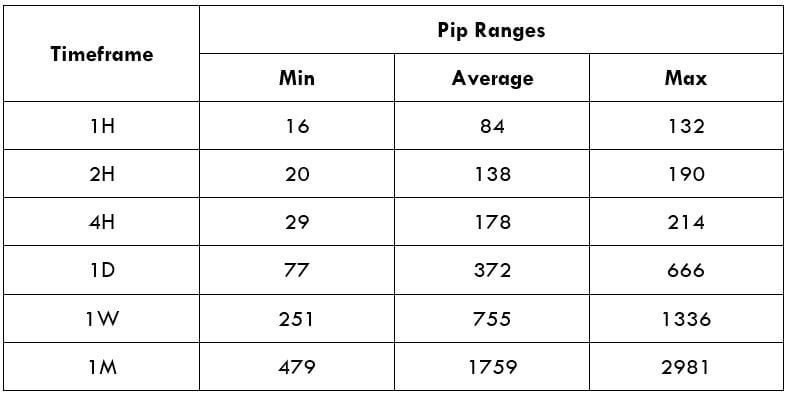
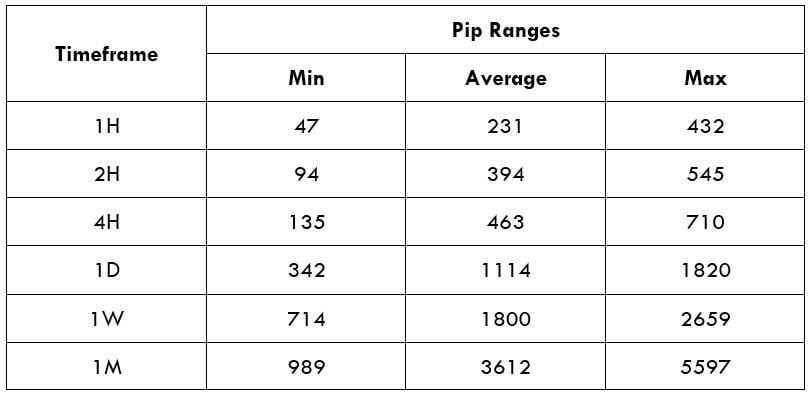 Procedure to assess Pip Ranges
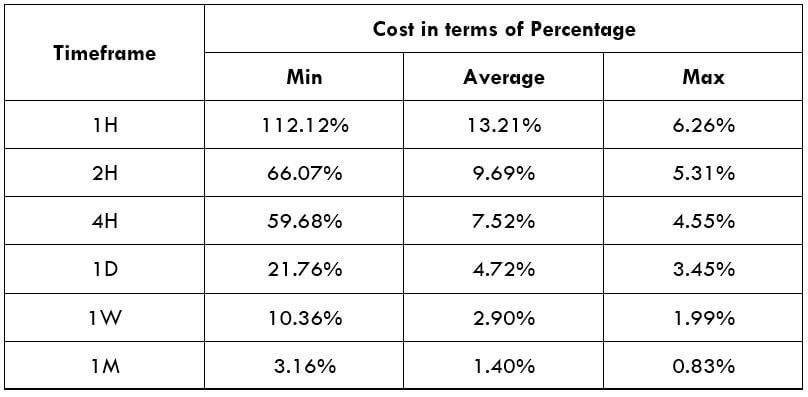
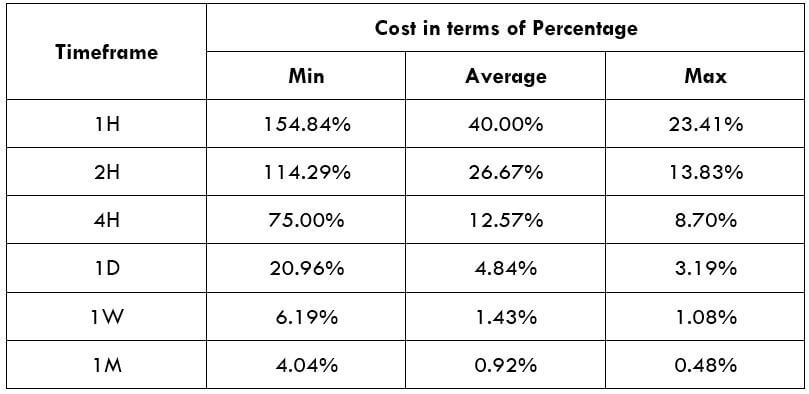
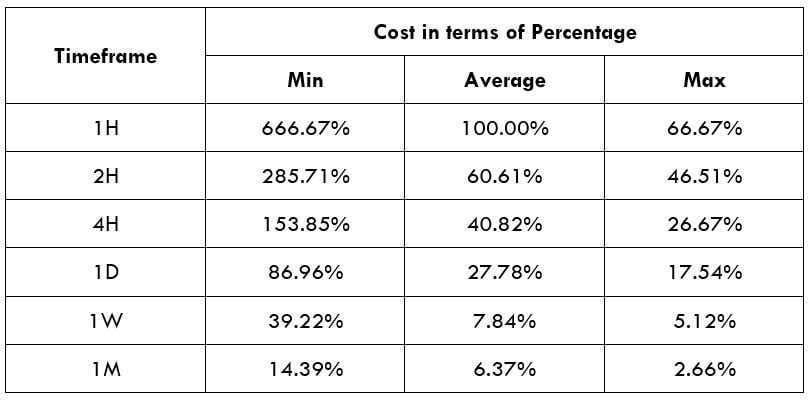
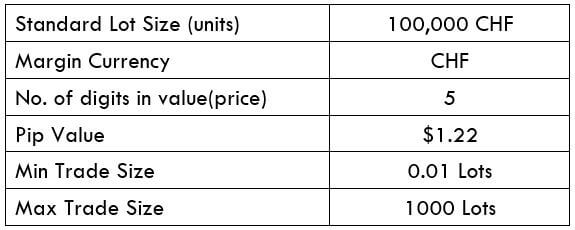
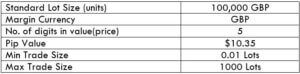
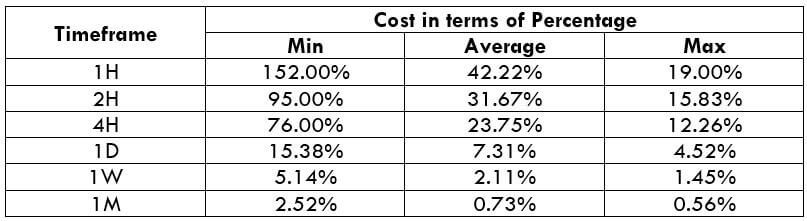
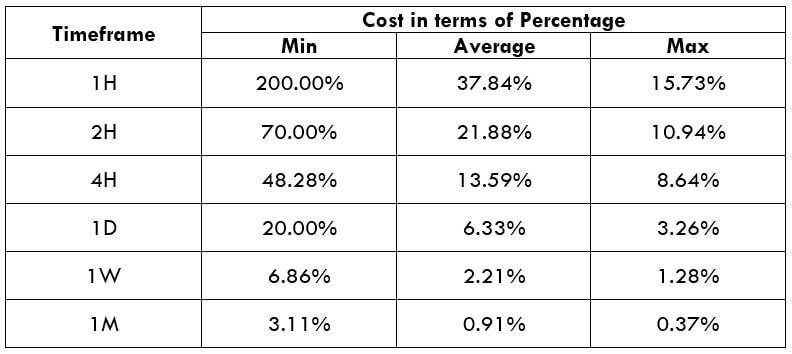
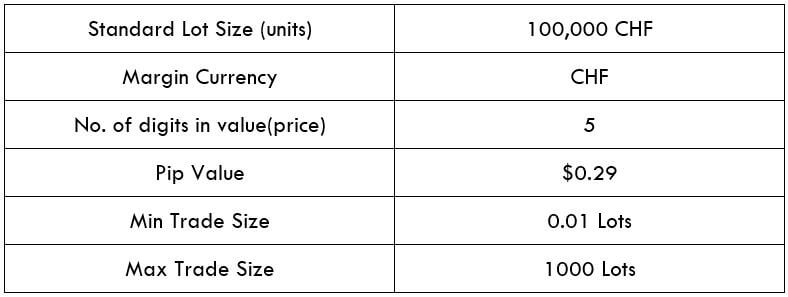
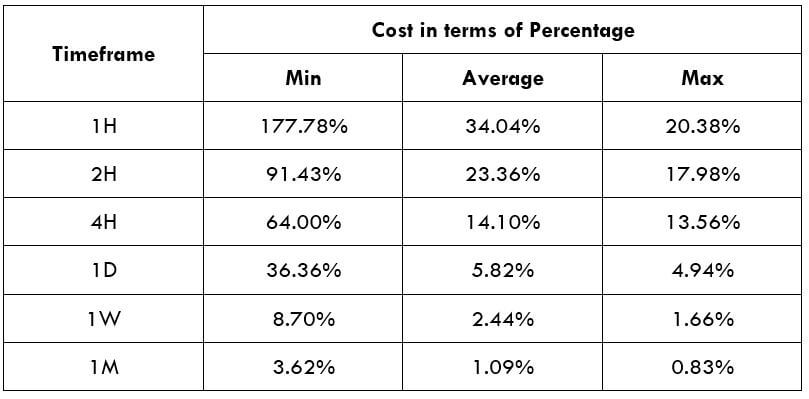
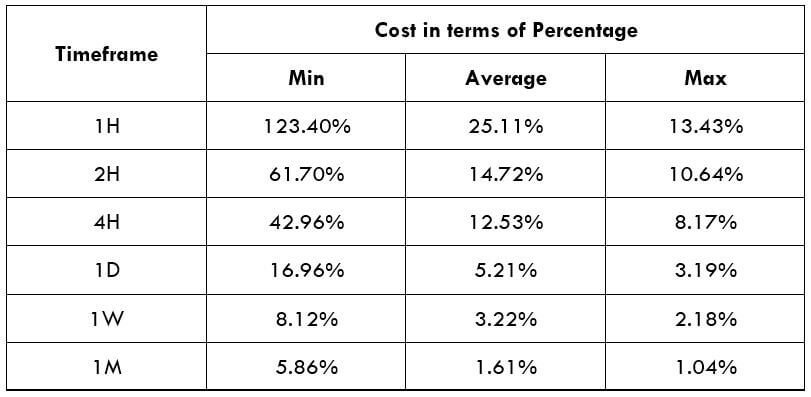 STP Model Account
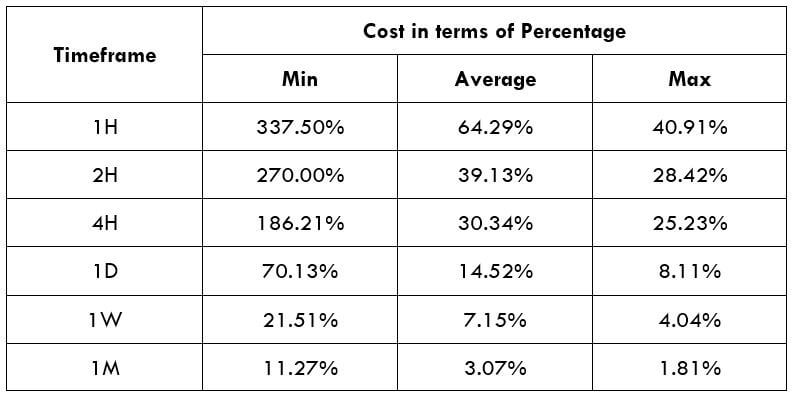
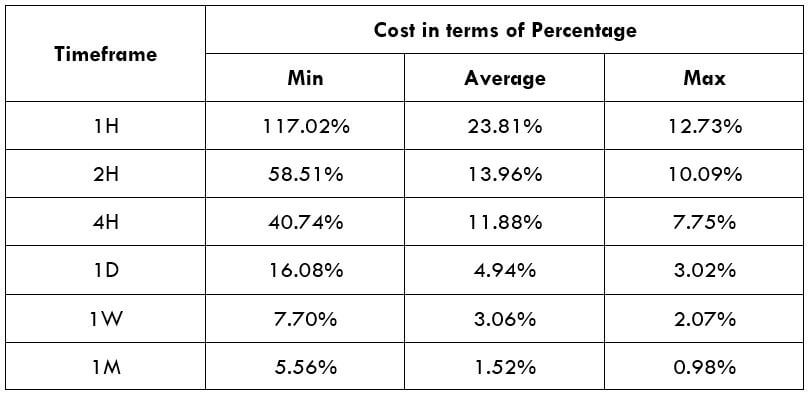

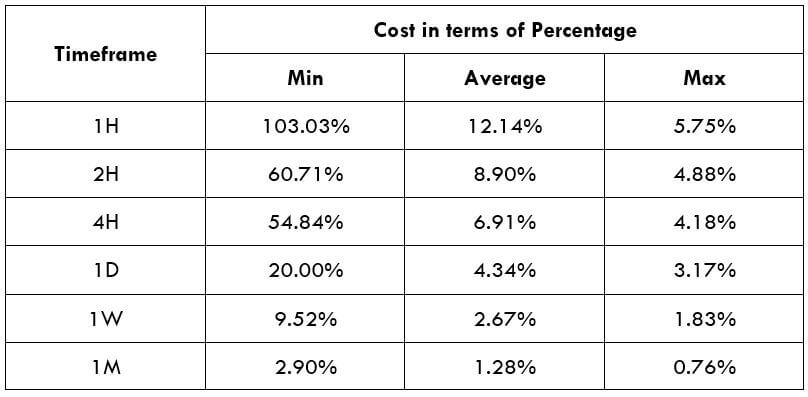
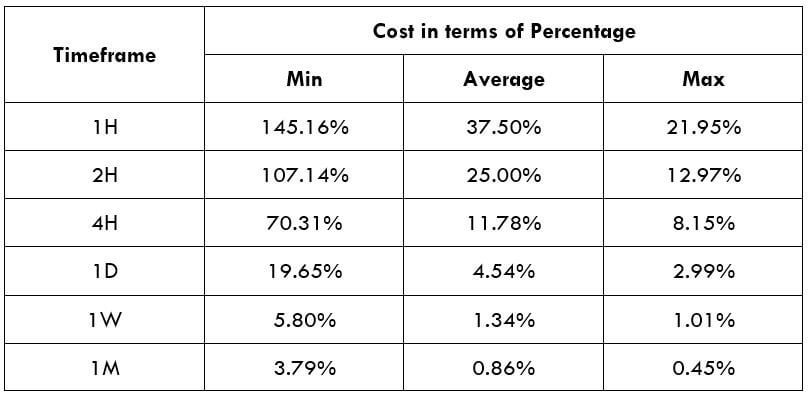
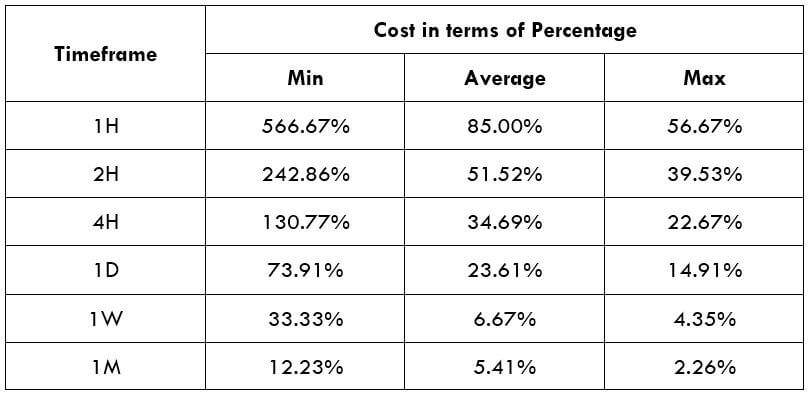
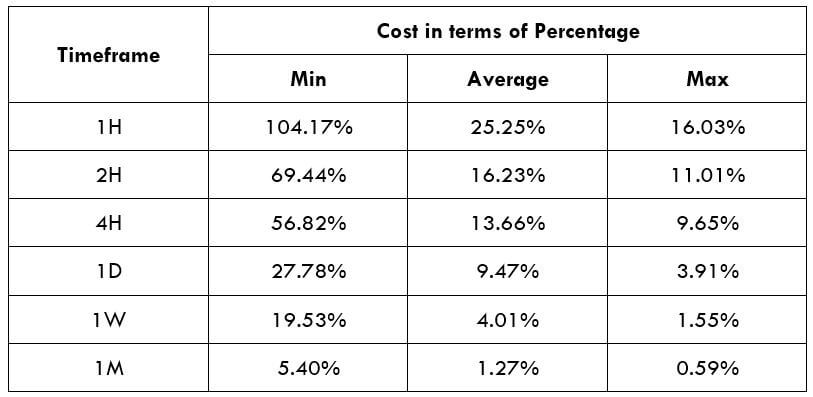
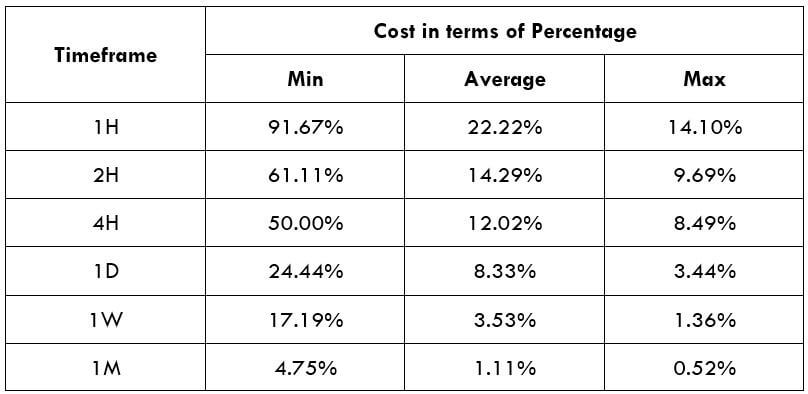
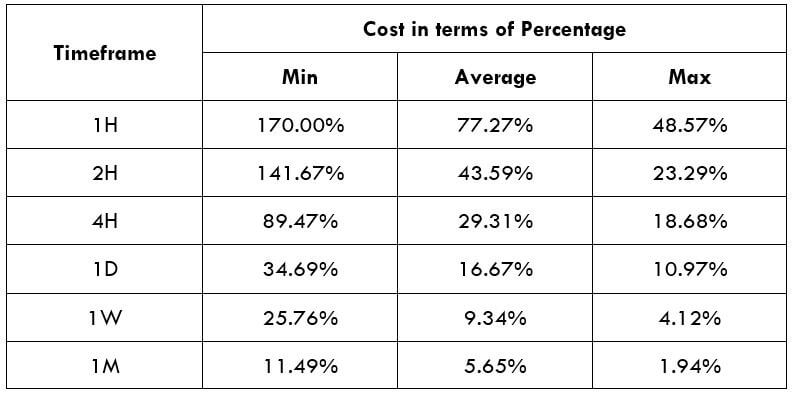
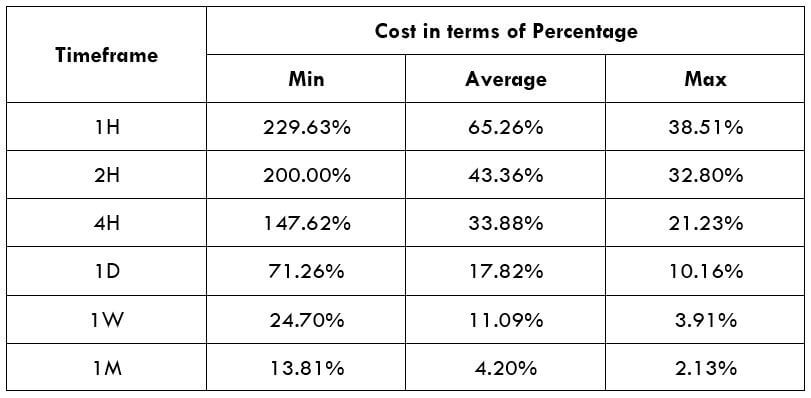
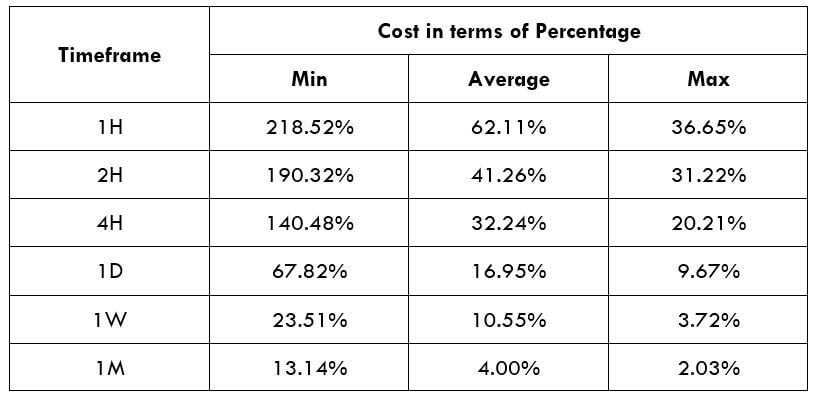
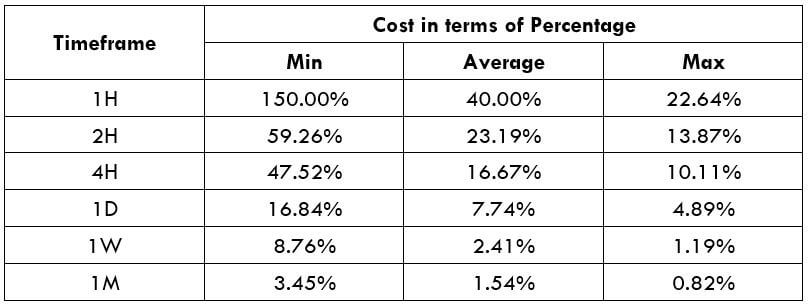
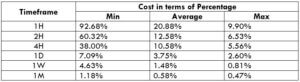
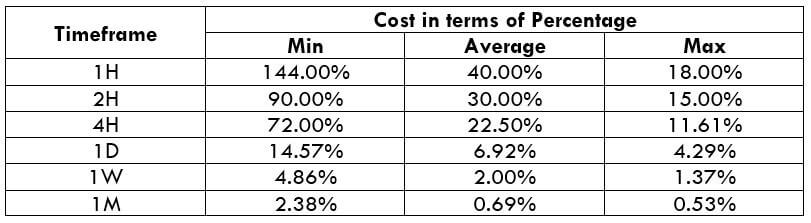
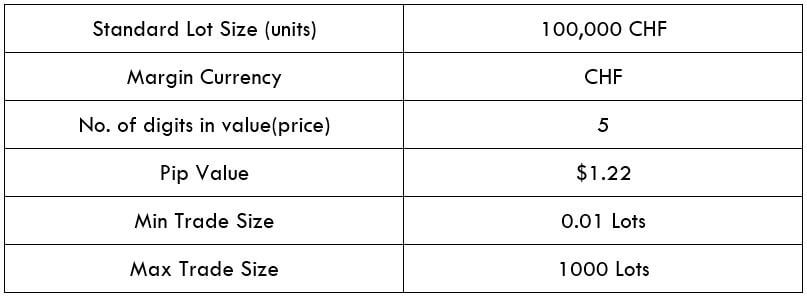
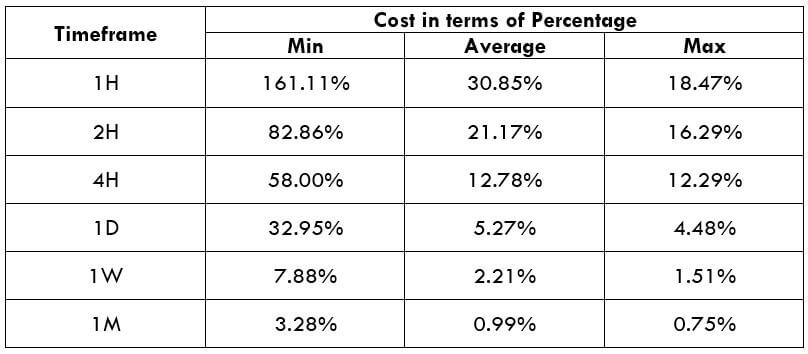
 Spread
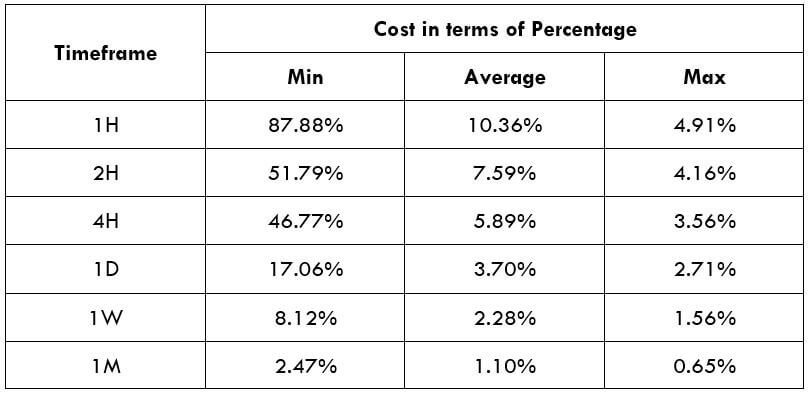
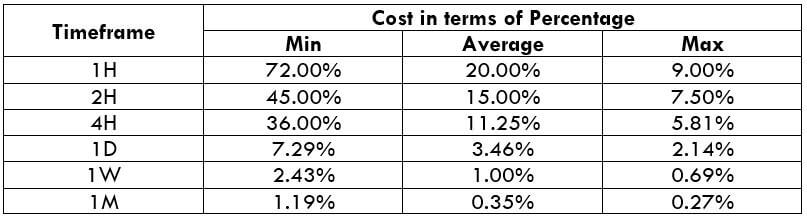
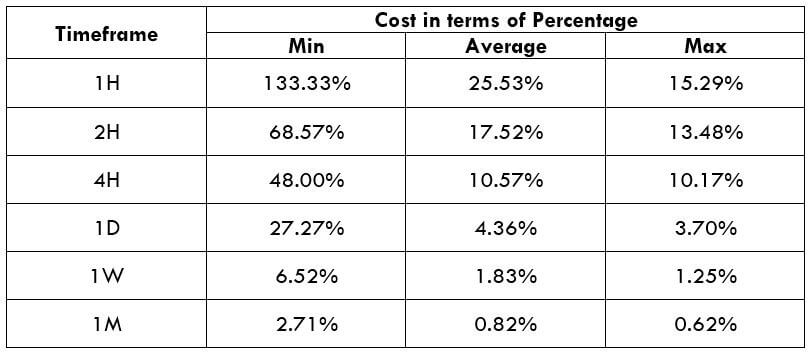