Categories
Forex Assets

Everything About Trading The CHF/THB Forex Exotic Pair

Introduction

CHF/THB is the abbreviation for the Swiss Franc against the Thai Baht. It is classified as an exotic-cross currency pair as it usually has a low trading volume. In this case, the Swiss Franc (on the left) is the base currency, and the Thai Baht (on the right) is the quote currency. The THB is the official currency of Thailand, and it is further split up into 100 satangs.

Understanding CHF/THB

The market price of CHF represents the value of THB that is required to purchase one CHF(Swiss Franc). It is quoted as 1 CHF per X THB. If the market cost of this pair is 34.350, then this amount of THB is required to buy one unit of CHF.

Spread

The distinction between the asking price and the offering price is labeled as the spread. ECN and STP account model will have various spread values; The approximate spread values of CHF/THB pair in both the accounts are mentioned below:

ECN: 30 pips | STP: 35 pips

Fees

The fee is the commission that one pays while entering a trade. A few extra pips are charged on ECN accounts, but there is no fee charged on STP accounts.

Slippage

The mathematical difference between the price expected by the trader and the given price by the broker can be termed slippage. Its cost varies on two factors, i.e., the market’s high volatility and broker’s implementation speed.

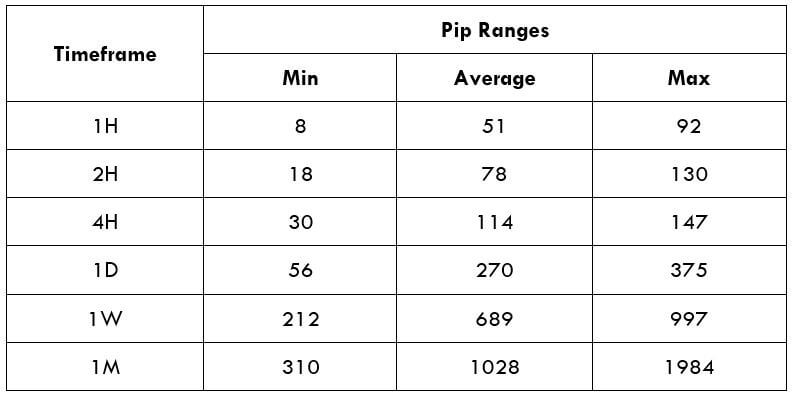
Trading Range in CHF/THB

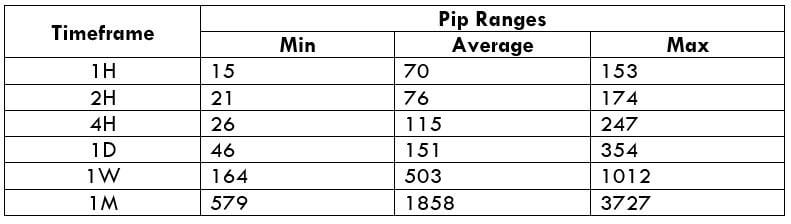
The trading range helps us understand the minimum, average, and maximum pip movement in various time frames. These values assist us in determining the risk, which could be caused by trade. The same is in shown in the below table:

Procedure to assess Pip Ranges

  1. Add the ATR indicator to your chart
  2. Set the period to 1
  3. Add a 200-period SMA to this indicator
  4. Shrink the chart so you can assess a large time period
  5. Select your desired timeframe
  6. Measure the floor level and set this value as the min
  7. Measure the level of the 200-period SMA and set this as the average
  8. Measure the peak levels and set this as Max.

CHF/THB Cost as a Percent of the Trading Range

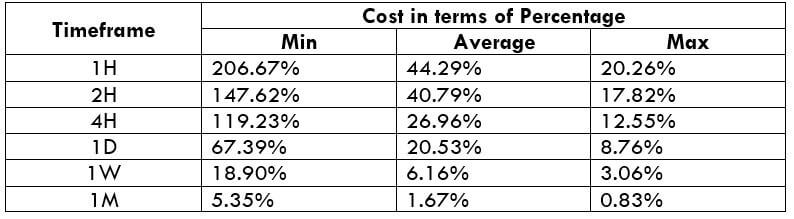
The cost variations in trade can be determined by applying the total cost to the table mentioned below. The cost percentage of the trading range represents the difference in fees on the trade and various time frames for differing volatility.
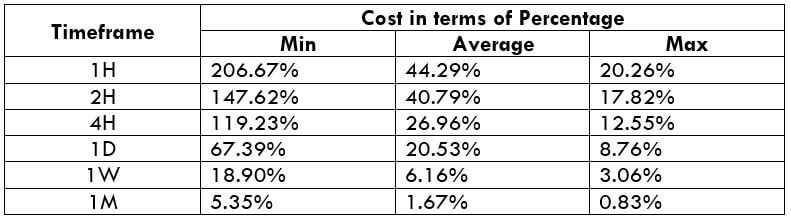
ECN Model Account

Spread = 30 | Slippage = 5 |Trading fee = 8

Total cost = Slippage + Spread + Trading Fee = 5 + 30 + 8 = 43 
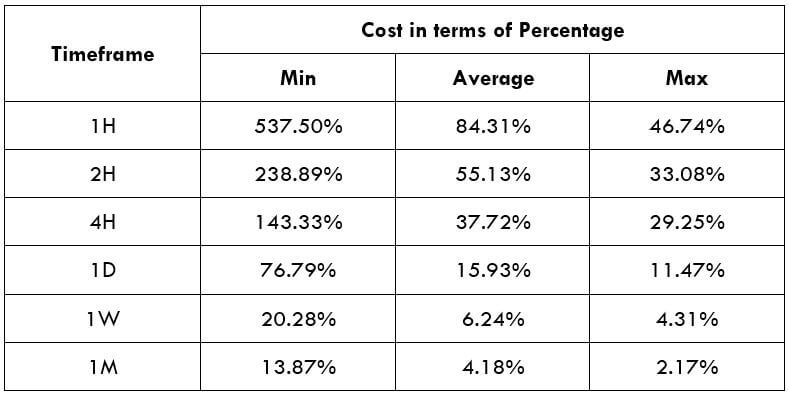
STP Model Account

Spread = 35 | Slippage = 5 | Trading fee = 0

Total cost = Slippage + Spread + Trading Fee = 5 + 35 + 0 = 40

The Ideal way to trade the CHF/THB

The CHF/THB is an exotic-cross currency pair, and this market’s volatility is moderate. For instance, the average pip movement on the 1H timeframe is 51 pips. We should understand the higher the volatility, the lower will be the cost to implement the trade. However, this is not an added advantage as trading in a volatile market means more risk.

For example, in the 1M time frame, the Maximum pip range value is 1984, and the minimum is 310. When we evaluate the trading fees for both the pip movements, we can see that for 310pip movement fess is 13.87%, and for the 1984 pip movement, the fee is only 2.17%. With the mentioned example, we can conclude that trading the CHF/THB currency pair will be comparatively expensive.

Categories
Forex Assets

Exploring The EUR/THB Exotic Currency Pair

Introduction

EUR/THB is the abbreviation for the Euro area’s euro against the Thai Baht. This pair is classified as an exotic currency pair. In this pair, EUR is the base currency, and THB is the quote currency.

Understanding EUR/THB

The market value of this pair represents the value of THB equivalent to one EUR. It is quoted as 1 EUR per X THB. For example, if the current market price of this pair is 35.345, these many units of THB are required to purchase one euro.

EUR/THB Specification

Spread

The algebraic difference between the bid and the ask price is referred to as the spread. Spread is determined by the brokers and varies based on the execution model they use.

Spread on ECN: 25 pips | Spread on STP: 28 pips

Fee

The fee is simply the commission paid on the trade. However, this fee is levied only on ECN accounts, not STP accounts.

Slippage

When you execute orders by market, the price you receive from the broker is different from the price you trigger your order. This happens solely due to the changes in the market volatility and the speed with which brokers execute the trades.

Trading Range in EUR/THB

The trading range is the representation of the range of pip movement in a currency pair. These pip values help in assessing the profit/loss in a trade, even before opening positions. In the below table, we have included six timeframes, ranging from 1H to 1M.

Procedure to assess Pip Ranges

  1. Add the ATR indicator to your chart
  2. Set the period to 1
  3. Add a 200-period SMA to this indicator
  4. Shrink the chart so you can assess a large time period
  5. Select your desired timeframe
  6. Measure the floor level and set this value as the min
  7. Measure the level of the 200-period SMA and set this as the average
  8. Measure the peak levels and set this as Max.

EUR/THB Cost as a Percent of the Trading Range

The cost as a percent of the trading range is the representation of the cost variation in the trade. The cost varies based on the volatility of the market. Having an idea of the cost variation, we can find our ideal times of day to trade in the market with reduced costs.

ECN Model Account

Spread = 25 | Slippage = 3 | Trading fee = 3

Total cost = Spread + Slippage + Trading Fee = 25 + 3 + 3 = 31

STP Model Account

Spread = 28 | Slippage = 3 | Trading fee = 0

Total cost = Spread + Slippage + Trading Fee = 28 + 3 + 0 = 31

The Ideal way to trade the EUR/THB

Before getting right into it, let’s comprehend the above tables. To analyze the tables, we consider the magnitude of the percentages. The higher the percentages, the higher is the cost of the trade. Conversely, lower percentages imply lower costs.

The costs in the min column are higher compared to the max column. This means that the costs are high when the volatility of the market is low, and the converse holds true as well.

The ideal way to trade this pair is completely dependent on the type of trader you are. For instance, if you are a trader looking for low costs, then you may trade when the volatility is high. Since the majority of the traders need a balance between the two, they may trade when the volatility of the market is somewhere around the average values in the trading range table.

Another simple technique to reduce costs is implementing strategies such that orders are executed using limit orders instead of market orders. In doing so, the slippage will be completely eradicated, and the total costs will be reduced by a decent number.