Introduction
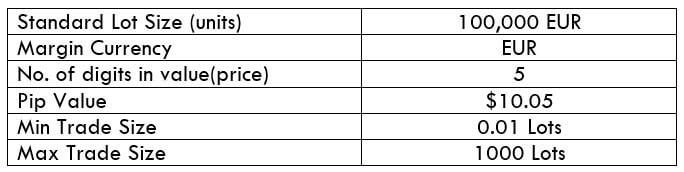
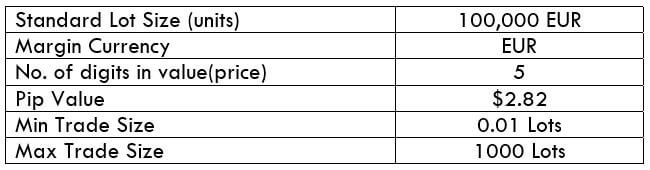
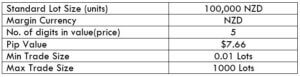
NZD/RON is the acronym for the New Zealand Dollar against the Romanian Leu. It is categorized as an exotic-cross currency pair that usually has a low trading volume. Here, the New Zealand Dollar is the base currency, and the Romanian Leu (on the right) is the quote currency. The RON (Romanian Leu) is the formal currency of Romania, and one RON is further divided into 100 bani.
Understanding NZD/RON
To identify the relative value of one currency, we require another currency to compare. If the base currency’s value comes down, the value of the quote currency goes up and contrariwise. If the market cost of this pair is 2.7393, then this amount of RON is required to buy one unit of NZD.
Spread
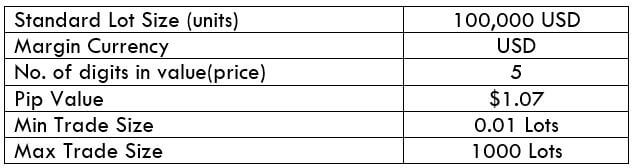
Foreign exchange brokers have two separate prices for currency pairs, which are categorized as the ask and bid price. The offering price is the bid price, and the buying price is the asking price. The difference between the bid/ask price is recognized as the spread. The spread is how stockbrokers make their revenue. Below are the spreads for NZD/RON currency pairs in both ECN & STP brokers.
ECN: 35 pips | STP: 40 pips
Fees
A Fee is a payment we pay to the broker each time we open a spot. There is no additional payment charged on STP accounts, but a few extra pips are charged on ECN accounts.
Slippage
Slippage is the difference between the trader’s predicted price and the actual price at which the trade is implemented. It can appear at any given time but often arises when the market is moving fast and is volatile.
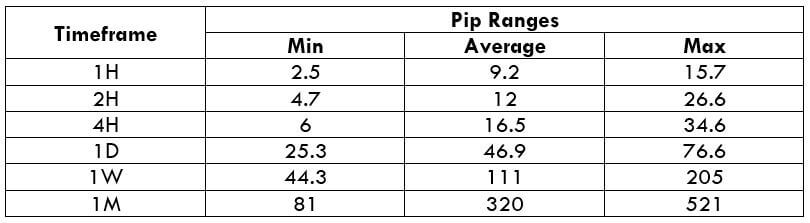
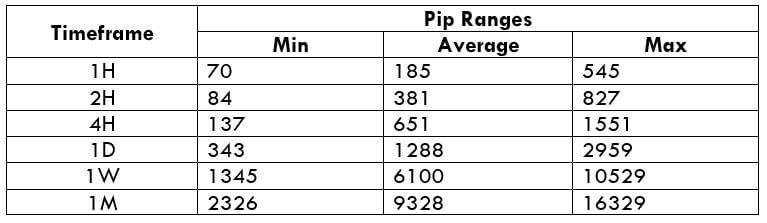
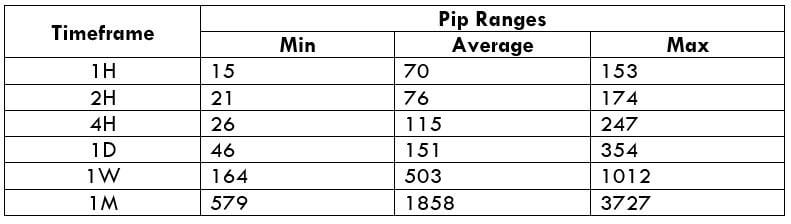
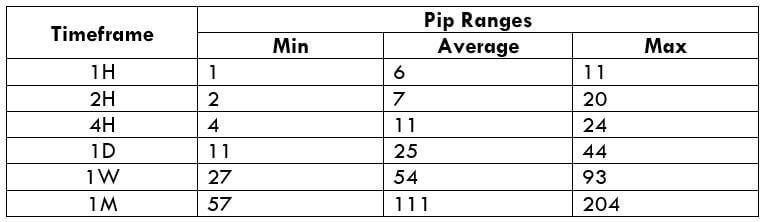
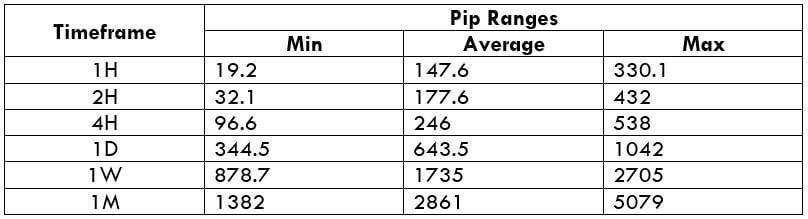
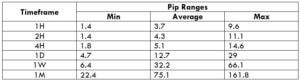
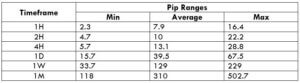
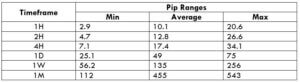
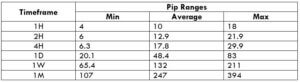
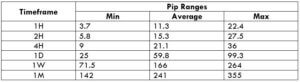
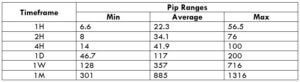
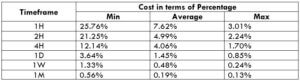
Trading Range in NZD/RON
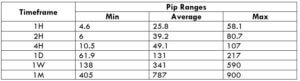
The amount of money we earn or lose in a timeframe can be estimated using the trading range table. It is an example of the minimum, average, and maximum pip movement in a currency pair. This can be measured simply by using the ART indicator with 200-period SMA.
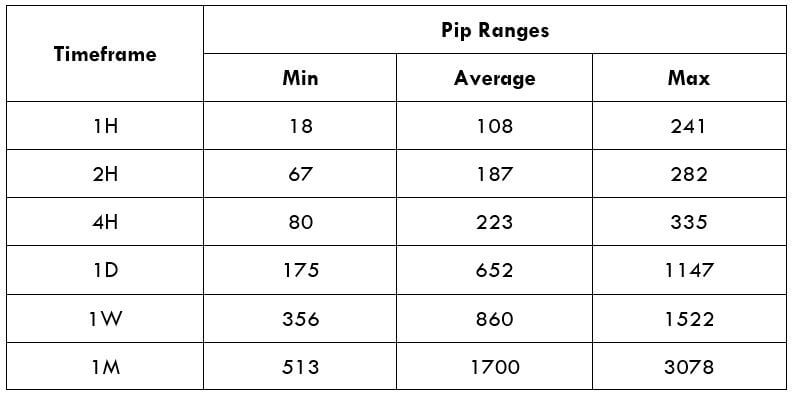
Procedure to assess Pip Ranges
- Add the ATR indicator to your chart
- Set the period to 1
- Add a 200-period SMA to this indicator
- Shrink the chart so you can assess a large time period
- Select your desired timeframe
- Measure the floor level and set this value as the min
- Measure the level of the 200-period SMA and set this as the average
- Measure the peak levels and set this as Max.
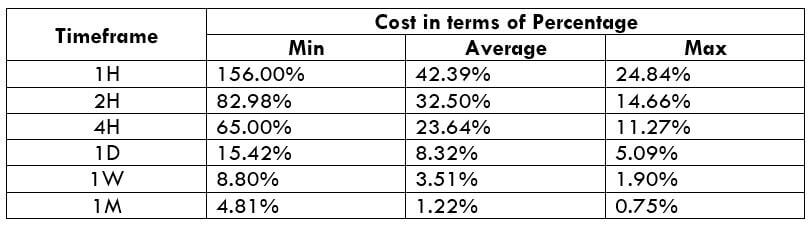
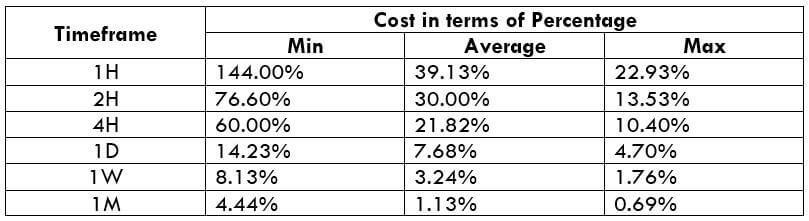
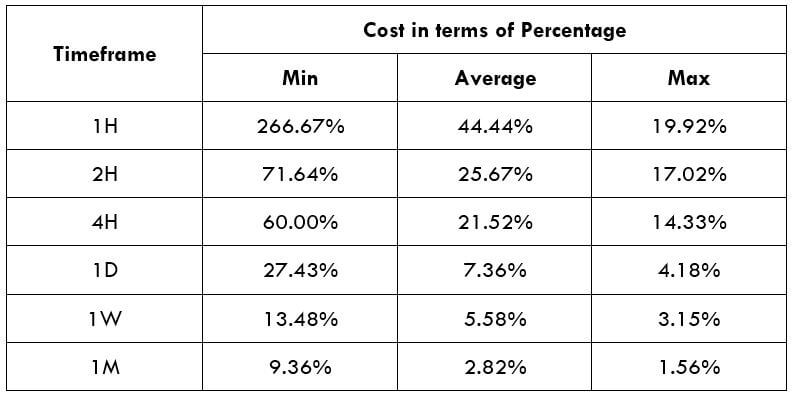
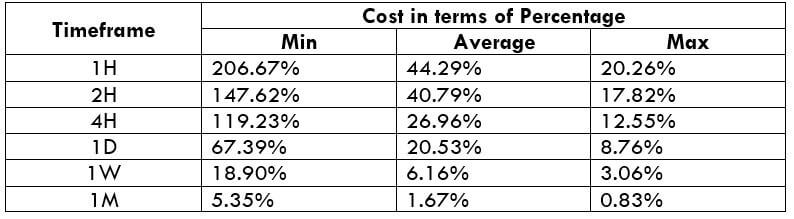
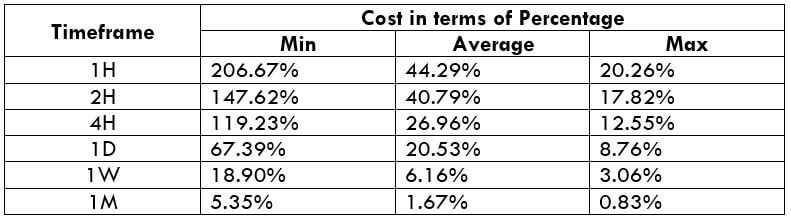
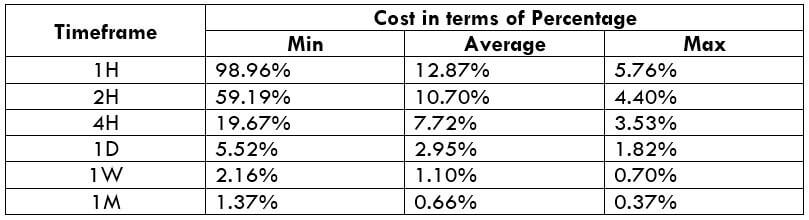
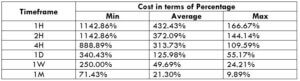
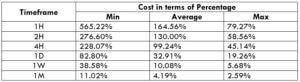
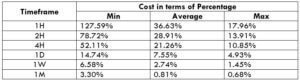
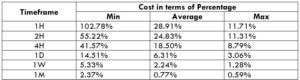
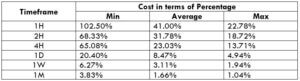
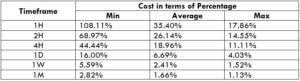
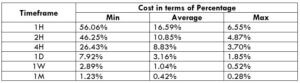
NZD/RON Cost as a Percent of the Trading Range
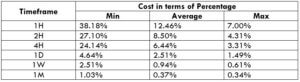
The cost of trade generally differs on the broker and differs based on the volatility of the market. This is because the total cost also comprises slippage and spreads, excluding the trading fee. Below is the understanding of the cost variation in terms of percentages. The insights of it are discussed in the subsequent sections.
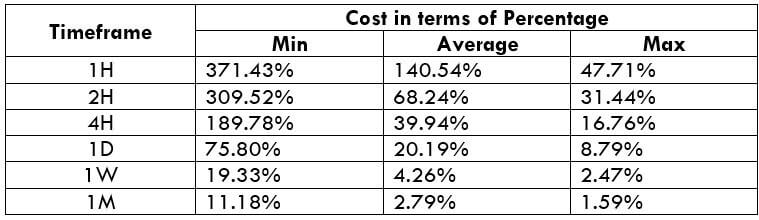
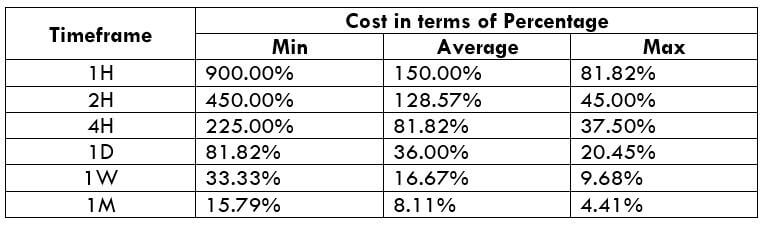
ECN Model Account
Spread = 35 | Slippage = 5 |Trading fee = 8
Total cost = Slippage + Spread + Trading Fee = 5 + 35 + 8 = 48
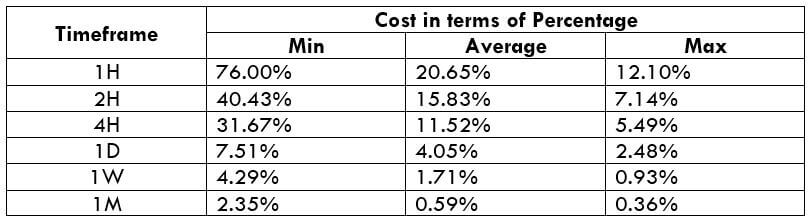
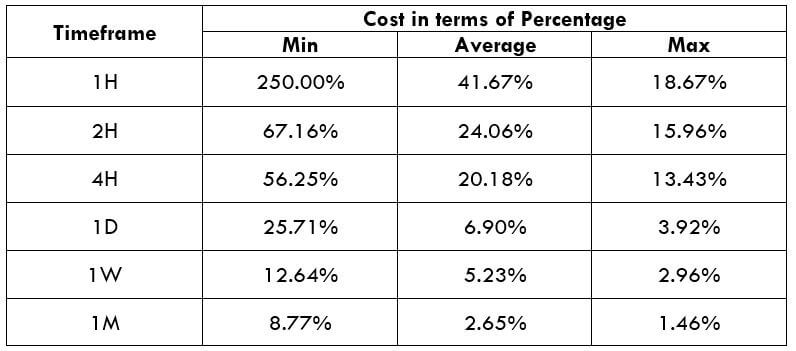
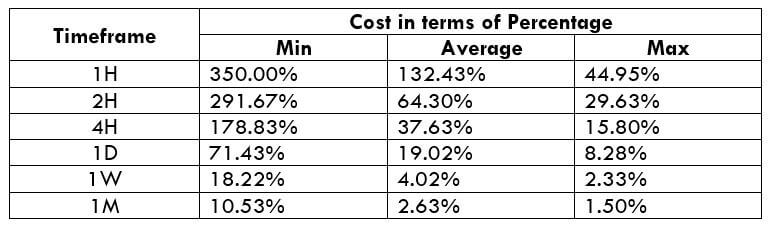
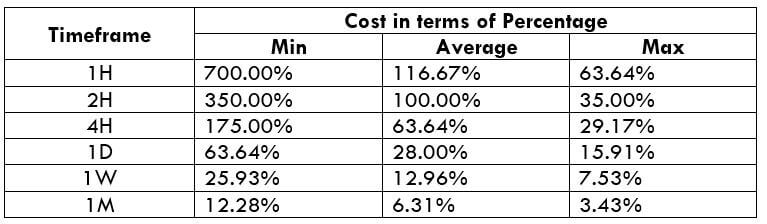
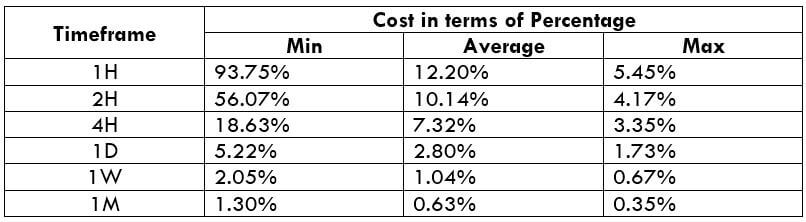
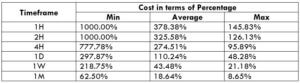
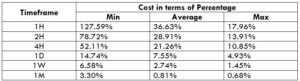
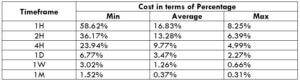
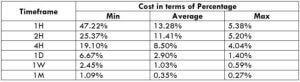
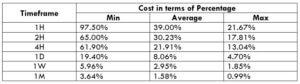
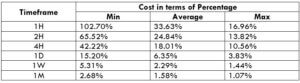
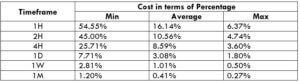
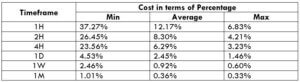
STP Model Account
Spread = 40 | Slippage = 5 | Trading fee = 0
Total cost = Slippage + Spread + Trading Fee = 5 + 40 + 0 = 45
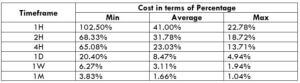
The Ideal way to trade the NZD/RON
Understanding the above tables is pretty simple. The percentage values are directly relative to the total cost of the trade. It is seen that the percentages are relatively high on the minimum column and vice versa. Now, coming to the best time to enter the market, it is when the volatility of NZD/RON is somewhere near the avg pip movement. Trading in such minutes will guarantee low costs as well as lower liquidity.
Speaking about timeframes, trading in 4H and Daily timeframe would be great, as the cost is manageable, and the trade is also not very time-consuming.
Another simple hack to cut down the cost is by trading using limit/pending orders instead of market orders. This will considerably lower costs on a trade because the slippage on the trade becomes 0. It many cases, the cost lowers by about 50% of the original value when we use limit orders.


 The Ideal way to trade the GBP/NZD