Introduction
USD/THB is the abbreviation for the US Dollar versus Thailand’s Thai Baht. It is an exotic currency pair which usually has high volatility and low trading volume. US Dollar, in this pair, is the base currency, and the Thai Baht is the quote currency.
Understanding USD/THB
The value of USDTHB represents the number of THB that are equivalent to one USD. It is quoted as 1 USD per X THB. So, if the market price of this pair is 30.98, then one has to produce 30.98 THB to buy one USD.
Spread
Spread is the difference between the bid and the ask price of the currency pair set by the brokers. It typically varies from broker to broker and also from the type of order execution. The spreads on ECN and STP accounts are as shown below.
ECN: 10 pips | STP: 11 pips
Fees
There is a fee associated with every trade you take. The fee is also referred to as the commission on the trade. Its value is usually a constant but varies from the type of execution model. The fee on STP accounts is nil, while there are a few pips of fee on ECN accounts.
Slippage
Slippage is the difference between the trader’s required price and the price at which his trade was executed. Since exotic pairs are highly volatile, the slippage is quite high.
Trading Range in USD/THB
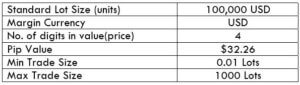
Below we shoe a table representation of the minimum, average, and maximum pip movement in a currency pair. These values help us determine the profit or loss that can be made on a trade in a given amount of time. All you have to do is, multiply any one of the below values with the value per pip ($32.26). The result is the potential profit gained or lost on the trade for one bar of the timeframe.
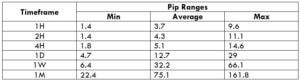
Procedure to assess Pip Ranges
- Add the ATR indicator to your chart
- Set the period to 1
- Add a 200-period SMA to this indicator
- Shrink the chart so you can assess a large period
- Select your desired timeframe
- Measure the floor level and set this value as the min
- Measure the level of the 200-period SMA and set this as the average
- Measure the peak levels and set this as Max.
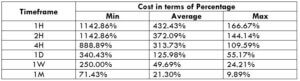
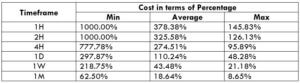
USD/THB Cost as a Percent of the Trading Range
The cost as a trading range represents the cost variation in trade in different volatilities of the market. It is presented in percentages of the total range. Thus, it helps determine the best moments to enter the market to ensure lower costs.
ECN Model Account
Spread = 10 | Slippage = 3 |Trading fee = 3
Total cost = Slippage + Spread + Trading Fee = 10 + 3 + 3 = 16
STP Model Account
Spread = 11 | Slippage = 3 | Trading fee = 0
Total cost = Slippage + Spread + Trading Fee = 11 + 3 + 0 = 14
The Ideal way to trade the USD/THB
Trading exotic pairs are different from trading the major and minor pairs. However, there are times when one can trade this pair by making attempts to reduce the costs.
The magnitude of the percentages represents the costs of the trade. The higher the percentages, the higher are the costs on the trade. It can be seen from tables that the costs are high on the min column and comparatively lower in the max column. This clearly means the costs are high during high volatilities and vice versa.
However, when it comes to determining the right time to trade, one must trade during those moments when the volatility is around the higher values because this will ensure pretty great volatility as well as low costs.
Furthermore, another simple way to reduce costs is by trading using limit/stop orders instead of market orders. Limit orders will eliminate the slippage and significantly reduce the total cost of the trade.
Finally, we can see that we must be pretty sure of the direction and extension of the trend to trade the USDTHB, and avoid trading it intraday. Using the daily chart and limit orders, we still would need almost 4 Hours of a positive movement (with the trade) to pay the costs. Therefore we practical setups would ask for at least 2-3 days of market action for propper reward-to-risk factors.