
Introduction
In this exotic forex pair, the AUD represents the Australian dollar, while the MXN – the Mexican Peso. Exotic currency pairs have higher volatility in the forex market when compared to the other major pairs. Here, AUD is the base currency, where MXN is the quote currency. It means that the AUD/MXN exchange rate shows the amount that 1 AUD can buy in terms of MXN. Let’s say that the exchange rate for the AUD/MXN is 15.0346; it means that 1 AUD can be exchanged for 15.0346 MXN.
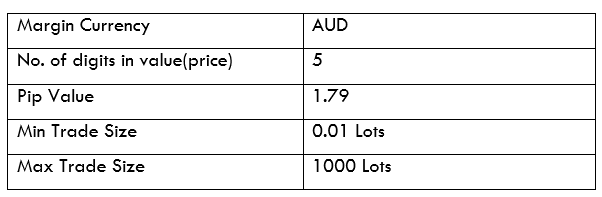
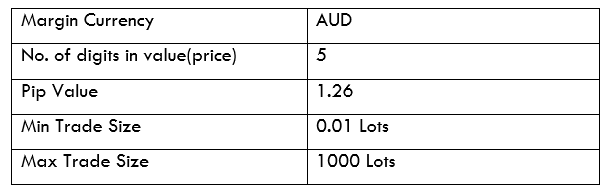
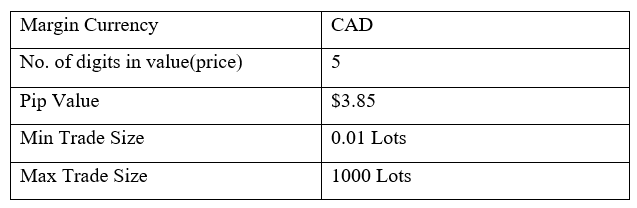
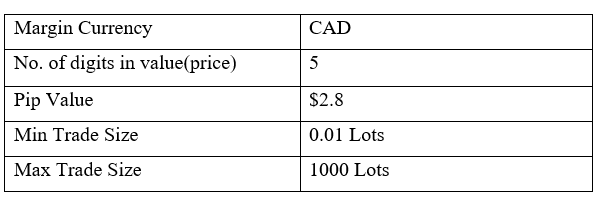
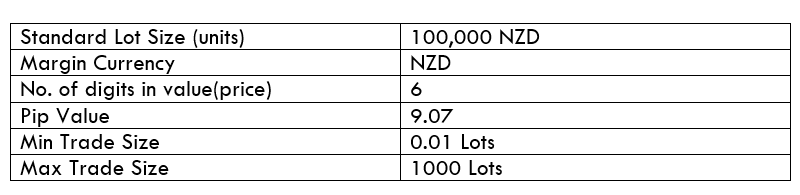
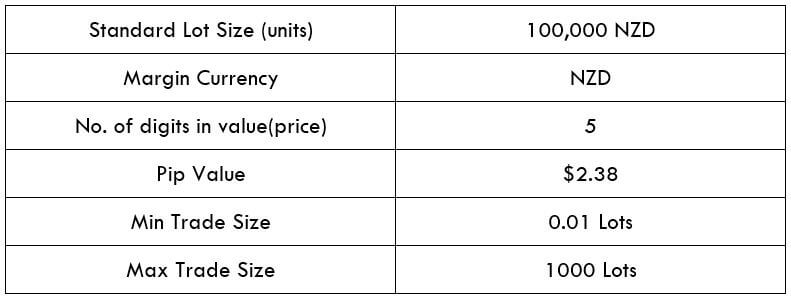
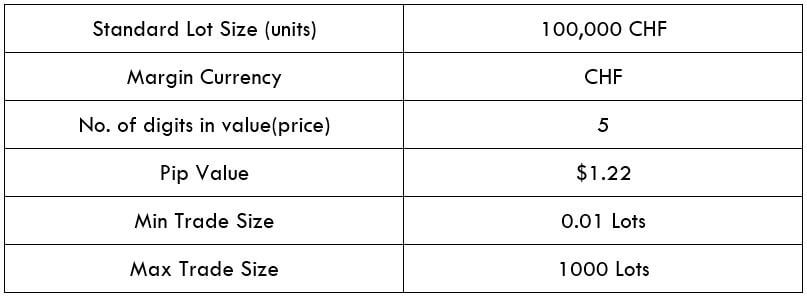
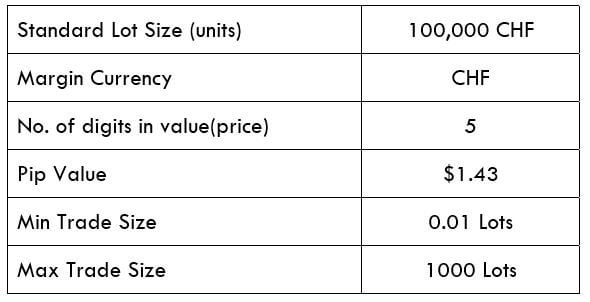
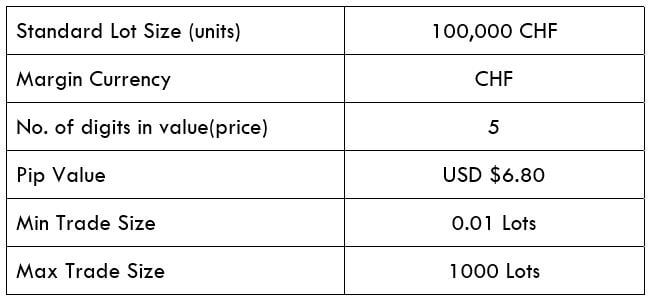
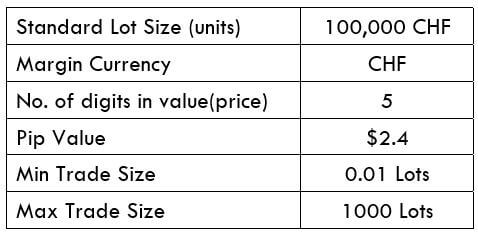
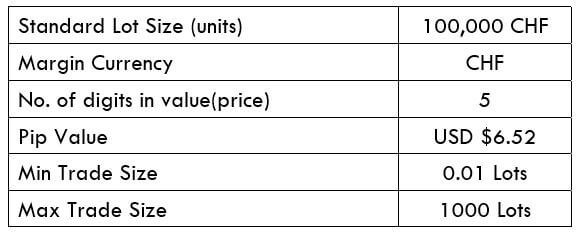
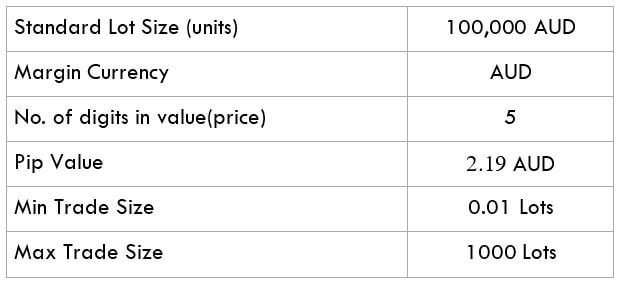
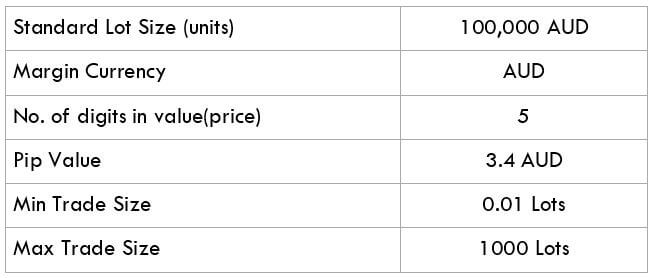
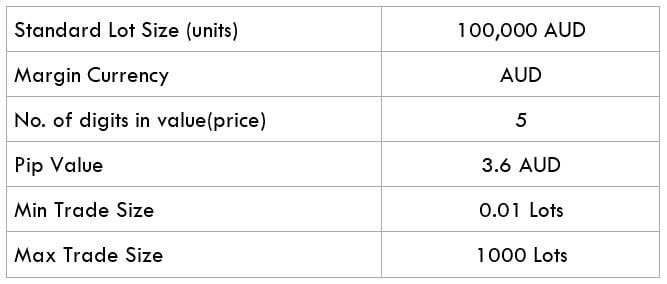
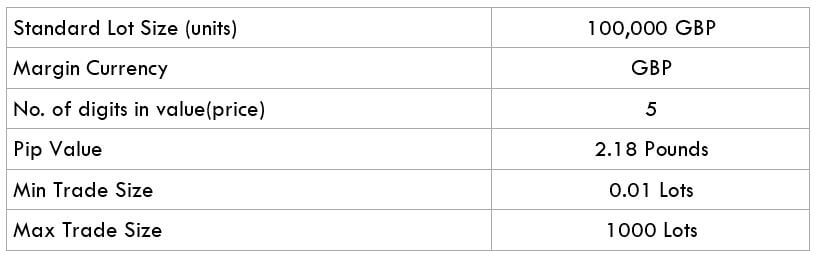
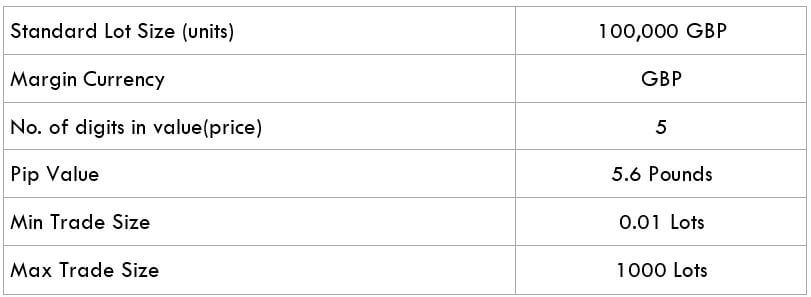
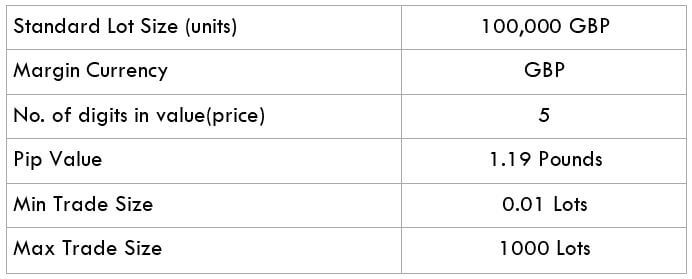
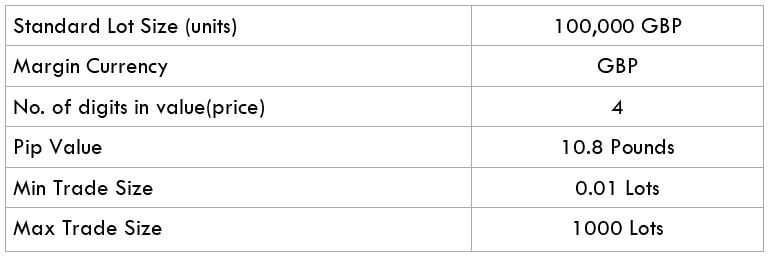
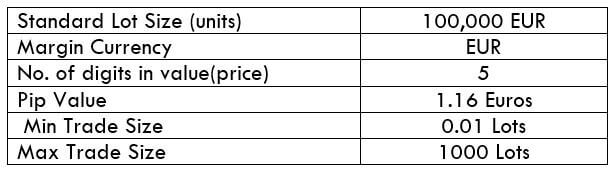
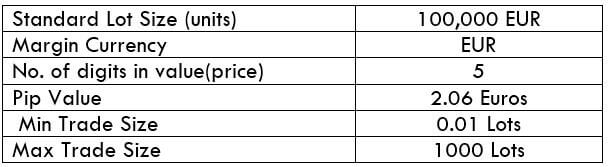
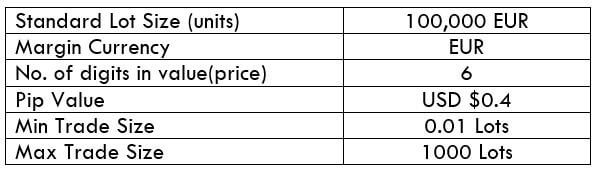
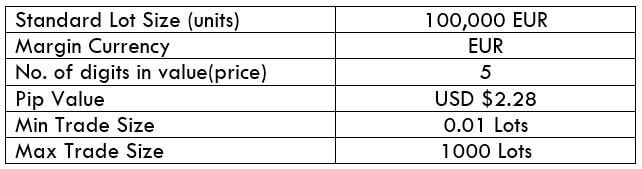
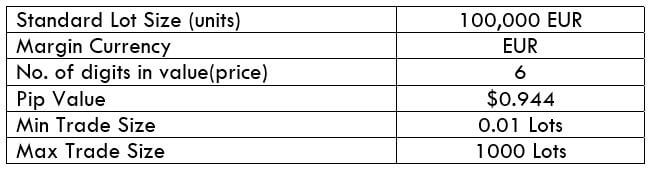
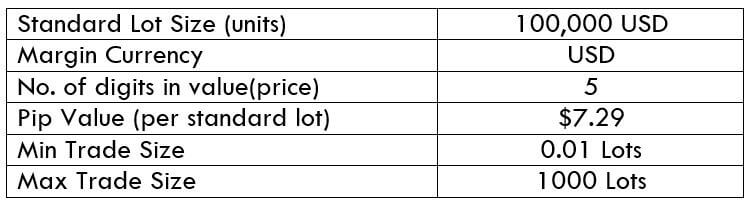
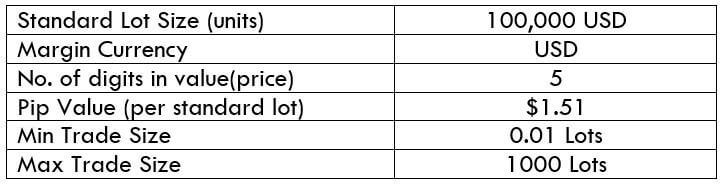
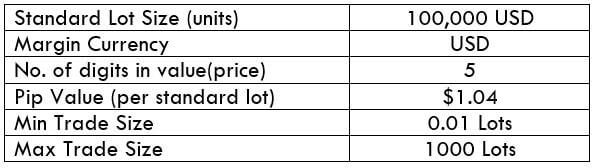
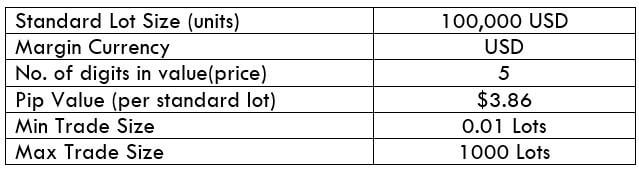
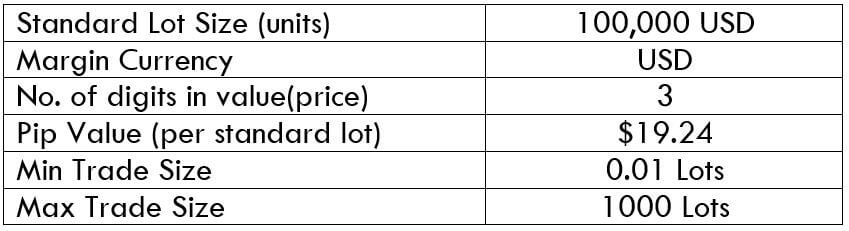
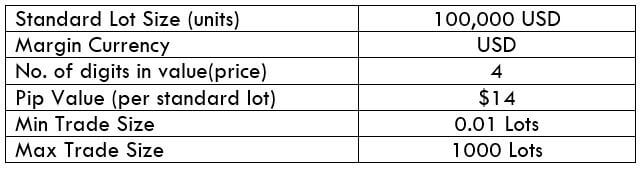
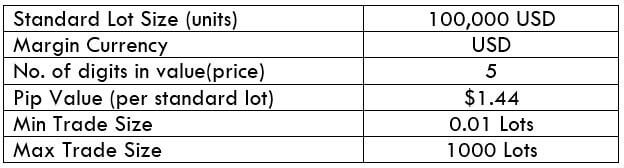
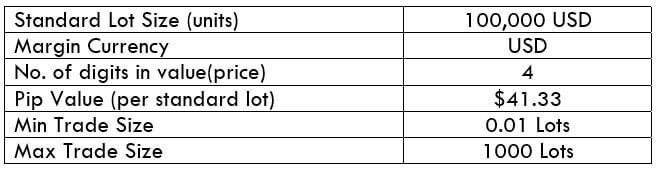
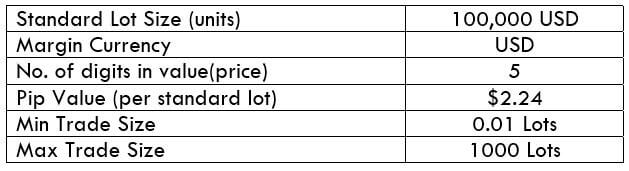
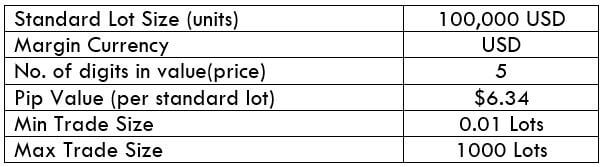
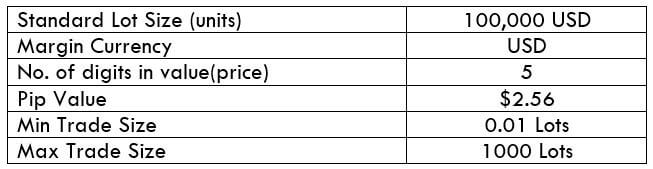
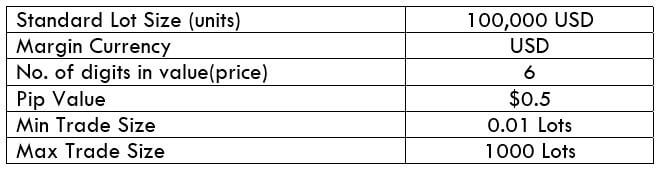
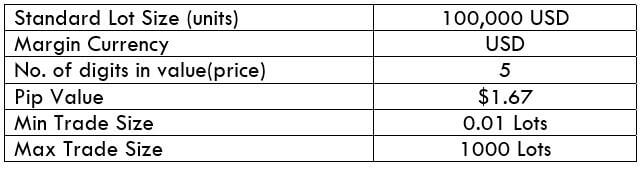
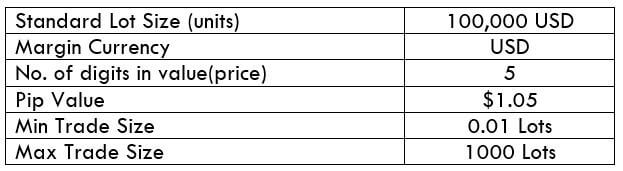
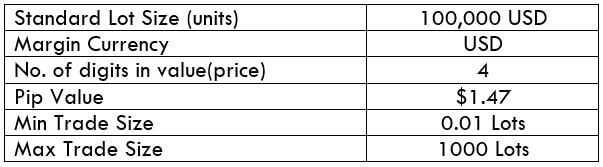
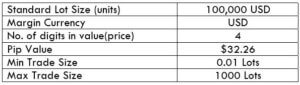
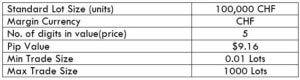
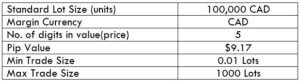
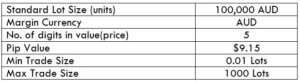
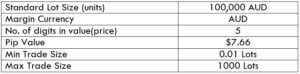
AUD/HUF Specification

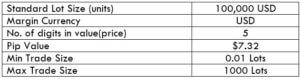
Spread
When you go long in the forex market, you buy the currency pair from your broker at a higher price than when you sell it. The spread in forex is the difference between these two. The spread for the AUD/MXN pair is – ECN: 2 pips | STP: 7 pips
Fees
Some forex brokers charge a commission for every trade on ECN type accounts, depending on the value of the trade. STP accounts do not incur any trading fees.
Slippage
Sometimes when you place a market order, your broker will fill it in with a different price. This is slippage in forex trading; it is caused by increased volatility and the speed at which your broker executes the trade.
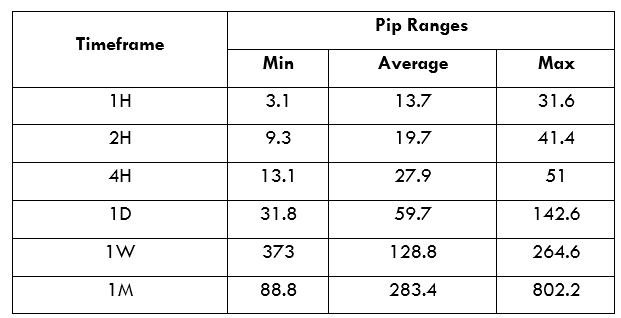
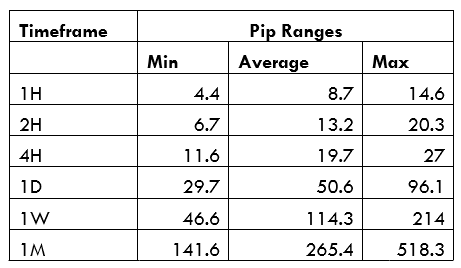
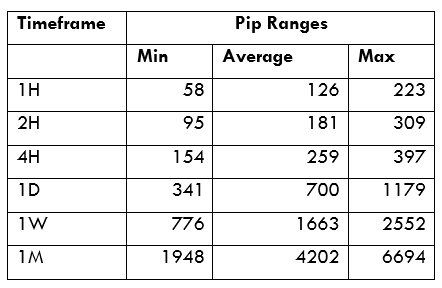
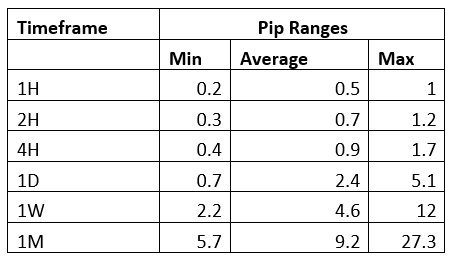
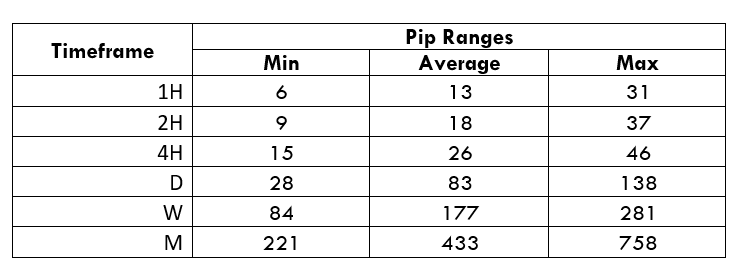
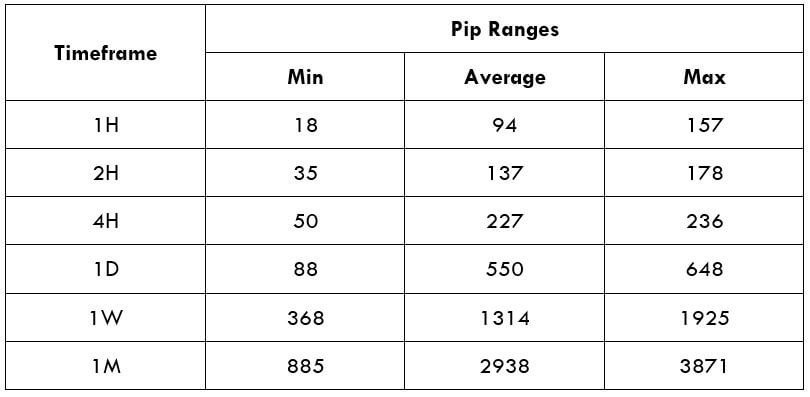
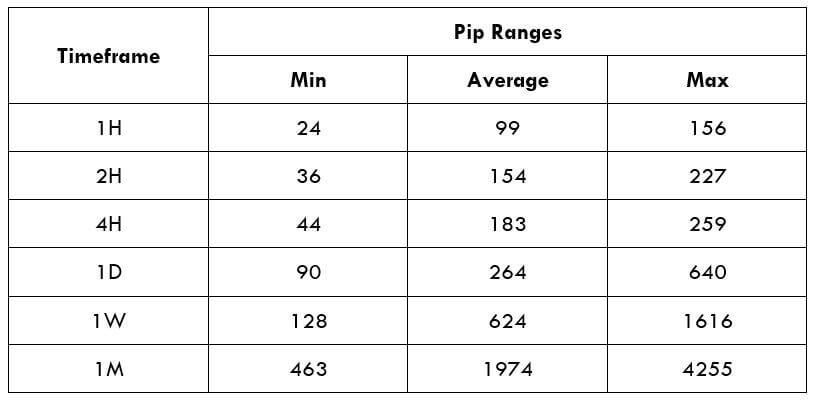
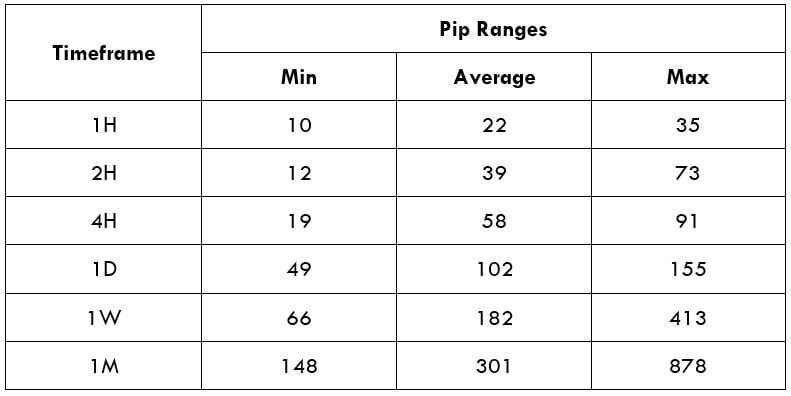
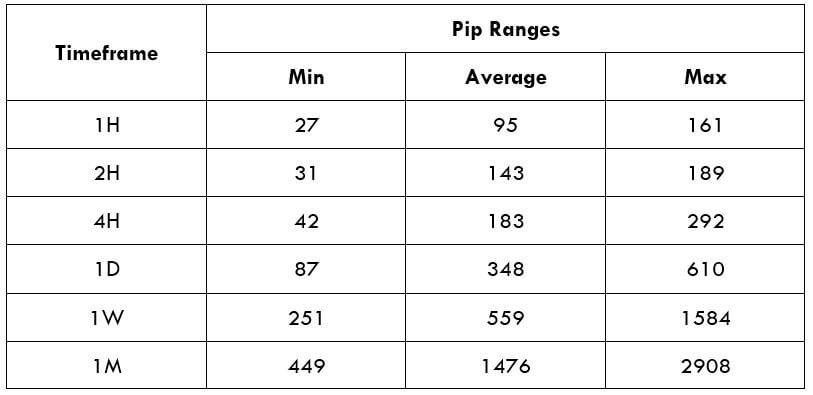
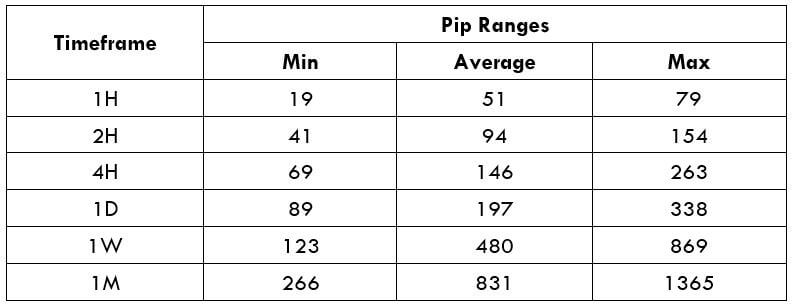
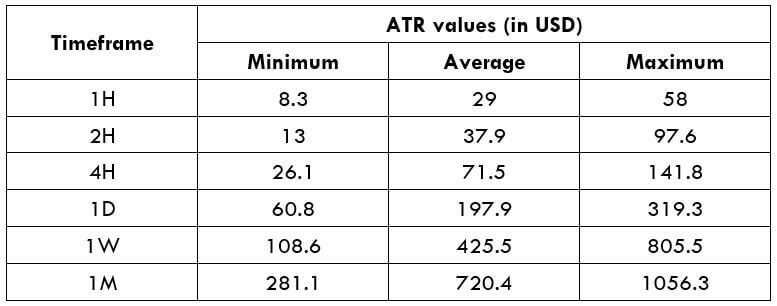
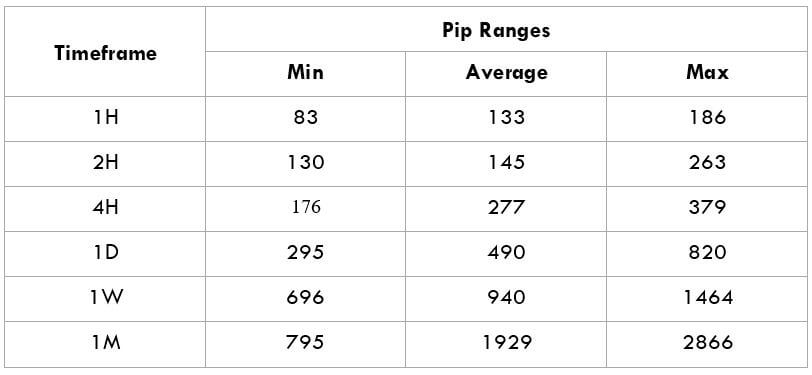
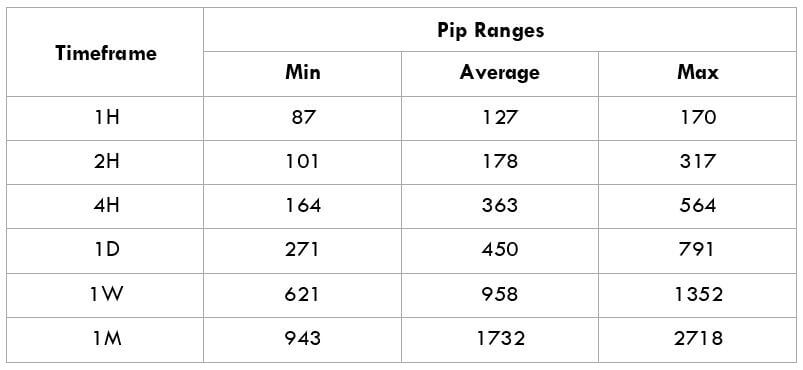
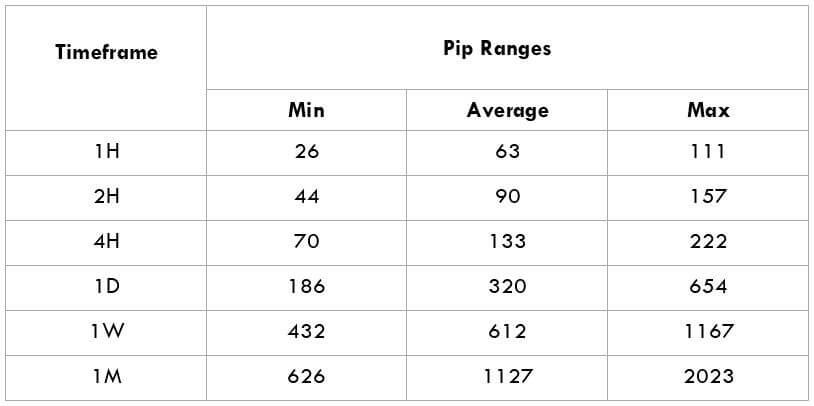
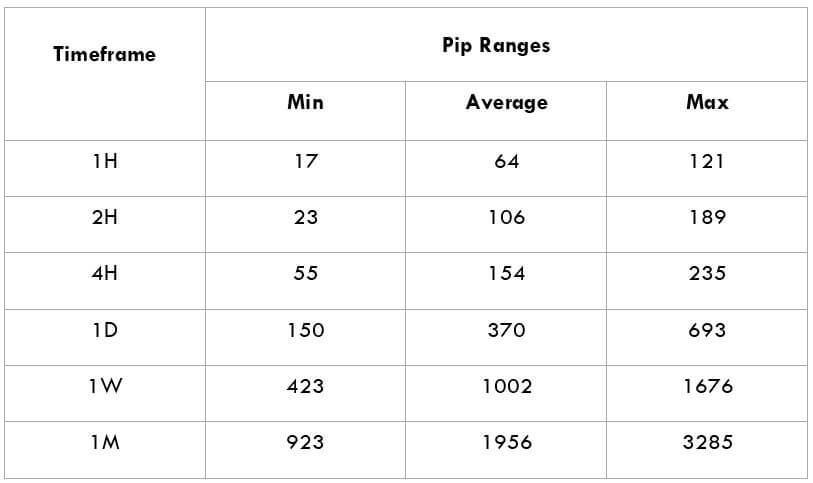
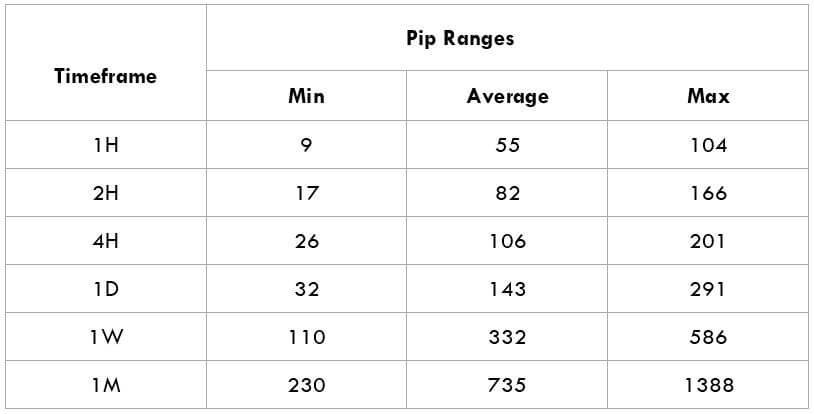
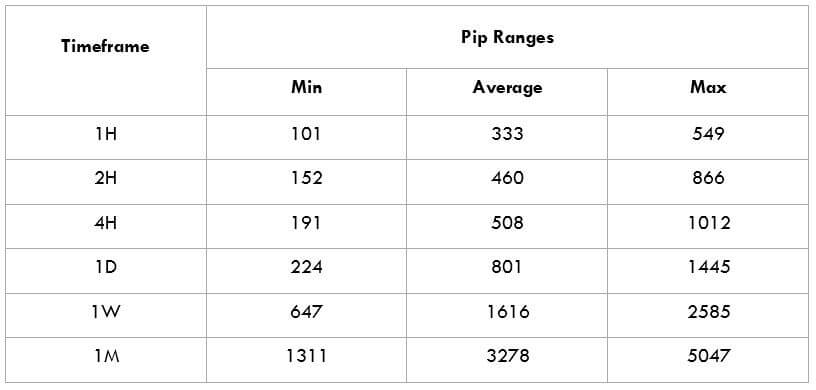
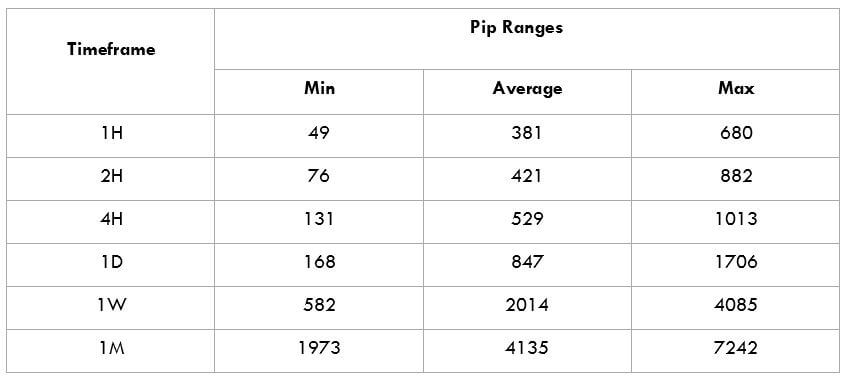
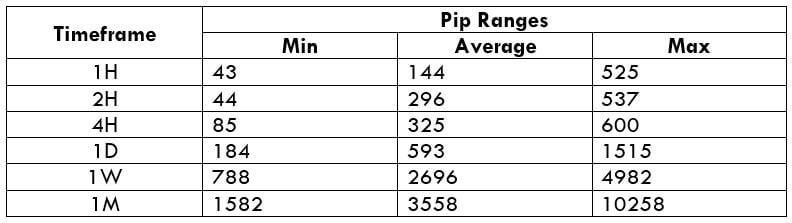
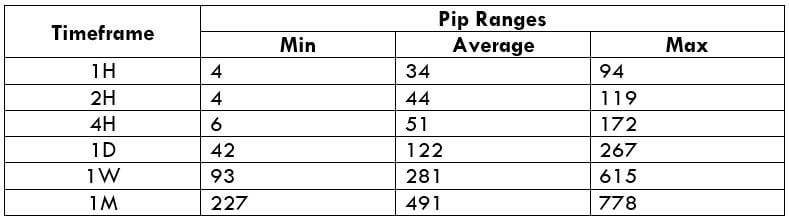
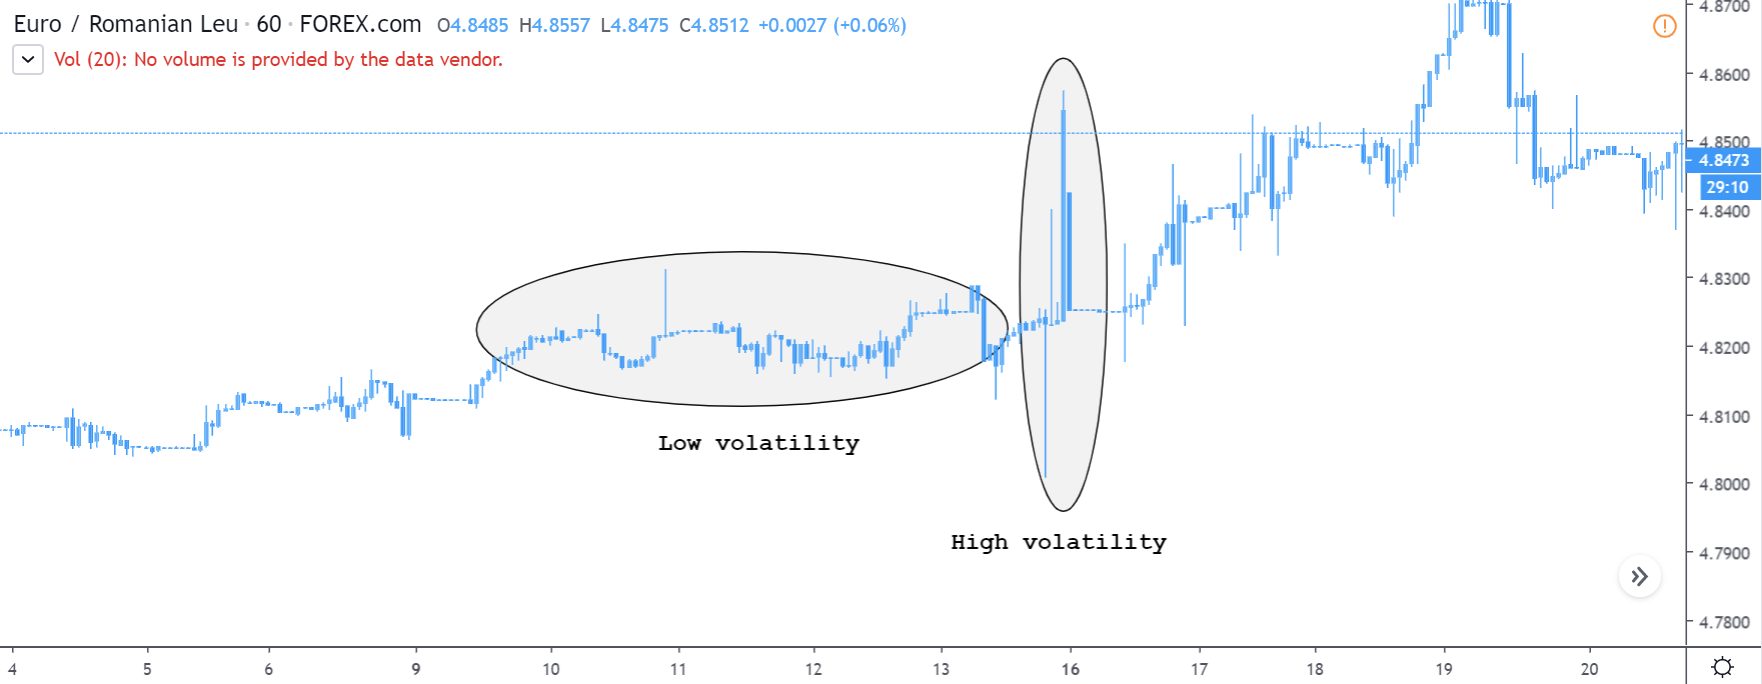
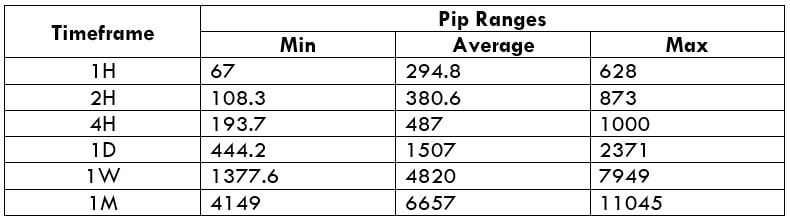
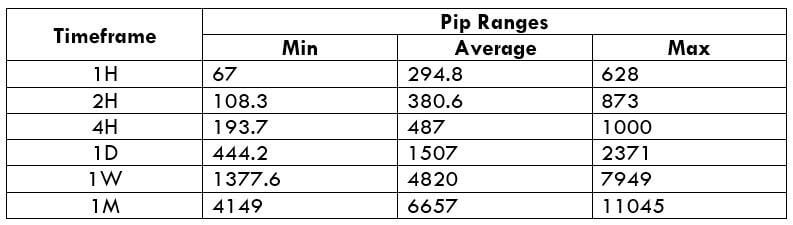
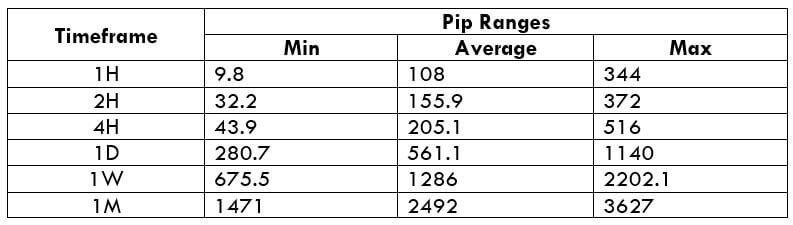
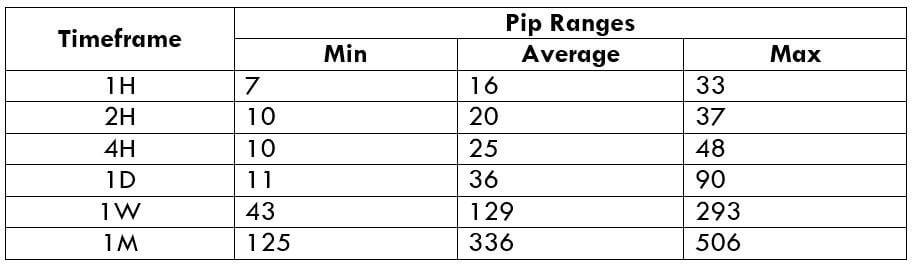
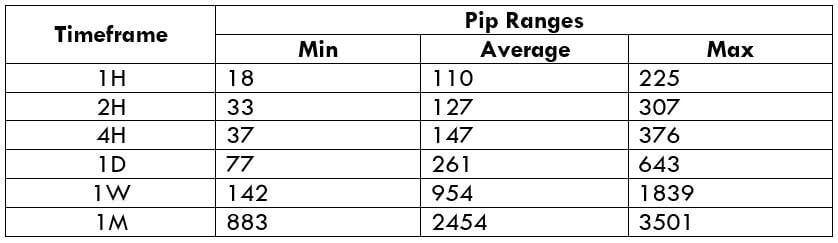
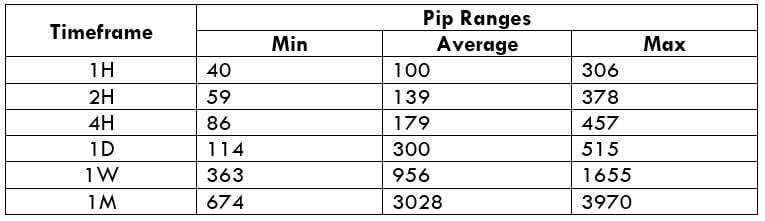
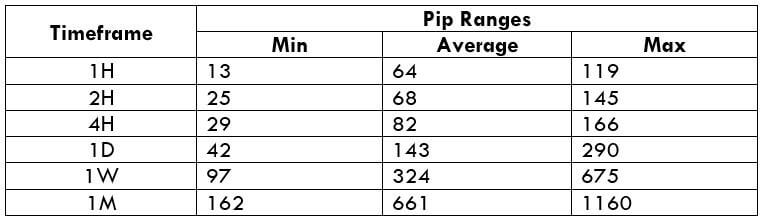
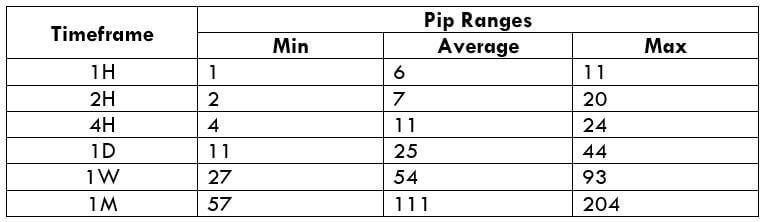
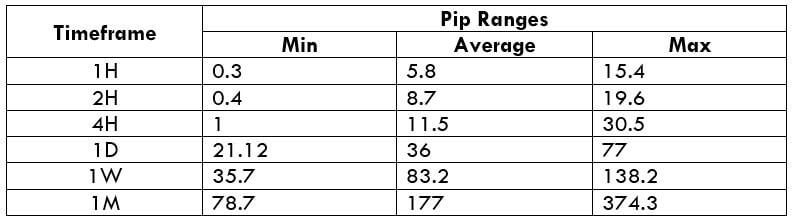
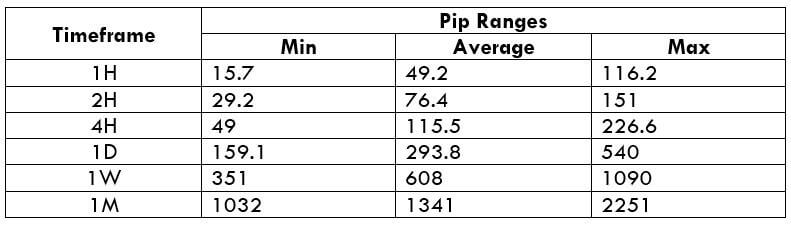
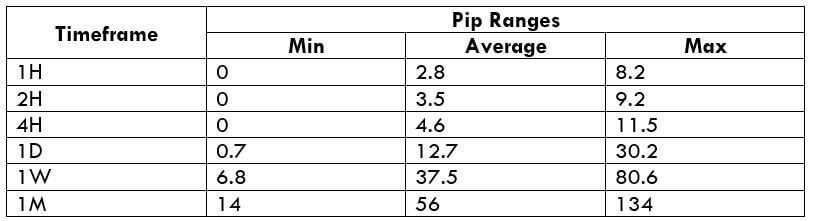
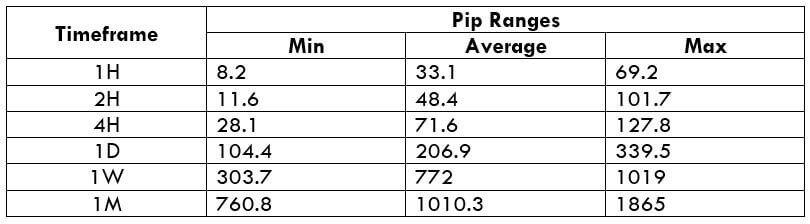
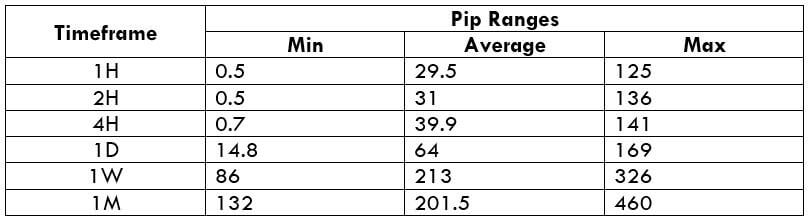
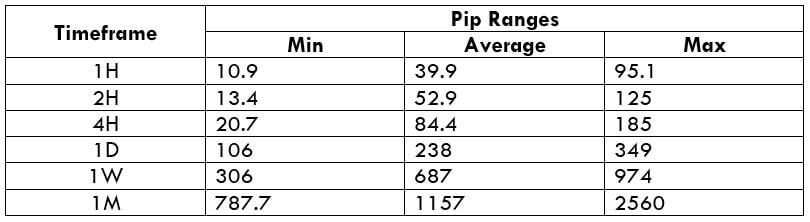
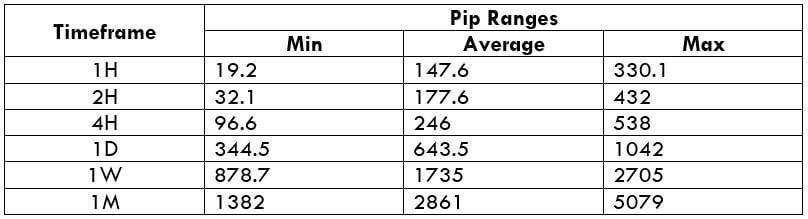
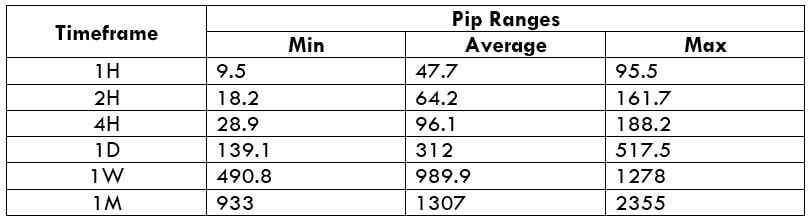
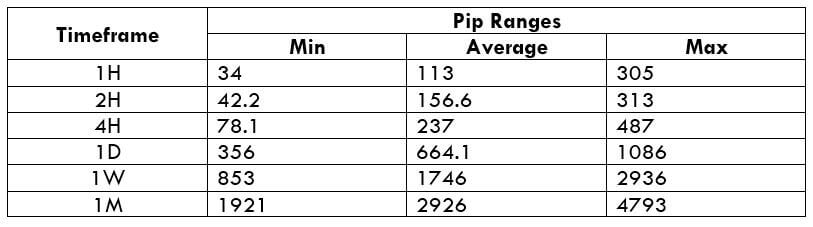
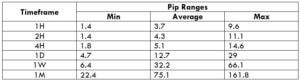
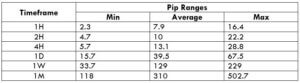
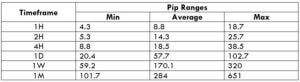
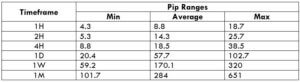
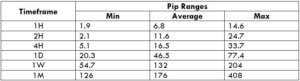
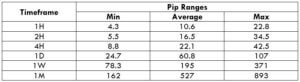
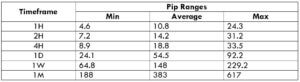
Trading Range in the AUD/MXN Pair
The trading range analyzes the spread between the highest and the lowest price movements across multiple timeframes. The trading range analysis ranges from the minimum, average, to the maximum volatility across all timeframes. It is used to assess the potential profitability of a currency pair across all timeframes.
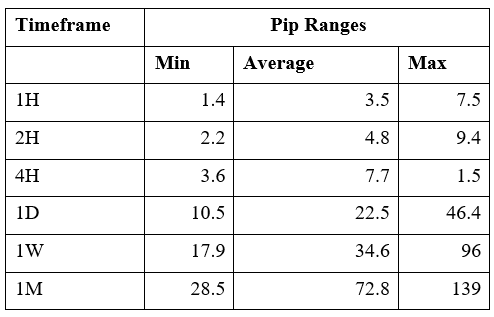
The Procedure to assess Pip Ranges
- Add the ATR indicator to your chart
- Set the period to 1
- Add a 200-period SMA to this indicator
- Shrink the chart so you can determine a larger period
- Select your desired timeframe
- Measure the floor level and set this value as the min
- Measure the level of the 200-period SMA and set this as the average
- Measure the peak levels and set this as Max.
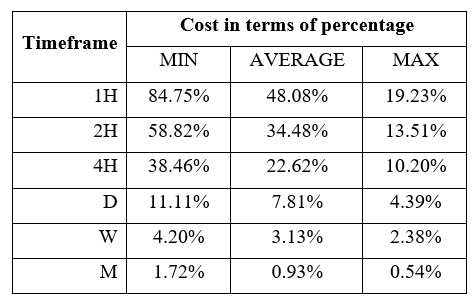
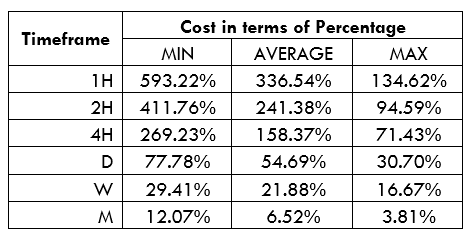
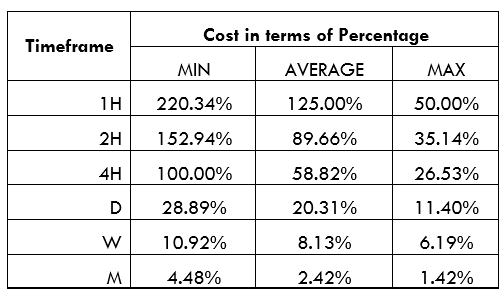
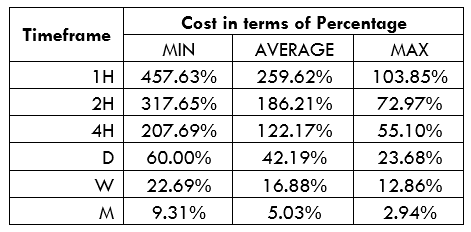
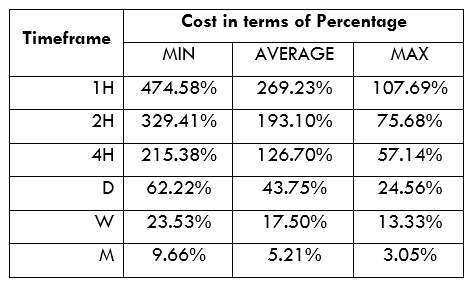
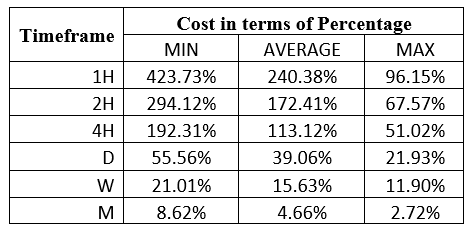
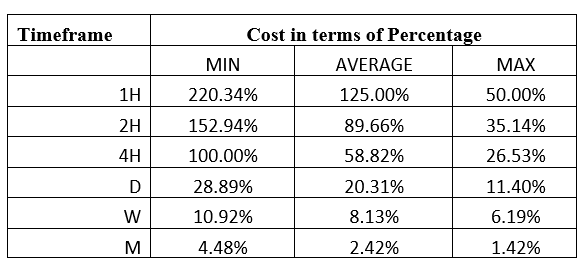
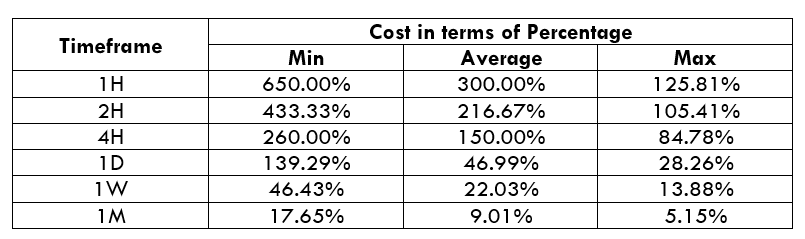
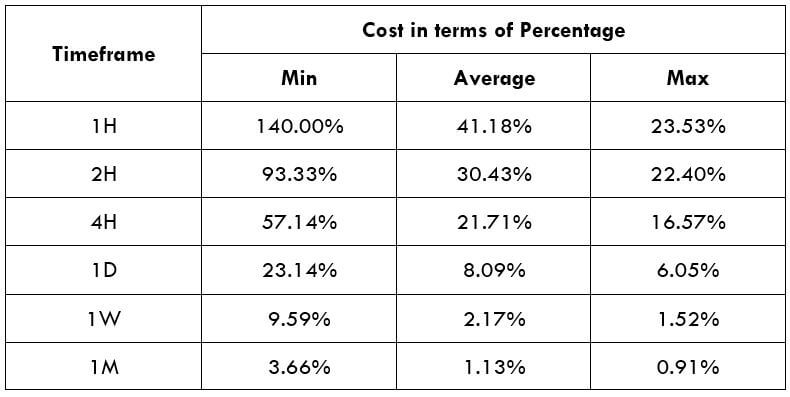
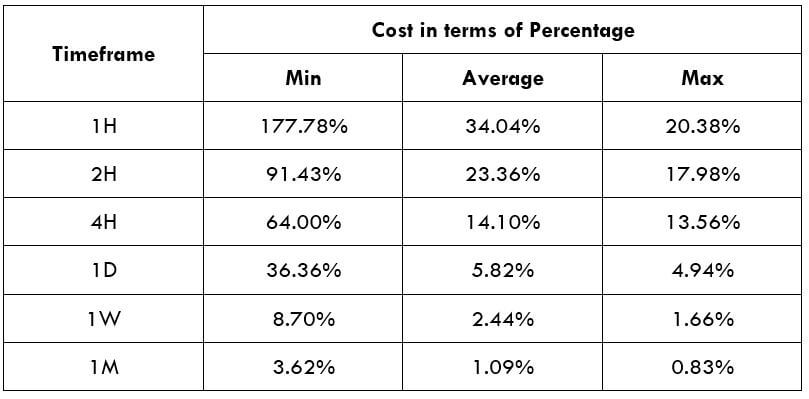
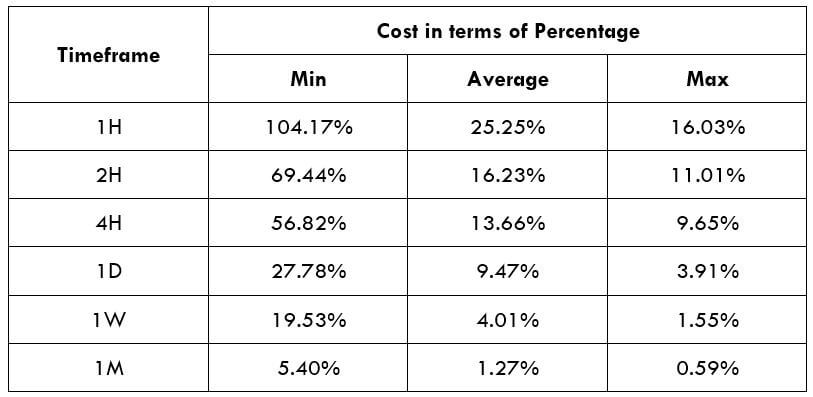
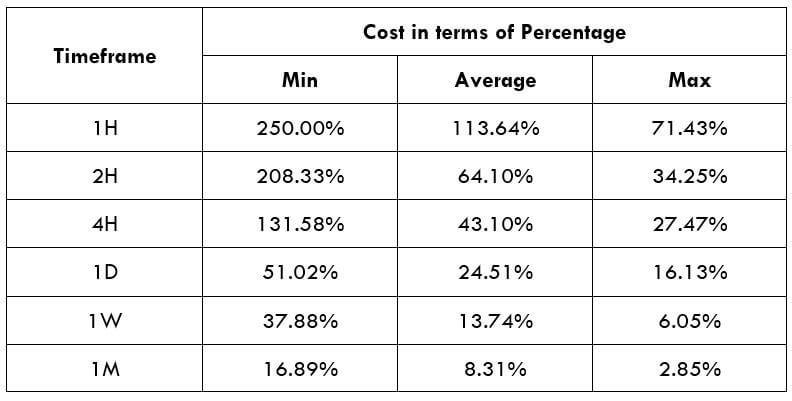
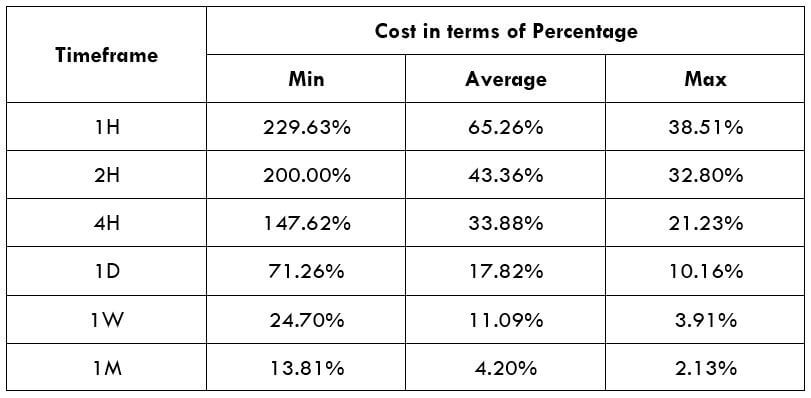
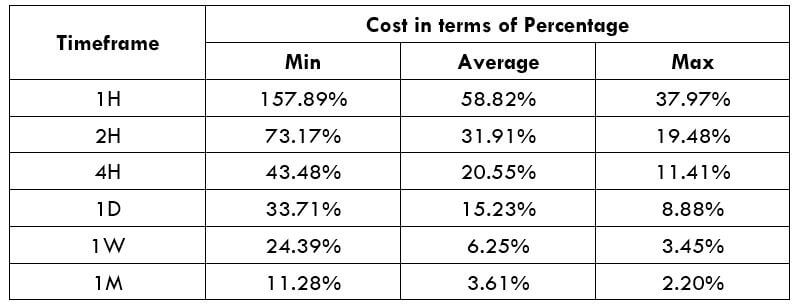
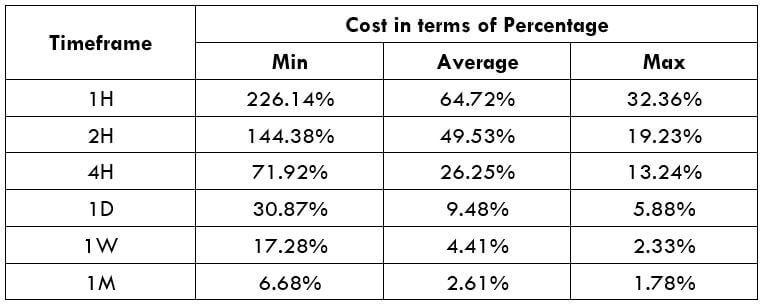
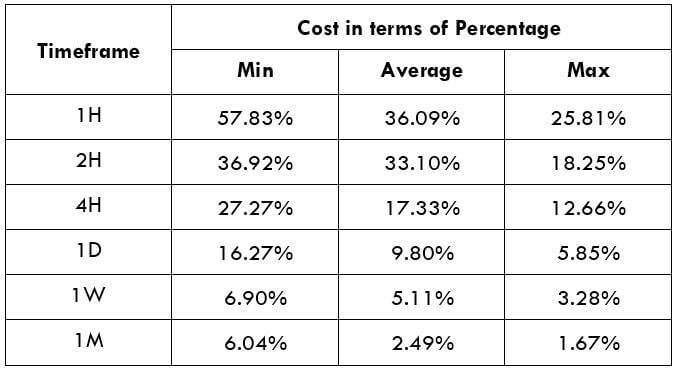
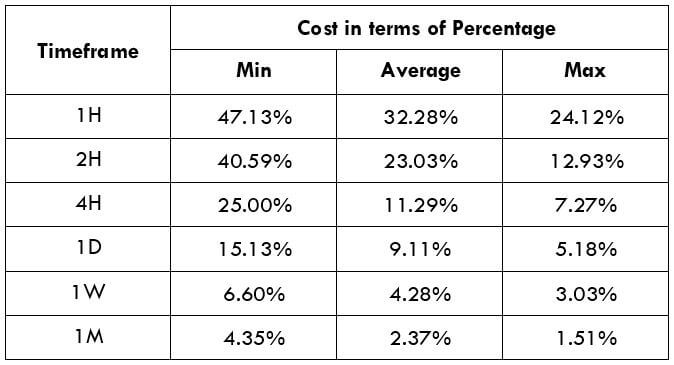
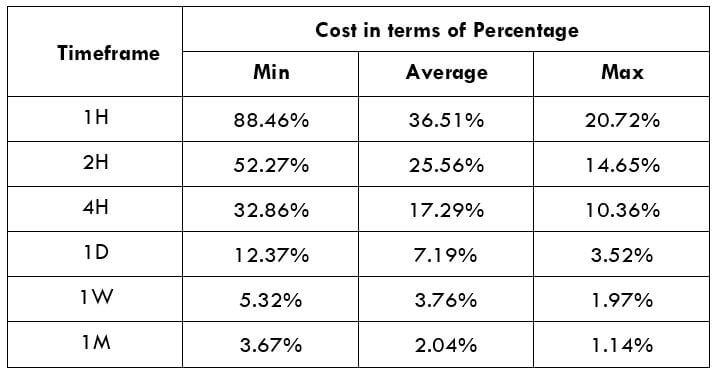
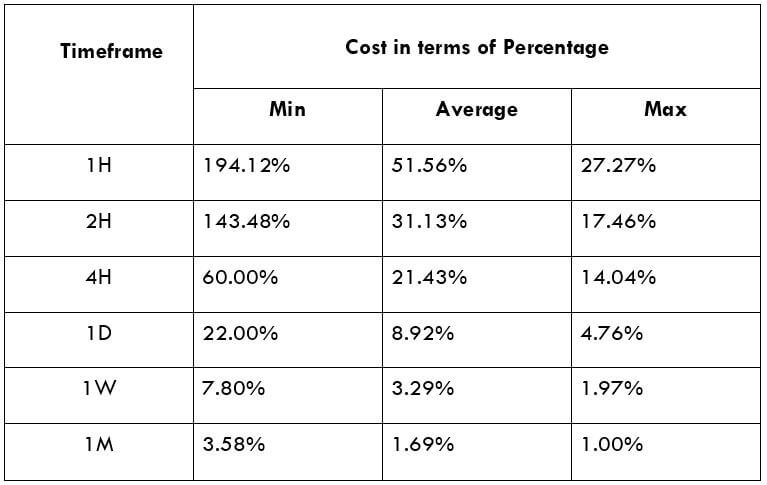
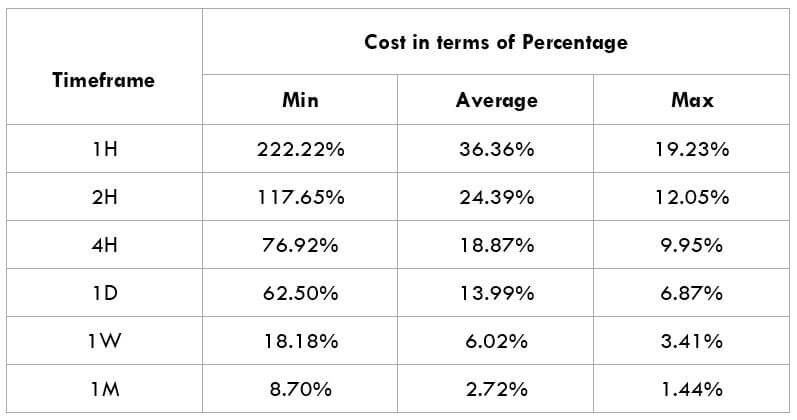
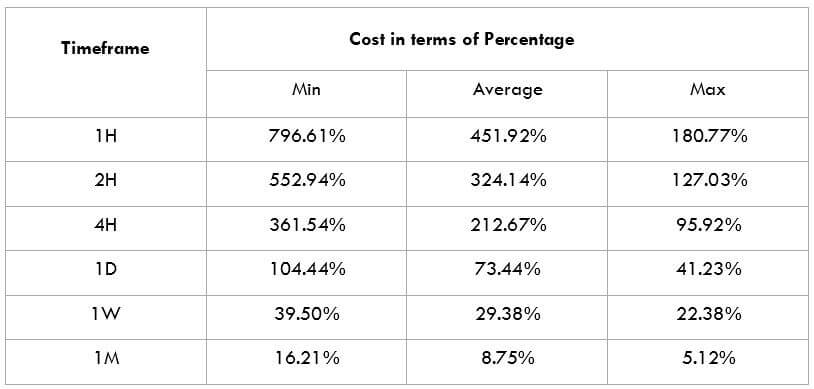
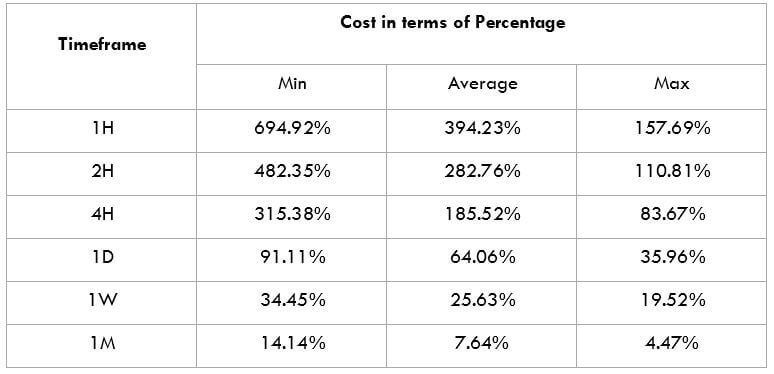
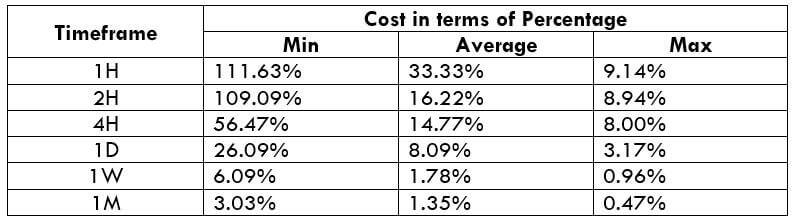
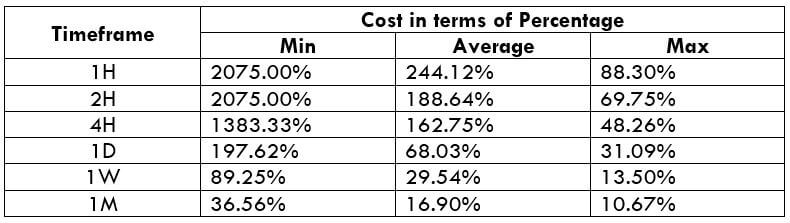
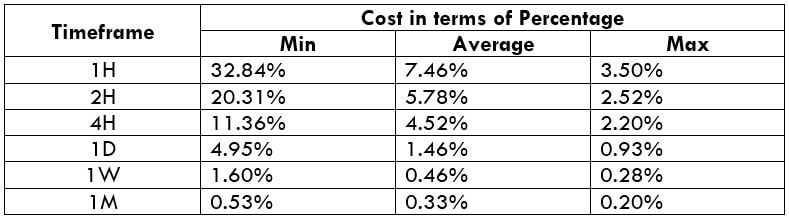
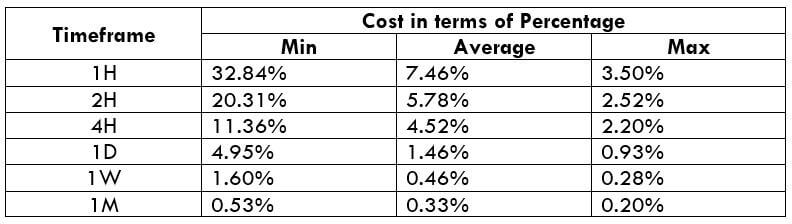
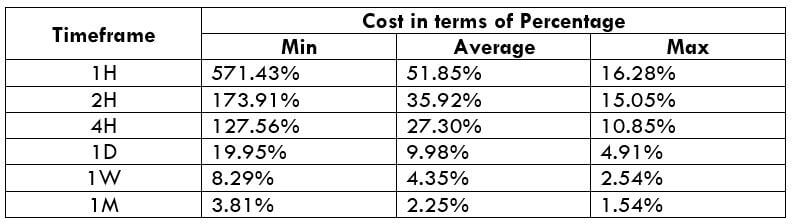
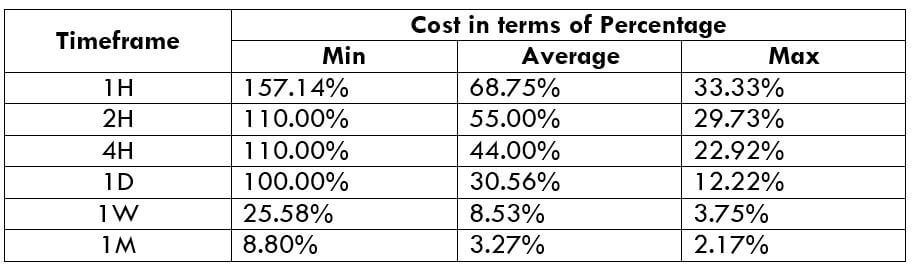
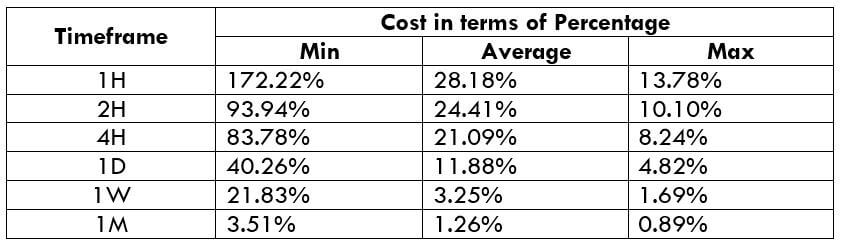
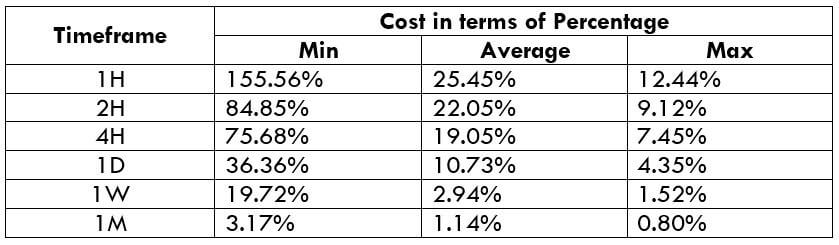
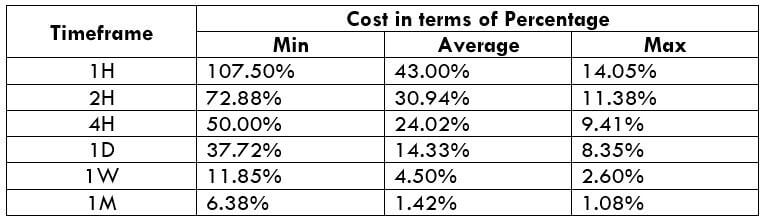
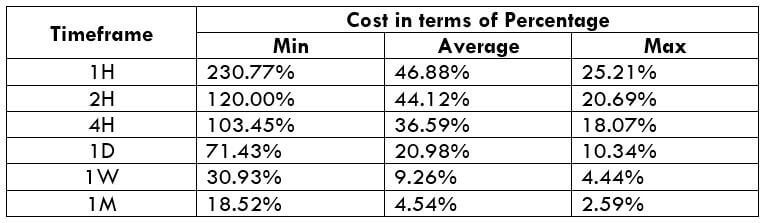
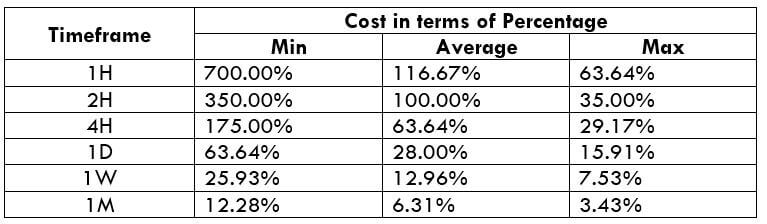
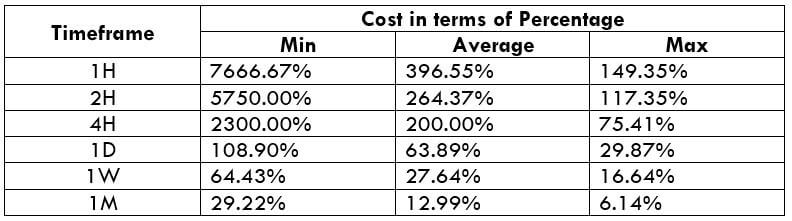
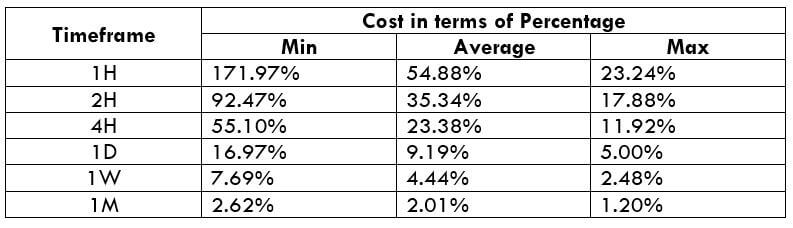
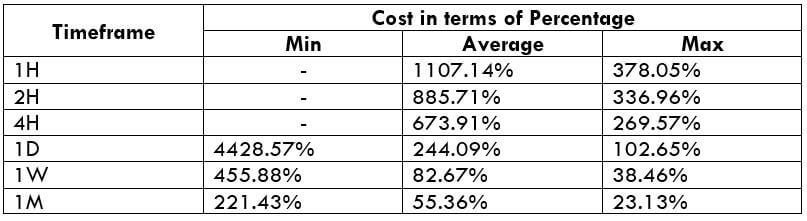
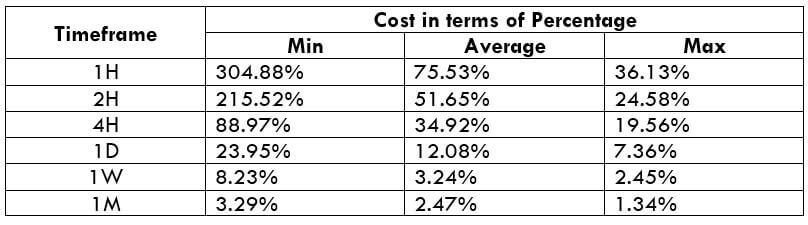
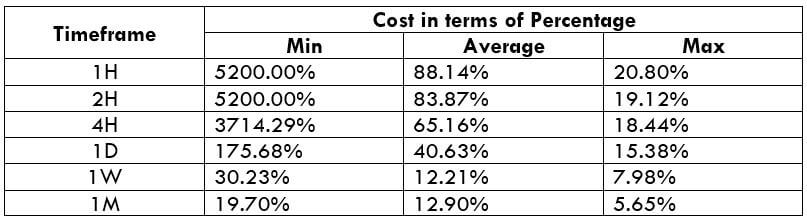
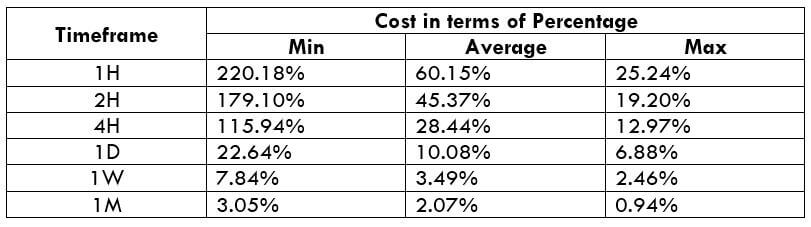
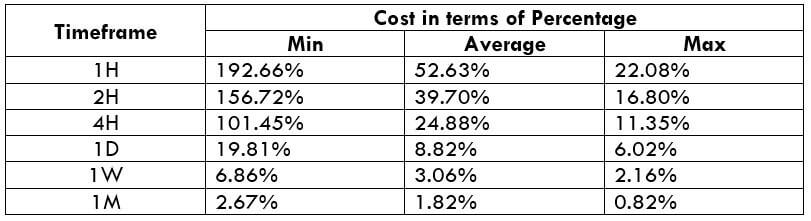
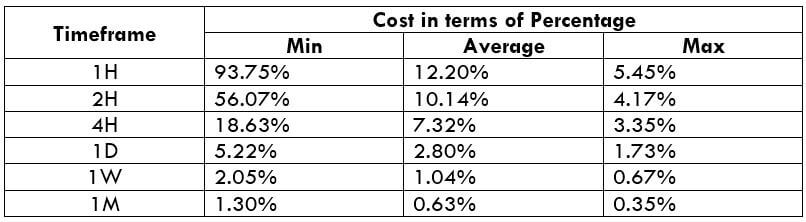
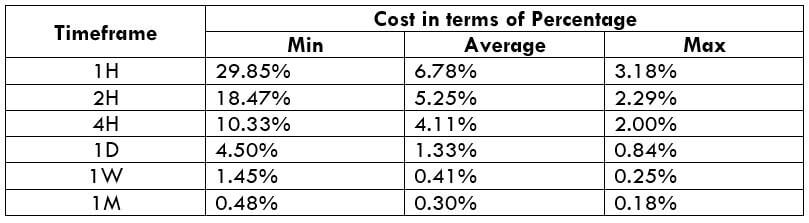
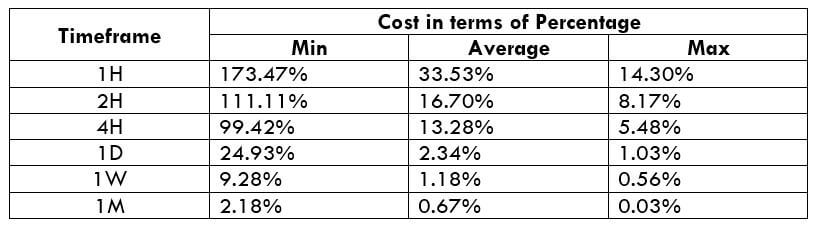
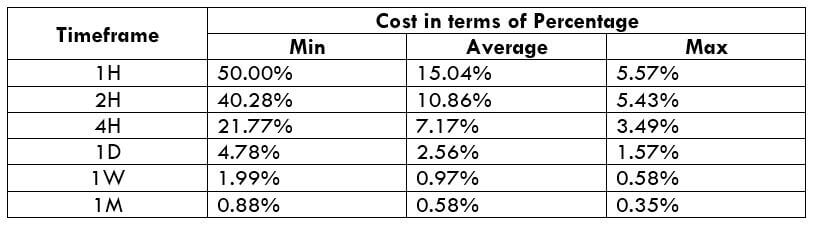
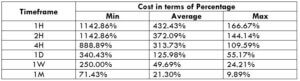
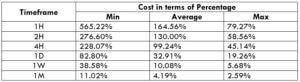
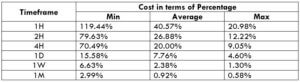
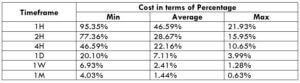
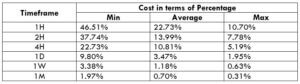
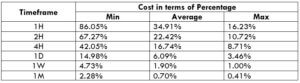
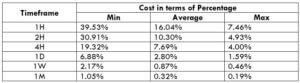
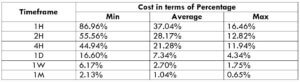
AUD/MXN Cost as a Percentage of the Trading Range
Further analysis of profitability can be aided by analyzing the percentage of the total cost to the volatility. These costs are put in terms of percentages of the volatility on all timeframes.
ECN Model Account costs
Spread = 2 | Slippage = 2 | Trading fee = 1 | Total cost = 5
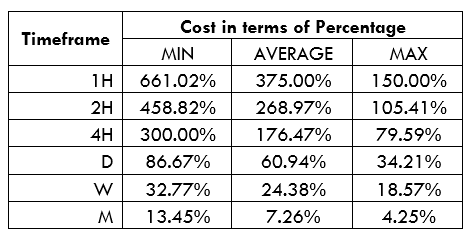
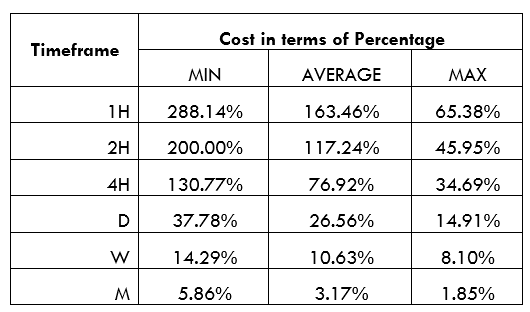
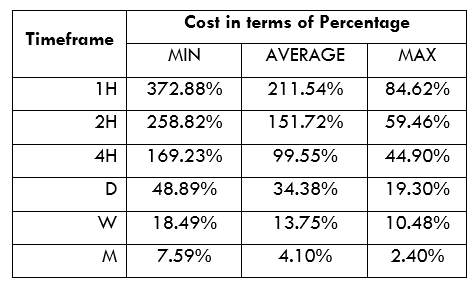
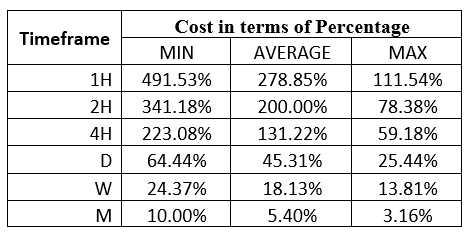
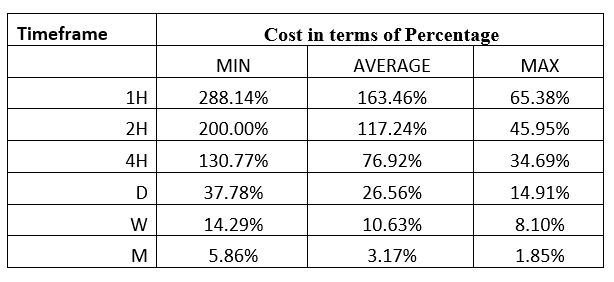
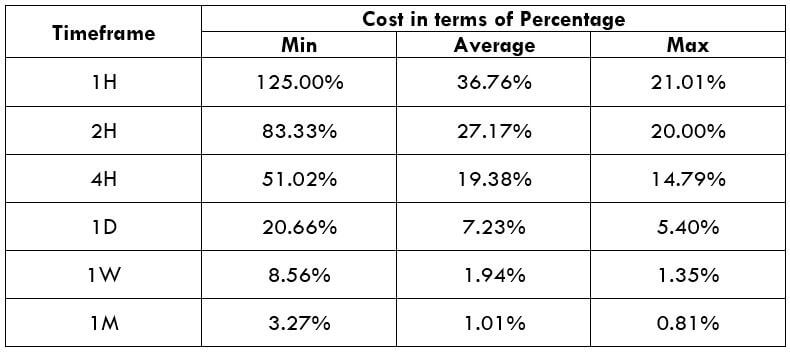
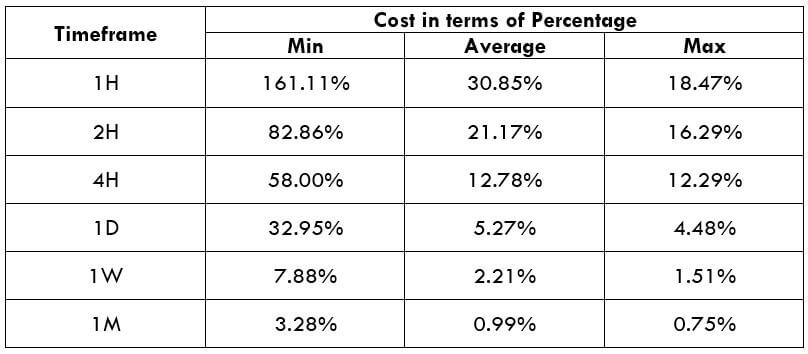
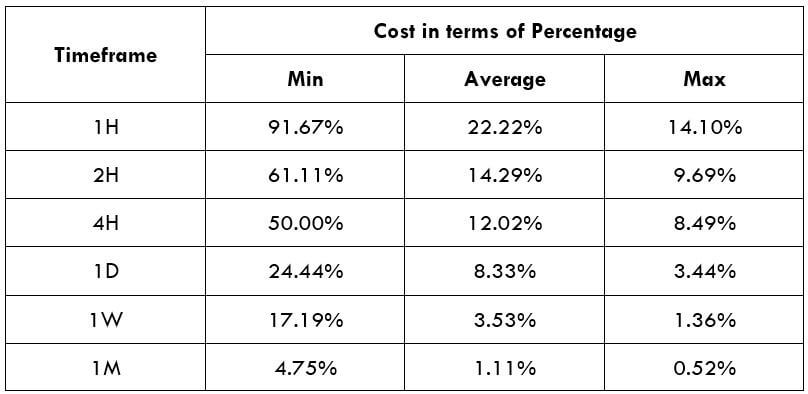
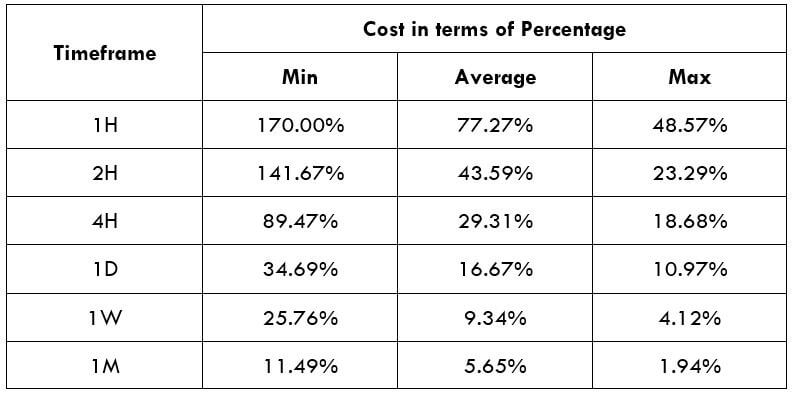
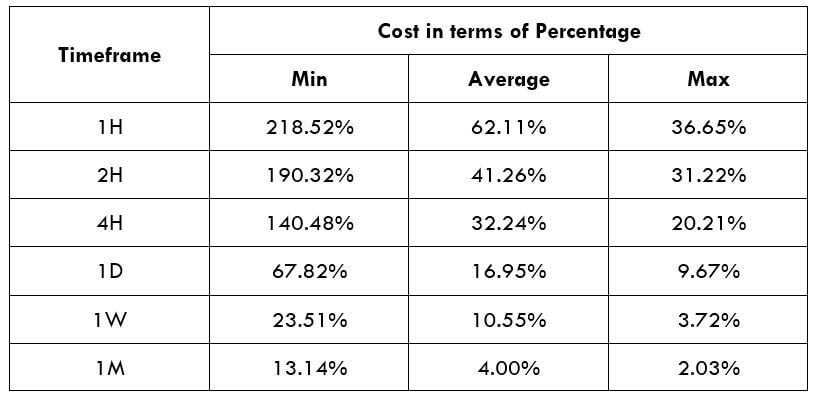
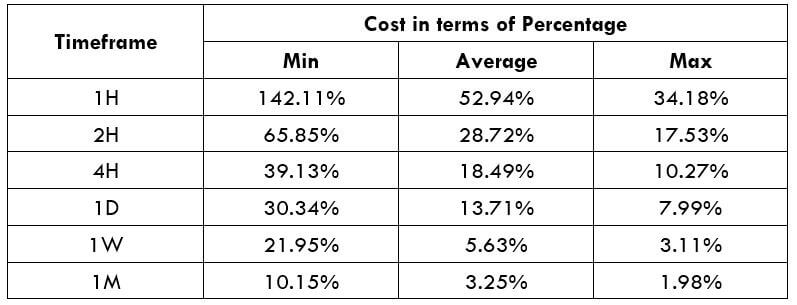
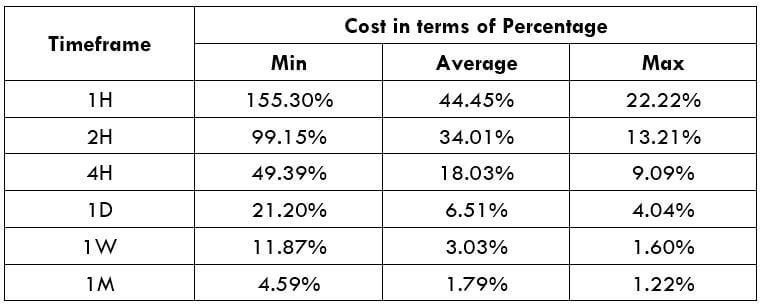
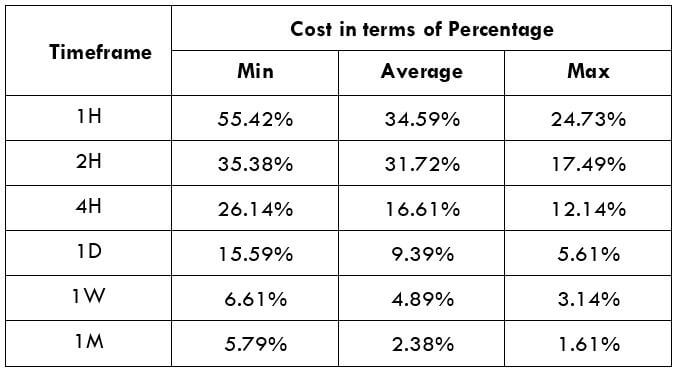
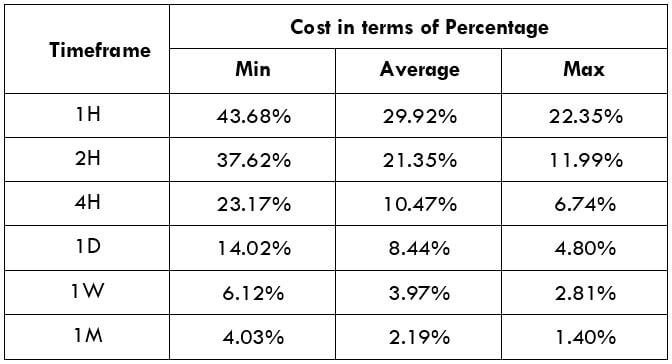
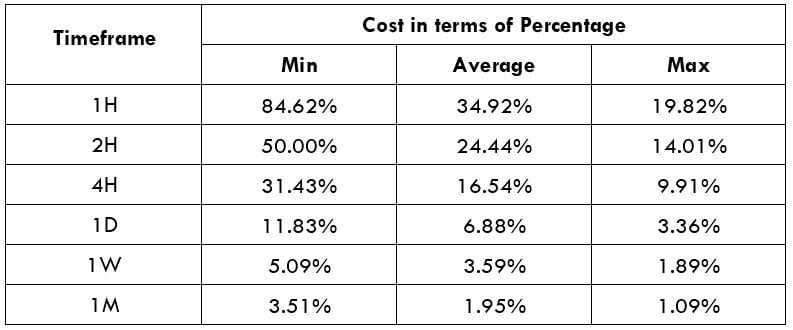
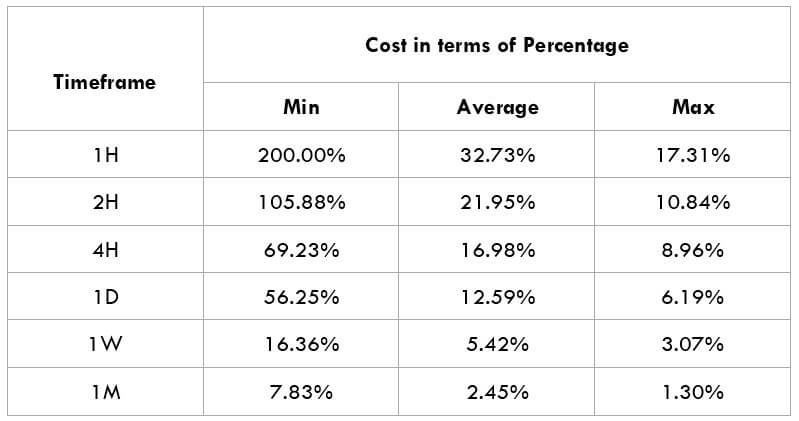
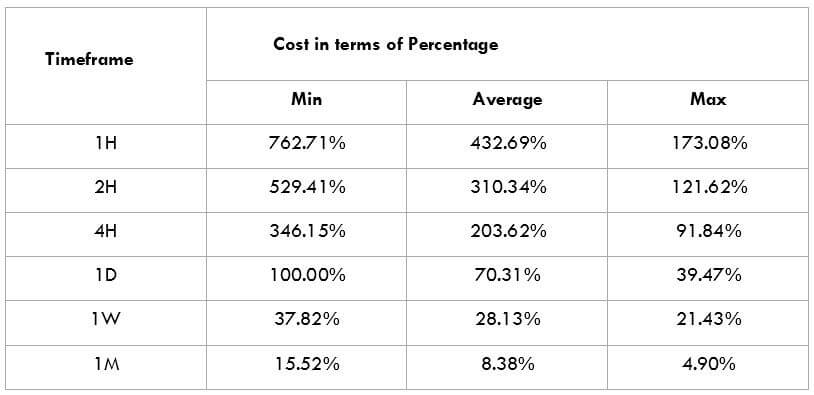
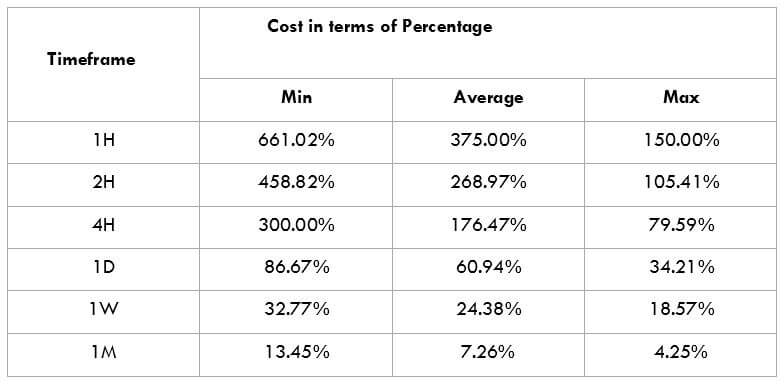
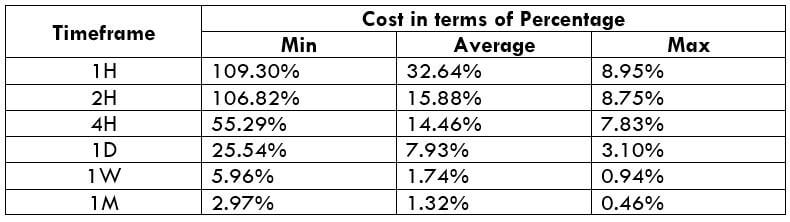
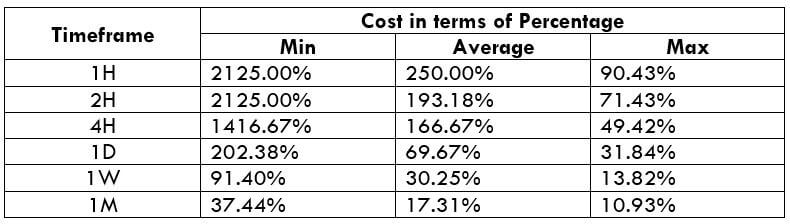
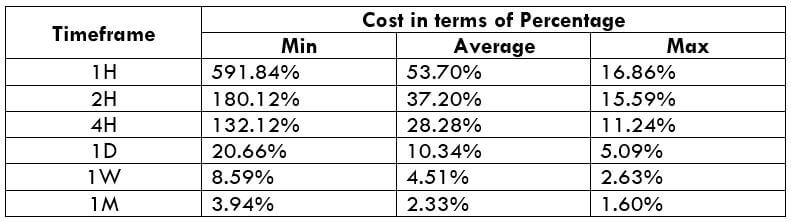
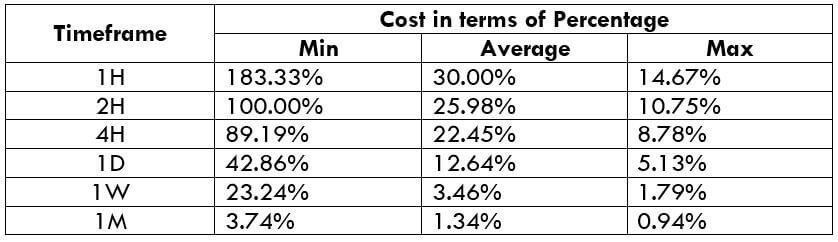
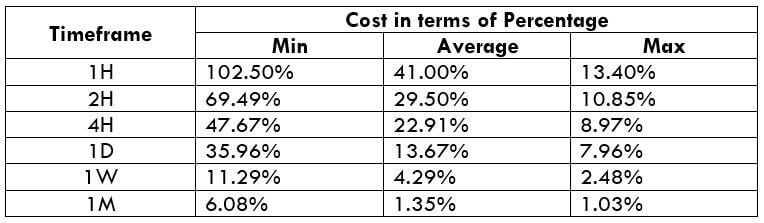
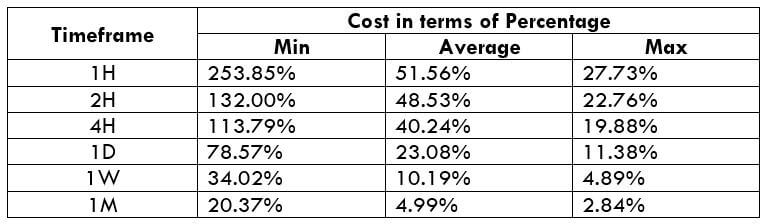
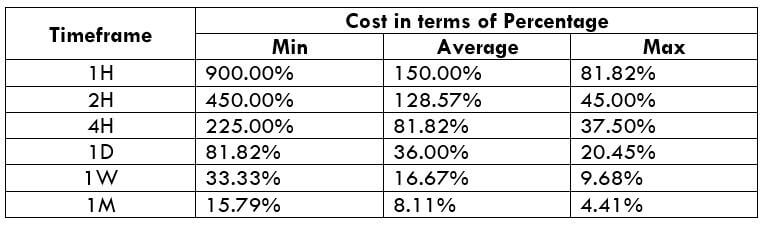
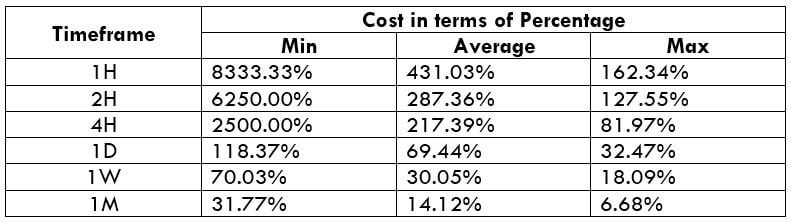
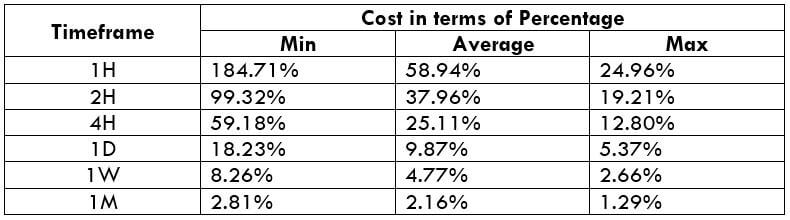
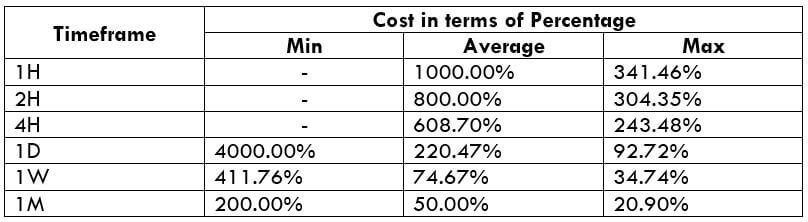
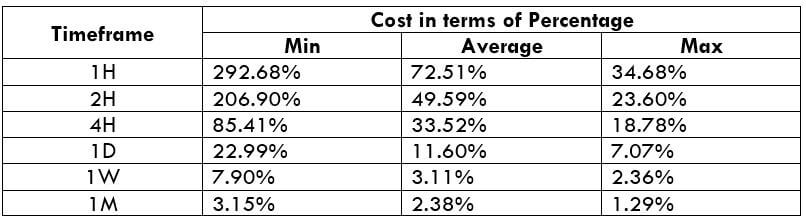
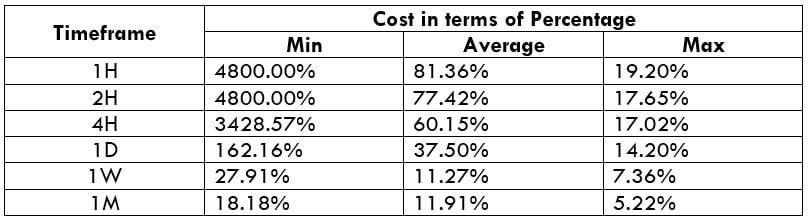
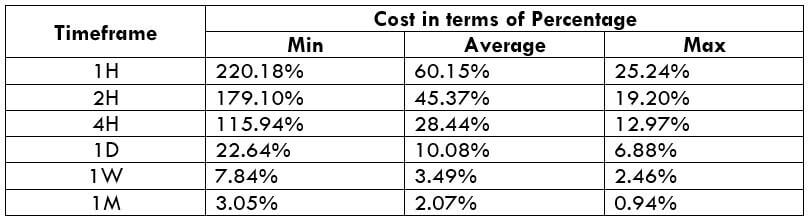
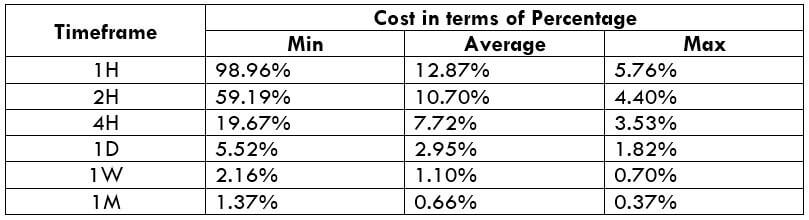
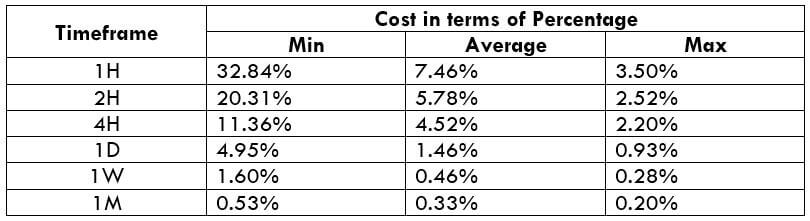
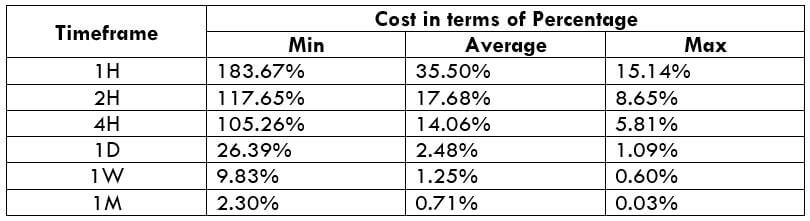
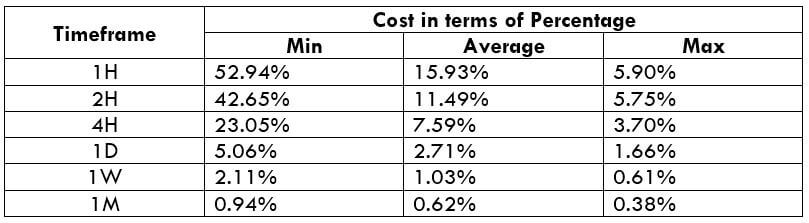
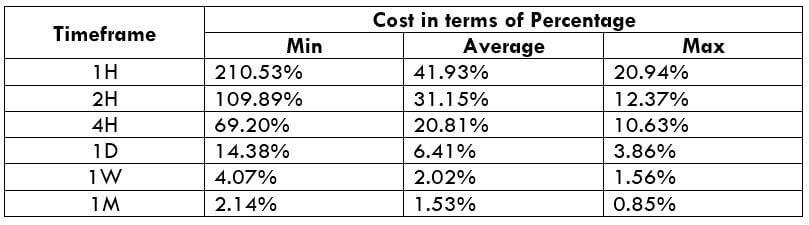
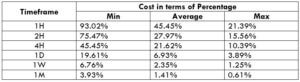
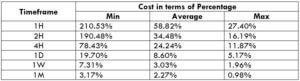
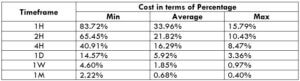
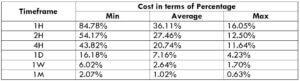
STP Model Account
Spread = 7 | Slippage = 2 | Trading fee = 0 | Total cost = 9

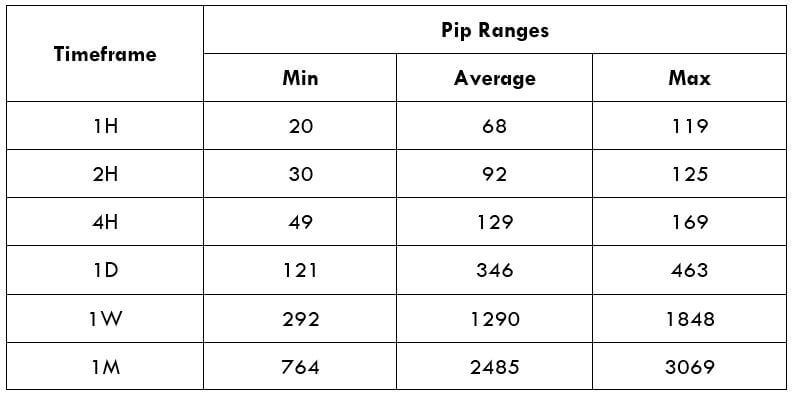
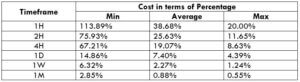
The Ideal Timeframe to Trade AUD/MXN Pair
For the AUD/MXN pair, the ideal trading timeframe appears to be the longer timeframes since trading costs are at their lowest here. We notice that the trading costs for the AUD/MXN pair decrease as the timeframes become longer. Also, note that at longer timeframes, the volatility is higher.
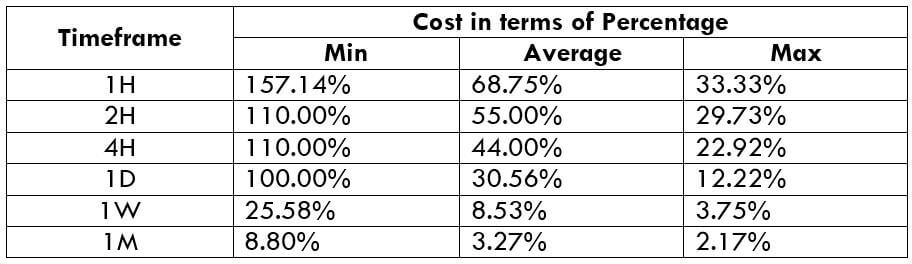
For traders wishing to trade the AUD/MXN pair for the shorter-term, timing their trades with when the volatility increases towards the maximum can help. More so, adopting the use of forex limit orders will lower the trading costs by ensuring there are no slippages.
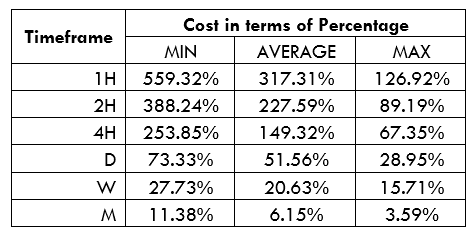
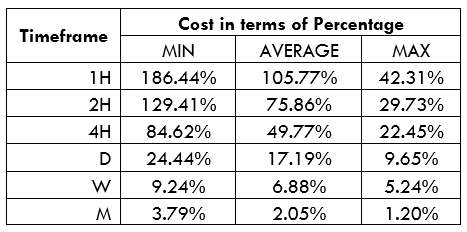
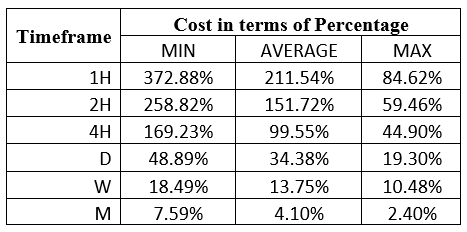
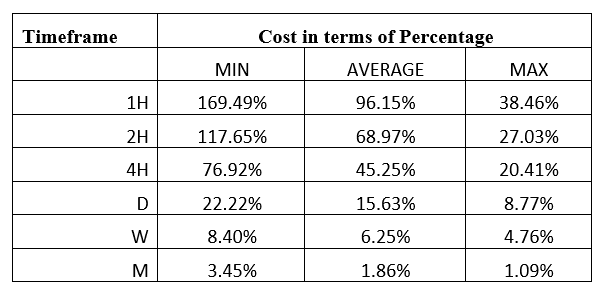
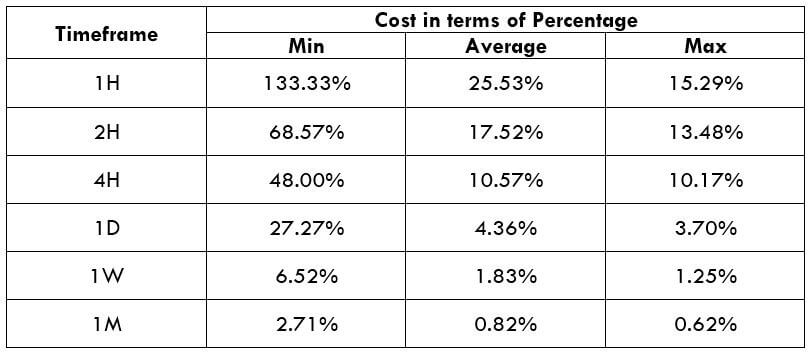
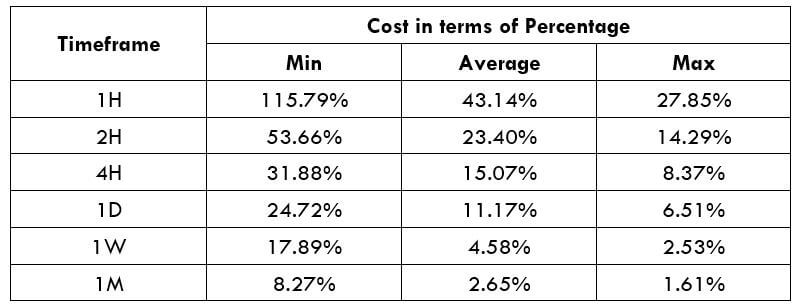
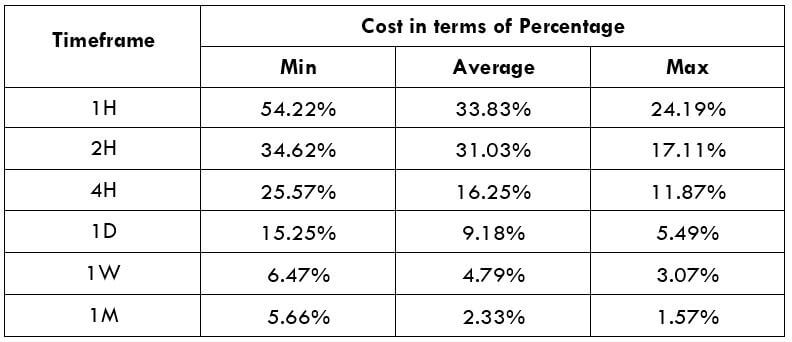
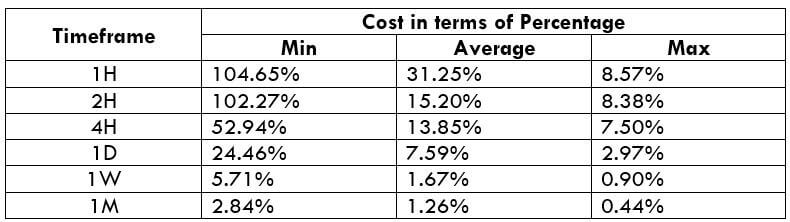
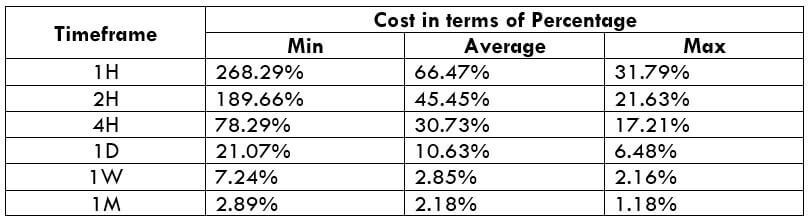
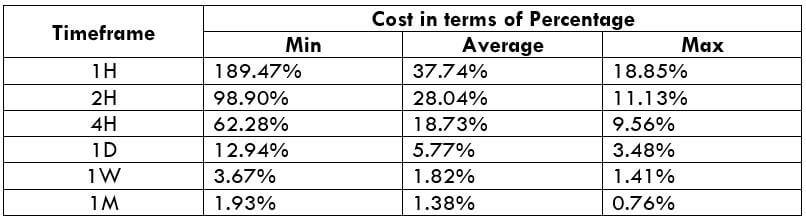
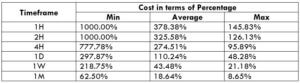
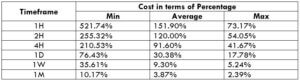
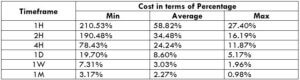
ECN Account Using Limit Model Account
Total cost = Slippage + Spread + Trading fee = 0 + 2 + 1 = 3
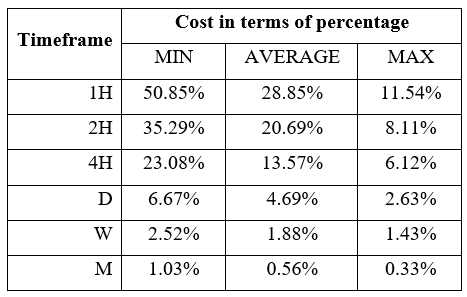
Notice how using the forex limit order types reduces the overall trading costs across all timeframes. The maximum trading cost of the AUD/MXN pair, for instance, decreased from 84.75% of the trading range to 50.85%.


 The Ideal way to trade the AUD/CAD